Comments on New York City’s Fiscal Year 2018 Adopted Budget
I. Executive Summary
The City adopted a balanced FY 2018 budget of $85.24 billion on June 6, 2017. Before adjusting for prepayments, the FY 2018 Adopted Budget is $86 million less than the modified FY 2017 budget of $85.33 billion. Adjusting for the $4.17 billion FY 2017 surplus used to prepay certain expenditures due in 2018, and excluding reserves, the FY 2018 budget is $87.96 billion, a 2.8 percent increase from the adjusted FY 2017 budget.
Approximately 72 percent of the budget is funded with City-generated revenues with the remainder funded by Federal, State and non-governmental grants and capital fund transfers. Federal and State grants account for 33 percent and 61 percent of non-City revenues, respectively. More than 80 percent of budgeted expenditures are allocated to education, social services, public safety and judicial, fringe benefits, pensions, and general government. Spending in these areas totals almost $70 billion.
The June 2017 Financial Plan shows budget gaps of $3.47 billion in FY 2019, $2.81 billion in FY 2020, and $2.33 billion in FY 2021. Revenues in the outyears of the Plan are projected to grow at an average annual rate of 3.2 percent while expenditures are projected to grow at a slower rate of 2.4 percent, leading to the narrowing of the outyear gaps. Revenue growth is driven primarily by the growth in tax revenues, which is projected to average 4.2 percent annually in the outyears. Expenditure growth is driven primarily by spending on salaries and wages, debt service, health insurance, and other fringe benefits. Spending in these areas, which accounts for 48.6 percent of adjusted FY 2018 expenditures, are projected to grow at an average annual rate of 5.1 percent.
The Comptroller’s Office’s analysis of the June 2017 Financial Plan estimates a small deficit of $65 million in FY 2018 and a larger gap of $3.61 billion in FY 2019. For FY 2020 and FY 2021, the Comptroller’s Office estimates smaller gaps of $2.78 billion and $2.10 billion, respectively.
Eliminating the FY 2019 gap will require generating a budget surplus again in 2018. That should be achievable, given the $1.45 billion in reserves and reasonable expectations regarding the other usual intra-year sources of funds, such as write-offs of prior-year payables and bond refinancings resulting in debt service savings. Nonetheless, if the slowdown in non-property tax revenue growth in FY 2017 continues, it will require continued reliance on the Citywide Savings Program to achieve savings. Realizing further savings will likely require tapping deeper into agency budgets to identify efficiency and productivity measures.
With a balance of $4.2 billion in the Retiree Health Benefit Trust and budgeted reserves of $1.45 billion in FY 2018 and $1.25 billion in each of the outyears, the gaps should be manageable. At the beginning of FY 2018, the budget cushion, as measured by the Comptroller’s Office, stood at 11.1 percent of adjusted spending, approaching the 12 percent threshold we have previously identified. Continued prudent management of the City’s finances should allow the City to maintain a healthy fiscal position in the future.
Table 1. FY 2018 – FY 2021 Financial Plan
| ($ in millions) | FY 2018 | FY 2019 | FY 2020 | FY 2021 | Change FYs 2018 – 2021 Dollar Percent |
|
| Revenues | ||||||
| Taxes: | ||||||
| General Property Tax | $26,014 | $27,739 | $29,103 | $30,224 | $4,210 | 16.2% |
| Other Taxes | 29,936 | 31,046 | 32,261 | 33,492 | 3,556 | 11.9% |
| Tax Audit Revenues | 850 | 721 | 721 | 721 | (129) | (15.2%) |
| Subtotal: Taxes | $56,800 | $59,506 | $62,085 | $64,437 | $7,637 | 13.4% |
| Miscellaneous Revenues | 6,488 | 6,648 | 6,863 | 6,850 | 362 | 5.6% |
| Less: Intra-City Revenues | (1,815) | (1,737) | (1,739) | (1,744) | 71 | (3.9%) |
| Disallowances Against Categorical Grants | (15) | (15) | (15) | (15) | 0 | 0.0% |
| Subtotal: City-Funds | $61,458 | $64,402 | $67,194 | $69,528 | $8,070 | 13.1% |
| Other Categorical Grants | 880 | 868 | 859 | 856 | (24) | (2.7%) |
| Inter-Fund Revenues | 671 | 664 | 602 | 602 | (69) | (10.3%) |
| Federal Categorical Grants | 7,811 | 7,014 | 6,915 | 6,901 | (910) | (11.7%) |
| State Categorical Grants | 14,419 | 14,872 | 15,371 | 15,727 | 1,308 | 9.1% |
| Total Revenues | $85,239 | $87,820 | $90,941 | $93,614 | $8,375 | 9.8% |
| Expenditures | ||||||
| Personal Service | ||||||
| Salaries and Wages | $27,250 | $28,625 | $29,426 | $30,065 | $2,815 | 10.3% |
| Pensions | 9,572 | 9,871 | 9,943 | 10,005 | 433 | 4.5% |
| Fringe Benefits | 10,111 | 10,816 | 11,715 | 12,505 | 2,394 | 23.7% |
| Subtotal-PS | $46,933 | $49,312 | $51,084 | $52,575 | $5,642 | 12.0% |
| Other Than Personal Service | ||||||
| Medical Assistance | $5,915 | $5,915 | $5,915 | $5,915 | $0 | 0.0% |
| Public Assistance | 1,594 | 1,605 | 1,617 | 1,617 | 23 | 1.4% |
| All Other | 28,803 | 27,723 | 27,760 | 28,000 | (803) | (2.8%) |
| Subtotal-OTPS | $36,312 | $35,243 | $35,292 | $35,532 | ($780) | (2.1%) |
| Debt Service | ||||||
| Principal | $3,174 | $3,492 | $3,598 | $3,591 | $417 | 13.1% |
| Interest & Offsets | 3,354 | 3,733 | 4,263 | 4,740 | 1,386 | 41.3% |
| Subtotal Debt Service | $6,528 | $7,225 | $7,861 | $8,331 | $1,803 | 27.6% |
| FY 2017 BSA | (4,169) | 0 | 0 | 0 | 4,169 | (100.0%) |
| Capital Stabilization Reserve | 250 | 250 | 250 | 250 | 0 | 0.0% |
| General Reserve | 1,200 | 1,000 | 1,000 | 1,000 | (200) | (16.7%) |
| Subtotal | $87,054 | $93,030 | $95,487 | $97,688 | $10,634 | 12.2% |
| Less: Intra-City Expenses | (1,815) | (1,737) | (1,739) | (1,744) | 71 | (3.9%) |
| Total Expenditures | $85,239 | $91,293 | $93,748 | $95,944 | $10,705 | 12.6% |
| Gap To Be Closed | $0 | ($3,473) | ($2,807) | ($2,330) | NA | NA |
Table 2. Plan-to-Plan Changes June 2017 Plan vs. April 2017 Plan
| ($ in millions) | FY 2018 | FY 2019 | FY 2020 | FY 2021 |
| Revenues | ||||
| Taxes: | ||||
| General Property Tax | $183 | $247 | $287 | $99 |
| Other Taxes | 149 | 9 | 6 | 3 |
| Tax Audit Revenues | 0 | 0 | 0 | 0 |
| Subtotal: Taxes | $332 | $256 | $293 | $102 |
| Miscellaneous Revenues | 8 | 8 | 9 | 9 |
| Less: Intra-City Revenues | 0 | 0 | 0 | 0 |
| Disallowances Against Categorical Grants | 0 | 0 | 0 | 0 |
| Subtotal: City-Funds | $340 | $264 | $302 | $111 |
| Other Categorical Grants | 0 | 0 | 0 | 0 |
| Inter-Fund Revenues | 4 | 2 | 3 | 5 |
| Federal Categorical Grants | 12 | 12 | 18 | 22 |
| State Categorical Grants | 23 | 23 | 24 | 25 |
| Total Revenues | $379 | $301 | $347 | $163 |
| Expenditures | ||||
| Personal Service | ||||
| Salaries and Wages | ($56) | $0 | $1 | $1 |
| Pensions | 0 | 5 | 7 | 4 |
| Fringe Benefits | (8) | 21 | 21 | 22 |
| Subtotal-PS | ($64) | $26 | $29 | $27 |
| Other Than Personal Service | ||||
| Medical Assistance | $0 | $0 | $0 | $0 |
| Public Assistance | 0 | 0 | 0 | 0 |
| All Other | 685 | 158 | 189 | 211 |
| Subtotal-OTPS | $685 | $158 | $189 | $211 |
| Debt Service | ||||
| Principal | $0 | $0 | $0 | $0 |
| Interest & Offsets | 0 | 0 | (47) | (65) |
| Subtotal Debt Service | $0 | $0 | ($47) | ($65) |
| FY 2017 BSA | (442) | 0 | 0 | 0 |
| Capital Stabilization Reserve | 0 | 0 | 0 | 0 |
| General Reserve | 200 | 0 | 0 | 0 |
| Subtotal | $379 | $184 | $171 | $173 |
| Less: Intra-City Expenses | 0 | 0 | 0 | 0 |
| Total Expenditures | $379 | $184 | $171 | $173 |
| Gap To Be Closed | $0 | $117 | $176 | ($10) |
Table 3. Plan-to-Plan Changes June 2017 Plan vs. June 2016 Plan
| ($ in millions) | FY 2018 | FY 2019 | FY 2020 |
| Revenues | |||
| Taxes: | |||
| General Property Tax | $402 | $619 | $714 |
| Other Taxes | (954) | (835) | (723) |
| Tax Audit Revenues | 136 | 7 | 7 |
| Subtotal: Taxes | ($416) | ($209) | ($2) |
| Miscellaneous Revenues | 54 | (30) | 86 |
| Less: Intra-City Revenues | (51) | 22 | 26 |
| Disallowances Against Categorical Grants | 0 | 0 | 0 |
| Subtotal: City-Funds | ($413) | ($217) | $110 |
| Other Categorical Grants | 43 | 33 | 28 |
| Inter-Fund Revenues | 27 | 82 | 21 |
| Federal Categorical Grants | 1,000 | 334 | 297 |
| State Categorical Grants | 126 | 109 | 122 |
| Total Revenues | $783 | $341 | $578 |
| Expenditures | |||
| Personal Service | |||
| Salaries and Wages | $37 | ($124) | ($156) |
| Pensions | (138) | 19 | 160 |
| Fringe Benefits | (143) | (116) | (164) |
| Subtotal-PS | ($244) | ($221) | ($160) |
| Other Than Personal Service | |||
| Medical Assistance | $0 | $0 | $0 |
| Public Assistance | (8) | (8) | (7) |
| All Other | 2,410 | 1,057 | 1,204 |
| Subtotal-OTPS | $2,402 | $1,049 | $1,197 |
| Debt Service | |||
| Principal | ($13) | $101 | $69 |
| Interest & Offsets | (408) | (332) | (323) |
| Subtotal Debt Service | ($421) | ($231) | ($254) |
| FY 2017 BSA | (4,169) | 0 | 0 |
| Capital Stabilization Reserve | 250 | 250 | 250 |
| General Reserve | 200 | 0 | 0 |
| Subtotal | ($1,982) | $847 | $1,033 |
| Less: Intra-City Expenses | (51) | 22 | 26 |
| Total Expenditures | ($2,033) | $869 | $1,059 |
| Gap To Be Closed | $2,816 | ($528) | ($481) |
Table 4. Risks and Offsets to the June 2017 Financial Plan
($ in millions, positive numbers decrease the gap and negative numbers increase the gap)
| FY 2018 | FY 2019 | FY 2020 | FY 2021 | |
| City Stated Gap | $0 | ($3,473) | ($2,807) | ($2,330) |
| Tax Revenues | ||||
| Property Tax | $0 | $232 | $363 | $753 |
| Property Tax Reserve | 100 | 100 | 100 | 100 |
| Personal Income Tax | 280 | 146 | 48 | (65) |
| Business Taxes | (37) | (72) | 18 | (5) |
| Sales Tax | 32 | (32) | (118) | (201) |
| State Sales Tax Intercept | 0 | (150) | 0 | 0 |
| Real Estate-Related Taxes | (74) | (76) | (80) | (81) |
| Subtotal Tax Revenues | $301 | $148 | $331 | $501 |
| Non-Tax Revenues | ||||
| ECB Fines | $30 | $30 | $30 | $30 |
| Late Filing/No Permit Penalties | 5 | 5 | 5 | 5 |
| Motor Vehicle Fines | 5 | 5 | 3 | 3 |
| Taxi Medallion Sales | 0 | (107) | (257) | (367) |
| Subtotal Non-Tax Revenues | $40 | ($67) | ($219) | ($329) |
| Total Revenues | $341 | $81 | $112 | $172 |
| Expenditures | ||||
| Overtime | ($169) | ($150) | ($150) | ($150) |
| DOE Medicaid Reimbursement | (70) | (70) | (70) | (70) |
| Homeless Shelters | (121) | (121) | (121) | (121) |
| NYC Health + Hospitals | (165) | (165) | (165) | (165) |
| Public Assistance | 15 | 15 | 15 | 15 |
| VRDB Interest Savings | 100 | 100 | 100 | 100 |
| Refunding Savings | 4 | 35 | 35 | 35 |
| Pension Contributions | 0 | 137 | 274 | 412 |
| Subtotal | ($406) | ($219) | ($82) | $56 |
| Total (Risks)/Offsets | ($65) | ($138) | $30 | $228 |
| Restated (Gap)/Surplus | ($65) | ($3,611) | ($2,777) | ($2,102) |
II. FY 2018 Adopted Budget
Overview
The FY 2018 Adopted Budget totals $85.24 billion. More than 80 percent of the budget is allocated for education, social services, public safety and judicial, fringe benefits, pensions and general government. As shown in Chart 1, spending in these areas accounts for approximately $70 billion of the total budget.
Chart 1. FY 2018 Budget by Service Areas and Centrally Budgeted Expenditures
($ in millions)
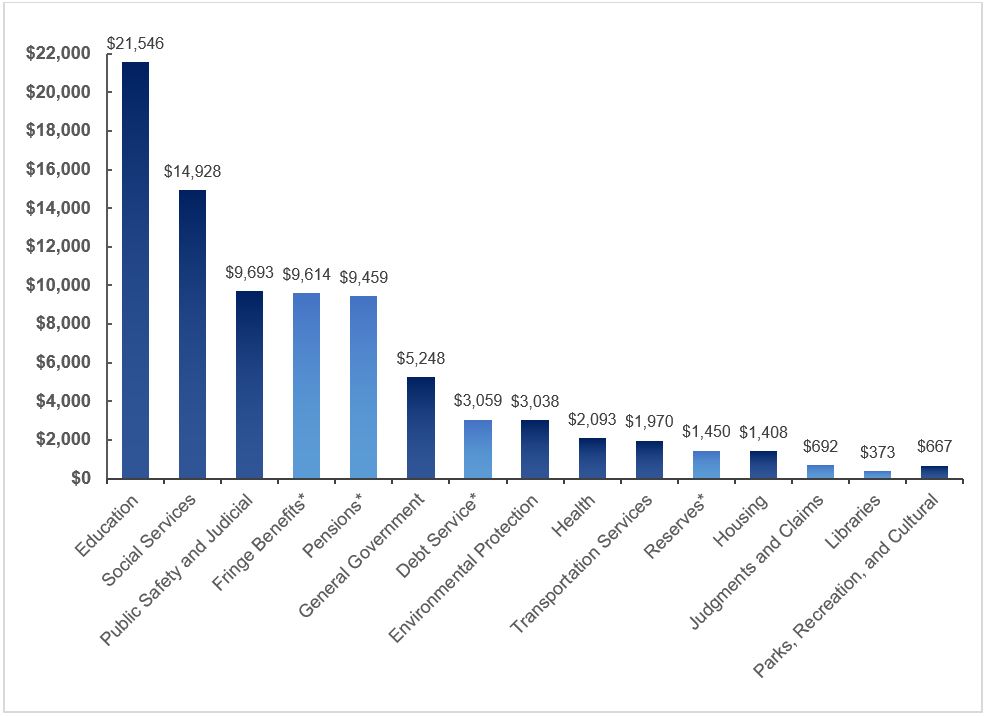
* Centrally budgeted expenditures
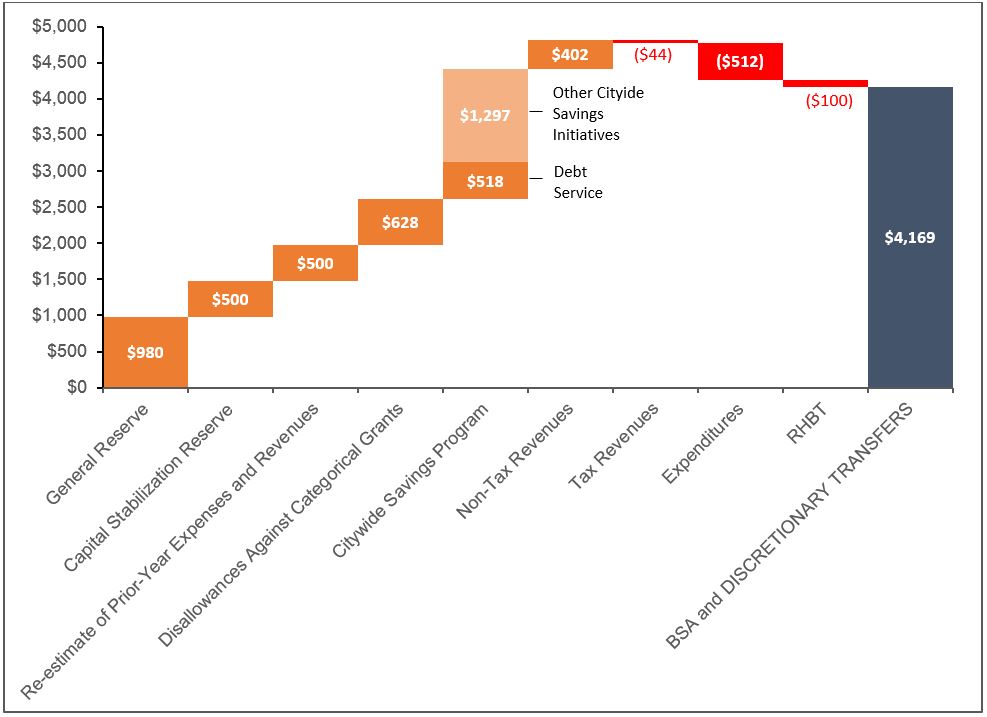
The FY 2018 Adopted Budget reflects FY 2017 prepayments totaling $4.17 billion, including $3.47 billion for debt service, $400 million for retiree health benefits, and $300 million for NYC Health + Hospitals (H+H) subsidies. Chart 2 shows the build-up of the Budget Stabilization Account (BSA) and discretionary transfers that fund the prepayments of FY 2018 expenditures. Without the prepayments, FY 2018 debt service, fringe benefits and health expenditures would have been $6.53 billion, $10.01 billion, and $2.39 billion, respectively.
Chart 2. Funding the BSA and Discretionary Transfers
($ in millions)
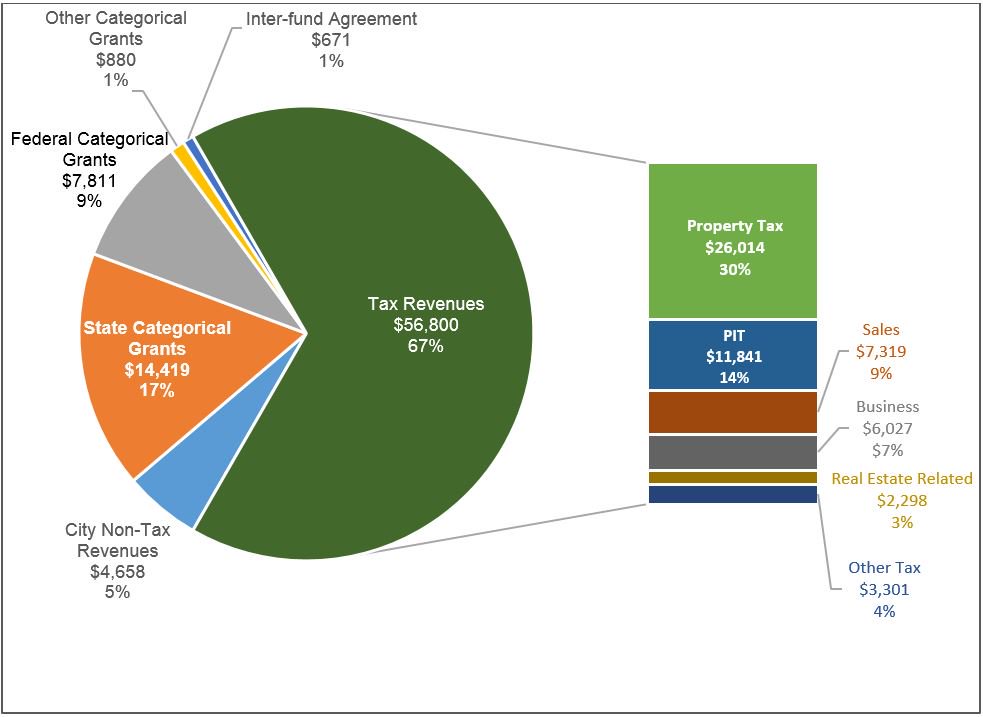
About 72 percent of FY 2018 expenditures are supported by City-generated revenues. Tax revenues, which are projected to total $56.8 billion, account for the bulk of City-generated revenues, as shown in Chart 3. Real property, personal income, sales, business, and real estate-related tax revenues account for almost 94 percent of total tax revenues. City-generated non-tax revenues include revenues from licenses, permits and franchises; interest income, charges for services; water and sewer charges; fines and forfeitures; and miscellaneous other non-tax revenues.
Chart 3. FY 2018 Budget Funding Sources
($ in millions)
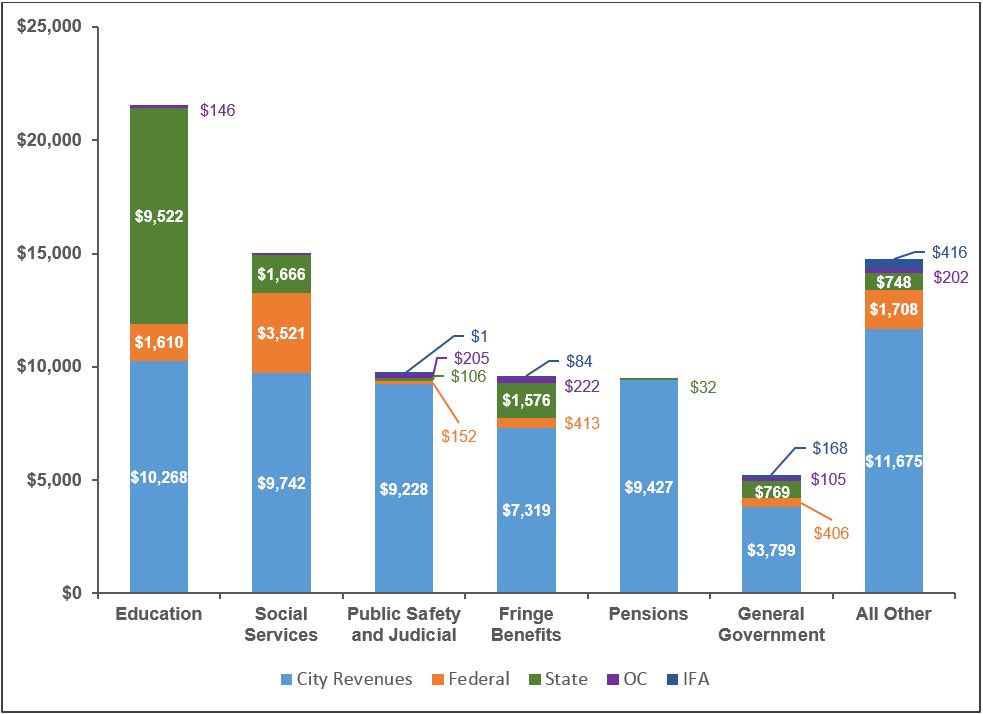
State categorical grants, which support many mandated programs, are budgeted at $14.4 billion and account for more than 60 percent of non-City revenues. About three-quarters of State categorical grants are earmarked for education. Federal categorical grants account for another $7.8 billion of non-City revenues, of which $705 million are disaster recovery community development block grants. Approximately 45 cents of every dollar of Federal grants go towards social services and account for almost a quarter of total funding for social services. A significant portion of the budget of most of the City’s social services agencies rely on Federal funding, including 42 percent of the budget for the Administration for Children’s Services (ACS), 35 percent of the budget for the Department of Homeless Services (DHS), 20 percent of the budget for the Department for the Aging (DFTA), and 16 percent of the budget for the Department of Social Services/Human Resources Administration (HRA).
Other categorical grants and inter-fund agreement (IFA) revenues round out the remaining non-City generated revenues. Other categorical grants consist primarily of reimbursements to the Fire Department (FDNY) for emergency medical services; reimbursements for health benefits from the Health Stabilization Fund; payments from H+H for fringe benefits, judgments and claims, and energy costs; interest exchange agreements, and private grants from foundations and other sources. IFA revenues are reimbursements from the Capital Fund for expense budget costs related to capital projects such as planning design and construction supervision. Chart 4 shows the funding allocation among the different service areas of the budget.
Chart 4. FY 2018 Funding Allocation by Service Areas and Centrally Budgeted Expenditures
($ in millions)
Changes from FY 2017
The FY 2018 Adopted Budget, which reflects the impact of prepayments, is $86 million less than the modified FY 2017 budget, as shown in Table 5. The decline in revenues is due to a projected $1.2 billion drop in non-City-funds revenues, largely offset by a projected increase of $1.16 billion in City-funds revenues. The drop in non-City-funds revenues is driven primarily by a reduction of $1.16 billion in Federal categorical grants. The winding down of disaster recovery community development block grants, from $1.39 billion in FY 2017 to $705 million in FY 2018, accounts for $689 million of the decrease. Another $368 million of the decrease is due to grants that are included in FY 2017 but not in the outyears, either because they are non-recurring or they are typically included only in budget modifications subsequent to budget adoption.
The net increase in City-funds revenues result from an increase of $2.2 billion in tax revenues and a decrease of $1.04 billion in non-tax revenues. Over 60 percent of the increase is due to property tax revenues which are projected to increase by $1.36 billion to $26.01 billion in FY 2018. The largest increase in non-property tax revenues is personal income tax (PIT) revenue which is projected to increase by $608 million to $11.84 billion. Business tax revenues, which weakened in FY 2017, are expected to rebound in FY 2018 with a projected increase of $502 million.[1] In contrast, tax audit revenues are projected to decline by $401 million to $850 million.
More than half of the decrease in FY 2018 City-funds non-tax revenues reflects the release of $628 million from the reserve for disallowances for categorical grants in FY 2017.[2] Because the reserve is against disallowances of prior-year claims already recognized as revenues, the released funds are treated as City-funds revenues in FY 2017. Since this revenue does not recur beyond FY 2017, City-funds revenues decline by the same amount in FY 2018.
Table 5. Change FY 2017 – FY 2018
| ($ in millions) | FY 2017 | FY 2018 | Dollar Change | Percent Change |
| Revenues | ||||
| Taxes: | ||||
| General Property Tax | $24,651 | $26,014 | $1,363 | 5.5% |
| Other Taxes | 28,699 | 29,936 | 1,237 | 4.3% |
| Tax Audit Revenues | 1,251 | 850 | (401) | (32.1%) |
| Subtotal Taxes | $54,601 | $56,800 | $2,199 | 4.0% |
| Miscellaneous Revenues | 7,107 | 6,488 | (619) | (8.7%) |
| Unrestricted Intergovernmental Aid | 57 | 0 | (57) | (100.0%) |
| Less: Intra-City Revenues | (2,081) | (1,815) | 266 | (12.8%) |
| Disallowances Against Categorical Grants | 613 | (15) | (628) | (102.4%) |
| Subtotal City-Funds | $60,297 | $61,458 | $1,161 | 1.9% |
| Other Categorical Grants | 985 | 880 | (105) | (10.7%) |
| Inter-Fund Revenues | 627 | 671 | 44 | 7.0% |
| Federal Categorical Grants | 8,966 | 7,811 | (1,155) | (12.9%) |
| State Categorical Grants | 14,450 | 14,419 | (31) | (0.2%) |
| Total Revenues | $85,325 | $85,239 | ($86) | (0.1%) |
| Expenditures | ||||
| Personal Services | ||||
| Salaries and Wages | $25,702 | $27,250 | $1,548 | 6.0% |
| Pensions | 9,395 | 9,572 | 177 | 1.9% |
| Fringe Benefits | 9,441 | 10,111 | 670 | 7.1% |
| Retiree Health Benefits Trust | 100 | 0 | (100) | (100.0%) |
| Subtotal PS | $44,638 | $46,933 | $2,295 | 5.1% |
| Other Than Personal Service | ||||
| Medical Assistance | 5,915 | 5,915 | 0 | 0.0% |
| Public Assistance | 1,579 | 1,594 | 15 | 0.9% |
| All Other | 29,064 | 28,803 | (261) | (0.9%) |
| Subtotal OTPS | $36,558 | $36,312 | ($246) | (0.7%) |
| Debt Service | ||||
| Principal | $2,927 | $3,004 | $77 | 2.6% |
| Interest & Offsets | 3,132 | 3,524 | 392 | 12.5% |
| Subtotal Debt Service | $6,059 | $6,528 | $469 | 7.7% |
| FY 2016 BSA & Discretionary Transfer | (4,038) | 0 | 4,038 | NA |
| FY 2017 BSA & Discretionary Transfer | 4,169 | (4,169) | (8,338) | NA |
| Capital Stabilization Reserve | 0 | 250 | 250 | NA |
| General Reserve | 20 | 1,200 | 1,180 | 5,900.0% |
| Subtotal | $87,406 | $87,054 | ($352) | (0.4%) |
| Less: Intra-City Expenses | (2,081) | (1,815) | 266 | (12.8%) |
| Total Expenditures | $85,325 | $85,239 | ($86) | (0.1%) |
Expenditures as presented in the FY 2018 Adopted Budget are reduced by FY 2017 prepayments. In contrast, the FY 2017 Modified Budget is inflated by the net impact of FY 2016 and FY 2017 prepayments and a $100 million deposit into the Retiree Health Benefits Trust (RHBT) above the amount required for FY 2017 pay-as-you-go retiree health benefits. After netting out the impact from prepayments and the RHBT deposit, FY 2018 expenditures before reserves total $87.96 billion, an increase of $2.38 billion from the adjusted FY 2017 expenditure, as shown in Table 6.[3]
Expenditure growth in FY 2018 is driven by spending on salaries and wages, debt service, health insurance, and other fringe benefits. The combined spending in these areas is projected to grow by $2.69 billion. All other spending areas are projected to remain relatively flat, with a moderate reduction of $304 million.
Table 6. FY 2018 Expenditures vs FY 2017 Expenditures Adjusted for Prepayments
| ($ in millions) |
FY 2017 |
FY 2018 | Dollar Change | Percent Change |
| Salaries and Wages | $25,323 | $26,882 | $1,558 | 6.2% |
| Debt Service | 6,060 | 6,528 | 468 | 7.7% |
| Health Insurance | 5,839 | 6,368 | 529 | 9.1% |
| Other Fringe Benefits | 3,518 | 3,650 | 132 | 3.8% |
| Subtotal | $40,740 | $43,427 | $2,687 | 6.6% |
| Pensions | $9,283 | $9,459 | $177 | 1.9% |
| Medicaid | 5,915 | 5,915 | 0 | 0.0% |
| Public Assistance | 1,579 | 1,594 | 15 | 1.0% |
| Judgments and Claims | 756 | 692 | (65) | (8.6%) |
| Contractual Services* | 16,280 | 15,587 | (694) | (4.3%) |
| Other OTPS | 11,021 | 11,284 | 263 | 2.4% |
| Subtotal | $44,834 | $44,531 | ($304) | (0.7%) |
| Expenditures Before Reserves | $85,574 | $87,958 | $2,384 | 2.8% |
| RHBT Deposit | $100 | $0 | ($100) | (100.0%) |
| Prior-Year Adjustment | ($500) | $0 | $500 | (100.0%) |
| General Reserve | $20 | $1,200 | $1,180 | 5,900.0% |
| Capital Stabilization Reserve | $0 | $250 | $250 | NA |
| Total | $85,194 | $89,408 | $4,214 | 4.9% |
*Excludes contractual services for debt service and Medicaid
Note: Numbers may not add due to rounding.
Changes from the Executive Budget
The FY 2018 Budget is $379 million more than the Executive Budget, driven by a $340 million increase in the City-funds portion of the budget. Increases of $23 million in State categorical grants, $12 million in Federal categorical grants and $4 million in IFA account for the remaining increase in the budget. The increase in State categorical grants includes $16 million for preventive child welfare services. The change in Federal categorical grants reflects a $6 million roll of community development block grants for school playground projects from FY 2017 into FY 2018.
City-Funds Revenues
The increase in City-funds revenues stems from an upward revision of $332 million in tax revenues driven primarily by increases of $183 million and $186 million respectively in the property and personal income tax (PIT) revenue estimates, as shown in Table 7.[4] The increase in property tax revenues reflects a final assessment roll that is higher than the tentative assessment roll used in the Executive Budget forecast. This increase is partially offset by a projected loss of $87 million from a tax program that increases property tax exemptions for seniors, veterans and the disabled.[5] The change in PIT revenue estimates is due to the State delaying $186 million of FY 2017 NYC PIT STAR rate reduction reimbursements to FY 2018. The delayed reimbursement is shown as an increase in FY 2018 PIT withholding because, beginning in tax year 2017, the NYC PIT STAR rate reduction will be terminated resulting in the elimination of State reimbursement for the rate reduction and a higher tax rate with an attendant increase in withholding. However, NYC PIT filers will be able to claim a credit against their State PIT liability that is equivalent to the rate increase. As such, the change from NYC PIT STAR rate reduction to State PIT credit is revenue neutral to both the City and taxpayers.
Table 7. Changes to City-Funds Estimates from the Executive Budget
| ($ in millions) | |||
| Revenues | Expenditures | ||
| Property | $183 | City Council Initiatives | $381 |
| Personal Income (PIT) | 186 | Agency Expenditures | 280 |
| Sales | (50) | Miscellaneous Expenditures | 19 |
| All Other | 100 | Collective Bargaining | 5 |
| City Tax Program | (87) | Subtotal Expenditures | $685 |
| Subtotal Tax Revenues | $332 | Citywide Savings Program | ($103) |
| FY 2017 BSA and Discretionary Transfers | ($442) | ||
| Non-Tax Revenues | $8 | General Reserve | $200 |
| Total Revenues | $340 | Total Expenditures | $340 |
City-Funds Expenditures
Excluding reductions from FY 2017 prepayments and savings from additional Citywide Savings Program initiatives, FY 2018 City-funds expenditures, before reserves, were increased by $685 million, as shown in Table 7. City Council initiatives totaling $381 million and additional agency spending of $280 million account for most of the increase.
The FY 2018 Adopted Budget includes additional savings initiatives which are projected to produce savings of $103 million in FY 2018. These savings along with the $340 million increase in City-funds revenues discussed above and an additional $442 million in FY 2017 prepayments help fund the increase in City-funds expenditures and a $200 million increase to the FY 2018 General Reserve, bringing the FY 2018 General Reserve to $1.2 billion. The increase in prepayments brings the total FY 2017 prepayments to $4.17 billion.
Citywide Savings Program
The additional Citywide savings initiatives in the current Financial Plan are estimated to produce savings of $279 million in FY 2017, $103 million in FY 2018, $222 thousand in FY 2019, $47 million in FY 2020, and $65 million in FY 2021.
Debt service savings of $223 million account for the bulk of FY 2017 savings and for nearly the entirety of savings in 2020 and 2021. The remaining FY 2017 savings are accruals of under-spending against the budget.
Almost all of the FY 2018 savings are from adjustments to the City’s hiring plan attributed to a “partial hiring freeze.” This initiative, however, is similar to the savings program at this point last year when most of the FY 2017 savings were from hiring Plan adjustments. These adjustments reflect accrual savings from hiring delays and are non-recurring. There are no headcount reductions associated with these adjustments.
Combined with the initiatives proposed in November, January, and April, savings in FY 2017 through FY 2021 are expected to total $6.6 billion. Almost all the initiatives are set to begin in FY 2017 and FY 2018. The combined savings in these two fiscal years total $3.2 billion. Nearly all the savings in FY 2019 through FY 2021 are from recurring savings from FY 2017 and FY 2018 initiatives.
Headcount
The June 2017 headcount plan increases full-time positions by 96 in FY 2017, 296 in FY 2018, and 309 in each of FY 2019 through FY 2021. The increase in staffing brings planned year-end full-time headcount to 301,389 in FY 2017, 302,097 in FY 2018, 302,725 in FY 2019, 302,815 in FY 2020, and 304,903 in FY 2021. Most of the additional headcount are in the Fire and Police Departments. The additional headcount in the Fire Department will go towards increasing staffing in Bronx EMS operations.
The increase in the Police Department reflects the planned hiring of 116 additional traffic enforcement agents (TEA) to curb fraudulent use and abuse of City-issued parking placards. The additional TEAs will cost $4.07 million in FY 2018 and $5.43 million per year in FY 2019 through FY 2021. The City expects additional parking fine revenues from this initiative to offset the additional staffing cost. The Financial Plan includes additional fine revenues of $5.9 million in FY 2018 and $5.4 million in each of the outyears of the Plan.
Overall, the additional headcount will cost $14.3 million in FY 2018 and more than $16 million in each of the outyears of the Plan.
The Outyears
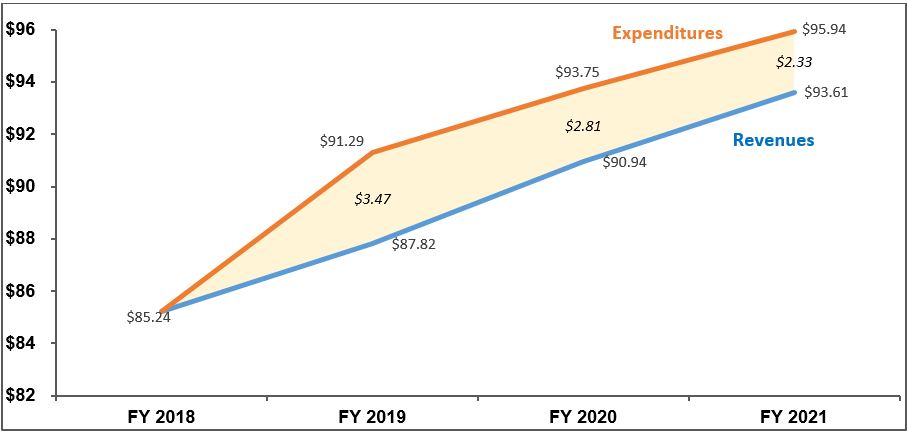
While the FY 2018 budget is balanced, the June 2017 Financial Plan projects budget gaps of $3.47 billion in FY 2019, $2.81 billion in FY 2020, and $2.33 billion in FY 2021, as shown in Chart 5. Over this period, revenues are projected to grow by 9.8 percent from $85.24 billion in FY 2018 to $93.61 billion in FY 2021 while expenditures are projected to grow by 12.6 percent to $95.94 billion.
Chart 5. June Financial Plan Revenues, Expenditures and Budget Gaps
($ in billions)
Revenues
As shown in Table 8, revenues are projected to grow at an average annual rate of 3.2 percent in the outyears of the Plan, driven by growth in City funds. City funds, which account for more than 72 percent of overall revenues, are projected to grow by 13.1 percent from FY 2018 to FY 2021. Non-City funds are projected to remain relatively flat over this period with a tepid 0.4 percent average annual growth. With the exception of State categorical grants, which are projected to grow at an annual average rate of 2.9 percent in the outyears, all other non-City revenues are projected to decline over the Plan period. The projection of Federal categorical grants does not reflect the Trump Administration’s proposed Federal FY 2018 budget, which eliminates or dramatically cuts numerous federal aid programs that fund City programs.
Table 8. FY 2018 – FY 2021 Revenue Growth
| ($ in millions) | FY 2018 | FY 2019 | FY 2020 | FY 2021 | Growth FYs 18-21 | Annual Growth |
| Tax Revenues | $56,800 | $59,506 | $62,085 | $64,437 | 13.4% | 4.3% |
| Non-Tax Revenues | 4,658 | 4,896 | 5,109 | 5,091 | 9.3% | 3.0% |
| Subtotal City-Funds | $61,458 | $64,402 | $67,194 | $69,528 | 13.1% | 4.2% |
| Federal Categorical Grants | $7,811 | $7,014 | $6,915 | $6,901 | (11.7%) | (4.0%) |
| State Categorical Grants | 14,419 | 14,872 | 15,371 | 15,727 | 9.1% | 2.9% |
| Other Categorical Grants | 880 | 868 | 859 | 856 | (2.7%) | (0.9%) |
| IFA Revenues | 671 | 664 | 602 | 602 | (10.3%) | (3.6%) |
| Subtotal Non-City-Funds | $23,781 | $23,418 | $23,747 | $24,086 | 1.3% | 0.4% |
| Total | $85,239 | $87,820 | $90,941 | $93,614 | 9.8% | 3.2% |
Expenditures
Expenditures in the Financial Plan, after adjusting for the FY 2017 prepayments of FY 2018 expenditures, are projected to grow by 2.1 percent in FY 2019, 2.7 percent in FY 2020, and 2.3 percent in FY 2021.
Similar to FY 2018, expenditure growth in the outyears is driven by spending on salaries and wages, debt service, health insurance, and other fringe benefits. Together, these expenditures are projected to grow at an average annual rate of 5.1 percent, as shown in Table 9. All other expenditures, excluding reserves, are projected to remain relatively flat with a slight decrease of 0.6 percent over the Plan period. Overall, expenditures adjusted for prepayments are projected to grow at an average annual rate of 2.4 percent, less than the 3.2 percent projected revenue growth, leading to narrowing of the outyear gaps over the Plan period.
Table 9. FY 2018 – FY 2021 Expenditure Growth Adjusted for Prepayments
| ($ in millions) | FY 2018 | FY 2019 | FY 2020 | FY 2021 | Growth FYs 18-21 | Annual Growth |
| Salaries and Wages | $26,882 | $28,257 | $29,058 | $29,697 | 10.5% | 3.4% |
| Debt Service | 6,528 | 7,225 | 7,861 | 8,331 | 27.6% | 8.5% |
| Health Insurance | 6,368 | 6,862 | 7,404 | 8,069 | 26.7% | 8.2% |
| Other Fringe Benefits | 3,650 | 3,854 | 4,205 | 4,325 | 18.5% | 5.8% |
| Subtotal | $43,427 | $46,198 | $48,528 | $50,422 | 16.1% | 5.1% |
| Pensions | $9,459 | $9,759 | $9,830 | $9,893 | 4.6% | 1.5% |
| Medicaid | 5,915 | 5,915 | 5,915 | 5,915 | 0.0% | 0.0% |
| Public Assistance | 1,594 | 1,605 | 1,617 | 1,617 | 1.4% | 0.5% |
| Judgments and Claims | 692 | 707 | 725 | 740 | 7.0% | 2.3% |
| Contractual Services* | 15,587 | 14,897 | 14,690 | 14,852 | (4.7%) | (1.6%) |
| Other OTPS | 11,284 | 10,963 | 11,193 | 11,256 | (0.2%) | (0.1%) |
| Subtotal | $44,531 | $43,845 | $43,970 | $44,272 | (0.6%) | (0.2%) |
| Expenditures Before Reserves | $87,958 | $90,043 | $92,498 | $94,694 | 7.7% | 2.5% |
| General Reserve | $1,200 | $1,000 | $1,000 | $1,000 | (16.7%) | (5.9%) |
| Capital Stabilization Reserve | $250 | $250 | $250 | $250 | 0.0% | 0.0% |
| Total | $89,408 | $91,293 | $93,748 | $95,944 | 7.3% | 2.4% |
*Excludes contractual services for debt service and Medicaid
Risks and Offsets
The Comptroller’s Office projects higher revenues of $341 million in FY 2018, $81 million in FY 2019, $112 million in FY 2020, and $172 million in FY 2021. The additional revenues in FY 2018 and FY 2019 are offset by net risks to expenditures estimated by the Comptroller’s Office of $406 million in FY 2018, $219 million in FY 2019, and $82 million in FY 2020. For FY 2021, the Comptroller’s Office estimates that spending will be less than the Plan projection by $56 million. As a result, the Comptroller’s Office projects a small deficit of $65 million for FY 2018, a larger gap of $3.61 billion in FY 2019, and smaller gaps of $2.78 billion and $2.10 billion in FY 2020 and FY 2021, as shown in Table 10.
Table 10. Risks and Offsets to the June 2017 Financial Plan
($ in millions, positive numbers decrease the gap and negative numbers increase the gap)
| FY 2018 | FY 2019 | FY 2020 | FY 2021 | |
| City Stated Gap | $0 | ($3,473) | ($2,807) | ($2,330) |
| Tax Revenues | ||||
| Property Tax | $0 | $232 | $363 | $753 |
| Property Tax Reserve | 100 | 100 | 100 | 100 |
| Personal Income Tax | 280 | 146 | 48 | (65) |
| Business Taxes | (37) | (72) | 18 | (5) |
| Sales Tax | 32 | (32) | (118) | (201) |
| State Sales Tax Intercept | 0 | (150) | 0 | 0 |
| Real Estate-Related Taxes | (74) | (76) | (80) | (81) |
| Subtotal Tax Revenues | $301 | $148 | $331 | $501 |
| Non-Tax Revenues | ||||
| ECB Fines | $30 | $30 | $30 | $30 |
| Late Filing/No Permit Penalties | 5 | 5 | 5 | 5 |
| Motor Vehicle Fines | 5 | 5 | 3 | 3 |
| Taxi Medallion Sales | 0 | (107) | (257) | (367) |
| Subtotal Non-Tax Revenues | $40 | ($67) | ($219) | ($329) |
| Total Revenues | $341 | $81 | $112 | $172 |
| Expenditures | ||||
| Overtime | ($169) | ($150) | ($150) | ($150) |
| DOE Medicaid Reimbursement | (70) | (70) | (70) | (70) |
| Homeless Shelters | (121) | (121) | (121) | (121) |
| NYC Health + Hospitals | (165) | (165) | (165) | (165) |
| Public Assistance | 15 | 15 | 15 | 15 |
| VRDB Interest Savings | 100 | 100 | 100 | 100 |
| Refunding Savings | 4 | 35 | 35 | 35 |
| Pension Contributions | 0 | 137 | 274 | 412 |
| Subtotal | ($406) | ($219) | ($82) | $56 |
| Total (Risks)/Offsets | ($65) | ($138) | $30 | $228 |
| Restated (Gap)/Surplus | ($65) | ($3,611) | ($2,777) | ($2,102) |
The Comptroller’s Office’s tax revenue projections are above the City’s by $301 million in FY 2018, $148 million in FY 2019, $331 million in FY 2020, and $501 million in FY 2021, due primarily to higher forecasts for property tax and PIT revenues. Differences in forecasts between the Comptroller’s Office and the City for the various tax revenue components are driven primarily by differences in growth rate assumptions. The Comptroller’s Office property tax forecast also reflects differences in assumptions of reserves and refunds for property tax.
Overall, the Comptroller’s Office forecast for tax revenue growth is slightly higher than the City over the forecast period, as shown in Table 11. Total tax revenue is forecast to grow at an average of 4.4 percent over the Plan period, compared to the City’s forecast of 4.2 percent.
Table 11. Tax Revenue Forecast, Growth Rates
| FY 2018 | FY 2019 | FY 2020 | FY 2021 | Average Annual Growth | |
| Property | |||||
| Mayor | 5.5% | 6.6% | 4.9% | 3.9% | 5.2% |
| Comptroller | 5.9% | 7.5% | 5.3% | 5.1% | 6.0% |
| PIT | |||||
| Mayor | 5.4% | 2.0% | 4.6% | 4.3% | 4.0% |
| Comptroller | 7.8% | 0.8% | 3.7% | 3.4% | 3.9% |
| Business | |||||
| Mayor | 9.1% | 3.3% | 2.4% | 3.8% | 4.6% |
| Comptroller | 8.4% | 2.7% | 3.9% | 3.4% | 4.6% |
| Sales a | |||||
| Mayor | 4.6% | 7.7% | 4.6% | 4.2% | 5.3% |
| Comptroller | 5.1% | 4.7% | 5.6% | 3.2% | 4.7% |
| Real Estate-Related | |||||
| Mayor | (8.1%) | 2.7% | 4.4% | 1.9% | 0.1% |
| Comptroller | (11.1%) | 2.7% | 4.4% | 1.9% | (0.7%) |
| All Other | |||||
| Mayor | 3.8% | 2.4% | 1.9% | 2.2% | 2.6% |
| Comptroller | 3.8% | 2.4% | 1.9% | 2.2% | 2.6% |
| Total Tax with Audit | |||||
| Mayor | 4.0% | 4.8% | 4.3% | 3.8% | 4.2% |
| Comptroller | 4.6% | 4.5% | 4.6% | 4.0% | 4.4% |
a Projected sales tax revenue growth rates are net of the State intercept of sales tax revenues to recoup savings from the FY 2015 refinancing of Sales Tax Asset Receivable Corporation bonds.
Revenues from motor vehicle and Environmental Control Board fines, and penalties for late or non-filing of building permits are also estimated to be higher than the City’s projections throughout the Plan period. However, uncertainty in the market for taxi medallions, caused by changes in the taxi industry from for-hire car services companies, suggests that the assumption of taxi medallion sales in the Plan may be overly optimistic. As such, the assumed revenues from taxi medallion sales result in net risks to non-tax revenues of $67 million in FY 2019, $219 million in FY 2020, and $329 million in FY 2021.
With regard to expenditures, the largest risk is in overtime. The City’s FY 2018 overtime budget of $1.37 billion is 22 percent lower than the current fiscal year’s estimated overtime spending of $1.77 billion through June. Based on recent overtime spending trends and factoring in the City’s initiatives to curb overtime spending, the Comptroller’s Office estimates that FY 2018 overtime expenditures will total $1.544 billion, $169 million more than the City’s projection.
Two other major risks to expenditures are the DHS budget for adult shelter operations expenditures and the City’s assumption of reimbursements for H+H fringe benefits costs and judgments and claims expenditures. City-funds spending on shelter operations in DHS is projected to decline from $795 million in FY 2017 to $694 million in FY 2018 and remain relatively stable thereafter. However, current trends show that it is unlikely that the need for shelter services will diminish. According to the Comptroller’s Office’s analysis, even if the adult shelter census were to stabilize at the current level, there is still a risk of at least $121 million a year in the Plan’s shelter operation estimates. This risk will escalate further if the shelter census further increases in FY 2018.
H+H is required to reimburse the City for debt service, fringe benefits costs, and judgements and claims (J&C) expenditures incurred on the system’s behalf. The Financial Plan reflects the City’s decision in FY 2016 to waive H+H’s reimbursement for debt service over the Plan period. The Plan continues to assume annual reimbursements of $140 million for J&C settlements and $25 million for fringe benefits costs. However, H+H has only made one payment out of the four-year period spanning FY 2013 to FY 2016. Until there is a clear indication that H+H will make this payment, the Comptroller’s Office expects that the City will have to cover these expenses.
Similarly, DOE will have to cover any potential shortfall in Medicaid reimbursement for special education related services against the Plan assumption. The June Plan assumes reimbursements of $97 million annually in FY 2018 through FY 2021. Given that the Department has realized an average of only $15 million annually over the past six years, the Comptroller’s Office estimates that reimbursements will likely fall short of the Plan assumption by $70 million in each of FYs 2018-2021.
The above expenditure risks are somewhat tempered by anticipated savings from: low interest rates on variable rate debt bonds (VRDB) if rates remain historically low; refunding; lower than projected public assistance caseloads; and lower pension contributions from FY 2017 pension investment earnings above the actuarial interest rate assumption (AIRA). Preliminary returns indicate that the City’s pension investments earned 13 percent in FY 2017, 6 percent above the AIRA. The excess earnings above the AIRA will be phased in over six years beginning in FY 2019, resulting in savings of $137 million in FY 2019, $274 million in FY 2020, and $412 million in FY 2021.
Cushion
In addition to the $4.169 billion prepayment, the City deposited an additional $100 million above the required FY 2017 pay-as-you-go retiree health benefits cost in the Retiree Health Benefits Trust (RHBT). The prepayment and additional RHBT deposit together with the $1.45 billion in the FY 2017 General Reserve and Capital Stabilization Reserve increases the City’s budget cushion at the start of FY 2018 to $9.8 billion. This is the fourth consecutive year in which the City has added to the cushion. Despite the increase, the cushion as a percent of adjusted expenditures remains at 11.1 percent, unchanged from the start of FY 2017. This is because expenditures have also increased with the cushion. This ratio falls outside the optimal range of 12 percent to 18 percent of adjusted expenditures recommended by the Comptroller’s Office and is $800 million shy of the lower threshold.
III. The City’s Economy
Comptroller’s Economic Forecast, 2017-2021
There are no significant changes to our economic forecast since we released our Executive Budget report in May 2017. Both the U.S. and City economies are expected to continue growing at a slow to moderate pace for the remainder of 2017 and 2018. Although the chance of a near-term recession is low, anticipated slow growth makes the economy vulnerable to shocks. The risks to our forecast are mostly related to how the economy responds to changes to the Federal Reserve’s monetary policy and to the fate of fiscal policy initiatives from Washington.
The Commerce Department’s Bureau of Economic Analysis revised its first quarter 2017 real GDP growth estimate to 1.4 percent, double the initial estimate of 0.7 percent. The U.S. economy added 1,079,000 jobs in the first half of 2017, or 0.7 percent from the end of 2016. That is an average of 180,000 jobs per month, slower than the 187,000 average monthly gain in 2016, but higher than the growth in the labor force (about 72,000 per month).
The City’s economy continues to outperform the nation’s: real gross city product (GCP) grew at a seasonally adjusted annual rate of 2.6 percent in the first quarter of 2017; payroll jobs increased by 82,000 or 1.9 percent in the first half of 2017, more than twice the nation’s 0.7 percent growth from December 2016; and the unemployment rate averaged 4.3 percent in the first half of 2017, lower than the nation’s 4.5 percent and the City’s 5.3 percent average during the same period in 2016.
Overall, the Comptroller’s Office expects the U.S. economy to grow 2.1 percent in 2017, slightly faster than the 1.6 percent growth in 2016, while the City’s economy is expected to grow 2.3 percent. We project national GDP growth to peak at 2.3 percent in 2018 before tapering off to 1.5 percent in 2021, while City GCP growth will peak at 2.5 percent in 2018 and then taper off to 2.2 percent in 2021.
The most likely risk to continued growth would be a premature increase in short-term interest rates by the Federal Reserve. On the fiscal front, a long delay in fulfilling the campaign promises of lower taxes and more infrastructure growth, which were widely accepted by financial markets as a positive factor, could also result in slower than projected growth of the national and local economies.
Table 12 shows the Comptroller’s and the Mayor’s forecast of five economic indicators for 2017 to 2021.
Table 12. Selected Economic Indicators, Annual Averages, Comptroller and Mayor’s Forecasts, 2017-2021
| Annual Averages | 2017 | 2018 | 2019 | 2020 | 2021 | |
| Selected U.S. Economic Indicators | ||||||
| Real GDP (2009 $), (% change) | Comptroller
Mayor |
2.1
2.3 |
2.3
2.5 |
2.0
2.3 |
1.7
2.3 |
1.5
2.2 |
| Payroll Jobs (Change in millions) | Comptroller
Mayor |
1.9
2.2 |
1.8
1.8 |
1.8
1.5 |
1.3
1.4 |
0.9
1.1 |
| Inflation Rate (Percent) | Comptroller
Mayor |
2.6
2.5 |
2.2
2.0 |
2.4
2.3 |
2.2
2.8 |
2.2
2.7 |
| Fed Funds Rate (Percent) | Comptroller
Mayor |
1.0
1.0 |
1.6
1.7 |
2.4
2.6 |
3.2
3.0 |
3.0
3.0 |
| Selected NYC Economic Indicators | ||||||
| Real GCP (2009 $), (% change) | Comptroller
Mayor |
2.2
1.7 |
2.4
1.8 |
2.1
1.6 |
1.6
1.8 |
1.6
1.9 |
| Payroll Jobs (Change in thousands) | Comptroller
Mayor |
60
53 |
50
45 |
39
35 |
31
34 |
28
34 |
| Inflation Rate (Percent) | Comptroller
Mayor |
2.4
2.5 |
2.7
2.0 |
2.6
2.4 |
2.4
2.7 |
2.4
2.7 |
| Wage-Rate Growth (Percent) | Comptroller
Mayor |
2.9
2.8 |
3.3
3.7 |
2.9
3.7 |
2.7
3.9 |
2.3
4.0 |
| Unemployment Rate (Percent) | Comptroller
Mayor |
4.3
NA |
4.6
NA |
5.1
NA |
5.2
NA |
5.0
NA |
Source: Office of the NYC Comptroller and Mayor’s Office of Management and Budget.
Notes: GCP: Gross City Product. NA: not available.
IV. Appendix
Table A1. June 2017 Financial Plan Revenue Detail
| ($ in millions) | FY 2018 | FY 2019 | FY 2020 | FY 2021 | Change FYs 2018 – 2021 Dollars Percent |
Annual Percent Change | ||
| Taxes: | ||||||||
| Real Property | $26,014 | $27,739 | $29,103 | $30,224 | $4,210 | 16.2% | 5.1% | |
| Personal Income Tax | 11,841 | 12,073 | 12,624 | 13,166 | 1,325 | 11.2% | 3.6% | |
| General Corporation Tax | 3,890 | 3,982 | 4,004 | 4,113 | 223 | 5.7% | 1.9% | |
| Unincorporated Business Tax | 2,137 | 2,242 | 2,371 | 2,502 | 365 | 17.1% | 5.4% | |
| Sale and Use Tax | 7,319 | 7,881 | 8,245 | 8,592 | 1,273 | 17.4% | 5.5% | |
| Real Property Transfer | 1,364 | 1,400 | 1,461 | 1,490 | 126 | 9.2% | 3.0% | |
| Mortgage Recording Tax | 934 | 959 | 1,001 | 1,020 | 86 | 9.2% | 3.0% | |
| Commercial Rent | 848 | 884 | 919 | 955 | 107 | 12.6% | 4.0% | |
| Utility | 382 | 387 | 396 | 409 | 27 | 7.1% | 2.3% | |
| Hotel | 570 | 592 | 599 | 608 | 38 | 6.7% | 2.2% | |
| Cigarette | 42 | 41 | 40 | 39 | (3) | (7.1%) | (2.4%) | |
| All Other | 696 | 696 | 696 | 696 | 0 | 0.0% | 0.0% | |
| Tax Audit Revenue | 850 | 721 | 721 | 721 | (129) | (15.2%) | (5.3%) | |
| City Tax Programs | (87) | (91) | (95) | (98) | (11) | 12.6% | 4.0% | |
| Total Taxes | $56,799 | $59,506 | $62,085 | $64,437 | $7,638 | 13.4% | 4.3% | |
| Miscellaneous Revenue: | ||||||||
| Licenses, Franchises, Etc. | $674 | $663 | $668 | $662 | ($12) | (1.8%) | (0.6%) | |
| Interest Income | 110 | 177 | 241 | 246 | 136 | 123.6% | 30.8% | |
| Charges for Services | 989 | 991 | 991 | 991 | 2 | 0.2% | 0.1% | |
| Water and Sewer Charges | 1,402 | 1,388 | 1,374 | 1,363 | (39) | (2.8%) | (0.9%) | |
| Rental Income | 251 | 250 | 250 | 250 | (1) | (0.4%) | (0.1%) | |
| Fines and Forfeitures | 914 | 905 | 896 | 881 | (33) | (3.6%) | (1.2%) | |
| Miscellaneous | 333 | 537 | 704 | 713 | 380 | 114.1% | 28.9% | |
| Intra-City Revenue | 1,815 | 1,737 | 1,739 | 1,744 | (71) | (3.9%) | (1.3%) | |
| Total Miscellaneous Revenue | $6,488 | $6,648 | $6,863 | $6,850 | $362 | 5.6% | 1.8% | |
| Reserve for Disallowance of Categorical Grants | ($15) | ($15) | ($15) | ($15) | $0 | 0.0% | 0.0% | |
| Less: Intra-City Revenue | ($1,815) | ($1,737) | ($1,739) | ($1,744) | $71 | (3.9%) | (1.3%) | |
| TOTAL CITY-FUNDS | $61,457 | $64,402 | $67,194 | $69,528 | $8,071 | 13.1% | 4.2% | |
| Other Categorical Grants | $880 | $868 | $859 | $856 | ($24) | (2.7%) | (0.9%) | |
| Inter-Fund Agreements | $671 | $664 | $602 | $602 | ($69) | (10.3%) | (3.6%) | |
| Federal Categorical Grants: | ||||||||
| Community Development | $1,010 | $333 | $253 | $235 | ($775) | (76.7%) | (38.5%) | |
| Welfare | 3,553 | 3,306 | 3,323 | 3,330 | (223) | (6.3%) | (2.1%) | |
| Education | 1,789 | 2,037 | 2,042 | 2,044 | 255 | 14.3% | 4.5% | |
| Other | 1,459 | 1,338 | 1,297 | 1,292 | (167) | (11.4%) | (4.0%) | |
| Total Federal Grants | $7,811 | $7,014 | $6,915 | $6,901 | ($910) | (11.7%) | (4.0%) | |
| State Categorical Grants | ||||||||
| Social Services | $1,732 | $1,739 | $1,751 | $1,752 | $20 | 1.2% | 0.4% | |
| Education | 10,683 | 11,108 | 11,554 | 11,879 | 1,196 | 11.2% | 3.6% | |
| Higher Education | 297 | 297 | 297 | 297 | 0 | 0.0% | 0.0% | |
| Department of Health and Mental Hygiene |
548 | 539 | 539 | 523 | (25) | (4.6%) | (1.5%) | |
| Other | 1,159 | 1,189 | 1,230 | 1,276 | 117 | 10.1% | 3.3% | |
| Total State Grants | $14,419 | $14,872 | $15,371 | $15,727 | $1,308 | 9.1% | 2.9% | |
| TOTAL REVENUES | $85,238 | $87,820 | $90,941 | $93,614 | $8,376 | 9.8% | 3.2% | |
Table A2. June 2017 Financial Plan Expenditure Detail
| ($ in thousands) | FY 2018 | FY 2019 | FY 2020 | FY 2021 | Change FYs 2018 – 2021 Dollars Percent |
Annual Percent Change | ||
| Mayoralty | $131,657 | $129,748 | $122,072 | $119,948 | ($11,709) | (8.9%) | (3.1%) | |
| Board of Elections | $140,996 | $95,113 | $96,564 | $94,370 | ($46,626) | (33.1%) | (12.5%) | |
| Campaign Finance Board | $56,661 | $14,019 | $14,019 | $14,019 | ($42,642) | (75.3%) | (37.2%) | |
| Office of the Actuary | $7,251 | $7,354 | $7,354 | $7,354 | $103 | 1.4% | 0.5% | |
| President, Borough of Manhattan | $5,021 | $4,589 | $4,589 | $4,589 | ($432) | (8.6%) | (3.0%) | |
| President, Borough of Bronx | $6,017 | $5,459 | $5,459 | $5,459 | ($558) | (9.3%) | (3.2%) | |
| President, Borough of Brooklyn | $6,690 | $5,702 | $5,702 | $5,702 | ($988) | (14.8%) | (5.2%) | |
| President, Borough of Queens | $5,585 | $4,749 | $4,749 | $4,749 | ($836) | (15.0%) | (5.3%) | |
| President, Borough of Staten Island | $4,555 | $4,248 | $4,248 | $4,248 | ($307) | (6.7%) | (2.3%) | |
| Office of the Comptroller | $105,457 | $105,463 | $105,463 | $105,463 | $6 | 0.0% | 0.0% | |
| Dept. of Emergency Management | $59,114 | $27,304 | $27,238 | $28,154 | ($30,960) | (52.4%) | (21.9%) | |
| Office of Administrative Tax Appeals | $4,946 | $5,063 | $5,063 | $5,063 | $117 | 2.4% | 0.8% | |
| Law Dept. | $206,156 | $202,324 | $203,741 | $203,741 | ($2,415) | (1.2%) | (0.4%) | |
| Dept. of City Planning | $49,507 | $41,814 | $40,273 | $40,273 | ($9,234) | (18.7%) | (6.6%) | |
| Dept. of Investigation | $37,917 | $35,602 | $33,005 | $33,005 | ($4,912) | (13.0%) | (4.5%) | |
| NY Public Library — Research | $28,043 | $27,993 | $27,993 | $27,993 | ($50) | (0.2%) | (0.1%) | |
| New York Public Library | $137,698 | $137,233 | $137,233 | $137,233 | ($465) | (0.3%) | (0.1%) | |
| Brooklyn Public Library | $102,412 | $102,002 | $102,002 | $102,002 | ($410) | (0.4%) | (0.1%) | |
| Queens Borough Public Library | $104,548 | $104,530 | $104,530 | $104,530 | ($18) | (0.0%) | (0.0%) | |
| Dept. of Education | $24,316,669 | $25,672,792 | $26,347,894 | $27,036,562 | $2,719,893 | 11.2% | 3.6% | |
| City University | $1,140,421 | $1,138,486 | $1,146,323 | $1,159,476 | $19,055 | 1.7% | 0.6% | |
| Civilian Complaint Review Board | $16,027 | $16,720 | $16,720 | $16,720 | $693 | 4.3% | 1.4% | |
| Police Dept. | $5,300,590 | $5,278,223 | $5,246,608 | $5,214,679 | ($85,911) | (1.6%) | (0.5%) | |
| Fire Dept. | $2,040,709 | $1,992,454 | $2,011,052 | $2,010,468 | ($30,241) | (1.5%) | (0.5%) | |
| Dept. of Veterans’ Services | $4,418 | $4,494 | $4,494 | $4,494 | $76 | 1.7% | 0.6% | |
| Admin. for Children Services | $3,052,741 | $2,557,072 | $2,571,068 | $2,575,145 | ($477,596) | (15.6%) | (5.5%) | |
| Dept. of Social Services | $9,891,959 | $9,878,028 | $9,939,291 | $9,958,126 | $66,167 | 0.7% | 0.2% | |
| Dept. of Homeless Services | $1,616,376 | $1,645,334 | $1,663,047 | $1,669,746 | $53,370 | 3.3% | 1.1% | |
| Dept. of Correction | $1,444,394 | $1,436,052 | $1,451,703 | $1,462,295 | $17,901 | 1.2% | 0.4% | |
| Board of Correction | $2,836 | $3,003 | $3,003 | $3,003 | $167 | 5.9% | 1.9% | |
| Citywide Pension Contribution | $9,459,386 | $9,758,881 | $9,830,312 | $9,892,604 | $433,218 | 4.6% | 1.5% | |
| Miscellaneous | $10,037,723 | $11,449,020 | $12,290,976 | $13,285,284 | $3,247,561 | 32.4% | 9.8% | |
| Debt Service | $4,326,809 | $4,394,908 | $4,739,855 | $4,925,731 | $598,922 | 13.8% | 4.4% | |
| T.F.A. Debt Service | $2,201,040 | $2,829,930 | $3,121,530 | $3,405,180 | $1,204,140 | 56.1% | 15.7% | |
| FY 2017 BSA and Discretionary Transfers | ($4,169,125) | $0 | $0 | $0 | $4,169,125 | (100.0%) | (100.0%) | |
| Public Advocate | $3,620 | $3,620 | $3,620 | $3,620 | $0 | 0.0% | 0.0% | |
| City Council | $64,077 | $54,200 | $54,200 | $54,200 | ($9,877) | (15.4%) | (5.4%) | |
| City Clerk | $5,714 | $5,564 | $5,564 | $5,564 | ($150) | (2.6%) | (0.9%) | |
| Dept. for the Aging | $365,369 | $342,138 | $348,621 | $349,944 | ($15,425) | (4.2%) | (1.4%) | |
| Dept. of Cultural Affairs | $188,584 | $142,834 | $142,834 | $142,834 | ($45,750) | (24.3%) | (8.8%) | |
| Financial Info. Serv. Agency | $109,319 | $110,938 | $111,581 | $111,581 | $2,262 | 2.1% | 0.7% | |
| Office of Payroll Admin. | $16,316 | $17,008 | $17,008 | $17,008 | $692 | 4.2% | 1.4% | |
| Independent Budget Office | $5,548 | $5,399 | $5,398 | $5,133 | ($415) | (7.5%) | (2.6%) | |
| Equal Employment Practices | $1,108 | $1,187 | $1,187 | $1,187 | $79 | 7.1% | 2.3% | |
| Civil Service Commission | $1,094 | $1,092 | $1,092 | $1,092 | ($2) | (0.2%) | (0.1%) | |
| Landmarks Preservation Commission | $6,288 | $6,276 | $6,267 | $6,287 | ($1) | (0.0%) | (0.0%) | |
| Taxi & Limousine Commission | $57,479 | $60,768 | $59,120 | $59,292 | $1,813 | 3.2% | 1.0% | |
| Commission on Human Rights | $14,759 | $14,137 | $14,137 | $14,137 | ($622) | (4.2%) | (1.4%) | |
| Youth & Community Development | $652,642 | $520,756 | $538,564 | $541,792 | ($110,850) | (17.0%) | (6.0%) | |
| Conflicts of Interest Board | $2,580 | $2,581 | $2,581 | $2,581 | $1 | 0.0% | 0.0% | |
| Office of Collective Bargaining | $2,456 | $2,322 | $2,322 | $2,322 | ($134) | (5.5%) | (1.9%) | |
| Community Boards (All) | $17,581 | $17,406 | $17,406 | $17,406 | ($175) | (1.0%) | (0.3%) | |
| Dept. of Probation | $97,033 | $95,733 | $95,340 | $95,411 | ($1,622) | (1.7%) | (0.6%) | |
| Dept. Small Business Services | $204,028 | $141,853 | $133,495 | $126,887 | ($77,141) | (37.8%) | (14.6%) | |
| Housing Preservation & Development | $1,143,083 | $836,732 | $780,547 | $769,257 | ($373,826) | (32.7%) | (12.4%) | |
| Dept. of Buildings | $184,717 | $164,401 | $165,671 | $158,591 | ($26,126) | (14.1%) | (5.0%) | |
| Dept. of Health & Mental Hygiene | $1,607,279 | $1,604,395 | $1,635,066 | $1,636,733 | $29,454 | 1.8% | 0.6% | |
| NYC Health + Hospitals | $785,969 | $804,664 | $906,782 | $806,167 | $20,198 | 2.6% | 0.8% | |
| Office of Administrative Trials & Hearings | $48,879 | $49,944 | $49,944 | $49,944 | $1,065 | 2.2% | 0.7% | |
| Dept. of Environmental Protection | $1,411,403 | $1,242,792 | $1,221,015 | $1,206,749 | ($204,654) | (14.5%) | (5.1%) | |
| Dept. of Sanitation | $1,668,065 | $1,696,557 | $1,710,227 | $1,707,852 | $39,787 | 2.4% | 0.8% | |
| Business Integrity Commission | $8,734 | $8,611 | $8,611 | $8,611 | ($123) | (1.4%) | (0.5%) | |
| Dept. of Finance | $297,722 | $293,991 | $294,219 | $294,261 | ($3,461) | (1.2%) | (0.4%) | |
| Dept. of Transportation | $964,651 | $965,868 | $921,305 | $923,385 | ($41,266) | (4.3%) | (1.4%) | |
| Dept. of Parks and Recreation | $481,630 | $441,443 | $439,855 | $438,405 | ($43,225) | (9.0%) | (3.1%) | |
| Dept. of Design & Construction | $351,785 | $153,011 | $158,641 | $145,953 | ($205,832) | (58.5%) | (25.4%) | |
| Dept. of Citywide Admin. Services | $467,154 | $416,315 | $416,991 | $418,081 | ($49,073) | (10.5%) | (3.6%) | |
| D.O.I.T.T. | $493,025 | $461,519 | $452,375 | $452,223 | ($40,802) | (8.3%) | (2.8%) | |
| Dept. of Record & Info. Services | $7,771 | $8,455 | $8,455 | $8,455 | $684 | 8.8% | 2.9% | |
| Dept. of Consumer Affairs | $39,577 | $39,035 | $39,035 | $39,035 | ($542) | (1.4%) | (0.5%) | |
| District Attorney – N.Y. | $102,942 | $103,276 | $103,287 | $103,287 | $345 | 0.3% | 0.1% | |
| District Attorney – Bronx | $71,535 | $71,596 | $71,594 | $71,594 | $59 | 0.1% | 0.0% | |
| District Attorney – Kings | $98,017 | $97,434 | $97,424 | $97,424 | ($593) | (0.6%) | (0.2%) | |
| District Attorney –Queens | $63,668 | $63,902 | $63,910 | $63,910 | $242 | 0.4% | 0.1% | |
| District Attorney – Richmond | $14,300 | $14,004 | $14,005 | $14,005 | ($295) | (2.1%) | (0.7%) | |
| Office of Prosec. & Special Narc. | $22,392 | $22,492 | $22,497 | $22,497 | $105 | 0.5% | 0.2% | |
| Public Administrator – N.Y. | $2,863 | $2,818 | $2,818 | $2,818 | ($45) | (1.6%) | (0.5%) | |
| Public Administrator – Bronx | $724 | $704 | $704 | $704 | ($20) | (2.8%) | (0.9%) | |
| Public Administrator – Brooklyn | $852 | $856 | $856 | $856 | $4 | 0.5% | 0.2% | |
| Public Administrator – Queens | $621 | $633 | $633 | $633 | $12 | 1.9% | 0.6% | |
| Public Administrator – Richmond | $525 | $531 | $531 | $531 | $6 | 1.1% | 0.4% | |
| General Reserve | $1,200,000 | $1,000,000 | $1,000,000 | $1,000,000 | ($200,000) | (16.7%) | (5.9%) | |
| Citywide Savings Initiatives | $0 | ($46,281) | ($73,531) | ($98,781) | ($98,781) | N/A | N/A | |
| Energy Adjustment | $0 | $22,099 | $57,776 | $101,321 | $101,321 | N/A | N/A | |
| Lease Adjustment | $0 | $34,636 | $70,311 | $107,056 | $107,056 | N/A | N/A | |
| OTPS Inflation Adjustment | $0 | $55,519 | $111,038 | $166,557 | $166,557 | N/A | N/A | |
| TOTAL EXPENDITURES | $85,238,682 | $91,293,470 | $93,748,102 | $95,943,800 | $10,705,118 | 12.6% | 4.0% | |
[1] Business tax collections through June of FY 2017 are more than $300 million below collections in FY 2016 over the same period.
[2] The reserve for disallowances against categorical grants is a set-aside for potential rejection of City claims for Federal and State categorical grants. The reserve stood at $1.11 billion at the end of FY 2016. A review by the Office of Management and Budget concluded that a lower balance is sufficient leading to the release of $628 million from the reserve.
[3] In addition to netting out the impact of prepayments and additional RHBT deposit, FY 2017 expenditures are also net of adjustments to prior-year payables.
[4] Property tax revenues include State reimbursement to the City for School Tax Relief (STAR) credit.
[5] Projected losses in property tax revenues from this program in the outyears are $91 million in FY 2019, $95 million in FY 2020, and $98 million in FY 2021.