The Comptroller’s Comments on New York City’s FY 2018 Preliminary Budget Report
I. Executive Summary
The New York City economy grew 2.9 percent in 2016, outperforming the nation for the sixth time in the past seven years. Despite the robust economic growth, there are clear signs that the expansion is cooling. Job growth is starting to tail off. The 84,900 new private sector jobs created in 2016, while still strong, represents the slowest annual job growth since 2010. The strong job growth during the recovery belies the fact, however, that many of the new private sector jobs are in low wage industries, which have not experienced the large wage gains seen in higher wage sectors.
More than the usual degree of uncertainty surrounds the forecast for the future of the economy. The Comptroller’s Office anticipates a modest boost to economic activity in 2017 and 2018 as a result of the fiscal stimulus promised by the new administration in Washington. While this stimulus – including personal and corporate tax cuts, and higher levels of spending on defense and infrastructure – has not yet been passed, a Republican controlled House and Senate should make passage in some form likely. Given that the economy is operating near full employment, however, the stimulus effect is likely to be short-lived, and in the longer-run, growth will slow, possibly exacerbated by restrictive trade and immigration policies. For now, we do not see the economy turning negative over our forecast horizon, but any change from our assumptions could translate into risks to our forecast.
The City’s Preliminary FY 2018 Budget and Financial Plan reflects the expectation of a slowing economy. The FY 2018 Preliminary Budget totals $84.67 billion. While total-funds revenues are $99 million above the November Plan, this increase is driven by an upward revision of $369 million in Federal and State categorical grants. Tax revenues and non-tax City-funds revenues are lower than projected in November. Non-property tax revenues, which are more economically sensitive than property tax revenues, are $544 million below the November projection. This is partially offset by increases to the property tax and tax audit revenue estimates which results in a net decrease of $183 million to tax revenues. Non-property tax revenues, excluding tax audit revenues, are on net, lower in each year of the Financial Plan period than the November Plan projections. Over the Plan period, total tax revenues are projected to grow by $10.0 billion – an average annual growth rate of 4.3 percent. Consistent with the maturity of this business cycle, the projection is lower than the 5.9 percent average annual growth realized in the prior years of the economic expansion (2009-2016).
City-funds expenditures in the FY 2018 Preliminary Budget total $61.60 billion, a decrease of $2.51 billion from the November Plan estimate. This reduction results from an increase of $2.62 billion in the prepayment of FY 2018 debt service and expense reduction of $573 million from a new round of Citywide Savings Program (CSP), partially offset by agency spending increases of $427 million and a $250 million Capital Stabilization Reserve.[1] The net reduction of $2.51 billion in City-funds expenditures help close the $2.241 billion gap projected in November and fund a $279 million decrease in City-funds revenues.
With the current round of CSP, the Financial Plan now assumes budget relief from CSP initiatives of $3.5 billion over FY 2017 through FY 2020.[2] FY 2017 and FY 2018 account for $2.1 billion of the savings, and rely on re-estimates, funding shifts and debt service for more than 90 percent of the savings; agency efficiency initiatives account for only 7 percent of the savings. However, over the FY 2017 to FY 2020 period, efficiency initiatives account for 11 percent of the savings. This is because, in general, efficiency initiatives tend to have recurring benefits. For example, among the 44 efficiency initiatives that begin in FY 2017, 39 of them (about 90 percent), totaling $24 million, are estimated to generate recurring savings of $35 million or more in each of FY 2018 through FY 2020. In contrast, less than half of the remaining 104 initiatives that begin in FY 2017 are expected to generate recurring savings in the outyears.
The Comptroller’s Office’s analysis of the Financial Plan shows a modest budget surplus of $45 million, after prepayments, in FY 2017, and net risks ranging from $141 million in FY 2018 to $669 million in FY 2021. The risks stem primarily from the Comptroller’s Office’s estimates of larger expenditures than assumed in the Plan. The Comptroller’s Office estimates that overall, expenditures could be above Plan projections by $76 million in FY 2017 and $542 million in each of FY 2018 through FY 2021. The higher expenditure estimates result primarily from projections of higher overtime cost and additional expenses for the Department of Homeless Services and Health + Hospitals. The expenditure risk in FY 2017 is mitigated by the Comptroller’s Office’s expectation that the $300 million in the General Reserve will not be needed for budget balance.
Offsetting some of the risks are the Comptroller’s higher tax revenue projections. Like the Office of Management and Budget, the Comptroller’s Office projects average annual growth of 4.3 percent, but on a somewhat different trajectory over the Plan period, consistent with our economic forecast, with higher forecasts for the economically-sensitive personal income, sales, and real estate-related taxes in the short-run, followed by lower projections starting in the later part of the outyears. This difference in growth rates between the Comptroller’s Office and OMB is mitigated by our projection of consistently faster growth in the real property tax, and a somewhat more optimistic outlook on business taxes, largely attributable to our assumption of a federal deregulation agenda boosting corporate profits. Overall, the Comptroller’s Office expects tax revenues to be above Plan projections by $104 million in FY 2017, $367 million in FY 2018, $242 million in FY 2019, $247 million in FY 2020, and $206 million in FY 2021.
Altogether, the risks and offsets identified by the Comptroller’s Office result in additional resources of $45 million in FY 2017 and gaps of $141 million in FY 2018, $3.69 billion in FY 2019, $3.03 billion in FY 2020, and $2.46 billion in FY 2021. The cumulative gaps projected by the Comptroller’s Office over the five years of the Plan are $1.66 billion more than the Plan projections.
With the current climate of economic uncertainty regarding Federal policies and the threat of cuts in Federal funding, the larger outyear gaps are a cause of concern. Now, more than ever, it is essential that we have a budget cushion that will allow the City to weather a slowdown in the economy or detrimental impact of Federal policies on the budget. The current Financial Plan assumptions indicate that the City will begin the next fiscal year with a projected cushion of $8.6 billion, or 10 percent of adjusted expenditures. The Mayor has indicated that he will seek another $500 million in savings in the Executive Budget. This is a step in the right direction but the City will need to do more to build the cushion to help weather an economic slowdown. The City can do this by adding to the accumulated surplus that was rolled into the current fiscal year and to its reserves. As it stands right now, the FY 2017 Budget Stabilization Account (BSA) of $3.06 billion in the Financial Plan indicates that the City is using $983 million of the $4.04 billion accumulated surplus that was rolled into the current fiscal year. We expect the BSA to increase over the next two plans.
Table 1. FY 2017 – FY 2021 Financial Plan
($ in millions)
| Changes FYs 2017 – 2021 |
|||||||
| FY 2017 | FY 2018 | FY 2019 | FY 2020 | FY 2021 | Dollar | Percent | |
| Revenues | |||||||
| Taxes: | |||||||
| General Property Tax | $24,400 | $25,831 | $27,492 | $28,816 | $30,125 | $5,725 | 23.5% |
| Other Taxes | $29,442 | $30,354 | $31,512 | $32,881 | $34,012 | $4,570 | 15.5% |
| Tax Audit Revenues | $1,041 | $850 | $721 | $721 | $721 | ($320) | (30.7%) |
| Subtotal: Taxes | $54,883 | $57,035 | $59,725 | $62,418 | $64,858 | $9,975 | 18.2% |
| Miscellaneous Revenues | $6,835 | $6,362 | $6,602 | $6,804 | $6,807 | ($28) | (0.4%) |
| Unrestricted Intergovernmental Aid | $57 | $0 | $0 | $0 | $0 | ($57) | (100.0%) |
| Less: Intra-City Revenues | ($2,039) | ($1,786) | ($1,781) | ($1,787) | ($1,787) | $252 | (12.4%) |
| Disallowances Against Categorical Grants | $200 | ($15) | ($15) | ($15) | ($15) | ($215) | (107.5%) |
| Subtotal: City-Funds | $59,936 | $61,596 | $64,531 | $67,420 | $69,863 | $9,927 | 16.6% |
| Other Categorical Grants | $980 | $856 | $847 | $837 | $833 | ($147) | (15.0%) |
| Inter-Fund Revenues | $655 | $658 | $658 | $595 | $593 | ($62) | (9.5%) |
| Federal Categorical Grants | $8,826 | $7,012 | $6,811 | $6,809 | $6,781 | ($2,045) | (23.2%) |
| State Categorical Grants | $14,417 | $14,546 | $15,008 | $15,404 | $15,718 | $1,301 | 9.0% |
| Total Revenues | $84,814 | $84,668 | $87,855 | $91,065 | $93,788 | $8,974 | 10.6% |
| Expenditures | |||||||
| Personal Service | |||||||
| Salaries and Wages | $25,829 | $27,316 | $28,796 | $29,634 | $30,222 | $4,393 | 17.0% |
| Pensions | $9,413 | $9,819 | $10,100 | $10,152 | $10,170 | $757 | 8.0% |
| Fringe Benefits | $9,606 | $10,258 | $10,981 | $11,920 | $12,701 | $3,095 | 32.2% |
| Subtotal-PS | $44,848 | $47,393 | $49,877 | $51,706 | $53,093 | $8,245 | 18.4% |
| Other Than Personal Service | |||||||
| Medical Assistance | $5,915 | $5,915 | $5,915 | $5,915 | $5,915 | $0 | 0.0% |
| Public Assistance | $1,584 | $1,594 | $1,605 | $1,617 | $1,617 | $33 | 2.1% |
| All Other | $28,801 | $26,776 | $27,001 | $26,914 | $27,121 | ($1,680) | (5.8%) |
| Subtotal-OTPS | $36,300 | $34,285 | $34,521 | $34,446 | $34,653 | ($1,647) | (4.5%) |
| Debt Service | |||||||
| Principal | $2,175 | $2,216 | $2,186 | $2,319 | $2,271 | $96 | 4.4% |
| Interest & Offsets | $2,026 | $2,141 | $2,267 | $2,514 | $2,721 | $695 | 34.3% |
| Subtotal Debt Service | $4,201 | $4,357 | $4,453 | $4,833 | $4,992 | $791 | 18.8% |
| FY 2016 BSA & Discretionary Transfers | ($4,038) | $0 | $0 | $0 | $0 | $4,038 | (100.0%) |
| FY 2017 BSA | $3,055 | ($3,055) | $0 | $0 | $0 | ($3,055) | (100.0%) |
| TFA Debt Service | |||||||
| Principal | $829 | $997 | $1,304 | $1,312 | $1,355 | $526 | 63.4% |
| Interest & Offsets | $1,357 | $1,228 | $1,544 | $1,815 | $2,026 | $668 | 49.2% |
| Subtotal TFA | $2,186 | $2,225 | $2,848 | $3,127 | $3,381 | $1,194 | 54.6% |
| Capital Stabilization Reserve | $0 | $250 | $250 | $250 | $250 | $250 | NA |
| General Reserve | $300 | $1,000 | $1,000 | $1,000 | $1,000 | $700 | 233.3% |
| $86,853 | $86,454 | $92,949 | $95,362 | $97,368 | $10,516 | 12.1% | |
| Less: Intra-City Expenses | ($2,039) | ($1,786) | ($1,781) | ($1,787) | ($1,787) | $252 | (12.4%) |
| Total Expenditures | $84,814 | $84,668 | $91,168 | $93,575 | $95,581 | $10,768 | 12.7% |
| Gap To Be Closed | $0 | $0 | ($3,313) | ($2,510) | ($1,793) | ($1,793) | NA |
Table 2. Plan-to-Plan Changes January 2017 Plan vs. November 2016 Plan
($ in millions)
| FY 2017 | FY 2018 | FY 2019 | FY 2020 | |
| Revenues | ||||
| Taxes: | ||||
| General Property Tax | $172 | $227 | $387 | $449 |
| Other Taxes | ($107) | ($544) | ($384) | ($125) |
| Tax Audit Revenues | $300 | $134 | $5 | $5 |
| Subtotal: Taxes | $365 | ($183) | $8 | $329 |
| Miscellaneous Revenues | $211 | ($80) | ($93) | $6 |
| Unrestricted Intergovernmental Aid | $57 | $0 | $0 | $0 |
| Less: Intra-City Revenues | ($78) | ($8) | ($9) | ($8) |
| Disallowances Against Categorical Grants | $215 | $0 | $0 | $0 |
| Subtotal: City-Funds | $770 | ($271) | ($94) | $327 |
| Other Categorical Grants | $8 | $0 | $0 | ($1) |
| Inter-Fund Revenues | $0 | $1 | $63 | $1 |
| Federal Categorical Grants | $292 | $213 | $173 | $171 |
| State Categorical Grants | $287 | $156 | $148 | $58 |
| Total Revenues | $1,357 | $99 | $290 | $556 |
| Expenditures | ||||
| Personal Service | ||||
| Salaries and Wages | $14 | $89 | $86 | $90 |
| Pensions | ($9) | ($11) | ($10) | ($9) |
| Fringe Benefits | ($30) | $36 | $91 | $82 |
| Subtotal-PS | ($25) | $114 | $167 | $163 |
| Other Than Personal Service | ||||
| Medical Assistance | $0 | $0 | $0 | $0 |
| Public Assistance | $0 | $0 | $0 | $1 |
| All Other | $129 | $453 | $389 | $356 |
| Subtotal-OTPS | $129 | $453 | $389 | $357 |
| Debt Service | ||||
| Principal | $0 | $0 | $47 | $49 |
| Interest & Offsets | ($48) | ($86) | ($132) | ($128) |
| Subtotal Debt Service | ($48) | ($86) | ($85) | ($79) |
| FY 2016 BSA and Discretionary Transfers | $0 | $0 | $0 | $0 |
| FY 2017 BSA | $2,616 | ($2,616) | $0 | $0 |
| TFA | ||||
| Principal | $0 | ($0) | ($0) | ($0) |
| Interest & Offsets | ($37) | ($249) | $1 | $7 |
| Subtotal TFA | ($37) | ($249) | $1 | $7 |
| Capital Stabilization Reserve | ($500) | $250 | $250 | $250 |
| General Reserve | ($700) | $0 | $0 | $0 |
| $1,435 | ($2,134) | $723 | $698 | |
| Less: Intra-City Expenses | ($78) | ($8) | ($9) | ($8) |
| Total Expenditures | $1,357 | ($2,142) | $714 | $690 |
| Gap To Be Closed | $0 | $2,241 | ($424) | ($134) |
Table 3. Plan-to-Plan Changes January 2017 Plan vs. June 2016 Plan
($ in millions)
| FY 2017 | FY 2018 | FY 2019 | FY 2020 | |
| Revenues | ||||
| Taxes: | ||||
| General Property Tax | $172 | $227 | $387 | $449 |
| Other Taxes | ($259) | ($544) | ($384) | ($125) |
| Tax Audit Revenues | $327 | $136 | $7 | $7 |
| Subtotal: Taxes | $240 | ($181) | $10 | $331 |
| Miscellaneous Revenues | $428 | ($72) | ($76) | $27 |
| Unrestricted Intergovernmental Aid | $57 | $0 | $0 | $0 |
| Less: Intra-City Revenues | ($275) | ($22) | ($22) | ($22) |
| Disallowances Against Categorical Grants | $215 | $0 | $0 | $0 |
| Subtotal: City-Funds | $665 | ($275) | ($88) | $336 |
| Other Categorical Grants | $127 | $19 | $12 | $6 |
| Inter-Fund Revenues | $9 | $14 | $76 | $14 |
| Federal Categorical Grants | $1,153 | $201 | $131 | $191 |
| State Categorical Grants | $744 | $253 | $245 | $155 |
| Total Revenues | $2,698 | $212 | $376 | $702 |
| Expenditures | ||||
| Personal Service | ||||
| Salaries and Wages | $84 | $103 | $47 | $52 |
| Pensions | ($9) | $109 | $248 | $369 |
| Fringe Benefits | ($73) | $4 | $49 | $41 |
| Subtotal-PS | $2 | $216 | $344 | $462 |
| Other Than Personal Service | ||||
| Medical Assistance | $0 | $0 | $0 | $0 |
| Public Assistance | $0 | ($8) | ($8) | ($7) |
| All Other | $1,351 | $383 | $335 | $358 |
| Subtotal-OTPS | $1,351 | $375 | $327 | $351 |
| Debt Service | ||||
| Principal | $0 | $0 | $47 | $49 |
| Interest & Offsets | ($155) | ($103) | ($149) | ($157) |
| Subtotal Debt Service | ($155) | ($103) | ($102) | ($108) |
| FY 2016 BSA and Discretionary Transfers | ($44) | $0 | $0 | $0 |
| FY 2017 BSA | $3,055 | ($3,055) | $0 | $0 |
| TFA | ||||
| Principal | $0 | $26 | $52 | $53 |
| Interest & Offsets | ($37) | ($290) | ($105) | ($100) |
| Subtotal TFA | ($37) | ($264) | ($53) | ($47) |
| Capital Stabilization Reserve | ($500) | $250 | $250 | $250 |
| General Reserve | ($700) | $0 | $0 | $0 |
| $2,973 | ($2,582) | $766 | $908 | |
| Less: Intra-City Expenses | ($275) | ($22) | ($22) | ($22) |
| Total Expenditures | $2,698 | ($2,604) | $744 | $886 |
| Gap To Be Closed | $0 | $2,816 | ($368) | ($184) |
Table 4. Risks and Offsets to the January Financial Plan
($ in millions, positive numbers decrease the gap and negative numbers increase the gap
| FY 2017 | FY 2018 | FY 2019 | FY 2020 | FY 2021 | |
| City Stated Gap | $0 | $0 | ($3,313) | ($2,510) | ($1,793) |
| Tax Revenues | |||||
| Property Tax | $0 | $34 | $285 | $572 | $673 |
| Personal Income Tax | 48 | 258 | 90 | (105) | (157) |
| Business Taxes | (56) | 76 | 95 | 123 | 68 |
| Sales Tax | 50 | 68 | 31 | (65) | (106) |
| State Sales Tax Intercept | (50) | (200) | (150) | 0 | 0 |
| Real Estate-Related Taxes | 112 | 131 | (109) | (278) | (272) |
| Subtotal Tax Revenues | $104 | $367 | $242 | $247 | $206 |
| Non-Tax Revenues | |||||
| ECB Fines | $12 | $24 | $24 | $24 | $24 |
| Late Filing/No Permit Penalties | 5 | 5 | 5 | 5 | 5 |
| Motor Vehicle Fines | 0 | 5 | 5 | 5 | 5 |
| Taxi Medallion Sales | 0 | 0 | (107) | (257) | (367) |
| Subtotal Non-Tax Revenues | $17 | $34 | ($73) | ($223) | ($333) |
| Total Revenues | $121 | $401 | $169 | $24 | ($127) |
| Expenditures | |||||
| Overtime | ($276) | ($215) | ($215) | ($215) | ($215) |
| DOE Medicaid Reimbursement | (20) | (70) | (70) | (70) | (70) |
| Homeless Shelters | 0 | (132) | (132) | (132) | (132) |
| NYC Health + Hospitals | (165) | (165) | (165) | (165) | (165) |
| Public Assistance | 15 | 10 | 10 | 10 | 10 |
| Debt Service Savings | 70 | 30 | 30 | 30 | 30 |
| General Reserve | 300 | 0 | 0 | 0 | 0 |
| Subtotal | ($76) | ($542) | ($542) | ($542) | ($542) |
| Total (Risks)/Offsets | $45 | ($141) | ($373) | ($518) | ($669) |
| Restated (Gap)/Surplus | $45 | ($141) | ($3,686) | ($3,028) | ($2,462) |
II. The State of The City’s Economy
The U.S. economy ended 2016 on a weak note. The new federal administration’s anticipated agenda, which includes new fiscal stimulus and broad deregulation, is expected to provide a temporary boost to economic growth in 2017 and 2018.
However, higher short-term economic growth is likely to raise the inflation rate and lead to higher interest rates. Economic growth is sensitive to higher interest rates and the result will be for growth to tail off from 2019 to 2021. The risks to the economy include the negative impact of potential U.S. protectionist policies and the strong dollar.
We expect the City’s economy to mirror the national trend with an increase in growth in 2018 tailing off afterward.
A. U.S. ECONOMIC OUTLOOK
The U.S. economy has been locked in a pattern of slow and steady growth since the end of the Great Recession. Economic growth, as measured by the change in real gross domestic product (GDP), has been averaging 1.8 percent per year since 2001. Given the current economic momentum, this growth pattern was expected to continue in 2017 and 2018. However, this pattern is now expected to change because of federal tax cuts, spending increases for defense and infrastructure, reduction in regulation, and possible restrictions on trade and immigration. With Republicans holding both the Senate and the House, there is a high likelihood that President Trump could do most of what he has proposed.
In general, these policies are expected to boost economic growth in the U.S. through 2018. However, there is uncertainty about the timing, size and composition of those economic policy initiatives as well as how those policies might affect aggregate demand and supply.
Increasing output, in 2017 and 2018, is expected to be fueled by increases in consumer spending, private investment, and government expenditure. Consumer spending is expected to increase as a result of a tighter job market, higher wages, and tax cuts. Private investment is expected to get a lift from corporate tax cuts and deregulation. Government expenditure is expected to increase because of defense and infrastructure spending. The main risks to the economy are potential U.S. protectionist policies and a stronger dollar which hurts exports. Other risks include a possible sharp rise in interest rates, low productivity growth, and geopolitical risks such as a Chinese recession or a breakup of the Eurozone.
The U.S. economy grew at an annual rate of 1.9 percent in the fourth quarter of 2016, the unemployment rate fell to 4.7 percent in December, and average hourly earnings were 2.7 percent higher in the fourth quarter of 2016 than they were a year earlier. Payroll jobs have been growing for the past 76 months, the longest uninterrupted growth since 1939, adding an average of 200,000 jobs per month since October 2010.
Consumer spending, which makes up about 70 percent of the economy, grew 2.7 percent in 2016, above the 2.3 percent average for the past seven years. This growth is expected to continue to be fueled by a strong labor market, increases in wages, the wealth effect from rises in the stock market and home prices, and proposed tax cuts by President Trump and Congressional Republicans.
Private investment is expected to increase in 2017 and 2018 despite higher interest rates as a result of corporate tax cuts and deregulation proposed by President Trump. After falling 5.6 percent in the first half of 2016, private investment recovered to grow 6.9 percent in the second half. Residential investment, which grew 4.9 percent in 2016, is expected to continue growing in 2017 and 2018. Increases in investment in equipment and intellectual property are expected to continue. Net exports, which is exports minus imports, are expected to have a negative impact on GDP growth. Imports grew faster than exports, 1.1 percent compared to 0.4 percent, in 2016. Going forward, a strong dollar would raise the price of U.S. exports and widen the trade deficit reducing GDP growth.
Government expenditures grew 0.9 percent in 2016. It was the state and local government sectors that contributed the most to the GDP growth. President Trump’s promise to increase defense and infrastructure spending could boost government expenditure going forward depending, in part, on congressional sensitivity to deficit spending.
U.S. jobs grew 1.7 percent and added an average of about 190,000 jobs per month in 2016. U.S. job growth is expected to continue but at a slower pace. The slack in the labor market is expected to disappear in the next two years, absorbing most of the roughly 1.1 million increase since 2007 of individuals who are not in the labor force but want a job. A tighter labor market will lead to increasing wages. The employee cost index, which measures the average cost of an hour of labor, including wages, salaries, and benefits, rose 2.2 percent in 4Q16 over 4Q15. Average hourly earnings of all private workers rose 2.5 percent in 2016, the highest increase since 2009.
Increases in employee compensation can be inflationary. The inflation rate, as measured by the consumer price index for all urban consumers, was 1.3 percent in 2016, higher than the 0.1 percent registered in 2015. The inflation rate was suppressed by a decline in energy prices which also lowered transportation prices. The core inflation rate, which includes all items less food and energy, was 2.2 percent in 2016, the highest since 2008 and very close to the 2 percent target set by the Federal Reserve to support stability in prices and maximum employment.
The higher inflation rate should help the Federal Reserve with its interest-rate normalization program. The Fed projected in December 2016 that it would raise rates three times in 2017. However, the uncertainty about President Trump’s fiscal policies and the absence of persistent wage inflation so far could make that monetary policy action less certain.
In addition to rising short-term rates, long-term rates, as measured by the yield on 10-year Treasury notes, have increased since last year and have caused concern for the housing market. Rising interest rates have pushed mortgage rates higher. Higher mortgage rates lower the refinancing volume and sales activity, but do not necessarily lower home prices.[3] Home prices are sensitive to household income which is expected to rise.
B. NEW YORK CITY’S ECONOMIC CONDITION AND OUTLOOK
The City’s economic growth is expected to slow a bit in 2017. As a result of the implementation of some of the fiscal stimuli proposed by the President, the City’s economy is expected to pick up slightly in 2018. Afterwards growth in the City’s economy is expected to tail off as a result of rising interest rates from increasing demand for investment, anti-inflationary monetary policy actions by the Fed, and slower job growth as a result of pressure on the labor force. That said, the City’s economy is expected to outpace the national economy again in both 2017 and 2018.
New York City’s economy grew 2.9 percent in 2016, outperforming the nation for the sixth time in the past seven years. The City added 84,900 new private-sector jobs in 2016. As strong as that was, it was the smallest gain since 2010. The private sector had been adding more than 90,000 jobs annually for the past seven years, the strongest pace of job growth since 1970. Job growth in the City was 2.1 percent and private-sector jobs grew 2.3 percent in 2016 which were higher than the nation’s 1.7 percent and 1.9 percent, respectively (Chart 1).
Chart 1. NYC and U.S. Payroll Jobs, Percent Change, 2016 over 2015
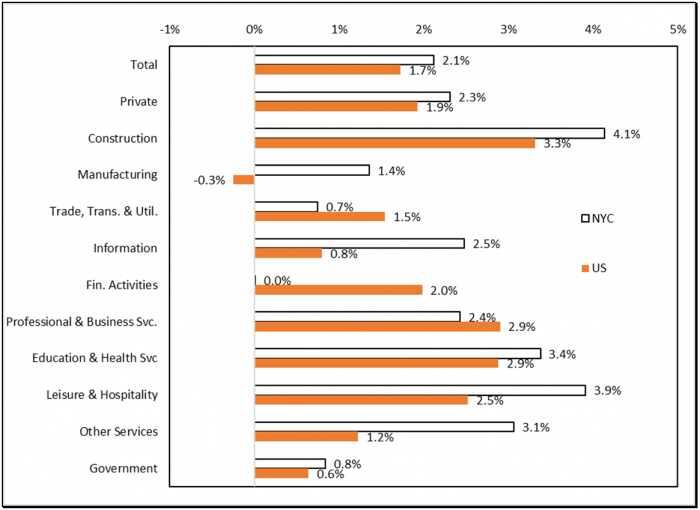
SOURCE: NYS Department of Labor and Bureau of Labor Statistics.
Note: Jobs are based on average of monthly data.
The biggest job gains were in education and health services, which added 29,400 jobs: 10,000 were in educational services and 19,400 were in health care and social assistance. Other job growth included:
- Professional and business services added 17,000 jobs of which 8,900 were in professional services and 7,700 were in administration.
- Leisure and hospitality added 16,600 jobs, most of which (12,200) were in bars and restaurants, that are generally low-wage.
- Construction and other services which includes personal and laundry services, each added 5,700 jobs.
- The information sector added 4,700 jobs.
- Government added 4,600 jobs.
- Financial activities added only 100 jobs, but the securities industry added 1,000 in 2016; both were the smallest gains since 2013.
- Trade, transportation and utilities added 4,700 jobs.
- Retail trade lost 3,700 jobs, the first decline since 2009.
- Wholesale trade gained 4,700 jobs, the biggest gain since 1990.
- Transportation and utilities added 3,700 jobs.
- Manufacturing gained 1,100 jobs.
Despite the City’s impressive economic expansion, job growth has been disappointing for two reasons: poor job composition and unequal wage gains. First, the composition of jobs has been deteriorating. Most of the jobs continue to be in low-wage sectors like health care and social services. In 2016, of the 85,000 new private-sector jobs, 41,000 or 49 percent were in low-wage industries, 30,000 or 35 percent were in the medium-wage industries, and 14,000 or 16 percent were in high-wage industries.
Compared with the previous peak in private-sector jobs in 2008, the shares of high and medium wage jobs have declined, while the share of low-wage jobs has increased. The private-sector share of high, medium, and low wage jobs are shown in Chart 2. Low-wage jobs pay less than $60,000 annually, medium-wage jobs pay $60,000 to $119,000 annually, and high-wage jobs pay more than $119,000 annually. In general, the average salary of an employee in a low-wage sector was about $42,000 annually, for a medium-wage sector was about $75,000 annually, and for a high-wage sector was about $187,000 as of 2015.
Chart 2. NYC Payroll Jobs Composition, Percent of Total Private, 2008 vs. 2016
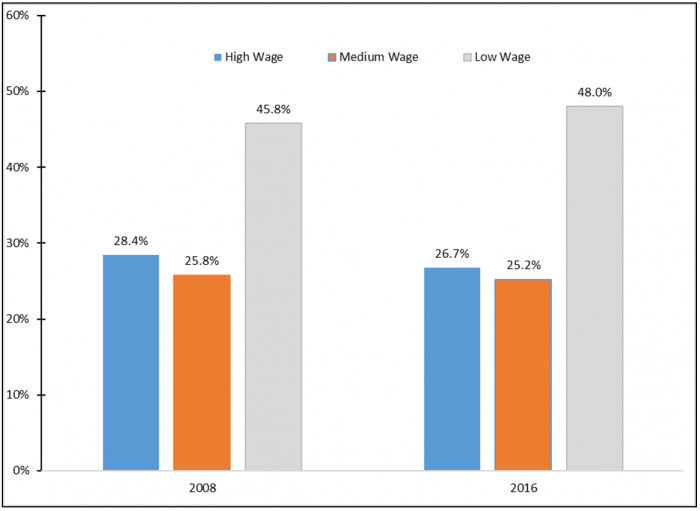
SOURCE: NYS Department of Labor.
Additionally, the wage gap between low, medium, and high earners continues to be large as real average wage rates increased the most in the high-wage sector followed by the medium-wage sector, but did not grow at all in the low-wage sector. Between 2009 and 2015, real average salaries for the high-wage sector grew 9.3 percent; for the medium-wage sector 7.4 percent; and remained unchanged for the low-wage sector.
C. Forecast
Table 5 shows the Comptroller’s and the Mayor’s forecast of five economic indicators for 2017 to 2021. There are some differences in the two forecasts. The Comptroller’s forecast projects a stronger impact of federal fiscal policy than the Mayor’s, leading to higher GCP and employment growth in the short-term. However, the Comptroller’s forecast is for a large share of those jobs to be in the lower wage sectors, which has been the case during the current expansion, and hence wage rate growth will be lower. It is important to note that there are significant assumptions being made as to the timing of implementation and the extent of the policy changes being proposed by the Congress and the new Administration in Washington. Any deviation from these assumptions may have an impact on the forecast.
Table 5. Selected NYC Economic Indicators, Annual Averages, Comptroller and Mayor’s Forecasts, 2017-2021
| Selected NYC Economic Indicators, Annual Averages | ||||||
| 2017 | 2018 | 2019 | 2020 | 2021 | ||
| Real GCP, (2009 $), | Comptroller | 2.4 | 2.5 | 2.0 | 1.6 | 1.6 |
| % Change | Mayor | 1.8 | 1.7 | 1.4 | 1.6 | 1.8 |
| Payroll Jobs, | Comptroller | 61 | 51 | 33 | 24 | 29 |
| Change in Thousands | Mayor | 55 | 37 | 34 | 32 | 30 |
| Inflation Rate | Comptroller | 2.4 | 2.7 | 2.6 | 2.4 | 2.4 |
| Percent | Mayor | 2.5 | 2.4 | 2.5 | 2.7 | 2.6 |
| Wage-Rate Growth, | Comptroller | 2.9 | 3.2 | 2.9 | 2.6 | 2.4 |
| Percent | Mayor | 3.2 | 3.9 | 3.7 | 3.8 | 4.0 |
| Unemployment Rate, | Comptroller | 5.0 | 5.4 | 5.9 | 6.1 | 5.9 |
| Percent | Mayor | NA | NA | NA | NA | NA |
| Selected U.S. Economic Indicators, Annual Averages | ||||||
| 2017 | 2018 | 2019 | 2020 | 2021 | ||
| Real GDP, (2009 $), | Comptroller | 2.3 | 2.6 | 2.0 | 1.5 | 1.6 |
| % Change | Mayor | 2.3 | 2.6 | 2.4 | 2.1 | 2.2 |
| Payroll Jobs, | Comptroller | 1.9 | 1.9 | 1.5 | 1.1 | 0.8 |
| Change in Millions | Mayor | 1.8 | 1.8 | 1.8 | 1.4 | 1.0 |
| Inflation Rate | Comptroller | 2.2 | 2.4 | 2.4 | 2.2 | 2.2 |
| Percent | Mayor | 2.5 | 2.4 | 2.5 | 2.7 | 2.6 |
| Fed Funds Rate, | Comptroller | 1.0 | 1.6 | 2.4 | 3.2 | 3.0 |
| Percent | Mayor | 0.9 | 1.7 | 2.6 | 3.0 | 3.0 |
| 10-Year Treasury Notes, | Comptroller | 2.7 | 3.3 | 3.7 | 4.0 | 4.0 |
| Percent | Mayor | 2.8 | 3.4 | 3.9 | 4.1 | 4.1 |
Source: Comptroller=forecast by the NYC Comptroller’s Office. GCP=Gross City Product. The NYC Office of Management and Budget in the January 2017 Financial Plan. NA=not available.
III. The FY 2018 Preliminary Budget
The City’s FY 2018 Preliminary Budget, released on January 24th, shows a balanced budget of $84.7 billion. Revenues in the Preliminary Budget are $99 million higher than projected in the November Plan, reflecting increases of $213 million and $156 million in Federal and State categorical grants, respectively, offset by a net decrease of $271 million in City-funds revenues.[4] Expenditures are $2.1 billion lower than estimated in November, driven by a reduction of $2.5 billion in City-funds expenditures partially offset by an increase of $369 million in expenditures which are supported by the above mentioned increase in Federal and State categorical grants.
More than half the increase in Federal aid is for an additional $117 million for homeless shelter operations to accommodate the surge in the homeless population. Another $54 million reflects funding shifts in the January 2017 Financial Plan’s Citywide Savings Program (CSP) for expenditures currently supported by City-funds revenues.
Similar to the increase in Federal grants, the additional State grants reflect funding shift initiatives in the Citywide Savings Program and increased funding for homeless shelter operations. Funding shifts account for $95 million of the increase while State support for homeless shelter operations was increased by $15 million.
The reduction in City-funds expenditures is supported by a $2.6 billion increase in the prepayment of FY 2018 debt service in FY 2017. The increase brings the total prepayments in the January Plan to $3.06 billion, $983 million less than the prepayments in FY 2016. As Table 6 shows, the increased prepayments and a new round of Citywide Savings Program add $3.2 billion of additional resources in the FY 2018 Preliminary Budget. Most of the additional resources are used to close a $2.2 billion gap projected in the November Plan. The remainder are used to support a downward revision of $279 million in City-funds revenues, $427 million in additional agency expenses, and a $250 million Capital Stabilization Reserve.
Table 6. Changes to the FY 2018 City-Funds Estimates
($ in millions)
| November Gap | ($2,241) |
| Additional Resources | |
| Prepayments | $2,616 |
| Citywide Savings Program | 581 |
| Total Resources | $3,197 |
| Additional Uses | |
| Revenues | ($279) |
| Agency Expenses | (427) |
| Capital Stabilization Reserve | (250) |
| Total Uses | ($956) |
| Net Change | $2,241 |
| January Gap | $0 |
More than two-thirds of the revenue reduction is due to downward revisions to tax revenues. Non-property tax revenue estimates were lowered by $544 million. This reduction is partially offset by increases of $227 million and $134 million to the property tax and tax audit revenue projections, respectively. The reduction in non-tax revenues stems mainly from the delay of proposed sale of taxi medallions in FYs 2018 through FY 2022 by a year to FYs 2019 through 2023.
Increases of $153 million in Department of Homeless Services (DHS), $54 million to the Department of Correction (DOC) and $67 million to the Department Education (DOE) account for close to two-thirds of the additional agency spending.[5] The increase in DHS spending is due primarily to an additional $123 million for shelter operations and $20 million for shelter security. DOC’s increase reflects mainly an upward revision of $52 million to its overtime budget. The additional DOE spending includes $16 million to upgrade the Special Education Student Information System and $14 million to expand the Summer in the City program.
Citywide Savings Program
The January 2017 Financial Plan contains another round of Citywide Savings Program that is expected to provide budget relief totaling $515 million in FY 2017, $581 million in FY 2018, $331 million in FY 2019, $326 million in FY 2020, and $307 million in FY 2021. The combined November and January CSP is expected to provide budget relief totaling $3.5 billion over FYs 2017 through 2020.[6]
FYs 2017 and 2018 CSPs account for $2.1 billion of the budget relief over the Plan period. As in previous CSP, efficiency and productivity initiatives account for only a small portion of the total savings. As shown in Chart 3, efficiency and productivity initiatives account for only 7 percent of the savings. Re-estimates, funding shifts and debt service account for over 90 percent of the savings.
Chart 3. Combined FY 2017 and FY 2018 Citywide Savings Program
($ in millions)
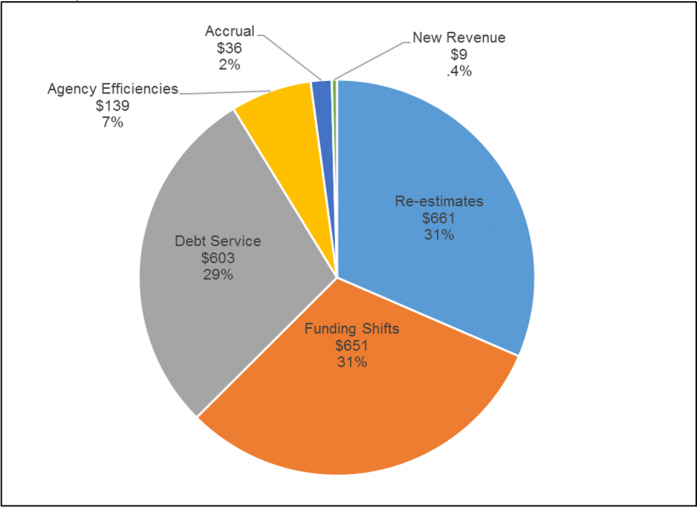
Of the 44 FY 2017 efficiency/productivity initiatives, 39 (about 90 percent) of them, totaling $24 million, are estimated to generate recurring savings of at least $35 million in each of FYs 2018 through 2020.[7] In contrast, less than half of the remaining 104 initiatives are expected to generate recurring savings in the outyears. As such, the City should strive to increase the share of agency efficiency initiatives in future savings programs as these initiatives not only produce real savings but also are generally recurring in nature.
Risks and Offsets
As Table 7 shows, the Comptroller’s Office has identified net additional resources of $45 million in FY 2017 driven by the Office’s higher revenue projections and assumption that the General Reserve will not be needed for FY 2017 budget balance. The Comptroller’s Office projects that revenues will be $121 million above the Plan estimate. While the Comptroller’s Office also projects that FY 2017 expenditures would be above Plan estimates, the higher revenue forecast more than offsets the net risk to the Plan’s FY 2017 expenditure estimates.
Table 7. Risks and Offsets to the January Financial Plan
($ in millions, positive numbers decrease the gap and negative numbers increase the gap
| FY 2017 | FY 2018 | FY 2019 | FY 2020 | FY 2021 | |
| City Stated Gap | $0 | $0 | ($3,313) | ($2,510) | ($1,793) |
| Tax Revenues | |||||
| Property Tax | $0 | $34 | $285 | $572 | $673 |
| Personal Income Tax | 48 | 258 | 90 | (105) | (157) |
| Business Taxes | (56) | 76 | 95 | 123 | 68 |
| Sales Tax | 50 | 68 | 31 | (65) | (106) |
| State Sales Tax Intercept | (50) | (200) | (150) | 0 | 0 |
| Real Estate-Related Taxes | 112 | 131 | (109) | (278) | (272) |
| Subtotal Tax Revenues | $104 | $367 | $242 | $247 | $206 |
| Non-Tax Revenues | |||||
| ECB Fines | $12 | $24 | $24 | $24 | $24 |
| Late Filing/No Permit Penalties | 5 | 5 | 5 | 5 | 5 |
| Motor Vehicle Fines | 0 | 5 | 5 | 5 | 5 |
| Taxi Medallion Sales | 0 | 0 | (107) | (257) | (367) |
| Subtotal Non-Tax Revenues | $17 | $34 | ($73) | ($223) | ($333) |
| Total Revenues | $121 | $401 | $169 | $24 | ($127) |
| Expenditures | |||||
| Overtime | ($276) | ($215) | ($215) | ($215) | ($215) |
| DOE Medicaid Reimbursement | (20) | (70) | (70) | (70) | (70) |
| Homeless Shelters | 0 | (132) | (132) | (132) | (132) |
| NYC Health + Hospitals | (165) | (165) | (165) | (165) | (165) |
| Public Assistance | 15 | 10 | 10 | 10 | 10 |
| Debt Service Savings | 70 | 30 | 30 | 30 | 30 |
| General Reserve | 300 | 0 | 0 | 0 | 0 |
| Subtotal | ($76) | ($542) | ($542) | ($542) | ($542) |
| Total (Risks)/Offsets | $45 | ($141) | ($373) | ($518) | ($669) |
| Restated (Gap)/Surplus | $45 | ($141) | ($3,686) | ($3,028) | ($2,462) |
In the outyears, our office’s projections show net risks to the Plan estimates ranging from $141 million in FY 2018 to $669 million in FY 2021. These risks, if realized, would create a gap of $141 million in FY 2018 and widen the outyear gaps to $3.7 billion in FY 2019, $3.0 billion in FY 2020, and $2.5 billion in FY 2021. While the Comptroller’s Office’s revenue forecast for FYs 2018 through 2020 are above the Plan’s projections, they are not sufficient to offset the expenditure risks. In FY 2021, the revenue risk identified by our office adds to the expenditures risk.
In total, the Comptroller’s Office anticipates more tax revenues than projected in each year of the Plan period. Our higher outyear forecasts are driven primarily by higher projections for property tax revenues. Risks and offsets to tax revenues are discussed in greater detail in “Tax Revenues” beginning on page 16.
The Comptroller’s Office projects higher revenues from fines and penalties over the Plan period. These additional revenues are offset by our office’s assumptions that the sale of taxi medallions assumed in the Plan is unlikely to take place. The current Plan delayed the schedule for the sale of taxi medallions by a year, the fourth such delay. This pattern of delay combined with declining taxi medallion prices make it highly unlikely that the sale will take place over the Plan period.
The largest risks to the Plan’s expenditure estimates are overtime, homeless shelter spending, and Health + Hospitals (H+H) support. Despite increases to the overtime budget in the current Plan, the Plan’s assumptions are still significantly below recent spending pattern. The Comptroller’s Office’s analysis indicates that overtime could be above Plan by $276 million in FY 2017 and $215 million in each of the outyears of the Plan as discussed in “Overtime” beginning on page 29.
Spending on shelter operations in the Department of Homeless Services is projected to decline from $1.32 billion in FY 2017 to $1.17 billion in FY 2018 and remain relatively stable thereafter. With the growth in the homeless population, it is unlikely that the need for shelter services will diminish drastically in the outyears of the Plan, posing a risk of $132 million in each of the outyears of the Plan.
The Financial Plan continues to assume reimbursements from H+H for fringe benefits expenses and medical malpractice settlements. As discussed in previous reports, the Comptroller’s Office believes that H+H is unlikely to make these payments as it has failed to do so in three of the last four fiscal years.
The expenditures are partially offset by the Comptroller’s assumption of additional debt service savings from refinancing, and lower spending on public assistance. In FY 2017, the Comptroller’s Office recognizes another $300 million in offsets to expenditures from the General Reserve. While the City has reduced the FY 2017 General Reserve by $700 million to $300 million, the Comptroller’s Office expects that the $300 million will not be needed for budget balance and will be eliminated as the fiscal year progresses.
A. Revenue Assumptions
The FY 2018 Preliminary Budget and Financial Plan projects total revenues to grow by $8.97 billion over the Financial Plan period, from $84.81 billion in FY 2017 to $93.79 billion in FY 2021. City-funds revenues are projected to grow from $59.94 billion in FY 2017 to $69.86 billion in FY 2021. Those projections are based on the Administration’s assumption of continued moderate growth in the City’s economy. Tax revenue growth is projected to slow to 2.4 percent in FY 2017 before accelerating and averaging 4.4 percent annually in FYs 2018-2021, driven by growth in both property and non-property tax revenues. The January Plan projects property tax revenues to grow from $24.40 billion in FY 2017 to $30.12 billion in FY 2021, while non-property tax revenues are expected to grow from $30.48 billion in FY 2017 to $34.73 billion in FY 2021.[8]
Miscellaneous revenues, excluding intra-City revenues, are expected to decline by 5.2 percent in FY 2017 and 4.6 percent in FY 2018 to $4.80 billion and $4.58 billion, respectively. These declines reflect the City’s anticipation of lower non-recurring revenues and slightly lower collections from other miscellaneous revenue sources. Miscellaneous revenues are expected to rebound and grow by 5.4 percent in FY 2019 and 4.1 percent in FY 2020. Growth in FY 2021 is expected to be nearly flat at 0.1 percent. Total miscellaneous revenues are expected to grow from $4.8 billion in FY 2017 to $5.02 billion in FY 2021.
The January Plan projects total Federal and State aid of $23.24 billion for FY 2017, an increase of $579 million over the November Plan. Similarly, the City recognized an additional $369 million in Federal and State aid in the Preliminary FY 2018 Budget. The majority of the new Federal and State aid recognized in the current Plan is for social services, including support for higher homeless shelter costs, enhanced fringe benefits reimbursement rates, and prior-year revenue adjustments. A substantial portion of the State aid increase in the January Plan is reflected as savings in the Citywide Savings Program as a result of funding shifts anticipated by the City. Over the remainder of the Plan period, Federal and State aid are projected to grow from $21.56 billion in FY 2018 to $22.50 billion in FY 2021 driven mainly by expected increases in State education aid.
Tax Revenues
In the January Modification, the City revised its tax revenue projections for every year of the Financial Plan period. FY 2017 tax revenue projections increased by a net $365 million to $54.88 billion, bringing the total increase in the FY 2017 tax revenue forecast to $240 million since budget adoption. The January Plan lowered the FY 2018 tax revenue forecast by a net $183 million to $57.035 billion, while projections for the outyears increased by a net $8 million in FY 2019, $329 million in FY 2020 and $425 million in FY 2021.
Changes to the City’s Tax Revenue Forecast
As Table 8 shows, revisions to the FY 2017 tax revenue projection includes increases of $171 million in property tax revenue resulting from a re-estimate of property tax reserves, $2.0 million in Unincorporated Business Tax (UBT) revenue and a combined $80 million increase in “all other” taxes. Additionally, projected audit revenues for FY 2017 increased by $300 million mostly due to higher than anticipated audit revenues from the banking corporation tax (BCT).[9] These increases are partially offset by lower projections of $29 million in personal income tax (PIT) revenue, $91 million in sales tax revenue and $68 million in combined revenues from real estate-related taxes, which comprise the real property transfer tax (RPTT) and the mortgage recording tax (MRT).
Table 8. Revisions to the City’s Tax Revenue Assumptions November 2016 vs. January 2017
($ in millions)
| FY 2017 | FY 2018 | FY 2019 | FY 2020 | FY 2021 | |
| November 2016 Financial Plan Total | $54,518 | $57,218 | $59,717 | $62,089 | $64,433 |
| Revisions: | |||||
| Property | 171 | 219 | 372 | 427 | 451 |
| Personal Income (PIT) | (29) | (60) | (81) | 60 | 90 |
| Business | 2 | (299) | (195) | (204) | (142) |
| Sales | (91) | 7 | 30 | 73 | 86 |
| Real Estate-Related | (68) | (199) | (117) | (11) | (37) |
| All Other | 80 | 15 | (6) | (21) | (28) |
| Tax Audit | 300 | 134 | 5 | 5 | 5 |
| Revisions-Total | $365 | ($183) | $8 | $329 | $425 |
| January 2017 Financial Plan – Total | $54,883 | $57,035 | $59,725 | $62,418 | $64,858 |
The Preliminary FY 2018 Budget projects total tax revenues of $57.04 billion. This forecast represents an increase of $2.15 billion, or 3.9 percent from the projected FY 2017 level. The January Plan lowered the FY 2018 tax revenue estimate by a net $183 million. This decline results primarily from downward revisions of $299 million in the business tax revenue forecast and $199 million in the combined forecast for real estate-related taxes. Downward revisions for these tax revenue projections were also carried out throughout the Plan period, but are more than offset by forecast increases in property, PIT, and sales tax revenues in FYs 2019-2021.
Projected Tax Revenue Growth, FYs 2017 – 2021
The City projects tax revenues will grow from $54.88 billion in FY 2017 to $64.86 billion in FY 2021, an average annual growth rate of 4.3 percent. Tax revenue growth is projected to slow to 2.4 percent in FY 2017, after growing by a moderate 3.2 percent in FY 2016 and 7.4 percent the year before. The projected slowdown in tax revenue growth in FY 2017 results primarily from an anticipated decline in revenues from the real estate-related taxes. As Table 9 shows, the January Plan assumes growth in tax revenues will accelerate to 3.9 percent in FY 2018 as collections from non-property taxes begin to improve.
Table 9. Tax Revenue Forecast, Growth Rates
| FY 2017 | FY 2018 | FY 2019 | FY 2020 | FY 2021 | FYs 2017 – 2021 Average Annual Growth | ||
| Property | |||||||
| Mayor | 5.3% | 5.9% | 6.4% | 4.8% | 4.5% | 5.4% | |
| Comptroller | 5.3% | 6.0% | 7.4% | 5.8% | 4.8% | 6.0% | |
| PIT | |||||||
| Mayor | 1.5% | 2.8% | 3.4% | 5.0% | 4.0% | 3.8% | |
| Comptroller | 1.9% | 4.6% | 1.9% | 3.3% | 3.6% | 3.4% | |
| Business | |||||||
| Mayor | 4.9% | 1.8% | 3.3% | 2.3% | 3.2% | 2.7% | |
| Comptroller | 3.9% | 4.1% | 3.6% | 2.7% | 2.3% | 3.2% | |
| Salesa | |||||||
| Mayor | 1.9% | 7.4% | 4.6% | 4.8% | 3.7% | 5.1% | |
| Comptroller | 1.9% | 5.5% | 4.8% | 5.6% | 3.2 | 4.8% | |
| Real Estate-Related | |||||||
| Mayor | (16.8%) | (1.0%) | 6.6% | 6.9% | 1.8% | 3.5% | |
| Comptroller | (13.0%) | (0.3%) | (2.9%) | 0.5% | 2.2% | (0.1%) | |
| All Other | |||||||
| Mayor | 3.9% | (0.4%) | 2.0% | 2.3% | 2.5% | 1.6% | |
| Comptroller | 3.9% | (0.4%) | 2.0% | 2.3% | 2.5% | 1.6% | |
| Total Tax with Audit | |||||||
| Mayor | 2.4% | 3.9% | 4.7% | 4.5% | 3.9% | 4.3% | |
| Comptroller | 2.5% | 4.4% | 4.5% | 4.5% | 3.8% | 4.3% | |
a Projected sales tax revenue growth rates are net of the State intercept of sales tax revenues to recoup savings from the FY 2015 refinancing of Sales Tax Asset Receivable Corporation bonds.
The Comptroller’s Office revised its current year tax revenue forecasts as well as its projections for the remainder of the Financial Plan period. The Comptroller projects total tax revenue to grow 2.5 percent in FY 2017, just one-tenth of a percentage point above the Administration’s 2.4 percent growth forecast. For FY 2018, the Comptroller forecasts a faster 4.4 percent growth in tax revenues compared to the City’s 3.9 percent reflecting the Comptroller’s more optimistic revenue projections for property tax, PIT, and the real estate-related taxes. In the outyears, for FYs 2019 and 2021, the Comptroller’s growth projections are slightly lower. Over the Plan period, both the Comptroller’s Office and the City project average annual growth in total tax revenues of 4.3 percent. Property Taxes
Growth projections for property tax revenue remains strong throughout the Plan period. Property tax revenue is expected to grow by 5.9 percent in FY 2018 to $25.83 billion. This growth is supported by strong billable value growth of 8.45 percent in the FY 2018 tentative assessment roll. Total market value of all City properties is assessed at $1.157 trillion, an 8.74 percent increase from FY 2017. Billable assessed value on the final roll is forecast to grow 6.7 percent (before accounting for veterans’ and STAR exemptions). Over the Financial Plan period, property tax revenue growth is expected to surpass growth in non-property tax revenues and average 5.4 percent annually, reflecting steady growth in projected property values and the phase-in of the pipeline of previous assessments.
The Comptroller expects property tax revenue to grow at an average annual rate of 6.0 percent over the Plan period compared to the 5.4 percent growth anticipated by the City. In FY 2018, the Comptroller is assuming a slightly lower reduction from the tentative roll to the final roll, resulting in net property tax revenue growth after reserves of 6.0 percent in FY 2018 compared to the City’s 5.9 percent projection. The Comptroller forecasts that growth in property tax revenue will begin to taper off over the forecast period as higher interest rates begin to put downward pressure on market and assessment values. Property tax revenue growth is expected to decline from the 7.4 percent forecast in FY 2018 to 4.8 percent by FY 2021. Although the City expects a similar downward growth pattern to occur, the Comptroller’s forecasts remain slightly higher, resulting in offsets increasing from $34 million in FY 2018 to $673 million in FY 2021.
Personal Income Taxes
PIT revenue growth is expected to tick up in FY 2017 and register a modest 2.8 percent increase in FY 2018 to reach $11.83 billion. The sluggish growth in projected PIT revenue reflects the City’s anticipation of continued decline in estimated payments in FY 2018. Withholding collections are expected to grow 6.2 percent while estimated payments are expected to decline 1.6 percent in FY 2018. Over the Plan period, PIT revenue growth is projected to average 3.8 percent annually.
The Comptroller’s Office projects PIT revenue to grow at an average annual rate of 3.4 percent from FY 2017 to FY 2021, marginally lower than the City’s forecast of 3.8 percent. Although growth over the Plan period is similar, the Comptroller’s forecast assumes stronger near-term growth in FY 2017 and FY 2018, and conversely lower growth in the outyears compared to the City. The major source for this different pattern of growth is the non-wage component of income, primarily associated with capital gains realizations. The Comptroller anticipates that the recent uptick in the stock market that occurred in late 2016 will contribute to strong growth in non-wage income in the near term. Of particular importance for the City’s income tax revenue is the appreciation in stock values of financial services firms. Stock incentive options that were issued at the height of the market in 2007, are, for the first time in many years, in the money, providing a financial incentive to exercise them.[10] Since these incentive options generally expire after ten years, they will need to be exercised in the near term, contributing to an uptick in non-wage income. In addition, proposed changes to Federal individual income tax law and the expectation of lower marginal tax rates on ordinary and capital gains income, likely resulted in taxpayers shifting income from tax year 2016 into tax year 2017 as evidenced by collections seen in January 2017. Estimated quarterly payments, based on tax year 2017 liability, are expected to continue to grow until 2019. The Comptroller therefore anticipates growth in non-wage income to average nearly 5.0 percent in FY 2017 and FY 2018, compared to the City’s average forecast decline of 1.4 percent over the same period. Thereafter, as growth in the economy slows due to the diminished effects of the fiscal stimulus and higher interest rates, the Comptroller is anticipating a slowdown in growth of non-wage income to only 1.5 percent on average, lower than the City’s estimate of 2.4 percent. This results in a higher near term forecast compared to the City, with offsets of $48 million in FY 2017, growing to $258 million in FY 2018, diminishing to $90 million in FY 2019, and thereafter risks of $105 million and $157 million, respectively in FYs 2020 and 2021.[11].
Business Taxes
Business tax revenues (unincorporated business tax and business corporation tax), are expected to recover in FY 2017 and grow by 4.9 percent thanks to stronger collections from the business corporation tax anticipated for the second half of the fiscal year. In FY 2018, the City expects growth in total business tax revenues to slow to 1.8 percent, with revenues growing to $6.05 billion. The slower growth projected for FY 2018 is due to a projected decline in Wall Street profits in calendar year 2017, which will weaken collections from the business corporation tax in FY 2018. Revenues from the UBT are expected to grow 4.2 percent in FY 2018, while growth in the business corporation tax revenue is expected to be nearly flat at just 0.5 percent. Average annual growth in the combined business tax revenues is projected at 2.7 percent in FYs 2017-2021.
Compared to the City’s overall forecast for the combined business taxes, the Comptroller’s Office expects a $56 million risk in FY 2017, followed by offsets of $76 million in FY 2018, $95 million in FY 2019, $123 million in FY 2020, and $68 million in FY 2021. Most of the difference between the Comptroller and the City’s forecasts is due to projections for the business corporation tax. In FY 2017, the City anticipates a very strong rebound of 6.8 percent in collections from the business corporation tax. This is due to anticipated strong liability in tax year 2016, which is expected to reverse weak payments that occurred in FY 2016 and the first half of FY 2017 following overpayments and credits generated in tax year 2015. The Comptroller’s Office also expects strong payments from the business corporation tax in the second half of FY 2017, but not quite as high as the City, with growth projected at 5.5 percent. Beginning in FY 2018, the City anticipates growth in the business corporation tax to drop significantly, averaging only 1.5 percent growth per year in FY 2018 through FY 2021. The Comptroller’s Office expects growth in the business corporation tax to average 2.5 percent a year over the same period, a more gradual decline, mirroring growth in the overall economy.
Sales Tax
The January Plan assumes sales tax revenue growth will slow to 1.9 percent in FY 2017 before picking up pace in FY 2018. The FY 2017 forecast is net of $150 million in State revenue intercept the City anticipates in the current fiscal year.[12] Since the Plan does not recognize any further intercept in FYs 2018-2019, projected growth in sales tax revenues accelerates to 7.4 percent in FY 2018 and averages 5.1 percent annually over the Plan period. While the City reflects a State intercept of only $150 million in FY 2017, the State plans to recoup $550 million over FYs 2017-2019.
The Comptroller’s Office believes the unrecognized sales tax revenue intercept of $50 million, $200 million, and $150 million in FYs 2017-2019, respectively, represents a risk to the City’s forecast. However, the Comptroller’s Office projections of employment and local economic growth are slightly better than the City’s assumptions resulting in a higher forecast in baseline sales tax revenues in FYs 2017-2019. Consequently, the Comptroller’s Office projects net risks of $132 million in FY 2018 and $119 million in FY 2019. For FYs 2020-2021, although no intercept is expected, the Comptroller believes sales tax revenues will be slightly below the City’s forecasts, producing risks of $65 million and $106 million respectively.
The State Executive budget includes a proposal to expand sales tax collections to online third-party vendors. The State projects City’s sales tax revenues would increase by $41 million in FY 2018. This assumption is not included in either the City’s or the Comptroller’s Office’s forecast.
Real Estate-Related Taxes
The City projects a significant decline of 16.8 percent in aggregate revenues from real estate-related taxes in FY 2017. Revenues from the Real Property Transfer Tax (RPTT) and the Mortgage Recording Tax (MRT) are both expected to fall in the current fiscal year driven by a decline in commercial real estate sales. In FY 2018, aggregate real estate-related taxes are expected to drop another 1.0 percent to $2.48 billion. MRT revenues are expected to decline 6.3 percent while collections from RPTT are projected to rise 2.8 percent in FY 2018, supported by increased activity in the residential real-estate market as new condominium units reach the market. Aggregate real estate-related tax revenue is expected to average 3.5 percent growth annually over the forecast period.
The Comptroller projects a 13.0 percent decline in the combined revenues from RPTT and MRT in FY 2017. These revenues are expected to stay nearly flat over the Plan period. After a record year of revenues from these two taxes in FY 2016 (a combined $3.0 billion), collections cooled off during the first six months of the current fiscal year, declining by 15 percent compared to FY 2016. The Comptroller forecasts aggregate real estate-related tax revenues to be $2.6 billion in the current fiscal year and then remain flat over the Plan period. The Comptroller forecasts that the positive effects from increased employment and wages will be offset by higher interest rates. This contributes to a stable outlook in both the residential market and the commercial markets. Overall, revenues are expected to hover around $2.6 billion throughout the Plan. In contrast, the City expects that these revenues will nearly recover to the FY 2016 level by the end of the Plan period. This difference results in offsets of $112 million in FY 2017 and $131 million in FY 2018, followed by risks in the outyears that grow from $109 million in FY 2019 to $272 million in FY 2021.
As shown in Table 10, the Comptroller’s Office projects net offsets in every year of the Plan period. The offset in FY 2017 is driven by higher forecasts of PIT and real estate-related tax revenues. The projected offsets in FYs 2019-2021, are driven primarily by higher property tax revenue forecasts. Net non-property tax revenue forecasts are lower than the City’s in each of FYs 2019 through 2021.
The Comptroller identifies offsets of $104 million in FY 2017, $367 million in FY 2018, $242 million in FY 2019, $247 million in FY 2020, and $206 million in FY 2021.
Table 10. Risks and Offsets to the City’s Tax Revenue Projections
($ in millions)
| FY 2017 | FY 2018 | FY 2019 | FY 2020 | FY 2021 | |
| Property | $0 | $34 | $285 | $572 | $673 |
| PIT | 48 | 258 | 90 | (105) | (157) |
| Business | (56) | 76 | 95 | 123 | 68 |
| Sales | 50 | 68 | 31 | (65) | (106) |
| State Sales Intercept | (50) | (200) | (150) | 0 | 0 |
| Real Estate-Related | 112 | 131 | (109) | (278) | (272) |
| Total | $104 | $367 | $242 | $247 | $206 |
Miscellaneous Revenues
In the January 2017 Financial Plan, the City raised its FY 2017 miscellaneous revenue projection by a net $133 million to $4.80 billion. The increase reflects mainly higher than expected collections through the first half of the fiscal year. The revised forecast, however, represents a $261 million decline in miscellaneous revenue compared to the previous fiscal year. This is mostly due to lower revenue projections for “other miscellaneous” revenue category, including asset sales, restitution and other non-recurring revenues in FY 2017.[13]
The FY 2018 Preliminary Budget includes a miscellaneous revenue projection of $4.58 billion, $220 million lower than the FY 2017 projection. The year-over-year change reflects small declines in projected revenues from licenses and franchises, charges for services, water and sewer revenues, rental income, fines and forfeitures and other miscellaneous revenues in FY 2018. The current FY 2018 miscellaneous revenue forecast is also $88 million lower than the forecast included in the November 2016 Plan.
Table 11 shows the changes in the FY 2018 miscellaneous revenue projections since the November 2016 Plan. With the exception of a downward revision of $107 million in the “other miscellaneous” category, revisions to the remaining categories were minor. The category “other miscellaneous” includes non-recurring revenues such as asset sales, refunds of prior-year expenditures and restitutions. The lower projection in this category reflects the City’s decision to once again delay the sale of taxi medallions another year, spreading out the $731 million in expected proceeds over FYs 2019-2021 instead of FYs 2018-2020. Despite the current unfavorable environment for medallion prices due to the rise of the rideshare industry, the City has not revised its revenue projection for medallion sales.
Table 11. Changes in FY 2018 Estimates November 2016 vs. January 2017
($ in millions)
| November | January | Change | |
| Licenses, Franchises, Etc. | $644 | $645 | $1 |
| Interest Income | 105 | 110 | 5 |
| Charges for Services | 975 | 977 | 2 |
| Water and Sewer Charges | 1,357 | 1,361 | 4 |
| Rental Income | 225 | 225 | 0 |
| Fines and Forfeitures | 895 | 902 | 7 |
| Other Miscellaneous | 463 | 356 | (107) |
| Total | $4,664 | $4,576 | ($88) |
Miscellaneous revenue projections for the outyears reflect changes associated with the delay in anticipated proceeds from medallion sales and minor adjustments to other categories including an increase in anticipated interest income as a result of higher estimated cash balances. The City expects total miscellaneous revenue to decline by 4.6 percent in FY 2018 and then grow by 5.4 percent in FY 2019, 4.1 percent in FY 2020 and remain flat in FY 2021.
The Comptroller’s Office believes that given market conditions, and uncertainty surrounding future taxi medallion auctions, the $731 million in anticipated revenues from medallion sales represents a risk to the City’s Financial Plan.
Based on collection trend in recent years, the Comptroller’s Office expects revenues from fines to be above the City’s forecast by $17 million in FY 2017 and $34 million annually in FYs 2018-2021. The Comptroller believes revenues from Environmental Control Board (ECB) fines could generate an additional $12 million in FY 2017 and $24 million annually over the Plan period. Motor vehicle fines could be higher by $5 million annually starting in FY 2018, while penalties from the Department of Buildings (DOB) are likely to exceed the City’s current forecast by $5 million annually in FYs 2017-2021.
Federal and State Aid
The January Financial Plan projects total Federal and State aid of $23.24 billion in FY 2017, supporting about 27 percent of the City’s expenditure budget. Compared with the November Plan, the City’s intergovernmental aid assumptions for the current year have risen by $579 million, which include increases of $292 million in Federal aid and $287 million in State grants. A significant portion of the Federal aid increase stems from greater support for social services of $195 million that mainly reflects homeless shelter cost re-estimates ($61 million) various enhanced fringe benefits reimbursement ($57 million) and prior-year revenue adjustments ($53 million). The January Plan also shows an additional $30 million in Community Development Block Grants (CDBG) for Disaster Recovery and other Sandy-related reimbursement, bringing the total for total Sandy-related reimbursement to nearly $1.45 billion in FY 2017. In addition, the City recognizes an additional $29 million in prior year Federal homeland security grants.
The Preliminary Budget projects $21.56 billion in Federal and State aid for FY 2018, showing increases of $213 million in Federal grants and $156 million in State grants since the November Plan. About 83 percent of this total is expected to support education and social services spending. Federal and State grants are expected to support about 26 percent of total spending in FY 2018. The decline in the size of the Federal and State support of the City’s budget in FY 2018 is attributable both to the slowdown in the pace of Sandy-related reimbursement and more conservative estimates of certain Federal grants, which together contribute to a decline of about $1.8 billion between FY 2017 and FY 2018. About $1.3 billion of the decline is attributable to the winding down of Federal funding for Sandy relief and rebuilding efforts.
Of the $287 million increase in FY 2017 State aid from the November Plan, $190 million is due to an increase in social services grants. Almost $79 million of the additional social service grants is due to a one-time recognition of prior-year revenue for State child welfare services that did not have an associated receivable. Other significant increases in social services include additional State reimbursements for the Department of Social Services and Administration for Children’s Services fringe benefits totaling $62 million. These additional reimbursements are included in the Citywide Savings Program as offsets to City-funds spending.
Since the Adopted FY 2017 Budget, OMB has increased projected State revenues by $744 million in FY 2017 and $253 million in FY 2018. A significant portion of these State aid increases has been counted in the Citywide Savings Program (CSP) –– $448 million in FY 2017 and $177 million in FY 2018. The FY 2018 Preliminary Budget CSP includes $105 million in FY 2017 from one-time State revenues for prior-year receivables for social services and $95 million in recurring savings from higher State aid projections in each of FY 2018 through FY 2021. The FY 2018 Preliminary Budget estimates $14.5 billion in State aid in FY 2018, with about three-quarters dedicated to education and 12 percent for social services.
Actual State revenues will be impacted by negotiations between the Governor and the Legislature over the State’s budget for the fiscal year beginning April 1. While the Legislature typically increases funds for education in the State Enacted Budget, the City’s current projection for formula-based school aid in FY 2018 is $264 million higher than the State Executive Budget proposal. The City would also face higher costs for charter school tuition and rent totaling about $200 million per year. The State Executive Budget as proposed also contains several proposals that would shift roughly $100 million in funding responsibility to the City for public health, foster care, special education, and traffic violations in FY 2017 and FY 2018. Additionally, under a State Executive Budget proposal, the City would be subject to a $50 million penalty if the City’s Department of Education fails to produce a plan by June to increase its Federal Medicaid claims for special education services by $100 million and submit a plan for $50 million in Medicaid savings. While the City has proposed continued investments to improve its claims system, previous efforts have so far failed to produce results. The City could also face additional State aid reductions under a proposed expansion of Executive budgetary powers. The State Executive Budget proposes to authorize the State Division of Budget to decrease local aid appropriations if State receipts, including federal aid, are less than planned.
B. Expenditures Analysis
Total-funds expenditures in the January Financial Plan is projected to decline slightly from $84.8 billion in FY 2017 to $84.7 billion in FY 2018, a decline of one tenth of a percent. However, both the FY 2017 and FY 2018 includes prepayments which lower debt service expenditures in these fiscal years. In addition, expenditures in FY 2017 are further reduced by the take-down of the general reserve and the re-estimates of prior-year payables and receivables. After adjusting for prepayments and other prior-year actions, and excluding re-estimates of prior-year receivables and payables and reserves, expenditures are projected to grow from $85.9 billion to $94.3 billion in 2021, a growth of 9.8 percent, as shown in Table 12.
Expenditure growth over the Plan period is driven by spending on wages and salaries, debt service, health insurance, other fringe benefits excluding pensions, and judgments and claims. The combined spending in these areas is projected to grow by 18.6 percent over the Plan period, averaging 5.3 percent annually. All other expenditures, net of the General Reserve, Capital Stabilization reserve, and prior-year re-estimates, are projected to remain relatively flat over the same period, with a projected annual average decline of under 1.0 percent.
Table 12. FY 2017 – FY 2021 Expenditure Growth Adjusted for Prepayments and prior-year actions
($ in millions)
| FY 2017 | FY 2018 | FY 2019 | FY 2020 | FY 2021 | Growth FYs 17-21 | Annual Growth | |
| Salaries and Wages | $25,453 | $26,950 | $28,430 | $29,268 | $29,855 | 17.3% | 4.1% |
| Debt Service | $6,389 | $6,582 | $7,301 | $7,960 | $8,372 | 31.1% | 7.0% |
| Health Insurance | $5,976 | $6,465 | $6,958 | $7,505 | $8,164 | 36.6% | 8.1% |
| Other Fringe Benefits | $3,531 | $3,689 | $3,913 | $4,298 | $4,421 | 25.2% | 5.8% |
| Subtotal | $41,348 | $43,686 | $46,602 | $49,030 | $50,812 | 18.6% | 5.3% |
| Pensions | $9,301 | $9,706 | $9,987 | $10,040 | $10,058 | 8.1% | 2.0% |
| Medicaid | 5,915 | 5,915 | 5,915 | 5,915 | 5,915 | 0.0% | 0.0% |
| Public Assistance | 1,584 | 1,594 | 1,605 | 1,617 | 1,617 | 2.0% | 0.5% |
| Judgments and Claims | 676 | 692 | 707 | 725 | 740 | 9.5% | 2.3% |
| Other OTPS | 27,074 | 24,879 | 25,102 | 24,999 | 25,190 | (7.0%) | (1.8%) |
| Subtotal | $44,549 | $42,787 | $43,316 | $43,295 | $43,519 | (2.3%) | (0.6%) |
| Expenditures Before Reserves and Prior-Year Re-estimates | $85,897 | $86,473 | $89,918 | $92,325 | $94,331 | 9.8% | 2.4% |
| Prior-Year Receivables and Payables Re-estimate | ($400) | $0 | $0 | $0 | $0 | (100.0%) | (100.0%) |
| General Reserve | $300 | $1,000 | $1,000 | $1,000 | $1,000 | 233.3% | 35.1% |
| Capital Stabilization Reserve | $0 | $250 | $250 | $250 | $250 | ||
| Total | $85,797 | $87,723 | $91,168 | $93,575 | $95,581 | 11.4% | 2.7% |
Headcount
The January 2017 Financial Plan projects total-funded full-time headcount of 300,703 for fiscal year-end 2017, an increase of 13,701 or 4.8 percent from the FY 2016 year-end level. The outyear headcount plan reverses a trend of increasing growth that began in FY 2015, when full-time headcount increased by 5,406 followed by an increase of 9,829 in FY 2016. Plan headcount in the outyears remains relatively steady, around the 300,000 level, as shown in Table 13.
Table 13. Total Funded Full-Time Year-End Headcount Projections –January 2017 Financial Plan
| FY 2017 | FY 2018 | FY 2019 | FY 2020 | FY 2021 | |
| Pedagogical | |||||
| Dept. of Education | 119,278 | 120,153 | 120,923 | 120,794 | 121,936 |
| City University | 4,441 | 4,441 | 4,441 | 4,441 | 4,441 |
| Subtotal | 123,719 | 124,594 | 125,364 | 125,235 | 126,377 |
| Uniformed | |||||
| Police | 35,822 | 35,822 | 35,822 | 35,822 | 35,822 |
| Fire | 10,884 | 10,910 | 10,938 | 10,938 | 10,938 |
| Correction | 10,336 | 10,420 | 10,459 | 10,475 | 10,475 |
| Sanitation | 7,445 | 7,505 | 7,569 | 7,569 | 7,569 |
| Subtotal | 64,487 | 64,657 | 64,788 | 64,804 | 64,804 |
| Civilian | |||||
| Dept. of Education | 11,225 | 11,254 | 11,264 | 11,268 | 11,922 |
| City University | 1,907 | 1,924 | 1,941 | 1,945 | 1,945 |
| Police | 16,058 | 15,971 | 15,971 | 15,971 | 15,971 |
| Fire | 5,977 | 5,980 | 5,980 | 5,980 | 5,980 |
| Correction | 2,188 | 2,172 | 2,172 | 2,172 | 2,172 |
| Sanitation | 2,250 | 2,269 | 2,293 | 2,293 | 2,293 |
| Admin. for Children’s Services | 7,116 | 7,112 | 7,112 | 7,111 | 7,111 |
| Social Services | 15,084 | 14,699 | 14,704 | 14,708 | 14,708 |
| Homeless Services | 2,367 | 2,393 | 2,393 | 2,393 | 2,393 |
| Health and Mental Hygiene | 5,550 | 5,337 | 5,329 | 5,325 | 5,325 |
| Finance | 2,169 | 2,164 | 2,164 | 2,164 | 2,164 |
| Transportation | 5,244 | 5,181 | 5,153 | 5,145 | 5,145 |
| Parks and Recreation | 4,326 | 4,243 | 4,243 | 4,231 | 4,228 |
| All Other Civilians | 31,036 | 30,501 | 30,420 | 30,375 | 30,432 |
| Subtotal | 112,497 | 111,200 | 111,139 | 111,081 | 111,789 |
| Total | 300,703 | 300,451 | 301,291 | 301,120 | 302,970 |
The January headcount plan, as shown in Table 14, shows a net increase of 100 in FY 2017 year-end headcount from the November 2016 Financial Plan. Major net increases as compared to the November Plan as shown in Table 14 include 75 in the Department of Social Services which adds $3.7 million to the agency’s expense in FY 2017 and $5.1 million annually, beginning in FY 2018; 69 in the Department of Homeless Services which adds $4.0 million to the agency’s FY 2017 expenses and $4.3 million annually, beginning in FY 2018 (including 61 for Shelter Intake Staffing, which accounts for $3.2 million of the agency’s increase in FY 2017 and $3.6 million annually, beginning in FY 2018); and 46 in the Department of Transportation which adds $514,275 to the agency’s FY 2017 expenses and $2.3 million annually, beginning in FY 2018.
There is a planned decrease of 277 in the Department of Health and Mental Hygiene for year-end 2017. While these positions were included in prior headcount plans, they were not previously funded in the expense budget, and thus the elimination of these positions has no financial impact on the agency’s budget.
Table 14. Plan-to-Plan Comparison: November 2016 Financial Plan vs. January 2017 Financial Plan Full-time Headcount
| FY 2017 | FY 2018 | FY 2019 | FY 2020 | |
| Pedagogical | ||||
| Dept. of Education | 0 | 0 | 0 | 0 |
| City University | 0 | 0 | 0 | 0 |
| Subtotal | 0 | 0 | 0 | 0 |
| Uniformed | ||||
| Police | 42 | 42 | 42 | 42 |
| Fire | 0 | 0 | 0 | 0 |
| Correction | 0 | 46 | 46 | 46 |
| Sanitation | 0 | 0 | 0 | 0 |
| Subtotal | 42 | 88 | 88 | 88 |
| Civilian | ||||
| Dept. of Education | 49 | 91 | 97 | 97 |
| City University | 0 | 0 | 0 | 0 |
| Police | (16) | (43) | (43) | (43) |
| Fire | 24 | 35 | 35 | 35 |
| Correction | 0 | 0 | 0 | 0 |
| Sanitation | 0 | 0 | 0 | 0 |
| Admin. for Children’s Services | 0 | 0 | 0 | 0 |
| Social Services | 75 | 70 | 70 | 70 |
| Homeless Services | 69 | 158 | 158 | 158 |
| Health and Mental Hygiene | (277) | (60) | (60) | (60) |
| Finance | 0 | 0 | 0 | 0 |
| Transportation | 46 | 67 | 86 | 67 |
| Parks and Recreation | 28 | 27 | 27 | 27 |
| All Other Civilians | 60 | 158 | 161 | 161 |
| Subtotal | 58 | 503 | 531 | 512 |
| Total | 100 | 591 | 619 | 600 |
Table 15 compares actual headcount on December 31, 2016 to the planned FY 2017 year-end headcount. The headcount Plan shows an expected net increase of 13,701 full-time employees Citywide, from June 30, 2016. As of December 31, 2016, half way through the fiscal year, Citywide headcount has shown a net increase of only 5,416, less than 40 percent of the planned increase.
The pace of increase suggests that the City may once again not be able to meet its headcount target for the year. This suggests that there could be additional personal services accrual savings in the budget in the latter part of the fiscal year. Several agencies with significant planned increases are well short of the pace needed to meet their end target. This includes:
- The Police Department which has added only 146 of the planned 1,705 increase in civilian headcount.
- The Administration for Children’s Services which has added only 246 of the planned 1,144 increase.
- The Department of Social Services which has experienced a decrease of 95 employees despite a planned increase of 1,820.
- The Department of Health and Mental Hygiene which has added only 349 of the planned 1,042 increase.
Despite planned reductions, headcount in the Department of Homeless Services and uniformed headcount in the NYPD, FDNY and Department of Sanitation have increased since June 30, 2016. Collectively, these headcounts are nearly 1,000 positions above plan.
Table 15. December 31, 2016 Headcount vs. Planned June 30, 2017 Headcount
| 6/30/2016 Actuals | 12/31/2016 Actuals | Jan Plan 6/30/2017 Plan | Change 6/30/2016 Actuals to 12/31/2016 Actuals | Planned Change 6/30/2016 to 6/30/2017 | Percent of Planned Change Achieved | |
| Pedagogical | ||||||
| Dept. of Education | 115,799 | 117,960 | 119,278 | 2,161 | 3,479 | 62.12% |
| City University | 4,232 | 4,283 | 4,441 | 51 | 209 | 24.40% |
| Subtotal | 120,031 | 122,243 | 123,719 | 2,212 | 3,688 | 59.98% |
| Uniformed | ||||||
| Police | 35,990 | 36,243 | 35,822 | 253 | (168) | (150.60)% |
| Fire | 10,945 | 11,040 | 10,884 | 95 | (61) | (155.74)% |
| Correction | 9,832 | 10,181 | 10,336 | 349 | 504 | 69.25% |
| Sanitation | 7,465 | 7,700 | 7,445 | 235 | (20) | (1,175.00%) |
| Subtotal | 64,232 | 65,164 | 64,487 | 932 | 255 | 365.49% |
| Civilian | ||||||
| Dept. of Education | 12,248 | 12,412 | 11,225 | 164 | (1,023) | (16.03)% |
| City University | 1,917 | 1,879 | 1,907 | (38) | (10) | 380.00% |
| Police | 14,353 | 14,499 | 16,058 | 146 | 1,705 | 8.56% |
| Fire | 5,813 | 6,066 | 5,977 | 253 | 164 | 154.27% |
| Correction | 1,569 | 1,669 | 2,188 | 100 | 619 | 16.16% |
| Sanitation | 2,104 | 2,112 | 2,250 | 8 | 146 | 5.48% |
| Admin. for Children’s Services | 5,972 | 6,218 | 7,116 | 246 | 1,144 | 21.50% |
| Social Services | 13,264 | 13,169 | 15,084 | (95) | 1,820 | (5.22)% |
| Homeless Services | 2,404 | 2,524 | 2,367 | 120 | (37) | (324.32)% |
| Health and Mental Hygiene | 4,508 | 4,857 | 5,550 | 349 | 1,042 | 33.49% |
| Finance | 1,882 | 1,897 | 2,169 | 15 | 287 | 5.23% |
| Transportation | 4,633 | 4,713 | 5,244 | 80 | 611 | 13.09% |
| Parks and Recreation | 4,043 | 4,185 | 4,326 | 142 | 283 | 50.18% |
| All Other Civilians | 28,029 | 28,811 | 31,036 | 782 | 3,007 | 26.01% |
| Subtotal | 102,739 | 105,011 | 112,497 | 2,272 | 9,758 | 23.28% |
| Total | 287,002 | 292,418 | 300,703 | 5,416 | 13,701 | 39.53% |
Overtime
The FY 2018 Preliminary Budget includes $1.324 billion for overtime expenditures, a modest decline of $42 million or 3 percent when compared to the current FY 2017 overtime projection of $1.366 billion. The City has increased uniformed headcount levels at the Police and Fire Departments and the Department of Corrections which has alleviated some of the reliance on overtime usage. Additionally, the FY 2018 Preliminary Budget includes civilian overtime savings of $14 million. Despite these positive developments, overtime projections appear optimistic when compared to actual overtime expenditures of almost $1.7 billion in FYs 2015 and 2016. Consequently, the Comptroller’s Office projects that FYs 2017 and 2018 overtime spending would likely exceed the Financial Plan’s overtime projections by $276 million and $215 million, respectively, as shown in Table 16.
Table 16. Projected Overtime Spending, FY 2017 and FY 2018
($ in millions)
| City
Planned Overtime FY 2017 |
Comptroller’s Projected Overtime
FY 2017 |
FY 2017 Risk |
City
Planned Overtime FY 2018 |
Comptroller’s Projected Overtime
FY 2018 |
FY 2018 Risk |
|
| Uniformed | ||||||
| Police | $502 | $580 | ($78) | $505 | $560 | ($55) |
| Fire | 282 | 282 | 0 | 237 | 237 | 0 |
| Correction | 133 | 245 | (112) | 165 | 220 | (55) |
| Sanitation | 105 | 105 | 0 | 106 | 106 | 0 |
| Total Uniformed | $1,022 | $1,212 | ($190) | $1,013 | $1,123 | ($110) |
| Others | ||||||
| Police-Civilian | $89 | $100 | $(11) | $87 | $100 | $(13) |
| Admin for Child Svcs | 18 | 30 | (12) | 18 | 30 | (12) |
| Environmental Protection | 23 | 40 | (17) | 23 | 40 | (17) |
| Transportation | 53 | 60 | (7) | 50 | 60 | (10) |
| All Other Agencies | 161 | 200 | (39) | 147 | 200 | (53) |
| Total Civilians | $344 | $430 | ($86) | $325 | $430 | ($105) |
| Overtime Civilian Savings | (14) | (14) | 0 | |||
| Total City | $1,366 | $1,642 | ($276) | $1,324 | $1,539 | ($215) |
The FY 2017 overtime budget in the January Plan is $73 million more than the November Plan. Uniformed personnel overtime spending is revised upward by $57 million driven primarily by an increase of $53 million in the Fire Department (FDNY). Through January, the department has spent $153 million for uniformed overtime and the Plan assumes that overtime spending for the current fiscal year will total $282 million. Civilian overtime projections increased by $16 million, reflecting increases of about $11 million for the Department of Transportation and $3 million for the NYPD.
Overtime projections for FY 2018 are revised upwards by $153 million or 13 percent from the November Plan. Approximately 97 percent of the increase is attributable to additional uniformed overtime spending of $78 million for the FDNY and $71 million for the DOC. The increases in the FDNY FYs 2017 and 2018 uniformed overtime budgets bring them in line with recent spending trends and should be sufficient to fund overtime needs in these fiscal years.
However, the Comptroller’s Office expects uniformed overtime spending in DOC and NYPD to exceed their budgeted amounts by a combined $190 million in FY 2017 and $110 million in FY 2018. The Comptroller’s Office estimates that uniformed overtime spending in DOC will total $245 million in FY 2017 and $220 million in FY 2018. This declining trend reflects increases in uniformed headcount which alleviate the need for overtime. While the Comptroller’s Office’s estimate for FY 2017 is only moderately lower than the $255 million spent in FY 2016, the City is estimating a sharper drop to $133 million followed by a moderate increase to $165 million in FY 2018. However, overtime spending through January is already at $136 million, $3 million more than budgeted for the full year. Consequently, the Comptroller’s Office is projecting risks of $112 million in FY 2017 and $55 million in FY 2018 in DOC’s uniformed overtime estimates.
In the Police Department, uniformed overtime spending of $326 million through January 2017 is slightly below the $339 million spent over the same period last fiscal year. Uniformed headcount levels at the NYPD have also increased since the end of FY 2015. If not for the department providing security and handling the protests leading up to and following the President’s inauguration, overtime spending may have been even lower. Given current spending trend, the Comptroller’s Office estimates that overtime spending for FY 2017 will be $580 million, relatively unchanged from the $575 million spent in FY 2016. The current Financial Plan assumes Police uniformed spending of $502 million in FY 2017 and $505 million in FY 2018, resulting in risks of $78 million and $55 million in FYs 2017 and 2018, respectively.
The City has spent $289 million through January for civilian overtime in FY 2017 and is on pace to spend at least $430 million for the entire fiscal year. Civilian overtime cost, which accounts for about 30 percent of total overtime expenditures, has grown steadily for several years with the average cost per full-time civilian employee increasing from $3,266 in FY 2006 to $4,867 in FY 2016.[14] To address this growing concern, the City has proposed initiatives in the January Plan aimed at reducing civilian overtime cost, particularly for trade titles. Under these initiatives, overtime caps will be implemented for skilled trade titles and all other civilians, with expected annual savings of $10 million and $8 million, respectively.[15] Waiver requests to go beyond overtime caps will be reviewed before being approved. Civilian overtime will likely exceed the budgeted amount by $86 million for FY 2017 and $105 million for FY 2018.
Health Insurance
The FY 2018 Preliminary Budget includes $6.465 billion for employees’ and retirees’ pay-as-you-go health insurance, a net increase of $22 million from the November Plan and $489 million higher than budgeted for FY 2017. The increase from FY 2017 reflects a premium rate increase of 7.84 percent for active employees and pre-Medicare retirees. This rate is significantly higher than the increases in recent years which ranged from 1.22 percent in FY 2015 to 4.88 percent for FY 2017. The senior-care rate, which remained relatively flat between FYs 2015 and 2017, is projected to increase by 8 percent for FY 2018.
As shown in Table 17, health insurance costs are projected to increase to $6.958 billion in FY 2019, $7.505 billion in FY 2020 and $8.164 billion by FY 2021, an average annual increase of just over 8 percent. The outyear projections assume annual increases in health insurance premium rates of 7 percent in FY 2019, 6.5 percent in FY 2020 and 6 percent in FY 2021. Senior-care rates are projected to increase by 5 percent annually for FY 2019 to FY 2021.
Table 17. Pay-As-You-Go Health Expenditures
($ in millions)
| FY 2017 | FY 2018 | FY 2019 | FY 2020 | FY 2021 | |
| Department of Education | $2,238 | $2,371 | $2,540 | $2,771 | $3,088 |
| CUNY | 84 | 114 | 122 | 130 | 143 |
| All Other | 3,654 | 3,980 | 4,296 | 4,604 | 4,933 |
| Total Pay-As-You-Go Health Insurance Costs | $5,976 | $6,465 | $6,958 | $7,505 | $8,164 |
The current health insurance projections incorporate savings agreed to in the Healthcare Reform Agreement between the City and the Municipal Labor Committee (MLC).[16] Thus far, as shown in Table 18, the City has achieved cumulative savings of $1.1 billion in FYs 2015 and 2016 and has outlined expected savings of $1 billion for FY 2017. The City has indicated that recurring savings from the initiatives implemented will result in savings of $1.1 billion for FY 2018 and that the additional $150 million needed to realize the FY 2018 targeted amount should be achievable.
So far, most of the savings being achieved results from lower than projected premium rates. This accounted for approximately 60 percent of the FY 2016 savings and is expected to account for 63 percent of the FY 2017 savings. It is likely that most of the savings for FY 2018 will also result from lower than budgeted premium rates. The City had previously projected a premium rate increase of 9 percent for active and pre-Medicare employees compared to the actual rate of 7.84 percent. The senior-care rate is projected to increase by 8 percent in FY 2018. Senior-care rates remained relatively flat between FYs 2012 and 2016 and increased by 4.73 percent for FY 2017 and it is likely that the actual rate increase will again be lower than projected.
Table 18. Health Reform Savings
($ in millions)
| FY 2015 | FY 2016 | FY 2017 | |
| HIP Premium Rate Savings | $17 | $343 | $544 |
| GHI Senior-Care Premium Savings | 38 | 77 | 100 |
| Dependent Eligibility Verification Audit (DEVA) | 108 | 110 | 103 |
| Mental Health Parity “Relief” | 148 | 0 | 0 |
| Funding Structure Change in GHI Plan | 58 | 61 | 41 |
| GHI CBP Program Changes | 0 | 0 | 85 |
| HIP HMO Preferred Plan | 0 | 3 | 63 |
| Changes to Care Management Program | 19 | 38 | 39 |
| Specialty Drugs (PICA) Program Changes | 8 | 32 | 32 |
| Reduction in Empire Blue Cross Blue Shield Admin Charges | 4 | 0 | 0 |
| Lower Radiology Fees | 0 | 3 | 20 |
| Lower Durable Medical Equipment (DME) Fees | 0 | 0 | 1 |
| Out-Of-Network Pricing Adjustment – Behavioral Mgmt. Program | 0 | 0 | 3 |
| Diabetes Case Management | 0 | 1 | 1 |
| Buy-Out Waiver Incentive Pilot Program | 0 | (3) | (3) |
| Stabilization Fund Adjustment | 0 | 36 | 0 |
| Total | $400 | $700 | $1,028 |
SOURCE: NYC Office of Labor Relations.
Pensions
Pension contributions are projected to grow moderately over the Financial Plan period, increasing from $9.301 billion in FY 2017 to $10.058 billion by FY 2021. The average annual growth of 2.0 percent in pension contributions is below total expenditure growth of 3 percent. The projected contributions include funds in reserve for the additional cost resulting from lower than projected FY 2016 actual investment returns, headcount changes, and other minor adjustments. Projected pension contributions in the January Plan are relatively unchanged from the November Plan as shown in Table 19. The January Plan incorporates the impact of the restatement of Board of Education Retirement System’s (BERS) assets effective June 30, 2015, which lowers projected pension contribution by $9 million annually.
Table 19. FY 2017 – FY 2021 City Pension Contributions
($ in millions)
| FY 2017 | FY 2018 | FY 2019 | FY 2020 | FY 2021 | |
| Five Actuarial Systems | $9,232 | $9,411 | $9,540 | $9,464 | $9,539 |
| Reserve for Expected Adjustments* | 26 | 242 | 389 | 513 | 456 |
| Non-Actuarial Systems | 70 | 75 | 80 | 83 | 83 |
| Non-City Systems | 85 | 89 | 91 | 92 | 92 |
| Less: Intra City-Expense | (112) | (112) | (112) | (112) | (112) |
| Net Pension Expense January Plan | 9,301 | 9,706 | 9,987 | 10,040 | 10,058 |
| Net Pension Expense November Plan | 9,310 | 9,718 | 9,997 | 10,049 | 10,067 |
| Net Change | ($9) | ($12) | ($10) | ($9) | ($9) |
*The reserve is being held to accommodate expected changes in headcount, valuation refinements, and salary adjustments.
**Totals may not add up due to rounding.
Through January 31, 2017, preliminary figures indicate that the pension funds have experienced investment gains of about 6 percent. The Financial Plan projections are based on the assumption that pension investments will earn the actuarial interest rate assumption (AIRA) of 7 percent.[17] Each percentage point in investment return above or below the AIRA in FY 2017 will, respectively, lower or increase pension contributions by approximately $22 million in FY 2019, $44 million in FY 2020, and $66 million in FY 2021.
As shown in Chart 4, the City’s expenditures for pension contributions grew at an average annual rate of almost 19 percent between FY 2001 and FY 2012. This was due primarily to lower than assumed investment returns and benefit enhancements. Beginning in FY 2012, the implementation of new actuarial assumptions and methodologies and the introduction of less expensive pension plans for new employees, together with an average investment return of 8.4 percent for July 1, 2012 to June 30, 2016, slowed the growth of pension contributions. For that period pension expenditures grew at an average annual rate of approximately 4 percent. Pension contributions are projected to increase at an annual average rate of 1.6 percent between FYs 2016 and 2021, even after incorporating the costs resulting from recent labor-settlements for employees and the introduction in FY 2016 of new sets of probability tables of post-retirement mortality.
Chart 4. City’s Pension Expenditures
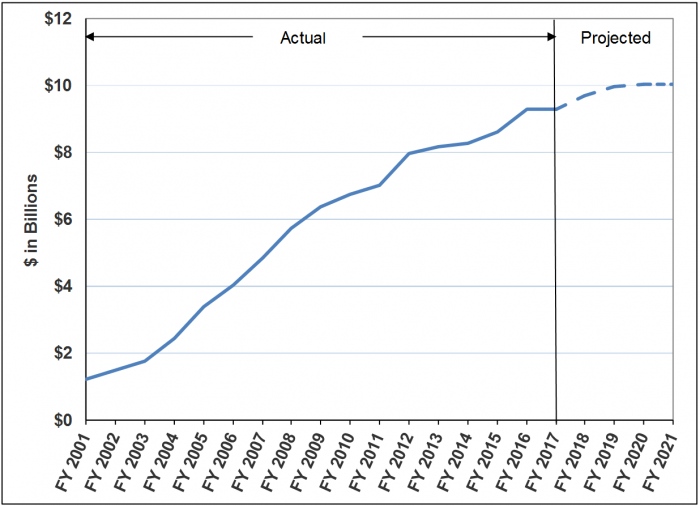
Independent Actuarial Audit
Pursuant to Section 96 of the New York City Charter, the Comptroller’s Office has engaged Bolton Partners, Inc. (“Bolton”) to conduct two consecutive biennial independent actuarial audit engagements. The engagements consist of audits of employer contributions for FY 2016 and FY 2018 to validate actuarial calculations and methods, experience studies of data through fiscal year-ends of 2015 and 2017 to validate actuarial assumptions, and administrative reviews of the City’s collection and processing of actuarial data. The audit process has begun and Bolton is expected to release final reports for their second engagement in 2019.
Labor
On February 27, 2017, the Patrolmen’s Benevolent Association (PBA) announced the ratification of a labor contract with the City covering a five-year period from August 1, 2012 to July 31, 2017. This contract period follows the two-year period from August 1, 2010 to July 31, 2012 for which the New York State Public Employment Relations Board (PERB) rendered a final decision for annual wage increases. The contract grants wage increases of 9 percent and brings the PBA in line with the pattern established by other uniformed settlements for the current round of collective bargaining. Together with the previous two-year contract, PBA members will receive wage increases totaling 11 percent by the end of the contract period.
The contract also includes a 2.25 percent differential for officers’ community policing work, effective March 15, 2017. The City agreed to this differential to compensate for the additional responsibilities of police officers following the implementation of community policing. Over the Plan period, this additional cost will be partially offset by a modification to the salary schedules of new officers. Table 20 below compares the current salary adjusted for proposed wage increases with the proposed salary for officers hired after March 15, 2017. Over a five and a half year period, base salaries earned by these officers will be approximately 11 percent less than that earned under the current salary schedule adjusted for wage proposed increases.[18] As a result, while there will be additional cost associated with the 2.25 percent differential in the first four years of the Plan period, the cost will be offset by FY 2021 and the new schedule will generate net savings thereafter. We estimate the cost over the first four years to be $12 million in FY 2017, $32 million in FY 2018, $43 million in FY 2019 and $28 million in FY 2020.
Table 20. Proposed Five and a Half-Year Salary Schedule
| Current Salary Schedule
(a) |
Proposed Salary Schedule (b) | Current Salary Schedule Adjusted for Wage Increases (c) | |
| First 1.5 Years | $42,819 | $42,500 | $46,805 |
| After 1.5 Years | $44,521 | $45,000 | $48,666 |
| After 2.5 Years | $49,760 | $46,000 | $54,394 |
| After 3.5 Years | $54,341 | $47,000 | $59,401 |
| After 4.5 Years | $57,747 | $51,000 | $63,125 |
| After 5.5 Years | $78,026 | $85,292 | $85,292 |
Other highlights of the contract include:
- The City has agreed to support State legislation to improve accidental disability retirement benefits for police officers hired beginning July 1, 2009 and thereafter.[19] This benefit will enable the officers to qualify for a non-taxable disability allowance equal to three-quarters of final average salary (FAS). The agreement with the PBA includes provisions for affected officers to partially fund this benefit through a contribution of an additional 1.0 percent of their salary.
The City and the PBA have agreed to expand the use of body cameras. Under a pilot program, the NYPD currently has 1,000 cameras being used in 20 precincts. The agreement calls for increasing that amount to 5,000 by July 2018 and to have all patrol officers outfitted by the end of 2019.
The contract will cost the City approximately $530 million through the end of the contract. Some of this cost will be offset by health insurance cost savings resulting in a net cost of $337 million. The Financial Plan includes funding for the PBA’s contract based on the pattern of the contracts with other uniformed employees. Since the effective dates of the wage increases negotiated in this contract differ from the dates used in calculating the funding in the Plan, for FY 2017 it will cost an additional $30 million in retroactive payments, excluding the additional cost associated with the 2.25 percent differential. Several of the current labor contracts will expire in FY 2018 and FY 2019, as shown in Table 21. The labor reserve contains funds for a 1.0 percent increase annually for the entire workforce beyond the current round. The current balance in the labor reserve is $261 million in FY 2017, $946 million in FY 2018, $1.911 billion in FY 2019, $2.268 billion in FY 2020, and $2.713 billion in FY 2021.
Table 21. Labor Contracts Expiring in FY 2018 and FY 2019
|
Expiration Dates |
|
| District Council 37 | 07/02/2017 |
| Uniformed Firefighters Association | 07/31/2017 |
| Patrolmen’s Benevolent Association* | 07/31/2017 |
| Organization of Staff Analyst | 08/24/2017 |
| Uniformed Fire Officers Association | 03/19/2018 |
| Communications Workers of America | 05/05/2018 |
| Sergeants Benevolent Association | 08/29/2018 |
| Uniformed Sanitation Chiefs Association | 10/09/2018 |
| Lieutenants Benevolent Association | 10/31/2018 |
| United Federation of Teachers | 11/30/2018 |
| United Sanitationmen’s Association | 01/19/2019 |
| Correction Officers’ Benevolent Association | 02/28/2019 |
| Detectives’ Endowment Association | 03/31/2019 |
| Council of School Supervisors and Administrators | 04/20/2019 |
| Captains Endowment Association | 04/30/2019 |
Public Assistance
Through January 2017, the City’s public assistance caseload has averaged 371,753 recipients per month in the current year. The average monthly caseload thus far in FY 2017 has increased by roughly one percent, or 4,031 recipients compared to average monthly caseload of 367,722 over the same period in FY 2016. Since rebounding from a low of 336,403 in May 2014, the number of public assistance recipients has largely fluctuated within a range of 367,000-375,000 recipients per month over the past twelve months. Thus far, public assistance grants spending has averaged about $119 million per month in the current fiscal year, showing a modest increase from the average for the same period in FY 2016.
The City’s Financial Plan maintains caseload projections at monthly averages of 386,610 for FY 2017 and 388,600 over the remainder of the plan period, unchanged since the June Plan. Total baseline grants expenditures are projected at approximately $1.48 billion in FY 2017 and $1.49 billion in each of FYs 2018-2020. Both caseload and grants levels are currently running below the City’s projections, which may result in offsets of $15 million in FY 2017 and $10 million annually in each of the outyears.
Homeless Services
The City’s homeless services spending is primarily driven by the Department of Homeless Services (DHS). However, funding for homeless assistance is also drawn from the budgets of other agencies, including the Department of Social Services (DSS) and the Department of Youth and Community Development (DYCD). Table 22 details funding for seven major categories of homeless services across these three agencies.
Table 22. Citywide Funding by Major Categories for Homeless Services
($ in millions)
| FY 2014 | FY 2017 | FY 2018 | FY 2019 | FY 2020 | |
| Adult Shelter Operations | $326 | $509 | $374 | $364 | $353 |
| Family Shelter Operations | $505 | $807 | $791 | $791 | $790 |
| Rental Assistance | $23 | $189 | $233 | $274 | $317 |
| Prevention, Diversion, Anti-Eviction & Aftercare | $82 | $400 | $354 | $354 | $347 |
| Domestic Violence, Youth & Emergency Shelters | $88 | $123 | $154 | $158 | $158 |
| Homeless Administration & Support | $151 | $268 | $247 | $254 | $261 |
| Total Citywide Homeless Spending | $1,175 | $2,295 | $2,153 | $2,195 | $2,227 |
Citywide homeless services expenses in the January Plan are set to drop by 6.2 percent from $2.295 billion in FY 2017 to $2.153 billion in FY 2018. This decline follows a remarkable 95 percent escalation in recent homeless services spending, from $1.175 billion in FY 2014 to $2.295 billion in FY 2017. Rental assistance expenditures are among the most prominent drivers of the City’s homeless services budget, with total FY 2018 spending anticipated to be more than ten times greater than the FY 2014 amount. However, substantial spending increases for shelter operations, prevention and aftercare, emergency shelters and administrative costs have also been contributing factors. In FY 2018, it is anticipated that 79 percent of adult shelter operation expenses and 37 percent of family shelter operation expenses will be funded by the City, with Federal and State funding accounting for the remainder.
Notable among the programmatic increases in the homeless services budget is spending for a new cohort of the Living in Communities (LINC) program which has an explicit public housing element. The City has budgeted an initial $9 million for “NYCHA LINC” rental assistance in FY 2017, which will increase to $18.4 million by FY 2018. Ultimately, the City plans to more than quadruple its first-year spending on NYCHA LINC by FY 2020. Other rental assistance expenditures in the January Plan, including the original LINC programs, City Family Eviction Prevention Supplement (FEPS) and Tenant Based Rental Assistance are set to stabilize in FYs 2018-2020, relative to FY 2017 levels.
One programmatic area that the City has likely underfunded is adult shelter operations, which are set to decline by 26.5 percent from $509.4 million in FY 2017 to $374.3 million in FY 2018. The Comptroller’s Office estimates that a single adult shelter census reduction of more than 3,700 people would be required in order for DHS to realize its planned 26.5 percent funding reduction in FY 2018. This will be an ambitious challenge given that the single adult shelter population has been persistently increasing. The single adult shelter population has risen by 6.5 percent since the start of FY 2017 and by 38 percent since January 1, 2014. In the absence of swift and successful new policies or programming to supplement the City’s existing efforts to reduce the adult shelter population, the planned reduction of $135 million for adult shelter operations in FY 2018 appears to be implausible. Reduced expenses for prevention and aftercare, driven largely by cuts to HomeBase funding in FY 2018, are also cause for concern. The City considers HomeBase to be “a cornerstone of its homelessness prevention efforts” and data provided to the Comptroller’s Office by DHS indicate that household enrollments at HomeBase have steadily increased since the start of FY 2015. If a decline in demand for HomeBase services does not materialize in FY 2018, it could pose an additional risk to projected spending amounts for prevention and aftercare. With these and other factors considered, the Comptroller’s Office projects a net City-funds risk of $132 million each year beginning FY 2018.
Department of Education
The January Modification shows a net increase of $57 million in the Department of Education’s (DOE) FY 2017 budget. The DOE budget now totals $23.27 billion in FY 2017, an increase of 4 percent or $895 million above actual FY 2016 spending of $22.37 billion. The funding increase in the January Modification for the current year includes new needs totaling $41 million mainly for broadband and data center upgrades to provide high-speed internet access in the schools ($24 million) and enhancements for the Department’s Special Education Student Information System ($13 million). Other major changes include adjustments for collective bargaining of $9 million for the Fashion Institute of Technology, fringe benefits costs of $15 million and a roll of $5 million in Federal Community Development Block Grants (CDBG). In addition, the City anticipates savings of $15 million from a recent State law change that improves claiming processes for special education itinerant services and funding shifts of $43 million from increased funding for career education and academic improvement. These two actions represent the DOE portion of the Citywide Savings Program at $58 million in FY 2017.
The FY 2018 Preliminary Budget projects DOE funding of $24.32 billion, representing an increase of $1.05 billion or 4.5 percent from the FY 2017 budget. Compared to the November Plan, the Preliminary Budget reflects a net increase of $65 million. The majority of the changes are continuation of initiatives reflected in FY 2017, with incremental increases of $10 million in new needs mainly attributable to expansion of the Summer in the City program and $3 million in Federal CDBG funds, partly offset by an additional $5 million in information technology savings.
With regard to the State Executive Budget, the Governor has proposed to increase formula-based school aids by $295 million to the City in the upcoming school year, including $241 million in Foundation Aid. While the proposed school aids fall short by $264 million compared with the City’s assumptions, the Legislature has traditionally provided additional aid to school districts during budget adoption. In addition, as outlined in the Mayor’s testimony to the Legislature, the State budget also includes a number of education proposals that could prove costly to the City if enacted by the Legislature. Foremost among these proposals is the potential increase in tuition rates paid to charter schools which according to City estimates could negatively impact its financial plan by nearly $200 million in FY 2018.
Over the remainder of the Plan, the DOE budget is projected to rise to $25.19 billion in FY 2019 and $25.72 billion in FY 2020, before reaching $26.3 billion in FY 2021. Compared to FY 2017 funding levels, the Department’s budget reflects growth of 13 percent, or roughly $3 billion, over the outyears of the Plan. Additional State support is expected to comprise about $1.54 billion or 51 percent of the total growth over this period, with City-funds almost exclusively making up the remainder of the increase.
The Department will likely continue to face risks from its assumptions of Federal Medicaid reimbursement in the January Plan. The DOE estimates it will realize $41 million in Medicaid reimbursement of special education related services costs in FY 2017 and $97 million annually in the outyears. The Department realized only $18 million in Medicaid revenue in FY 2016 and an annual average of $16 million over the past five years. Therefore, the Comptroller’s Office projects DOE Medicaid revenue risks of $20 million in FY 2017 and $70 million in each of FYs 2018-2021. The City also faces additional pressure from a State proposal that threatens to reduce reimbursement for Medicaid administration to the City by $50 million unless the DOE can increase Medicaid collections by $100 million beginning next year, as well as identify $50 million in Medicaid Savings.
Debt Service
As shown in Table 23, debt service in the January 2017 Plan, net of prepayment adjustments, is projected to grow from $6.46 billion in FY 2017 to $8.45 billion in FY 2021, an increase of $1.99 billion, or an average annual growth of 6.9 percent.[20]
Table 23. January 2017 Financial Plan Debt Service Estimates
($ in millions)
| Debt Service Category | FY 2017 | FY 2018 | FY 2019 | FY 2020 | FY 2021 | Change from FYs 2017 – 2021 |
| GOa | $3,971 | $4,134 | $4,209 | $4,537 | $4,695 | $724 |
| TFAb | 2,187 | 2,225 | 2,848 | 3,127 | 3,381 | 1,194 |
| Lease-Purchase Debt | 230 | 223 | 244 | 297 | 296 | 66 |
| TSASC, Inc. | 74 | 82 | 82 | 82 | 82 | 8 |
| Total | $6,462 | $6,664 | $7,383 | $8,043 | $8,454 | $1,992 |
Source: January 2017 Financial Plan.
Note: Debt service is adjusted for prepayments.
a Includes long-term GO debt service.
b Amounts do not include TFA BARBs.
These projections represent decreases from the November 2016 Financial Plan of $85 million in FY 2017, $334 million in FY 2018, $83 million in FY 2019, and $72 million in FY 2020.[21]
The decrease in planned FY 2017 debt service is the result of a $48 million reduction in GO debt service, and $37 million in estimated TFA savings. Of the $48 million decline in GO debt service, $66 million is the result of lowering estimates for current year interest costs for GO Variable Rate Demand Bonds (VDRBs), partially offset by $16 million of debt service costs due to an acceleration of projected GO borrowing in the first-half of FY 2017. As a result, the City does not anticipate further GO borrowing in the second-half of FY 2017. The $37 million savings for TFA is a result of lower projected VRDB interest costs.
The reduction in estimated debt service from the November 2016 Plan for FY 2018 is comprised of GO debt service savings of $85 million and TFA savings of $249 million. GO savings in FY 2018 result primarily from the elimination of short-term note borrowing and the attendant $75 million interest cost along with $11 million of other miscellaneous baseline adjustments. The $249 million decrease in TFA debt service costs in FY 2018 comes from the use of excess building aid revenue retention for BARBs purposes in prior years, and availing those resources to pay TFA Future Tax Secured (FTS) debt service.[22]
The FYs 2019 and 2020 decreases from the November Plan of $83 million and $72 million, respectively, come primarily from the elimination of short-term note borrowing over the Plan period.
Debt Affordability
Debt service as a percent of local tax revenues is a useful measure of debt affordability used by the financial sector and government officials alike. The January 2017 Plan projects that debt service will consume 11.7 percent of local tax revenues in FY 2017, 11.6 percent in FY 2018, 12.3 percent in FY 2019, 12.8 percent in FY 2020 and 13.0 percent in FY 2021, as shown in Chart 5.[23] The increasing ratio is the result of the City’s debt service growing at a faster rate than its tax revenues. Between FY 2017 and FY 2021 the City’s debt service is estimated to grow by 31 percent, resulting in an annual growth rate of 6.9 percent over the Financial Plan period. In contrast, the estimated annual tax revenue growth for the same period is 4.3 percent. Beyond FY 2021, the ratio declines to 12.2 percent by FY 2027 as borrowing tapers off due to a less-defined capital plan.[24] If capital commitments and expenditures remain higher in the later years, and if annual tax revenue growth were to average less than the assumed 4.5 percent, the debt service ratio would not decline as quickly as projected in the Ten-Year Capital Strategy (TYCS).
Chart 5. Debt Service as a Percentage of Tax Revenues, 1992 – 2027
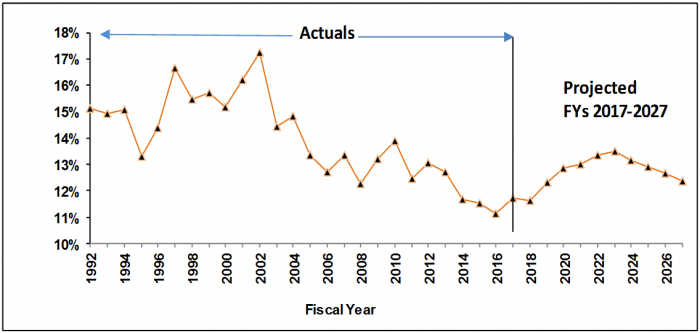
Source: NYC Office of Management and Budget, January 2017 Financial Plan.
Financing Program
The January 2017 Financial Plan contains $47.8 billion of planned City and State supported borrowing in FYs 2017 – 2021, as shown in Table 24. GO and TFA FTS borrowing account for over 78 percent of total borrowing over this period. Planned TFA bonds total $19.25 billion while estimated GO borrowing totals $18.33 billion.
Planned borrowing over FYs 2017 – 2020 is $619 million higher than the November Plan, attributable to increased TFA/GO borrowing of $290 million along with $317 million increase in New York City Municipal Water Finance Authority (NYW) borrowing.[25]
Planned NYW FYs 2017 – 2021 borrowing of $8.94 billion accounts for a significant 18.7 percent of the City’s capital borrowing plan during this period. However, unlike other debt that is financed by revenues derived from collection of the property tax and other General Fund revenues, NYW debt service is funded by water and sewer user fees that are collected directly by the NYC Water Board. As a result, neither the water and sewer user fees nor the NYW debt service is included in the City’s General Fund.
While total borrowing averages $8.2 billion over FY 2017 and FY 2018, it does increase to an annual average of $10.47 billion over FYs 2019-2021, or an increase of 28 percent. More specifically, GO/TFA averages $6.09 billion in FYs 2017 and 2018, then increases to $8.47 billion per year from FYs 2019-2021, or an increase of 39 percent.
Table 24. January 2017 Financing Program, FYs 2017 – 2021
($ millions)
| Description: | Estimated Borrowing and Funding Sources FYs 2017-2021 | Percent of Total |
| General Obligation Bonds | $18,331 | 38.3% |
| TFA – PIT Bonds | 19,250 | 40.3 |
| NYC Water Finance Authority | 8,941 | 18.7 |
| TFA – BARBs | 1,285 | 2.7 |
| Total | $47,807 | 100.0% |
Source: NYC Office of Management and Budget, January 2017 Financial Plan.
Low market interest rates have allowed the City to realize debt service savings over the past several years. At the current planned GO and TFA FTS borrowing levels of $6.70 billion in FY 2018, $8.44 billion in FY 2019, $8.70 billion in FY 2020, and $8.26 billion in FY 2021, every one percentage point increase to current rates would reduce savings by $34 million in FY 2018, $109 million in FY 2019, $195 million in FY 2020, and $280 million in FY 2021.
Capital Commitment Plan
The January 2017 Capital Commitment Plan for FYs 2017 – 2020 contains $64.05 billion in authorized all-funds commitments, as shown in Table 25.[26] City-funds commitments account for $57.29 billion of the total, as shown in Table 26. All-funds commitments increased by $4.21 billion, or 7 percent, from the October 2016 Commitment Plan.
All-Funds Commitments
All-funds commitments, after adjusting for the $6.52 billion reserve for unattained commitments, totals $57.53 billion. The authorized Plan is somewhat front-loaded with 31.3 percent of all-funds commitments scheduled for FY 2017.
As is typical, capital commitments for DOE and CUNY, the Department of Environmental Protection (DEP), the Department of Transportation (DOT) and Mass Transit, and Housing and Economic Development account for 65.4 percent of all-funds commitments.[27]
Table 25. FYs 2017 – 2020 Capital Commitments, All-Funds
($ in millions)
| Project Category | January FYs 2017– 2020 Commitment Plan | Percent of Total |
| Education and CUNY | $12,556 | 19.6% |
| Environmental Protection | 11,637 | 18.2 |
| Dept. of Transportation and Mass Transit | 10,389 | 16.2 |
| Housing and Economic Development | 7,326 | 11.4 |
| Administration of Justice | 4,987 | 7.8 |
| Resiliency, Technology and Equipment | 3,690 | 5.8 |
| Parks Department | 4,095 | 6.4 |
| Hospitals | 2,324 | 3.6 |
| Other City Operations and Facilities | 7,042 | 11.0 |
| Total | $64,046 | 100.0% |
| Reserve for Unattained Commitments | ($6,515) | N/A |
| Adjusted Total | $57,531 | N/A |
Source: NYC Office of Management and Budget, FYs 2017 – 2020 January Capital Commitment Plan, January 2017.
The net increase of $4.21 billion from the October 2016 Plan is comprised of increases of $785 million in FY 2017, $776 million in FY 2018, $1.14 billion in FY 2019, and $1.51 billion in FY 2020.
A significant portion of the FY 2017 increase stems from increases in highways and bridges related projects in the amount of $291 million, water pollution control projects for $119 million, and the Parks Department with an increase of $112 million.
The addition of $776 million in FY 2018 is driven by increases of $124 million in economic development projects, $112 million in the Parks Department, $112 million in public buildings projects, and $111 million to the Police Department.
The increase of $1.14 billion in FY 2019 is driven by a $296 million increase in highways and street related projects. In addition, there is an increase of $227 million to the Parks Department, $222 million for the Police Department driven primarily by the new Firearms training facility, along with $146 million of economic development projects, and $143 million for sewers related projects.
The additional $1.51 billion in FY 2020 is driven by increases of $307 million in water pollution control projects, $238 million for sewer projects, $215 million for water mains, and $146 million for highways and streets related projects.
City-Funds Commitments
City-funds commitments in the January 2017 Capital Commitment Plan totals $57.29 billion, an increase of $4.19 billion from the Adopted Commitment Plan over FYs 2017 – 2020. After adjusting for the reserve for unattained commitments of $6.52 billion, City-funds commitments total $50.77 billion, as shown in Table 26. DEP, Education and CUNY, DOT and Mass Transit, along with Housing and Economic Development (Business Services) account for 66.2 percent of City-funds commitments over the FYs 2017-2020 period.
Major increases from the Adopted Commitment Plan include:
- An increase of $1.1 billion in DEP for Water Mains ($410 million), sewer projects ($389 million), and water pollution control related projects ($302 million).
- A $540 million increase to the Parks Department including $82 million for Street and Park Tree Planting, and $55 million for site acquisition to enable the creation of Bushwick Inlet Park.
- An increase of $530 million in DOT for highway construction and reconstruction projects, including increased street repaving and resurfacing efforts ($146 million).
- An increase of $346 million in the Police Department, including $275 million for the rehabilitation of the Rodman’s Neck site in the Bronx for a new firearms and tactical training facility.
Table 26. FYs 2017 – 2020 Capital Commitments, City-Funds
($ in millions)
| Project Category | January FYs 2017– 2020 Commitment Plan | Percent of Total |
| Environmental Protection | $11,362 | 19.8% |
| Education and CUNY | 11,178 | 19.5 |
| Dept. of Transportation and Mass Transit | 8,608 | 15.0 |
| Housing and Economic Development | 6,831 | 11.9 |
| Administration of Justice | 4,848 | 8.5 |
| Resiliency, Technology and Equipment | 3,248 | 5.7 |
| Parks Department | 3,566 | 6.2 |
| Hospitals | 1,011 | 1.8 |
| Other City Operations and Facilities | 6,637 | 11.6 |
| Total | $57,289 | 100.0% |
| Reserve for Unattained Commitments | ($6,515) | N/A |
| Adjusted Total | $50,774 | N/A |
Source: NYC Office of Management and Budget, FYs 2017-2020 February Capital Commitment Plan, January 2017.
Preliminary Ten-Year Capital Strategy
The City is required by Sections 215 and 234 of the City Charter to issue a Preliminary Ten-Year Capital Strategy (the Preliminary Strategy) every odd calendar year. The Preliminary Ten-Year Capital Strategy for FYs 2018 – 2027 totals $89.56 billion – $83.26 billion of City-funds and $6.3 billion in non-City funds. This is a $5.78 billion, or 6.9 percent, increase from the last Ten-Year Capital Strategy published in May 2015, as shown on Table 27.
Table 27. Preliminary Ten-Year Capital Strategy, FYs 2018 – 2027, January 2017, Comparison to the 2015 Ten-Year Capital Strategy, May 2015
($ in millions)
| May 2015 Capital Strategy – City-Funds |
May 2015 Capital Strategy – All-Funds |
January 2017 Capital Strategy – City-Funds | January 2017 Capital Strategy – All-Funds | Change in City-Funds | Change in All-Funds | |
| Education (DOE and CUNY) |
$20,749 | $23,435 | $18,590 | $20,764 | ($2,159) | ($2,671) |
| Environmental Protection |
14,381 | 14,688 | 17,453 | 17,651 | 3,073 | 2,962 |
| DOT and Transit | 10,978 | 13,422 | 13,453 | 15,306 | 2,475 | 1,884 |
| Housing ( HPD and NYCHA) | 7,773 | 8,357 | 8,904 | 9,231 | 1,131 | 874 |
| Business Services | 3,289 | 3,380 | 2,793 | 2,946 | (495) | (434) |
| All Other | 18,329 | 20,496 | 22,067 | 23,658 | 3,737 | 3,163 |
| Total | $75,499 | $83,778 | $83,261 | $89,556 | $7,762 | $5,778 |
Source: Preliminary Ten-Year Capital Strategy, Fiscal Years 2018-2027, January 2017 and the Ten-Year Capital Strategy, FYs 2016-2025, May 2015.
Similar to patterns of other Ten-Year Strategies, all-funds projects for Education, DEP, Housing (including NYCHA), and DOT/Transit constitute 70.3 percent of the current preliminary Strategy. The categories with the largest changes from the prior capital strategy are a decrease of $2.67 billion in Education (DOE), and increases of $2.96 billion in DEP, $1.88 billion in DOT/Transit, and $874 million in HPD and NYCHA, with NYCHA increasing its City-funds commitments by $715 million.
In addition, the current capital strategy contains three major “lifecycle” project categories: State of Good Repair which involves fixing and repairing facilities and infrastructure, Program Expansion which involves adding new or expanding current facilities and infrastructure, and Programmatic Replacement which involves replacing facilities or equipment. Those capital efforts entitled State of Good Repair are allocated $47.6 billion followed by $23.1 billion for Program Expansion, and $18.8 billion for Programmatic Replacement as shown in Chart 6.
Chart 6. Ten-Year Capital Strategy, FYs 2018-2027, All Funds
($ in millions)
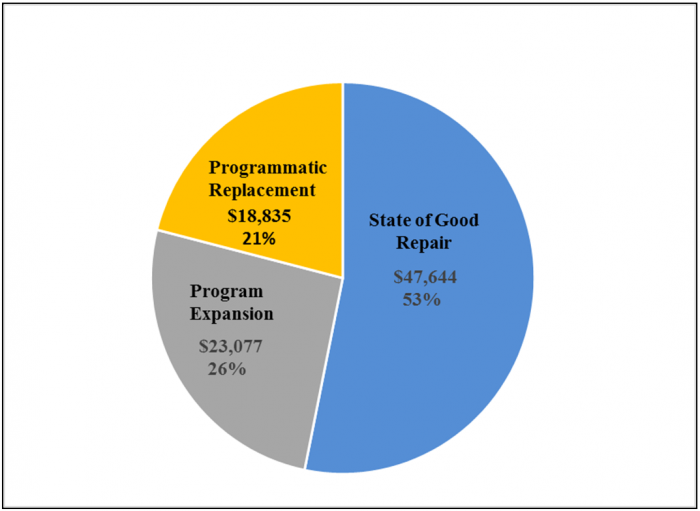
Source: NYC OMB, January 2017 Ten-Year Capital Strategy.
Examples of state of good repair projects are $12.4 billion for the reconstruction of schools; $8.2 billion for East River and other Bridge reconstruction; and $5.4 billion for the reconstruction and resurfacing of streets and highways.
Some examples of program expansion projects include $7.6 billion for new school construction and expansion, which includes the construction of new schools at a cost of $4.5 billion and an additional 38,487 seats, and $3.1 billion for improvements to leased facilities, athletic fields and playgrounds and building additions; $4.5 billion for new and special needs housing; and $2.2 billion for the construction of the third water tunnel, including the Kensico City Tunnel.
Programmatic replacement projects include such items as $3.6 billion of upgrades to water pollution control plants; $2.5 billion for water main replacements and dam safety programs; and $2.0 billion for citywide information systems and equipment.
Major Programmatic Agencies
Education
The Department of Education (DOE) and CUNY capital programs account for $20.76 billion in all-funds, or 23.2 percent of the Preliminary Strategy. DOE programs include:
- Rehabilitation of School Components with a forecast total of $7.66 billion over the period. This area of work is dedicated to keeping major building and playground components in a state of good repair, including roofs, parapets and new windows.
- System Expansion with $4.51 billion to create new seats.
- Other System Expansion with $3.13 billion for the renovation of leased space, building additions, new athletic fields and playgrounds.
- $3.13 billion for the category of Emergency, Inspection, and Miscellaneous, which is comprised of mayoral/council program, administrative costs, emergency projects, research and development, along with funds to complete prior plan projects.
- $1.27 billion for Educational Enhancements. This category is technology driven, with eligible computer purchases, network upgrades, approved software enhancements, along with re-wiring projects to better access the internet. Upgrades and replacements of science labs are part of this category as well.
- $390 million from the Smart Schools Bond Act approved by voters in November 2014 from an original allocation of $783 million. This allocation will be used for technological enhancements, additional pre-kindergarten capacity, along with removal of transportable classroom units. The remaining $393 million is expected to be committed in FY 2017, pending State approval.
- $331 million allocated for safety and security projects which include security systems, emergency lighting, and miscellaneous code compliance projects.
Total commitments for Education are $2.7 billion less than the May 2015 Ten-Year Capital Strategy. The decrease stems primarily from a $2.98 billion decrease in DOE’s Rehabilitation of School Components. Other changes include:
- An increase of $832 million for System Expansion – New Schools.
- An increase of $1.37 billion for System Expansion – Other.
- An increase of $195 million for Emergency, Unspecified, and Miscellaneous projects.
- A decrease of $1.42 billion for Educational Enhancements.
- A decrease $390 million in the Smart Schools Bond Act (Another $390 million is in FY 2017).
- A decrease of $236 million in the Safety and Security category.
Department of Environmental Protection
The Department of Environmental Protection (DEP) capital programs account for $17.65 billion in all-funds, or 19.7 percent of the Preliminary Strategy total. DEP capital projects are divided into five program areas: water pollution control; water mains, sources and treatment; sewer related projects; water supply; and equipment purchases.
Water pollution control projects total $6.61 billion and involve capital work at wastewater treatment plants, including projects to improve storm water capture, and conform to water quality mandates. These projects include:
- Plant Upgrading and Reconstruction, which constitutes 54 percent of water pollution control projects at $3.56 billion. The primary charge of this category is the reconstruction or replacement of components, or related conveyance infrastructure at in-City wastewater treatment plants, including $538 million for plant upgrades that will reduce carbon emissions and make plants more energy efficient, and $360 million for upgrades to the North River Wastewater Treatment Plant.
- $1.86 billion for capital projects related to water quality mandates. The majority of the funding will be used for measures to prevent combined-sewer overflow (CSO) into local harbor waters, including $735 million for CSO storage tanks at the Gowanus Canal in Brooklyn.
- The Green Infrastructure program is funded at $909 million. To assist in reducing CSO issues, this program is seeking natural water absorption strategies through the use of constructed wetlands, bioswales, tree pits, green roofs, and permeable pavement projects throughout the City.
The water mains, sources, and treatment program area, which has been allocated $4.02 billion in the Preliminary Strategy, is dedicated to the upkeep of the water supply at its source and its related distribution systems. These projects include:
- The category of Trunk and Distribution Main replacement, which is funded at $1.59 billion, including $650 million for a variety of state-of-good repair projects citywide, as well as $404 million for water main replacement in conjunction with DOT street reconstruction and coordinating Vision Zero initiatives, and $237 million for emergency water main work.
- The category of Water Quality Preservation programs for which $947 million of resources are dedicated. This includes $145 million for the reconstruction of the New Croton Dam and $126 million for the continued rehabilitation of the Catskill Aqueduct between the Kensico and Hillview reservoirs in Westchester County.
- The Dam Safety program of $878 million, primarily made up of the $733 million rehabilitation of the Ashokan Reservoir upstate.
- Two programs totaling $33 million, the Bluebelt program and Water for the Future, which will provide resources to connect natural storm water drainage corridors along with Water for the Future projects to allow for the temporary shutdown of the Delaware Aqueduct.
Sewer related projects throughout the City contain $4.26 billion in the Preliminary Strategy. Included in this are:
- A $1.42 billion allocation for the Replacement or Augmentation of Existing Systems. Included in this category is $535 million for the continued sewer build-out in Southeast Queens, $329 million for the provision of sewer infrastructure to accommodate rezoning in coordination with the Department of City Planning. Another $217 million is scheduled for sewer replacement in partnership with DOT street reconstruction and Vision Zero projects.
- $1.07 billion for the Replacement of Chronically Failing Components to address malfunctioning or collapsed combined sewers. About $635 million of this allocation is reserved for emergency work citywide, along with $107 million of sewer replacement in concert with DOT priorities.
- $799 million for Programmatic Replacement and Reconstruction for the reconstruction of storm and sanitary sewers with an emphasis on Southeast Queens ($740 million).
- Just over $350 million for the Bluebelt program for storm water management plan focused in mid Staten Island.
The Water Supply program was allocated $2.36 billion over the Preliminary Strategy period. This includes:
- $339.5 million for City Water Tunnel No. 3, Stage 1, which will modify the gate chambers at the Hillview reservoir.
- $1.18 billion for the Kensico-Eastview connection tunnel. This redundancy creating tunnel will connect the Kensico reservoir with the Catskill/Delaware Ultraviolet light facility, both of which are located in Westchester County.
- $650 million for City Water Tunnel No. 3, Stage 2, which will provide DEP the ability to bypass tunnels 1 and 2 and allow inspection of those tunnels for the first time since they were introduced.
- Water for the Future related projects totaling $146 million that will enable the increase of capacity in the upper Catskill Aqueduct. Projects will include new chemical addition facilities at the Ashokan reservoir and a new de-chlorination facility.
DEP equipment programs sum to $405 million over the FYs 2018 – 2027 period. This includes utility relocation related sewer and water main projects along with DEP field operations and select administrative offices comprise the majority of the resources in this category. A projected $134 million is provided to pay for 51 percent of the cost of gas utility work that is impacted by water and sewer projects. Another $89 million is for the reconstruction and rehabilitation of field operations facilities and DEP administrative offices.
Department of Transportation (DOT) and Mass Transit
The Preliminary Ten-Year Capital Strategy contains $15.3 billion over FYs 2018 – 2027, or 17.1 percent of the all-funds total, for NYC DOT and mass transit projects. DOT projects, which include Bridges, Highways, Traffic, Ferries, and Equipment are allocated $14.65 billion, and $655 million is allocated to New York City Transit infrastructure projects.
The Bridges program area contains both East River crossings and highway bridges citywide. $8.20 billion is allocated in this category. This includes:
- $3.55 billion for reconstruction of about 60 bridge structures rated “fair” and “good”. Two large projects account for over 50 percent of this category with $1.5 billion allocated to the Brooklyn-Queens Expressway Triple Cantilever Bridge and $344 million for the Shore Road Bridge over the Hutchinson River.
- $3.15 billion for the category of Bridge Life Extension is for about 40 bridge structures rated “fair” or “good” that require upgrades to their current condition. Highlights include $147 million for the Broadway Bridge over the Harlem River and $66 million for the Woodhaven Blvd. Bridge over Queens Blvd.
- Just over $1.0 billion for East River bridges, with $330 million of the total allocated to the Ed Koch Queensboro Bridge in FY 2018 for an upper roadway replacement.
The Highways program area totals $5.42 billion over the ten-year period and is comprised primarily of $1.6 billion for approximately 7,640 lane-miles of street resurfacing and $2.4 billion for approximately 598 lane-miles of street reconstruction. About $300 million of the street reconstruction allocation is dedicated to Vision Zero projects with another $230 million to improve drainage conditions in Southeast Queens.
The Traffic program area within DOT sums to $628 million over the period and contains $275 million for signal installation of computerization, $192 million for lampposts and luminaries, and $66 million for an estimated 101 million linear feet of thermoplastic reflectorized pavement markings.
The program area of Ferries contains $336 million over the period, of which $219 million is for improvements and rehabilitation of terminal buildings, slips, and racks at both St. George and Whitehall terminals.
The Ten-Year Plan category of transportation equipment contains $72 million over the ten-year period and includes $39 million for automotive and other equipment along with $33 million for data processing equipment.
The Ten-Year Plan category of Transit (MTA) contains $655 million with $251 million for miscellaneous track improvements and the ongoing inter-fund agreements (IFA) Transit Infrastructure projects totaling $350 million.
Housing and Economic Development
This program area includes capital projects for HPD, NYCHA, and Small Business Services agencies. The Preliminary Strategy allocates $12.18 billion, or 13.6 percent of the total Ten-Year Plan, to this area. Housing for HPD and NYCHA comprises $9.23 billion of the total amount, with Business Services/EDC at $2.95 billion. The housing component’s primary objective is to support the “Housing New York” program whose goal is to create 200,000 units of affordable housing between FY 2014 and FY 2024. According to the February 2017 Preliminary Mayor’s Management Report, there have been over 55,000 housing starts.
HPD spearheads this program area with $7.92 billion over the FYs 2018 – 2027 period. Three HPD categories comprise 92 percent of the allocation:
- Preservation, at $2.75 billion, will address the preservation of the existing affordable housing stock and assist in the creation of long-term affordability.
- The new construction category contains $2.43 billion to finance new affordable housing units as part of the Housing New York’s goal to build 200,000 new units by FY 2024.
- The Special Needs category provides $2.08 billion for both the construction and preservation of housing for seniors, the disabled, and formerly homeless households citywide.
NYCHA with $1.3 billion in all-funds over the period, will largely address roof replacements along with elevator replacements at various NYCHA developments. This is a net increase of $407 million from the prior Ten-Year Capital Strategy driven by a $715 million increase in City-funds offset by a transfer of $308 million in CDBG-DR funds to the HPD expense budget for NYCHA purposes.
The Department of Small Business services, in conjunction with NYC Economic Development Corporation, has an allocation of $2.95 billion from FYs 2018 – 2027. The Plan for SBS is heavily front-loaded with 78 percent of estimated commitments in the first four years. Four Ten-Year Plan categories make up 88 percent of the agency total. These include Neighborhood Revitalization, Waterfront Development, Commercial Development, and Industrial Development:
- The category of Neighborhood Revitalization contains planned projects of $1.63 billion. Specific neighborhood projects are not enumerated in this particular component.
- Waterfront Development contains $352 million of resources over the period. Primary objectives are the expansion and preservation of public waterfront locations throughout the City for transportation and recreational purposes, as well as ferry purchases for a new Citywide Ferry System.
- The Preliminary Strategy allocates $343 million for Commercial Development of the life sciences industry in the City. Overall, the goals of the category are to foster the growth of new industries and new retail opportunities.
- The Preliminary Strategy allocates $252 million to Industrial Development which continues to focus on City-owned or operated industrial real estate at the Brooklyn Navy Yard, the Brooklyn Army Terminal, and Bush Terminal in Brooklyn. Capital project objectives include infrastructure improvements along with bringing assets to a state-of-good repair.
IV. Appendix
Table A1. January 2017 Financial Plan Revenue Detail
($ in millions)
| Change FYs 2017 – 2021 | Annual Percent | |||||||
|---|---|---|---|---|---|---|---|---|
| FY 2017 | FY 2018 | FY 2019 | FY 2020 | FY 2021 | Dollars | Percent | Change | |
| Taxes: | ||||||||
| Real Property | $24,400 | $25,831 | $27,492 | $28,816 | $30,126 | $5,726 | 23.50% | 5.40% |
| Personal Income Tax | $11,507 | $11,826 | $12,223 | $12,829 | $13,340 | $1,833 | 15.90% | 3.80% |
| General Corporation Tax | $3,904 | $3,890 | $3,982 | $4,004 | $4,113 | $209 | 5.40% | 1.30% |
| Banking Corporation Tax | ($35) | $0 | $0 | $0 | $0 | $35 | -100.00% | -100.00% |
| Unincorporated Business Tax | $2,069 | $2,155 | $2,265 | $2,388 | $2,483 | $414 | 20.00% | 4.70% |
| Sale and Use Tax | $7,044 | $7,564 | $7,910 | $8,289 | $8,592 | $1,548 | 22.00% | 5.10% |
| Real Property Transfer | $1,444 | $1,485 | $1,580 | $1,685 | $1,717 | $273 | 18.90% | 4.40% |
| Mortgage Recording Tax | $1,061 | $994 | $1,063 | $1,140 | $1,158 | $97 | 9.10% | 2.20% |
| Commercial Rent | $816 | $848 | $884 | $919 | $955 | $139 | 17.00% | 4.00% |
| Utility | $365 | $377 | $380 | $388 | $398 | $33 | 9.00% | 2.20% |
| Hotel | $568 | $575 | $587 | $602 | $620 | $52 | 9.20% | 2.20% |
| Cigarette | $44 | $42 | $41 | $40 | $39 | ($5) | -11.40% | -3.00% |
| All Other | $655 | $598 | $597 | $597 | $597 | ($58) | -8.90% | -2.30% |
| Tax Audit Revenue | $1,041 | $850 | $721 | $721 | $721 | ($320) | -30.70% | -8.80% |
| Total Taxes | $54,883 | $57,034 | $59,725 | $62,418 | $64,859 | $9,976 | 18.20% | 4.30% |
| Miscellaneous Revenue: | ||||||||
| Licenses, Franchises, Etc. | $731 | $645 | $639 | $644 | $641 | ($90) | -12.30% | -3.20% |
| Interest Income | $75 | $110 | $177 | $241 | $246 | $171 | 228.00% | 34.60% |
| Charges for Services | $996 | $977 | $980 | $980 | $980 | ($16) | -1.60% | -0.40% |
| Water and Sewer Charges | $1,407 | $1,361 | $1,347 | $1,336 | $1,337 | ($70) | -5.00% | -1.30% |
| Rental Income | $235 | $225 | $224 | $224 | $224 | ($11) | -4.70% | -1.20% |
| Fines and Forfeitures | $923 | $902 | $891 | $880 | $870 | ($53) | -5.70% | -1.50% |
| Miscellaneous | $429 | $356 | $563 | $712 | $722 | $293 | 68.30% | 13.90% |
| Intra-City Revenue | $2,039 | $1,786 | $1,781 | $1,787 | $1,787 | ($252) | -12.40% | -3.20% |
| Total Miscellaneous Revenue | $6,835 | $6,362 | $6,602 | $6,804 | $6,807 | ($28) | -0.40% | -0.10% |
| Unrestricted Intergovernmental Aid: | ||||||||
| Other Federal and State Aid | $57 | $0 | $0 | $0 | $0 | ($57) | -100.00% | -100.00% |
| Total Unrestricted Intergovernmental Aid | $57 | $0 | $0 | $0 | $0 | ($57) | -100.00% | -100.00% |
| Reserve for Disallowance of Categorical Grants | $200 | ($15) | ($15) | ($15) | ($15) | ($215) | -107.50% | N/A |
| Less: Intra-City Revenue | ($2,039) | ($1,786) | ($1,781) | ($1,787) | ($1,787) | $252 | -12.40% | -3.20% |
| TOTAL CITY-FUNDS | $59,936 | $61,595 | $64,531 | $67,420 | $69,864 | $9,928 | 16.60% | 3.90% |
| Other Categorical Grants | $980 | $856 | $847 | $837 | $833 | ($147) | -15.00% | -4.00% |
| Inter-Fund Agreements | $655 | $658 | $658 | $595 | $593 | ($62) | -9.50% | -2.50% |
| Federal Categorical Grants: | ||||||||
| Community Development | $1,623 | $396 | $253 | $257 | $232 | ($1,391) | -85.70% | -38.50% |
| Welfare | $3,666 | $3,486 | $3,481 | $3,482 | $3,482 | ($184) | -5.00% | -1.30% |
| Education | $1,702 | $1,776 | $1,776 | $1,776 | $1,776 | $74 | 4.30% | 1.10% |
| Other | $1,835 | $1,354 | $1,301 | $1,294 | $1,291 | ($544) | -29.60% | -8.40% |
| Total Federal Grants | $8,826 | $7,012 | $6,811 | $6,809 | $6,781 | ($2,045) | -23.20% | -6.40% |
| State Categorical Grants | ||||||||
| Social Services | $1,858 | $1,744 | $1,757 | $1,763 | $1,763 | ($95) | -5.10% | -1.30% |
| Education | $10,319 | $10,813 | $11,245 | $11,593 | $11,860 | $1,541 | 14.90% | 3.50% |
| Higher Education | $286 | $286 | $286 | $286 | $286 | $0 | 0.00% | 0.00% |
| Department of Health and Mental | $584 | $552 | $535 | $535 | $535 | ($49) | -8.40% | -2.20% |
| Hygiene | ||||||||
| Other | $1,370 | $1,151 | $1,185 | $1,227 | $1,274 | ($96) | -7.00% | -1.80% |
| Total State Grants | $14,417 | $14,546 | $15,008 | $15,404 | $15,718 | $1,301 | 9.00% | 2.20% |
| TOTAL REVENUES | $84,814 | $84,667 | $87,855 | $91,065 | $93,789 | $8,975 | 10.60% | 2.50% |
Table A2. January 2017 Financial Plan Expenditure Detail
| Change FYs 2017 -2021 | Annual Percent Change | |||||||
|---|---|---|---|---|---|---|---|---|
| FY` 2018 | FY 2019 | FY 2020 | FY 2021 | Dollars | Percent | |||
| Mayoralty | $134,897 | $137,755 | $135,935 | $131,923 | $119,827 | ($15,070) | -11.20% | -2.90% |
| Board of Elections | $132,424 | $98,616 | $94,919 | $96,370 | $94,176 | ($38,248) | -28.90% | -8.20% |
| Campaign Finance Board | $16,205 | $14,014 | $14,015 | $14,015 | $14,015 | ($2,190) | -13.50% | -3.60% |
| Office of the Actuary | $7,190 | $7,354 | $7,354 | $7,354 | $7,354 | $164 | 2.30% | 0.60% |
| President, Borough of Manhattan | $4,839 | $4,583 | $4,583 | $4,583 | $4,583 | ($256) | -5.30% | -1.30% |
| President, Borough of Bronx | $5,799 | $5,450 | $5,450 | $5,450 | $5,450 | ($349) | -6.00% | -1.50% |
| President, Borough of Brooklyn | $6,399 | $5,694 | $5,694 | $5,694 | $5,694 | ($705) | -11.00% | -2.90% |
| President, Borough of Queens | $5,326 | $4,743 | $4,743 | $4,743 | $4,743 | ($583) | -10.90% | -2.90% |
| President, Borough of Staten Island | $4,429 | $4,243 | $4,243 | $4,243 | $4,243 | ($186) | -4.20% | -1.10% |
| Office of the Comptroller | $104,849 | $105,418 | $105,424 | $105,424 | $105,424 | $575 | 0.50% | 0.10% |
| Dept. of Emergency Management | $69,309 | $24,088 | $24,318 | $24,730 | $24,761 | ($44,548) | -64.30% | -22.70% |
| Office of Administrative Tax Appeals | $5,057 | $5,061 | $5,061 | $5,061 | $5,061 | $4 | 0.10% | 0.00% |
| Law Dept. | $220,922 | $202,701 | $201,628 | $201,478 | $201,478 | ($19,444) | -8.80% | -2.30% |
| Dept. of City Planning | $47,108 | $42,537 | $40,189 | $39,348 | $39,348 | ($7,760) | -16.50% | -4.40% |
| Dept. of Investigation | $50,417 | $35,843 | $35,554 | $32,957 | $32,957 | ($17,460) | -34.60% | -10.10% |
| NY Public Library — Research | $27,463 | $27,559 | $27,559 | $27,559 | $27,559 | $96 | 0.30% | 0.10% |
| New York Public Library | $135,468 | $135,388 | $135,388 | $135,388 | $135,388 | ($80) | -0.10% | 0.00% |
| Brooklyn Public Library | $100,721 | $100,719 | $100,720 | $100,720 | $100,720 | ($1) | 0.00% | 0.00% |
| Queens Borough Public Library | $102,532 | $102,430 | $102,431 | $102,431 | $102,431 | ($101) | -0.10% | 0.00% |
| Dept. of Education | $23,268,681 | $24,316,442 | $25,190,125 | $25,717,469 | $26,302,003 | $3,033,322 | 13.00% | 3.10% |
| City University | $1,110,492 | $1,093,842 | $1,122,830 | $1,130,917 | $1,144,070 | $33,578 | 3.00% | 0.70% |
| Civilian Complaint Review Board | $16,176 | $16,484 | $16,484 | $16,484 | $16,484 | $308 | 1.90% | 0.50% |
| Police Dept. | $5,168,596 | $4,999,482 | $5,029,701 | $5,033,924 | $5,032,806 | ($135,790) | -2.60% | -0.70% |
| Fire Dept. | $2,056,864 | $1,980,530 | $1,955,853 | $1,981,818 | $1,981,818 | ($75,046) | -3.60% | -0.90% |
| Dept. of Veterans’ Services | $3,952 | $3,634 | $3,634 | $3,634 | $3,634 | ($318) | -8.00% | -2.10% |
| Admin. for Children Services | $2,954,264 | $2,956,949 | $2,983,619 | $2,987,902 | $2,989,939 | $35,675 | 1.20% | 0.30% |
| Dept. of Social Services | $9,701,025 | $9,822,106 | $9,859,330 | $9,914,983 | $9,914,983 | $213,958 | 2.20% | 0.50% |
| Dept. of Homeless Services | $1,680,208 | $1,431,033 | $1,427,403 | $1,420,498 | $1,420,498 | ($259,710) | -15.50% | -4.10% |
| Dept. of Correction | $1,401,399 | $1,440,678 | $1,437,918 | $1,453,306 | $1,463,916 | $62,517 | 4.50% | 1.10% |
| Board of Correction | $3,037 | $2,997 | $2,997 | $2,997 | $2,997 | ($40) | -1.30% | -0.30% |
| Citywide Pension Contribution | $9,300,607 | $9,706,324 | $9,987,352 | $10,039,885 | $10,057,652 | $757,045 | 8.10% | 2.00% |
| Miscellaneous | $8,913,625 | $10,400,671 | $11,932,961 | $12,834,273 | $13,799,797 | $4,886,172 | 54.80% | 11.50% |
| Debt Service | $4,201,285 | $4,356,732 | $4,452,888 | $4,833,299 | $4,991,782 | $790,497 | 18.80% | 4.40% |
| T.F.A. Debt Service | $2,187,200 | $2,224,540 | $2,847,830 | $3,126,540 | $3,380,670 | $1,193,470 | 54.60% | 11.50% |
| FY 2016 BSA and Discretionary Transfers | ($4,037,505) | $0 | $0 | $0 | $0 | $4,037,505 | -100.00% | -100.00% |
| FY 2017 BSA | $3,054,660 | ($3,054,660) | $0 | $0 | $0 | ($3,054,660) | -100.00% | -100.00% |
| Public Advocate | $3,600 | $3,619 | $3,619 | $3,619 | $3,619 | $19 | 0.50% | 0.10% |
| City Council | $64,077 | $54,200 | $54,200 | $54,200 | $54,200 | ($9,877) | -15.40% | -4.10% |
| City Clerk | $5,985 | $5,557 | $5,557 | $5,557 | $5,557 | ($428) | -7.20% | -1.80% |
| Dept. for the Aging | $338,842 | $306,097 | $307,007 | $309,836 | $309,836 | ($29,006) | -8.60% | -2.20% |
| Dept. of Cultural Affairs | $181,727 | $143,481 | $143,481 | $143,481 | $143,481 | ($38,246) | -21.00% | -5.70% |
| Financial Info. Serv. Agency | $103,611 | $109,777 | $110,421 | $111,065 | $111,065 | $7,454 | 7.20% | 1.80% |
| Office of Payroll Admin. | $16,533 | $17,347 | $17,348 | $17,348 | $17,348 | $815 | 4.90% | 1.20% |
| Independent Budget Office | $6,126 | $7,001 | $6,671 | $6,670 | $5,158 | ($968) | -15.80% | -4.20% |
| Equal Employment Practices Commission | $1,125 | $1,132 | $1,132 | $1,132 | $1,132 | $7 | 0.60% | 0.20% |
| Civil Service Commission | $1,086 | $1,094 | $1,092 | $1,092 | $1,092 | $6 | 0.60% | 0.10% |
| Landmarks Preservation Commission | $6,193 | $6,348 | $6,159 | $6,148 | $6,168 | ($25) | -0.40% | -0.10% |
| Taxi & Limousine Commission | $70,590 | $58,208 | $58,058 | $51,051 | $51,051 | ($19,539) | -27.70% | -7.80% |
| Commission on Human Rights | $12,124 | $11,443 | $11,444 | $11,444 | $11,444 | ($680) | -5.60% | -1.40% |
| Youth & Community Development | $590,302 | $471,184 | $475,333 | $482,947 | $482,947 | ($107,355) | -18.20% | -4.90% |
| Conflicts of Interest Board | $2,561 | $2,580 | $2,581 | $2,581 | $2,581 | $20 | 0.80% | 0.20% |
| Office of Collective Bargaining | $2,418 | $2,322 | $2,322 | $2,322 | $2,322 | ($96) | -4.00% | -1.00% |
| Community Boards (All) | $18,167 | $17,331 | $17,331 | $17,331 | $17,331 | ($836) | -4.60% | -1.20% |
| Dept. of Probation | $93,081 | $94,302 | $94,186 | $94,215 | $94,215 | $1,134 | 1.20% | 0.30% |
| Dept. Small Business Services | $313,372 | $147,004 | $132,372 | $126,307 | $126,344 | ($187,028) | -59.70% | -20.30% |
| Housing Preservation & Development | $1,335,511 | $900,957 | $741,678 | $739,940 | $739,940 | ($595,571) | -44.60% | -13.70% |
| Dept. of Buildings | $170,202 | $157,628 | $153,499 | $152,212 | $152,212 | ($17,990) | -10.60% | -2.80% |
| Dept. of Health & Mental Hygiene | $1,582,397 | $1,506,105 | $1,518,219 | $1,517,172 | $1,517,189 | ($65,208) | -4.10% | -1.00% |
| NYC Health + Hospitals | $699,506 | $767,177 | $787,756 | $891,034 | $791,034 | $91,528 | 13.10% | 3.10% |
| Office of Administrative Trials & Hearings | $42,004 | $44,397 | $44,809 | $44,809 | $44,809 | $2,805 | 6.70% | 1.60% |
| Dept. of Environmental Protection | $1,581,303 | $1,216,279 | $1,196,979 | $1,184,805 | $1,185,713 | ($395,590) | -25.00% | -6.90% |
| Dept. of Sanitation | $1,613,459 | $1,664,409 | $1,690,965 | $1,695,306 | $1,693,056 | $79,597 | 4.90% | 1.20% |
| Business Integrity Commission | $10,303 | $8,462 | $8,462 | $8,462 | $8,462 | ($1,841) | -17.90% | -4.80% |
| Dept. of Finance | $273,762 | $281,644 | $281,119 | $281,333 | $281,333 | $7,571 | 2.80% | 0.70% |
| Dept. of Transportation | $994,680 | $953,595 | $954,264 | $907,313 | $909,375 | ($85,305) | -8.60% | -2.20% |
| Dept. of Parks and Recreation | $494,637 | $437,320 | $435,140 | $433,489 | $431,906 | ($62,731) | -12.70% | -3.30% |
| Dept. of Design & Construction | $630,574 | $148,258 | $150,261 | $156,990 | $144,302 | ($486,272) | -77.10% | -30.80% |
| Dept. of Citywide Admin. Services | $472,486 | $419,315 | $407,359 | $408,398 | $409,428 | ($63,058) | -13.30% | -3.50% |
| D.O.I.T.T. | $555,948 | $468,162 | $458,349 | $456,255 | $456,255 | ($99,693) | -17.90% | -4.80% |
| Dept. of Record & Info. Services | $8,239 | $7,048 | $7,049 | $7,049 | $7,049 | ($1,190) | -14.40% | -3.80% |
| Dept. of Consumer Affairs | $38,274 | $38,998 | $38,916 | $38,916 | $38,916 | $642 | 1.70% | 0.40% |
| District Attorney – N.Y. | $124,040 | $102,613 | $102,928 | $102,932 | $102,932 | ($21,108) | -17.00% | -4.60% |
| District Attorney – Bronx | $73,357 | $71,375 | $71,496 | $71,494 | $71,494 | ($1,863) | -2.50% | -0.60% |
| District Attorney – Kings | $99,919 | $97,109 | $97,357 | $97,347 | $97,347 | ($2,572) | -2.60% | -0.60% |
| District Attorney -Queens | $65,741 | $63,576 | $63,810 | $63,818 | $63,818 | ($1,923) | -2.90% | -0.70% |
| District Attorney – Richmond | $13,949 | $13,954 | $13,989 | $13,990 | $13,990 | $41 | 0.30% | 0.10% |
| Office of Prosec. & Special Narc. | $22,121 | $22,353 | $22,453 | $22,458 | $22,458 | $337 | 1.50% | 0.40% |
| Public Administrator – N.Y. | $1,786 | $1,718 | $1,731 | $1,731 | $1,731 | ($55) | -3.10% | -0.80% |
| Public Administrator – Bronx | $728 | $692 | $704 | $704 | $704 | ($24) | -3.30% | -0.80% |
| Public Administrator – Brooklyn | $859 | $823 | $835 | $835 | $835 | ($24) | -2.80% | -0.70% |
| Public Administrator – Queens | $612 | $620 | $632 | $632 | $632 | $20 | 3.30% | 0.80% |
| Public Administrator – Richmond | $514 | $518 | $530 | $530 | $530 | $16 | 3.10% | 0.80% |
| Prior Payable Adjustment | ($400,000) | $0 | $0 | $0 | $0 | $400,000 | -100.00% | -100.00% |
| General Reserve | $300,000 | $1,000,000 | $1,000,000 | $1,000,000 | $1,000,000 | $700,000 | 233.30% | 35.10% |
| Citywide Savings Initiatives | $0 | ($30,700) | ($42,000) | ($47,000) | ($44,000) | ($44,000) | N/A | N/A |
| Energy Adjustment | $9,981 | $49,446 | $81,364 | $115,577 | $151,063 | $141,082 | 1413.50% | 97.20% |
| Lease Adjustment | $0 | $32,217 | $65,400 | $99,579 | $134,783 | $134,783 | N/A | N/A |
| OTPS Inflation Adjustment | $0 | $0 | $55,519 | $111,038 | $166,557 | $166,557 | N/A | N/A |
| TOTAL EXPENDITURES | $84,814,332 | $84,668,075 | $91,168,019 | $93,574,894 | $95,581,005 | $10,766,673 | 12.70% | 3.00% |
Endnotes
[1] The new round of Citywide Savings program also contains $7.8 million of additional revenues from CSP initiatives.
[2] The November Plan CSP did not include projections for FY 2021 and the current Plan does not provide details of the FY 2021 savings from the November Plan CSP.
[3] According to Doug Duncan, Chief Economist at Fannie Mae, if interest rates rise because the economy is growing more rapidly, then it means incomes are rising and higher income offsets higher mortgages and thus house prices rise. If interest rates rise because of inflationary expectations, then people think of houses as a hedge against inflation and house prices rise. If interest rates rise because Central banks perceive a rise in inflationary pressure and want to slow the economy, then employment slows, income slows, and people sell fewer houses making house prices rise. http://www.nationalmortgagenews.com/video/why-rising-mortgage-rates-wont-hurt-home-prices-1092745-1.html
[4] The $271 million decline reflects a decrease of $279 million in City-funds revenues offset by an $8 million increase in revenues from the Citywide Savings Program.
[5] Agency spending excludes transfers from the labor reserve for collective bargaining and the impact of the Citywide Savings Program.
[6] The November Plan CSP did not include projections of savings for FY 2021.
[7] Our analysis of recurring savings end at FY 2020 because the November Plan CSP estimated savings stop at FY 2020.
[8] If not indicated specifically, throughout this section, personal income tax (PIT) and property tax revenues include School Tax Relief (STAR) reimbursement.
[9] On April 13, 2015, the Governor signed into law a corporate income tax reform for New York City, which merged the taxation of all New York City C-corporations formerly paid under the banking corporation tax and the general corporation tax. These corporations now pay under the new Business Corporation Tax.
[10] Stock incentive options give rise to both wage income and capital gains income. We assume that most of the tax revenue is related to the non-wage component that is treated as capital gains income.
[11] Neither the Comptroller’s nor the City’s estimates include proposed legislative changes that were introduced as part of the Governor’s budget in January. These include child care tax credits that would impact New York City PIT revenue. Beginning in January 2018 Paid Family Legislation that was enacted last year could also have an impact on PIT revenue. At this time we expect the impact to be minimal.
[12] In the April Plan, the Administration recognized reductions in sales tax revenues of $50 million in FY 2016 and $150 million in FY 2017 to account for revenue intercept by New York State associated with the Sales Tax Asset Receivable Corporation (STARC) refinancing from which the City generated $650 million in savings.
[13] Miscellaneous revenue analysis excludes private grants and intra-City revenues.
[14] Civilian overtime expenditures divided by total-funds full-time civilian headcount, excluding pedagogical.
[15] Estimated overtime savings for other civilians in FY 2018 is $4 million, suggesting only a half year of savings.
[16] In May 2014, the City and the MLC reached an agreement on healthcare reform for savings of $400 million in FY 2015, $700 million in FY 2016, $1 billion in FY 2017, and $1.3 billion annually in FY 2018 and beyond. The savings are earmarked to offset some of the cost of the current round of collective bargaining.
[17] Returns above or below the AIRA for a given fiscal year are phased in to the Actuarial Asset Value over a six-year period in accordance with the Actuary’s Actuarial Asset Valuation Methodology (AAVM).
[18] Base salary over the period excludes longevity, holiday and other non-wage compensation.
[19] Following Governor Paterson’s veto of Tier II legislation extending Tier II accidental disability benefits to uniformed employees hired during the upcoming fiscal year, accidental disability benefits for uniformed employees hired on or after July 1, 2009 were reduced from 75 percent to 50 percent of final average salary, offset by 50 percent of Social Security disability benefits.
[20] Includes debt service on General Obligation (GO), Transitional Finance Authority (TFA), and TSASC bonds as well as lease-purchase debt.
[21] There was no published estimate for FY 2021 in either the June or November 2016 Plans.
[22] BARBs debt service is not carried in the City’s General Fund budget, whereas TFA Future Tax Secured (FTS) debt service is included in the City’s General Fund budget. Decreases in TFA FTS debt service directly benefit the General Fund budget.
[23] Includes TSASC debt service and revenues.
[24] The Plan assumes a tax revenue growth rate of 4.5 percent per annum after FY 2021.
[25] Changes described are from FYs 2017-2020 as FY 2021 was not yet in the November 2016 Financial Plan.
[26] The Commitment Plan is a schedule of anticipated capital contract registrations. The January 2017 Commitment Plan contains forecasts for FYs 2017 – 2020 only. FY 2021 will appear at the time of the Executive Budget.
[27] This percentage assumes all DOT project types, not just bridges and highways.