The Human Cost of Subway Delays: A Survey of New York City Riders
Introduction
The subway is the backbone and circulatory system of New York City. It is among the most extensive and well-trafficked subway systems in the world, carrying millions of riders each day to work, to school, to appointments, to cultural events, and to thousands of other activities that could never be sustained without robust mass transit. It is also among the oldest systems in the world, with much of its critical infrastructure dating back to the early 20th century.
Under pressure from this aging infrastructure and record ridership, subway service has declined dramatically in recent years. The Metropolitan Transportation Authority statistics are clear and indisputable: trains are frequently delayed, platforms are overcrowded, and key infrastructure is being extended beyond its useful life. The physical underpinnings of the system are beginning to fail.
While this declining state of physical repair has been well documented, its effect on people’s lives and livelihoods is too often overlooked. This survey, by New York City Comptroller Scott M. Stringer, aims to address this gap, providing a real-time snapshot of the personal and material consequences of subway delays.
As the findings make clear, when New Yorkers are left stranded on the subway platform or stuck in a tunnel, they are missing classes and job interviews and doctor’s appointments. They are running late to pick up or drop off their children or care for elderly relatives. They are losing wages and putting their jobs in jeopardy. In short, when subway performance declines, so too does the health, financial security, and quality of life of everyday New Yorkers.
Frustration among subway riders is palpable. In this survey of 1,227 straphangers—gathered during morning and evening commutes at 143 stations over a two week period in June 2017—the Comptroller’s Office found the following:
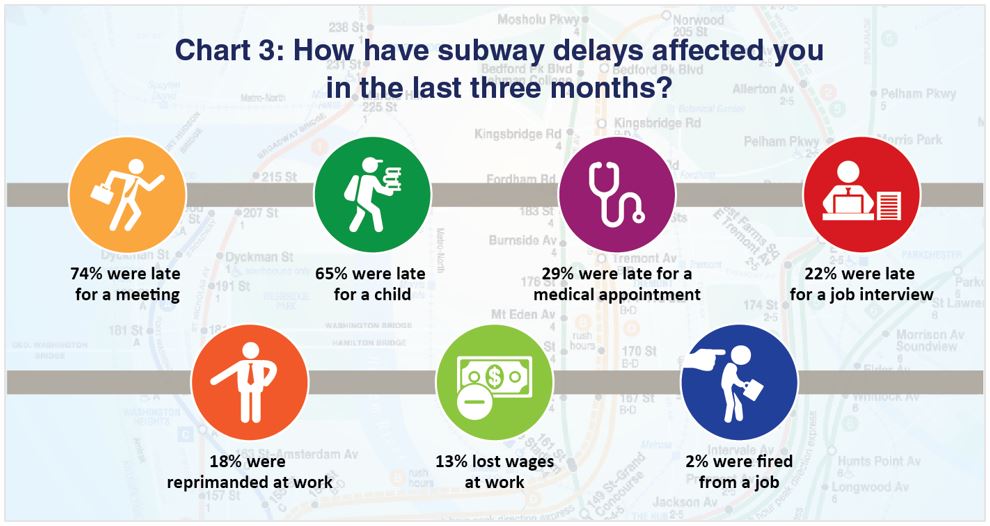
- Declining subway service has adversely affected the job security, family life, and healthcare of riders. Among respondents who were employed, subway delays caused 74 percent to be late for a work meeting, 18 percent to be reprimanded, and 13 percent to lose wages. An additional 22 percent of respondents were late for a job interview on account of delays and 2 percent said they were fired.
- Outside of work, 65 percent of parents said that they had been late to pick-up, drop-off, or attend a child’s function in the last three months due to subway delays, and 29 percent of respondents were late for a medical appointment.
- Residents of lower income New York City zip codes were fourteen percent more likely to be reprimanded at work on account of subway delays than those from higher income areas, seven percent more likely to be late for a job interview, and four percent more likely to have lost wages. Overall, 42 percent of respondents from lower income areas experienced significant delays “Always” or “More than Half the Time,” compared to 34 percent of those from higher income zip codes.
- Disparities in service were also evident at the borough level, with residents outside of Manhattan reporting far worse service. Sixty-eight percent of Bronx respondents graded subway service a “D” or an “F,” compared to 41 percent of Queens residents, 37 percent of Brooklynites, and 21 percent from Manhattan. In the Bronx, 54 percent of residents experienced significant delays “more than half of the time” or “always,” compared to 45 percent of Queens residents, 40 percent from Brooklyn, and 25 percent of Manhattanites.
- In the face of declining service, more and more subway riders are left to rely on alternate forms of transit. Due to subways delays (or anticipated delays), 50 percent of straphangers said they were forced to take a taxi or other for-hire vehicle to work, 42 percent walked to work, 40 percent took a bus, 10 percent drove, and six percent biked.
- While on-train announcements are meant to clarify the causes of delays and, where relevant, provide information about alternative routes, many riders do not find them useful. Nearly 85 percent of respondents graded these announcements a “C” or lower.
- Subway riders are highly attuned to declining service. Forty-six percent of respondents found service was “slightly” or “far” worse than last year—higher than the 38 percent who saw no difference and the 16 percent who thought it had improved.
- Overall, 14 percent of respondents graded subway service an “F,” 24 percent graded it a “D,” and 35 percent graded it a “C.”
Subway Survey
Survey Methodology
From June 13 to June 26, the Comptroller’s Office conducted a city-wide survey of subway riders. The survey targeted weekday commuters at 143 stations and every subway line during AM and PM rush hour. In total, 1,227 riders completed the nine question survey (see Appendix 1). Ninety-four percent of respondents were from the five boroughs, collectively residing in 158 of the city’s 180 residential zip codes. Within the city, 33 percent of respondents were from Brooklyn, 27 percent from Manhattan, 24 percent from Queens, and 14 percent from the Bronx – closely tracking the distribution of subway commuters according to the 5-Year 2011-2015 American Community Survey.
SURVEY RUNDOWN
- Respondents: Total – 1,227
- Respondents: New York City Residents – 1,154
- Unique Zip Codes of NYC Respondents – 158
- Survey Administered – 6:30-9:30am, 5pm-8pm on Weekdays
- Subway Stations Canvassed – 143
Across the city, subway riders are dissatisfied with the MTA. Nearly three-quarters of survey respondents graded service a “C” or lower. One out of seven riders gave the subway a failing grade (see Chart 1).

New Yorkers in every borough and on every subway line are experiencing delays. Over 70 percent of respondents reported significant delays at least half the time they used transit while only one percent never experienced a significant delay (see Chart 2).

Declining subway service has adversely affected the professional and personal lives of riders (see Chart 3). Among survey respondents who were employed, subway delays caused 74 percent to be late for a work meeting, 18 percent to be reprimanded, and 13 percent to lose wages. An additional 22 percent of respondents were late for a job interview on account of delays and 2 percent said they were fired.
Outside of work, 65 percent of parents were late to pick-up, drop-off, or attend a child’s function due to subway delays and 29 percent of riders were late for a medical appointment. When trains were stalled, the daily lives of subway riders were clearly affected, compromising their job security, family life, and personal health.
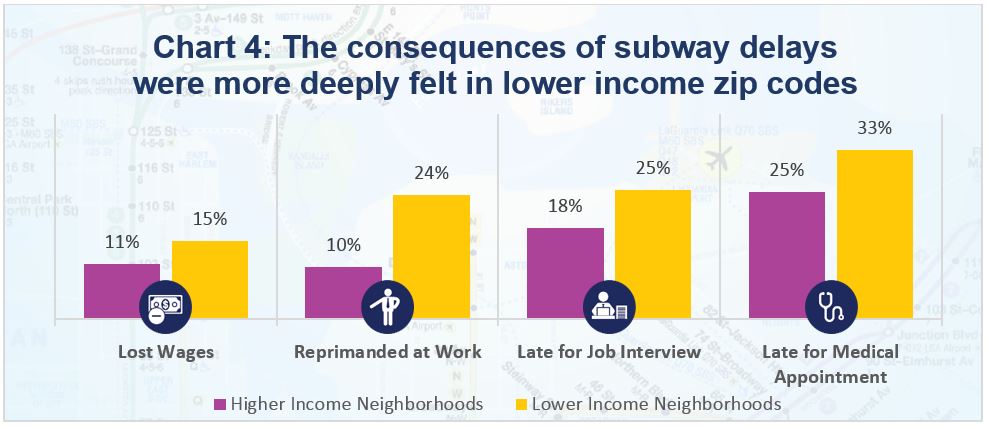
These effects were particularly acute in the city’s lower income zip codes – where average incomes were below the $62,150 threshold for a three-person household.[1] Residents in these lower income neighborhoods were 14 percent more likely to be reprimanded at work on account of subway delays than respondents from higher income areas, seven percent more likely to be late for a job interview, four percent more likely to have lost wages, and eight percent more likely to be late for a doctor’s appointment (see Chart 4). In short, the most vulnerable New Yorkers appear to also be the most vulnerable to erratic subway service.
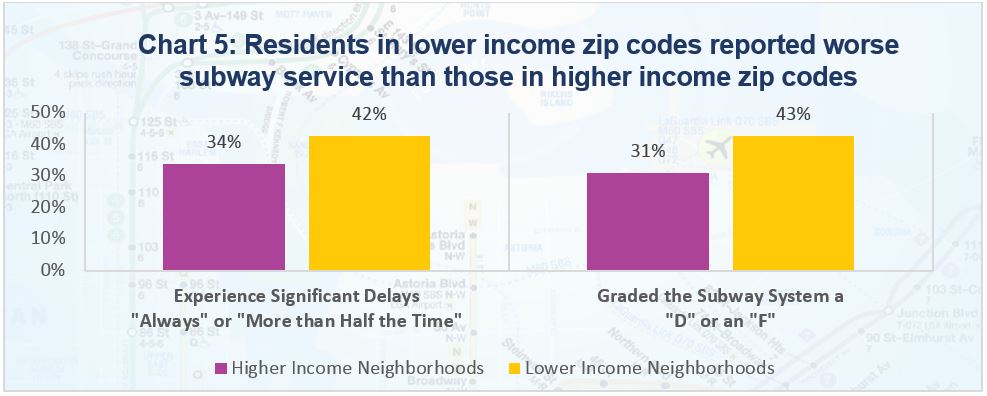
Not surprisingly, riders from these lower income zip codes were highly critical of the MTA, with 43 percent grading subway service a “D” or an “F” compared to 31 percent of residents from the rest of the city. Overall, 42 percent experienced significant delays “Always” or “More than Half the Time” in these areas, compared to 34 percent of those from higher income zip codes (see Chart 5).
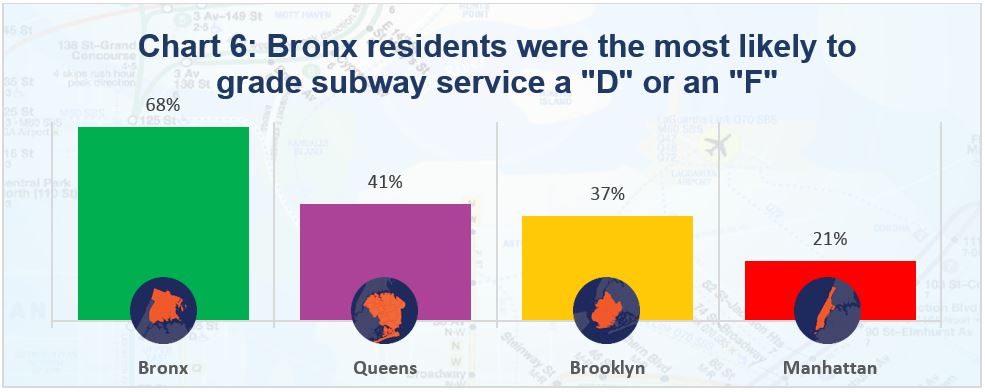
These disparities in service were also evident at the borough level, with residents outside of Manhattan reporting far worse service. Sixty-eight percent of Bronx respondents graded subway service a “D” or an “F,” compared to 41 percent of Queens residents, 37 percent of Brooklynites, and 21 percent from Manhattan (see Chart 6).
In the Bronx, 54 percent of respondents experienced significant delays “more than half of the time” or “always,” compared to 45 percent of Queens residents, 40 percent from Brooklyn, and 25 percent of Manhattanites. Fifty-eight percent of Bronx residents reported that subway service was “far worse” or “slightly worse” than last year, compared to 42 percent of Manhattanites.
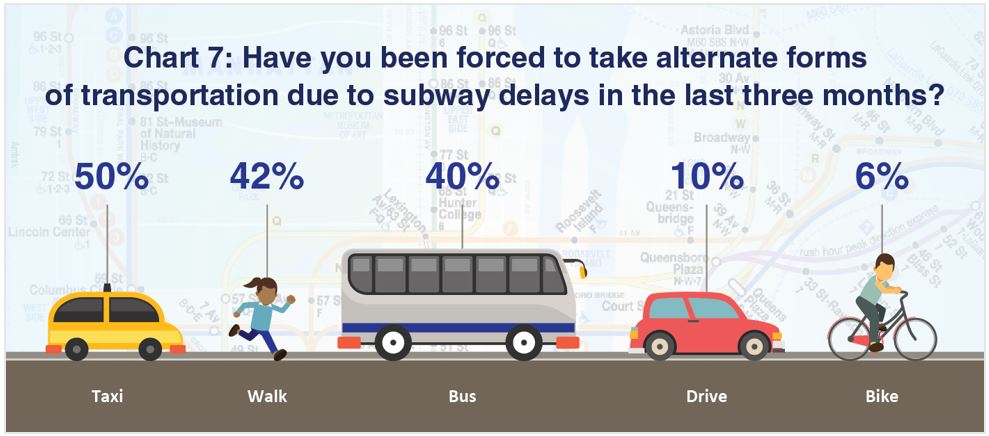
In the face of declining subway service, more and more New Yorkers are left to rely on alternate forms of transit. This can be both costly and inconvenient. Due to subways delays (or anticipated delays), 50 percent of riders were forced to take a taxi or other for-hire vehicle to work, 42 percent walked to work, 40 percent took a bus, 10 percent drove, and six percent biked (see Chart 7).
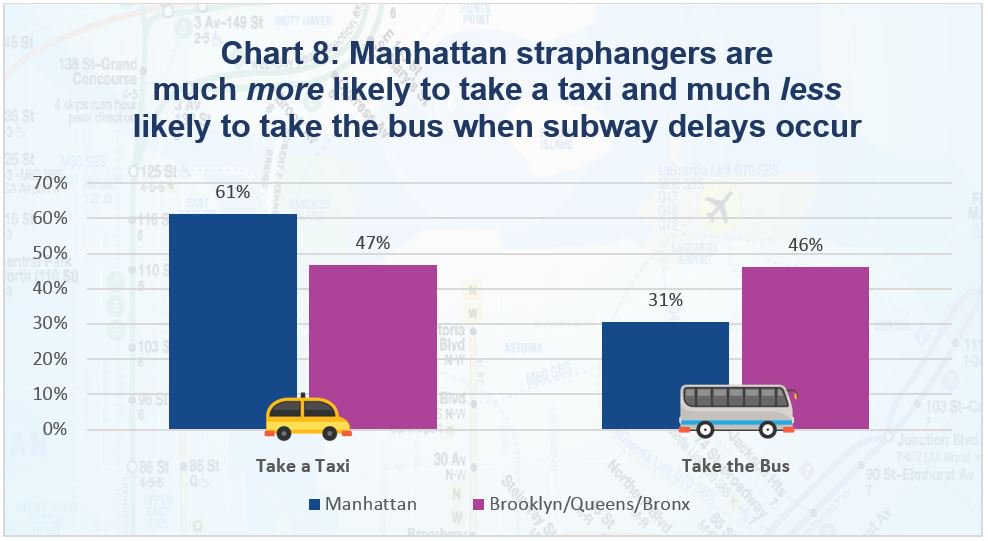
As New Yorkers shift their commuting patterns, issues with underground transit begin to affect street level conditions – particularly in the city’s most congested areas (see Chart 8). When confronting subway delays, Manhattanites were far more likely to take a taxi or other for-hire vehicle (61 percent) than those in the rest of the city (47 percent), increasing the presence of automobiles in a borough already choked with traffic.
On the other hand, Manhattanites were far less likely to take the bus when subway delays occurred (31 percent) than residents of Brooklyn, Queens, and the Bronx (46 percent). This could be explained by the higher prevalence of taxis as well as the haltingly slow speeds on Manhattan bus routes, which average less than six miles per hour.[2]
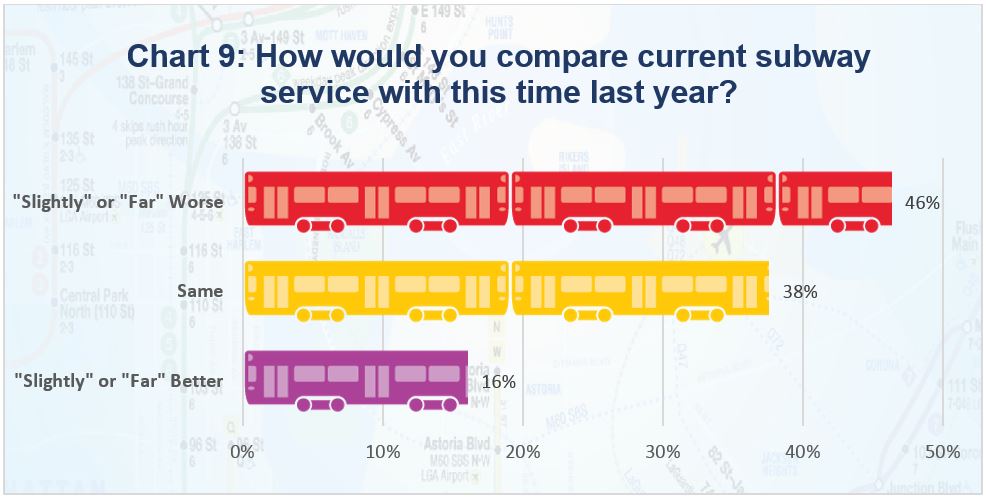
Increased gridlock, unplanned transit expenses, job insecurity, missed appointments: declining subway service has a dramatic effect on the city and its residents. Naturally, subway riders are highly attuned to these changes, with 46% of respondents reporting that subway service was “slightly” or “far” worse than last year, higher than the 38 percent who saw no difference and the 16 percent who thought it had improved (see Chart 9).
In the face of increased service disruptions, the MTA has made a concerted effort to improve communications with passengers. According to the Authority, these efforts have been successful, with “information” in subway cars receiving a 94.8 percent grade in the most recent condition assessment.[3]
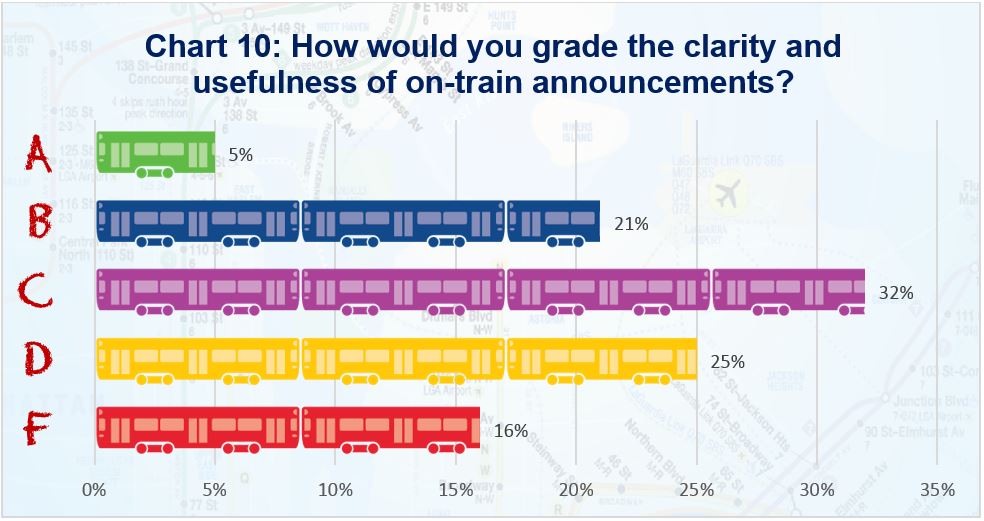
Subway passengers, however, disagree. While on-train announcement are meant to clarify the cause of delays and provide information on alternative routes, most riders do not find them useful. Overall, 85 percent of respondents graded these announcements a “C” or lower (Chart 10).
A Review of Subway Delays and Performance
Signs of decline are visible throughout the subway system. Trains are frequently delayed, platforms are overcrowded, and key infrastructure—like signals, switches, cars, and power systems—are being extended beyond their useful life. After decades of improving service and increased ridership, many fear that transit service has peaked and is sliding backwards.
In certain respects, the MTA is a victim of its own success. As the city’s residential, working, and tourist population grows, record ridership has taken a toll.[4] Subway overcrowding makes boarding and exiting difficult, holding trains at the station and wreaking havoc on subway car doors. Growing off-peak ridership, meanwhile, makes late-night and weekend maintenance work more complicated and burdensome.
This combination of record ridership and aging infrastructure has triggered a substantial increase in annual subway delays. In the 2012 calendar year, 356,607 trains experienced delays—arriving at their terminal more than five minutes late. By 2016, delays jumped to 823,582 (up 152 percent) and, based on January through April data, are on pace to reach 900,000 in 2017 (see Chart 11).

Source: NYCT and Bus Committee Materials, 2012-2017. Through April 2017.
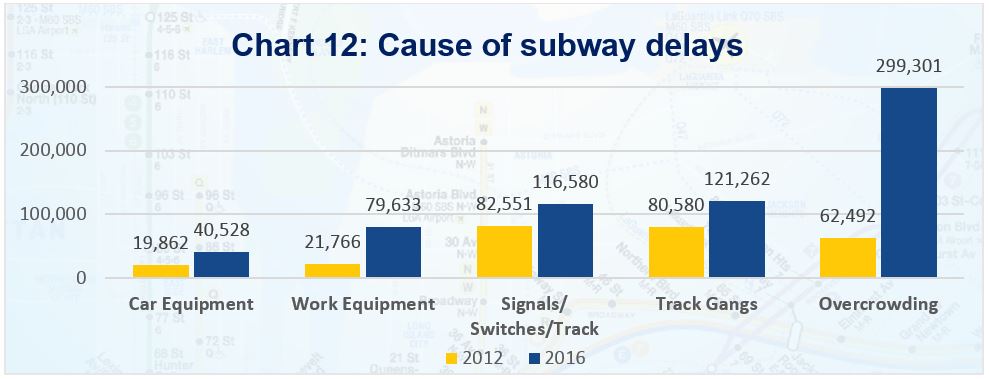
Issues with overcrowding, signals, work crews, work equipment, and car equipment are responsible for 80 percent of terminal delays (see Appendix 2). In recent years, overcrowding has been the primary driver, jumping from 62,492 in 2012 to 299,301 in 2016, a 379 percent increase (see Chart 12). Delays caused by switch, signal, or rail malfunctions jumped by 41 percent over this period (from 82,551 to 116,580), while issues with work equipment (21,766 to 79,633) and train cars (19,862 to 40,528) also grew worse.
Source: NYCT and Bus Committee Materials, 2012-2017.
Of course, identifying a root cause of any delay is complicated and issues with overcrowding and infrastructure systems are deeply interrelated. Installing a modern signal system on the L line, for instance, allowed trains to run faster, safer, and more frequently, helping to reduce congestion on platforms.[5]
Replacing signals, electrical systems, and train cars throughout the subway would have a similar effect on overcrowding—though much of this work is still decades away.[6] In the meantime, the city is left with an outdated system, riddled with delays and ill-equipped to handle growing ridership.
The rapid increase in delays is reflected in the “on-time performance” of the subway system. In the first four months of 2017, only 63 percent of trains reached their terminus within five minutes of their scheduled arrival—down from 84 percent in 2012 and well below the MTA’s target of 75 percent (see Chart 13).[7]

Source: NYCT and Bus Committee Materials, 2012-2017. Through April 2017.
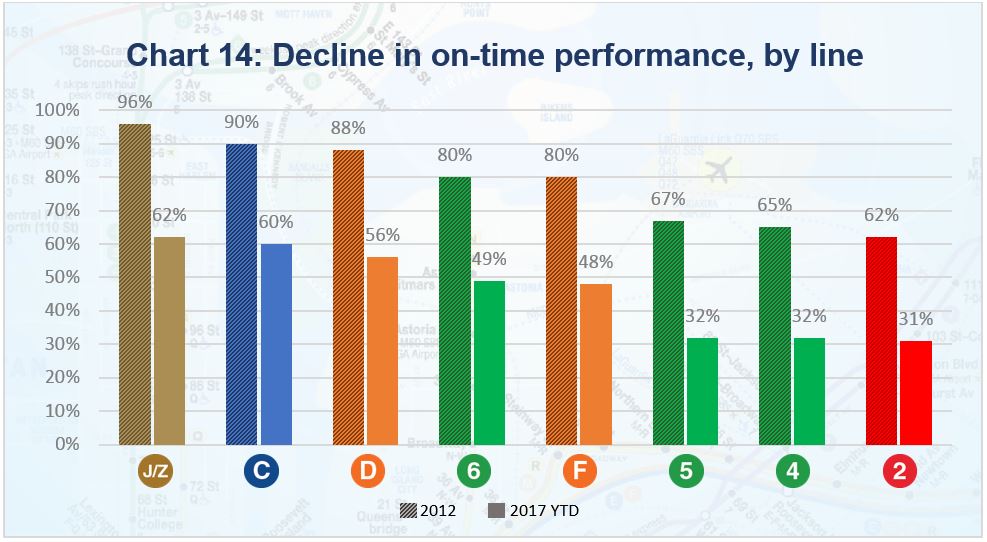
On seven subway lines, on-time performance fell by over 31 percent during this period (see Chart 14 and Appendix 3). The sharpest fall was a 34 percentage point drop on the 5 line (67 percent to 32 percent), followed by a 33 percentage point decline on the J/Z (96 percent to 62 percent), 33 percent on the 4 (65 percent to 32 percent), 32 percent on the D (88 percent to 56 percent), 32 percent on the F (80 percent to 48 percent), 31 percent on the C (90 percent to 60 percent), 30 percent on the 2 (62 percent to 31 percent), and 30 percent on the 6 (80 percent to 49 percent).
Source: NYCT and Bus Committee Materials, 2012-2017. Through April 2017.
And while on-time-performance is instructive, riders are generally more interested in the regularity of service than the time that a train reaches its terminal station. Performance, then, is better captured by the “wait assessment,” a measure of whether intervals between trains are longer than scheduled.
In the first four months of 2017, the MTA maintained regular service on its lines 75 percent of the time, far lower than its 81 percent target. The 5 train (62 percent), 4 train (67 percent), 6 train (68 percent), 2 train (68 percent), and A train (69 percent) were the worst performers. Issues extended across the system, with wait assessments falling on every line from 2012 to 2017 (see Chart 15 and Appendix 4).

Source: NYCT and Bus Committee Materials, 2012-2017 YTD. Through April 2017.
Appendix
Appendix 1

Appendix 2
| Causes of subway delays | ||||||
| Category | 2012 | 2013 | 2014 | 2015 | 2016 | 2017
(Adjusted) |
| Overcrowding | 62,492 | 72,139 | 155,183 | 245,366 | 299,301 | 335,568 |
| Work Crews | 80,580 | 98,736 | 110,788 | 114,368 | 121,262 | 131,877 |
| Right of Way Delays | 82,551 | 108,794 | 128,456 | 120,174 | 116,580 | 124,170 |
| Work Equipment | 21,766 | 29,209 | 51,876 | 70,005 | 79,633 | 83,628 |
| Sick Customer | 26,650 | 30,428 | 36,667 | 41,868 | 41,155 | 38,835 |
| Car Equipment | 19,862 | 23,219 | 34,343 | 38,063 | 40,528 | 37,332 |
| Operational Diversions | 3,968 | 4,673 | 17,365 | 22,129 | 27,146 | 28,632 |
| Unruly Customer | 10,450 | 14,756 | 21,187 | 26,906 | 26,319 | 27,048 |
| Police | 22,462 | 25,850 | 23,519 | 23,773 | 26,233 | 26,340 |
| Inclement Weather | 3,870 | 6,866 | 20,451 | 17,847 | 11,006 | 25,476 |
| Employee | 6,606 | 8,643 | 12,015 | 15,379 | 16,434 | 15,771 |
| Fire | 9,169 | 9,407 | 10,475 | 12,228 | 9,597 | 14,445 |
| Infrastructure | 3,194 | 5,468 | 6,937 | 4,808 | 5,136 | 6,654 |
| External | 2,424 | 2,328 | 3,712 | 3,934 | 3,250 | 2,775 |
| Collision/ Derailment |
560 | 335 | 1,095 | 244 | 9 | 21 |
| Total | 356,607 | 440,853 | 634,071 | 757,092 | 823,582 | 898,572 |
Source: NYCT and Bus Committee Materials, 2012-2017. Due to missing data from August 2013, those year’s figures are adjusted for a 12 month average. Data for 2017 runs through April and are also adjusted for a 12 month average.
Appendix 3
| On-time-performance, by subway line | ||||||||
| 2010 | 2011 | 2012 | 2013 | 2014 | 2015 | 2016 | 2017 YTD | |
| 1 Line | 90% | 91% | 88% | 84% | 79% | 76% | 72% | 68% |
| 2 Line | 77% | 68% | 62% | 56% | 46% | 43% | 36% | 31% |
| 3 Line | 80% | 75% | 73% | 71% | 66% | 65% | 58% | 52% |
| 4 Line | 79% | 68% | 65% | 55% | 46% | 43% | 38% | 32% |
| 5 Line | 82% | 68% | 67% | 56% | 43% | 40% | 37% | 32% |
| 6 Line | 84% | 80% | 80% | 72% | 54% | 46% | 49% | 49% |
| 7 Line | 91% | 88% | 90% | 89% | 88% | 83% | 78% | 73% |
| A Line | 87% | 82% | 83% | 83% | 72% | 66% | 62% | 57% |
| B Line | 92% | 88% | 87% | 83% | 74% | 76% | 67% | 58% |
| C Line | 92% | 90% | 90% | 92% | 84% | 79% | 69% | 60% |
| D Line | 89% | 88% | 88% | 84% | 75% | 74% | 67% | 56% |
| E Line | 87% | 87% | 86% | 81% | 72% | 69% | 67% | 62% |
| F Line | 82% | 82% | 80% | 73% | 55% | 57% | 58% | 48% |
| G Line | 93% | 94% | 90% | 86% | 78% | 68% | 80% | 76% |
| J and Z Lines | 98% | 96% | 96% | 94% | 86% | 73% | 65% | 62% |
| L Line | 96% | 96% | 95% | 94% | 94% | 92% | 91% | 93% |
| M Line | 95% | 90% | 90% | 85% | 75% | 69% | 68% | 61% |
| N Line | 86% | 80% | 81% | 82% | 71% | 66% | 62% | 53% |
| Q Line | 91% | 87% | 86% | 86% | 75% | 70% | 69% | 67% |
| R Line | 90% | 87% | 89% | 87% | 81% | 59% | 60% | 68% |
| System-wide | 89% | 85% | 84% | 82% | 74% | 70% | 67% | 63% |
Source: New York State Open Data. “Metropolitan Transportation
Authority (MTA) Performance Indicators per Agency: Beginning 2008.” Through April 2017.
Appendix 4
| Wait assessment, by subway line | ||||||||
| 2010 | 2011 | 2012 | 2013 | 2014 | 2015 | 2016 | 2017 YTD | |
| 1 Line | 76% | 78% | 83% | 82% | 80% | 79% | 77% | 77% |
| 2 Line | 72% | 72% | 74% | 73% | 71% | 73% | 69% | 68% |
| 3 Line | 77% | 76% | 77% | 78% | 77% | 78% | 74% | 73% |
| 4 Line | 73% | 72% | 74% | 74% | 72% | 71% | 69% | 67% |
| 5 Line | 71% | 70% | 72% | 71% | 68% | 67% | 65% | 62% |
| 6 Line | 74% | 75% | 78% | 76% | 72% | 67% | 66% | 68% |
| 7 Line | 75% | 76% | 77% | 79% | 76% | 76% | 74% | 70% |
| A Line | 71% | 73% | 73% | 74% | 70% | 69% | 71% | 69% |
| B Line | 78% | 78% | 79% | 80% | 79% | 79% | 76% | 75% |
| C Line | 80% | 81% | 79% | 83% | 81% | 80% | 75% | 73% |
| D Line | 80% | 80% | 79% | 79% | 80% | 80% | 79% | 75% |
| E Line | 76% | 75% | 73% | 76% | 74% | 75% | 73% | 71% |
| F Line | 72% | 74% | 74% | 75% | 72% | 72% | 73% | 71% |
| G line | 83% | 83% | 83% | 83% | 79% | 82% | 83% | 82% |
| J and Z Lines | 86% | 84% | 82% | 81% | 80% | 80% | 78% | 76% |
| L Line | 77% | 79% | 80% | 82% | 80% | 81% | 77% | 78% |
| M Line | 86% | 80% | 78% | 78% | 79% | 78% | 76% | 75% |
| N Line | 81% | 77% | 79% | 79% | 80% | 79% | 77% | 74% |
| Q Line | 81% | 78% | 79% | 79% | 79% | 79% | 78% | 76% |
| R Line | 78% | 78% | 77% | 79% | 82% | 77% | 76% | 75% |
| System-wide | 79% | 79% | 79% | 80% | 78% | 78% | 77% | 75% |
Source: New York State Open Data. “Metropolitan Transportation
Authority (MTA) Performance Indicators per Agency: Beginning 2008.” Through April 2017.
Acknowledgments
Comptroller Scott M. Stringer thanks Adam Forman, Associate Policy Director and the lead author of this report. He also recognizes the important contributions made by David Saltonstall, Assistant Comptroller for Policy; Preston Niblack, Deputy Comptroller for Budget; Tammy Gamerman, Director of Budget Research; Stephen Corson, Senior Research Analyst for Budget; Angela Chen, Senior Web Developer and Graphic Designer; Jessica Silver, Director of Strategic Operations; Tyrone Stevens, Press Secretary; Devon Puglia, Director of Communications; and Interns Joseph Asprea and Alex Hunter.
Endnotes
[1] Based on income limits by household size from the U.S. Department of Housing and Urban Development. “New York City Mandatory Inclusionary Housing,” Department of Planning of New York. September 2015.
[2] This includes bus routes that travel exclusively in Manhattan. Data is for October, 2015. Bus Turnaround Coalition: http://busturnaround.nyc/
[3] “New York City Transit & Bus Committee Meeting,” June 2017.
[4] “New York City’s Labor Market: Evidence From The Recent Expansion,” Office of the New York City Comptroller. June 2017.
[5] “Caution Ahead,” Center for an Urban Future. March 2014.
[6] Barone, Richard E. “Moving Forward: Accelerating the Transition to Communications-Based Train Control for New York City’s Subways,” Regional Planning Authority. May 2014.
[7] MTA, “NYC Transit Performance Dashboard.” April 2017.