Comptroller Stringer: Cost of Incarceration per Person in New York City Skyrockets to All-Time High

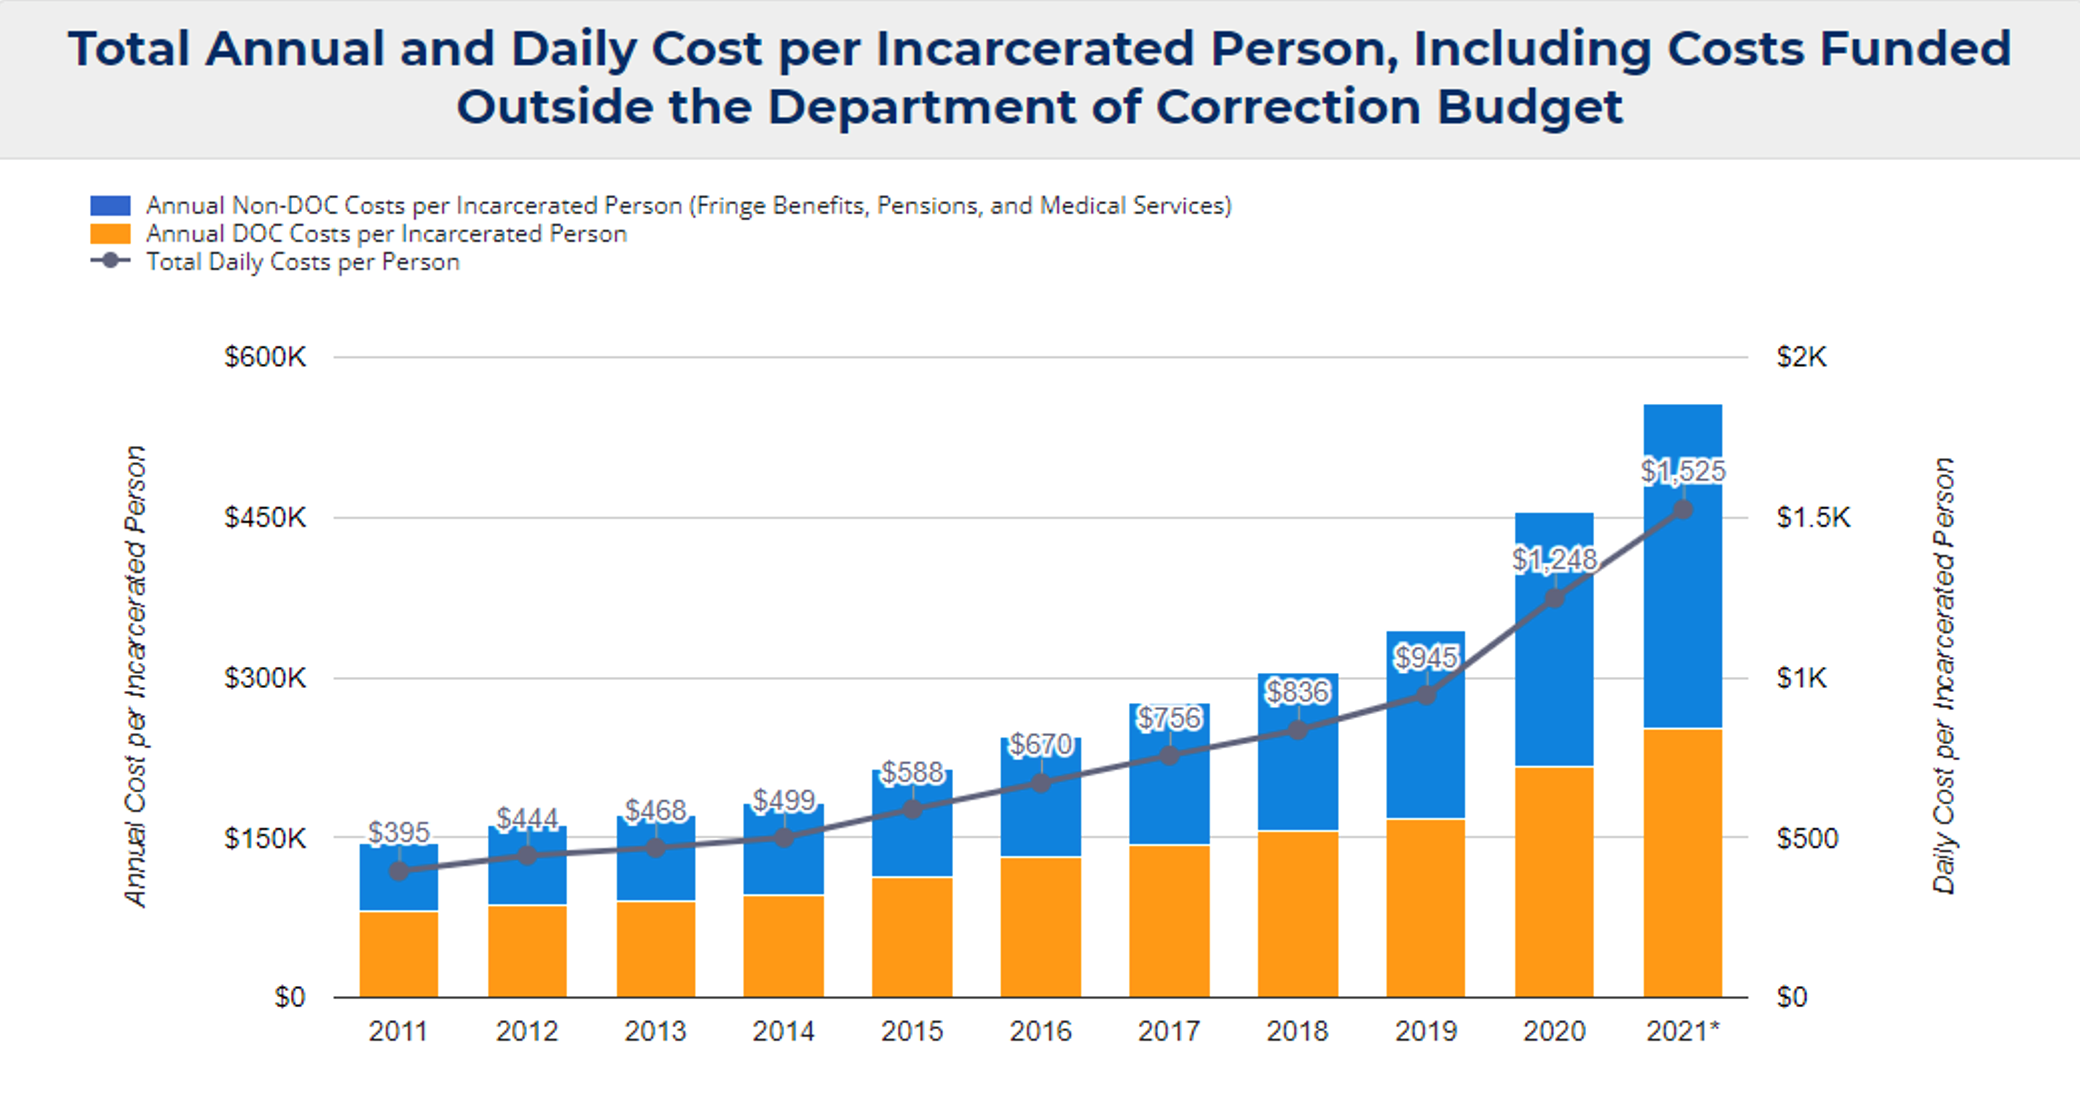
Annual cost of incarceration grew to $556,539 a person per year – or $1,525 each day
The full annual cost per person nearly quadrupled from FY 2011 to FY 2021
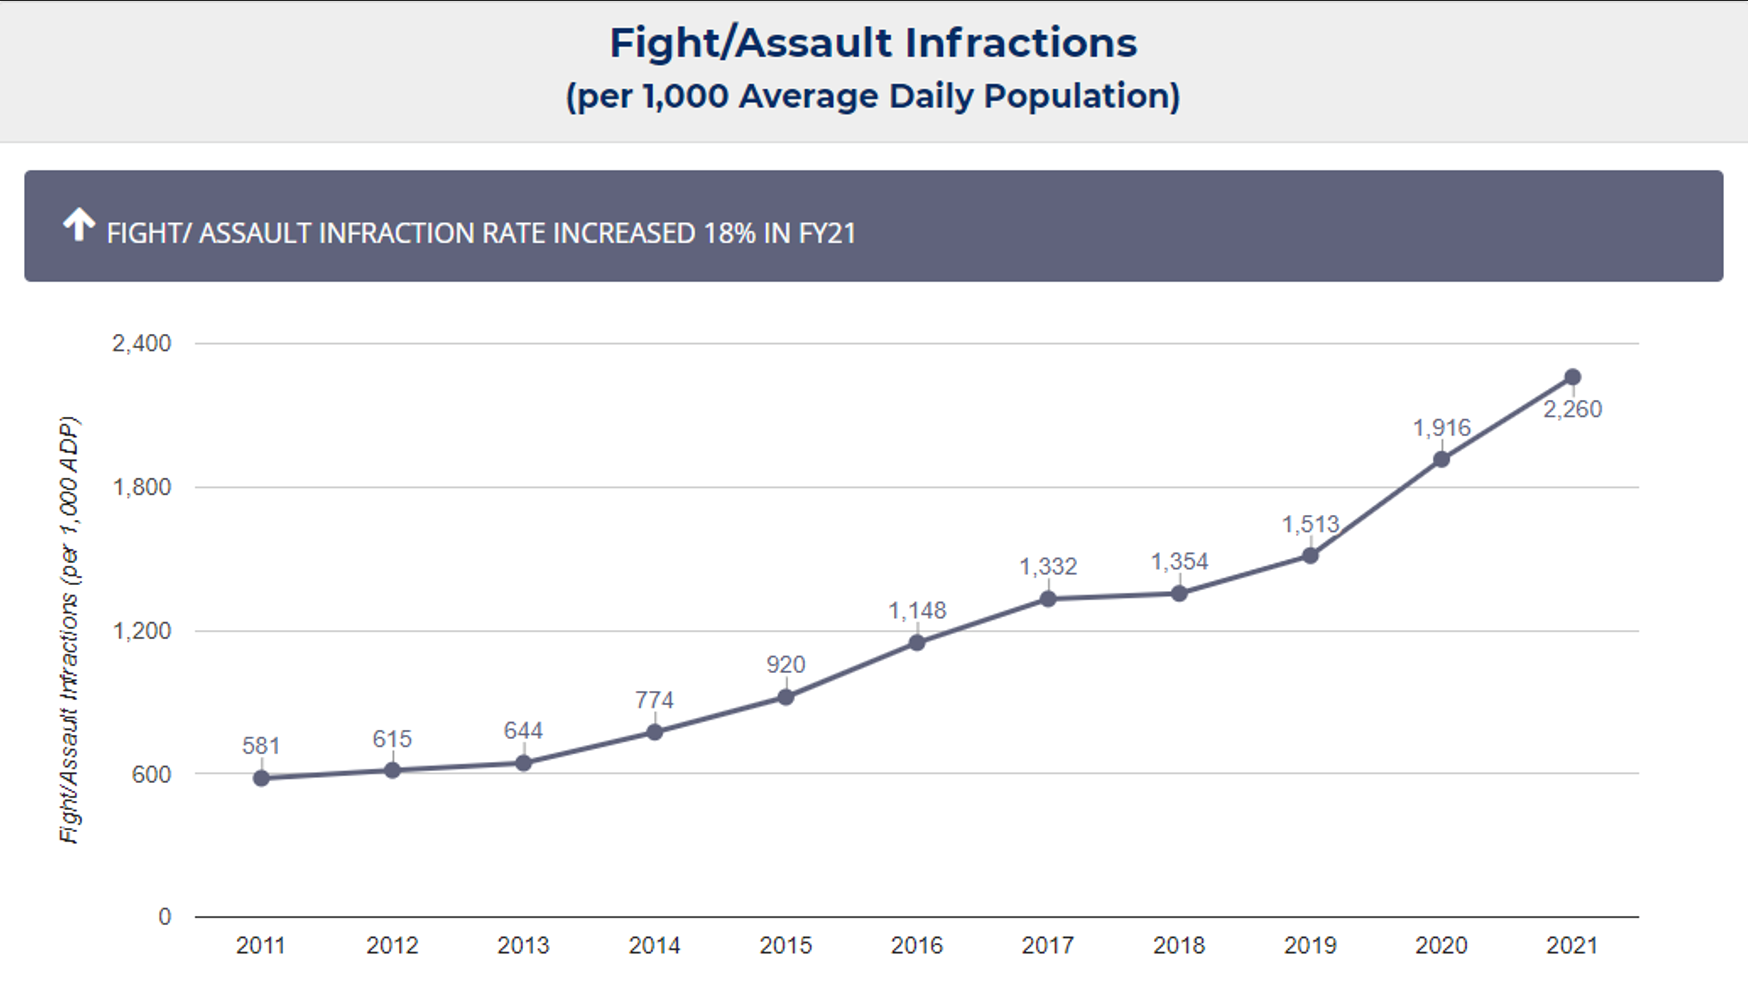
Despite a 15% decline in the average daily population, the absolute number of violent infractions rose slightly from FY 2020 to FY 2021
(New York, NY) — The cost of incarceration per person in New York City rose to an all-time high in Fiscal Year (FY) 2021, according to a new analysis of the Department of Correction (DOC) released today by New York City Comptroller Scott M. Stringer. The City now spends $556,539 to incarcerate one person for a full year, or $1,525 per day – nearly quadrupling since FY 2011. As identified in previous analyses by the Comptroller’s Office, rates of violent incidents continue to rise: despite a 15% decline in the average daily population, the absolute number of fight and assault infractions rose slightly from 11,191 in FY 2020 to 11,214 in FY 2021.
“The City is spending more and more to incarcerate fewer and fewer individuals – yet the numbers show that rates of violence and use of force in our jail system are substantially increasing,” said Comptroller Stringer. “As the jail system continues to shrink and yield significant savings, the City should use these resources to leverage better all-around outcomes. We need to invest in a humane, modern, and efficient corrections system that keeps our incarcerated population as small as possible while prioritizing safety and security.”
This analysis is the Comptroller’s eighth annual update of spending and performance trends of the New York City Department of Correction. The analysis uses budget data, claims against the City, reports of violence in City jails, and personnel data to analyze the DOC’s operations.
According to the Comptroller’s FY 2021 Department of Correction analysis:
The full annual cost of incarceration grew to $556,539 per person in FY 2021.
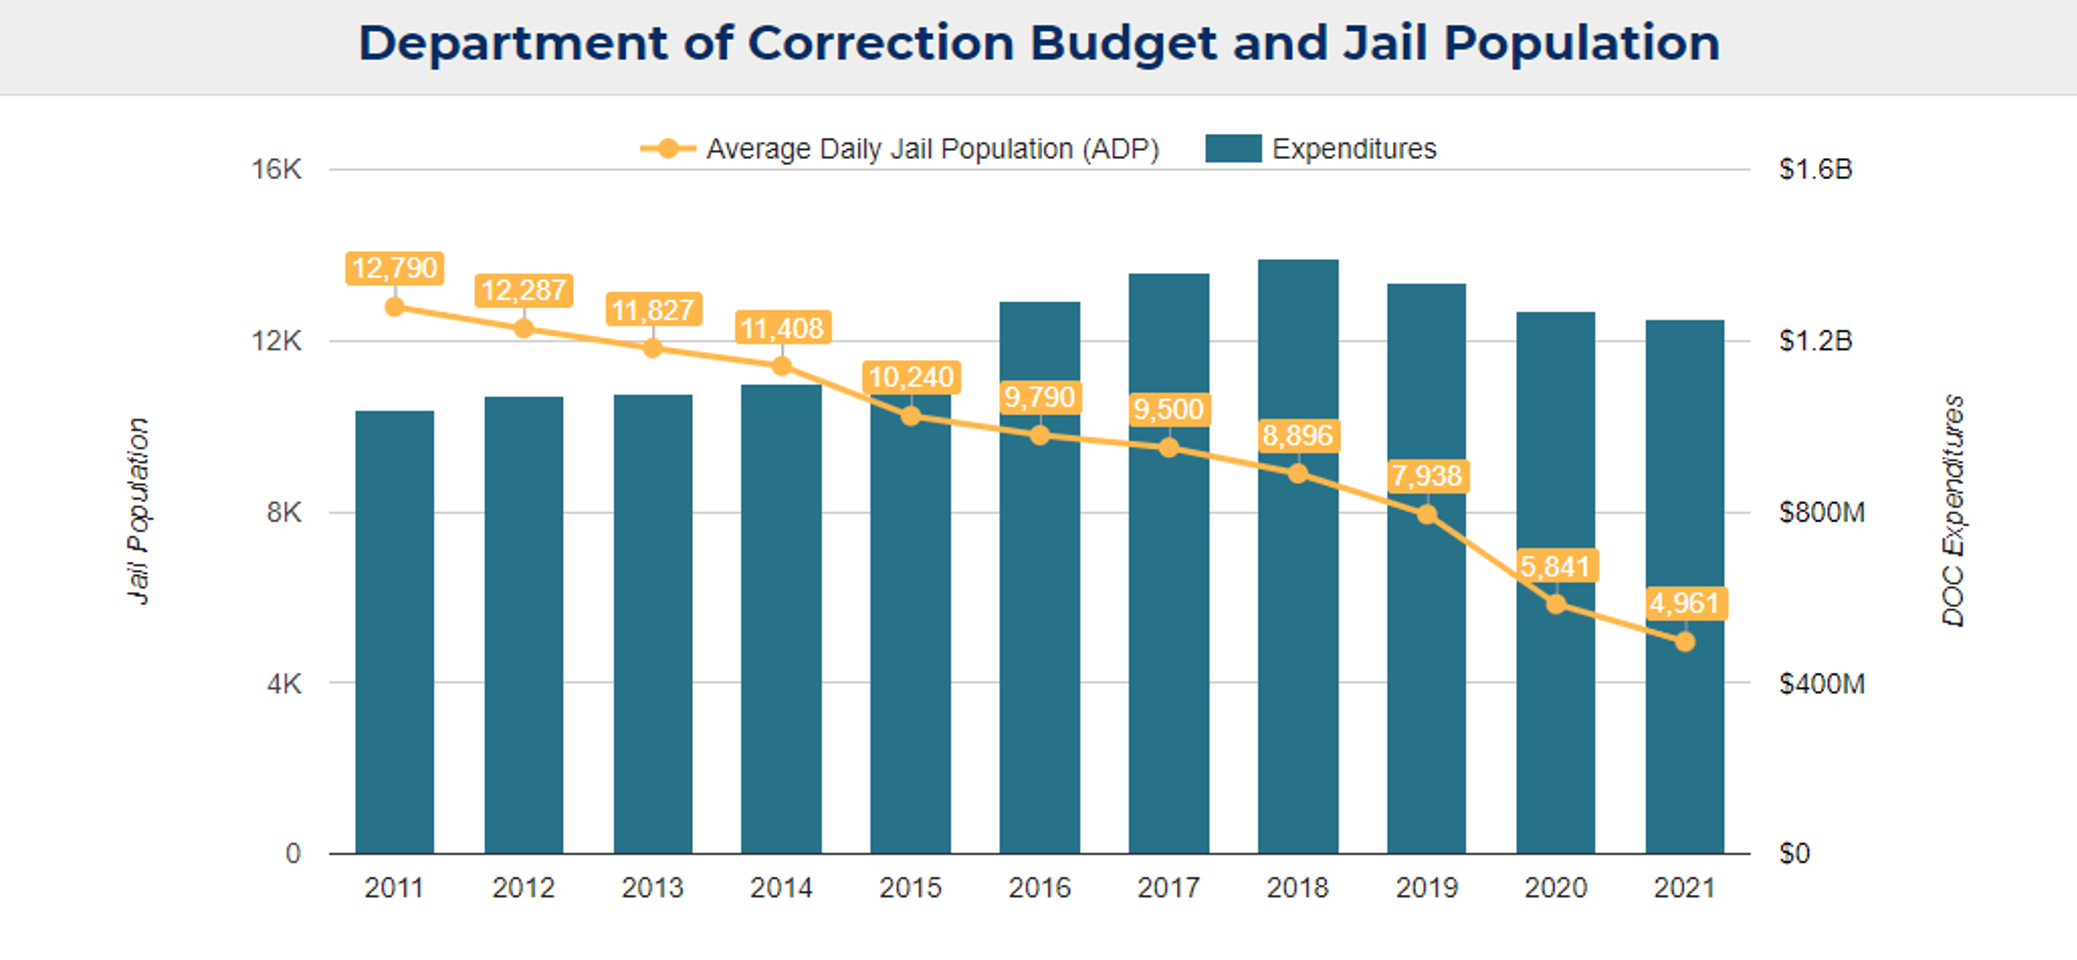
- DOC’s budget has declined for the last three years, contracting 10% from $1.39 billion in FY 2018 to $1.25 billion in FY 2021. Including additional costs outside the DOC budget, such as employee fringe benefits and health care expenses for the incarcerated population, the full cost of incarcerating one person for one year was $556,539 in FY 2021. As the jail population dropped at a steep pace, the full annual cost per person nearly quadrupled from FY 2011 to FY 2021.
- DOC staff earned $153 million in overtime in FY 2021, down 44% from its peak of $275 million in FY 2016.
Average daily jail population fell 61% from FY 2011 to 2021
- The average daily jail population fell by 61% from 12,790 in FY 2011 to 4,961 in FY 2021. The pandemic contributed to a temporary drop in the jail population at the end of FY 2020 as non-essential activity ground to a halt and city and state officials endeavored to reduce the population amid the threat of COVID-19. Amid the reopening of the economy, as well as pandemic-related interruptions to court proceedings, the jail population steadily rose for most of FY 2021. More recently, the jail population briefly exceeded 6,000 in late August and early September before declining modestly to about 5,500 at the end of October.
The ratio of correction officers to incarcerated persons continued to rise
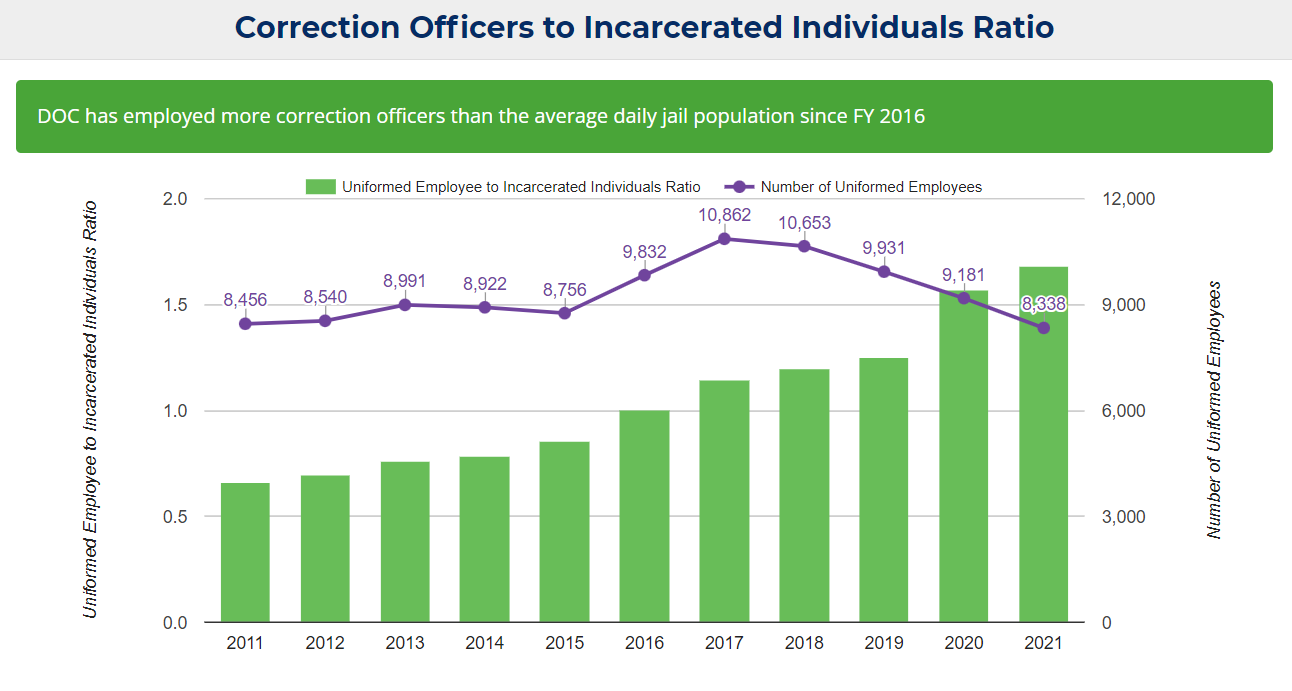
- After a headcount expansion in FY 2016 and FY 2017, the number of uniformed personnel employed by DOC has fallen steadily, dropping to 8,338 at the end of FY 2021. Compared to FY 2011, the number of correction officers has declined by 1%.
- Because the jail population fell faster than the decline in staffing, the ratio of guards to the average jail population has risen. Since FY 2016, DOC has employed more guards than the average daily population, with the department employing 1.7 guards per incarcerated person in FY 2021.
Rates of violent incidents keep rising
- Despite a 15% decline in the average daily population, the absolute number of fight and assault infractions rose slightly from 11,191 in FY 2020 to 11,214 in FY 2021. As a result, the annual rate of fight and assault infractions per 1,000 incarcerated persons increased 18% from 1,916 in FY 2020 to 2,260 in FY 2021. Since FY 2011, the rate has nearly quadrupled. In FY 2011, the DOC reported 7,431 fight and assault infractions.
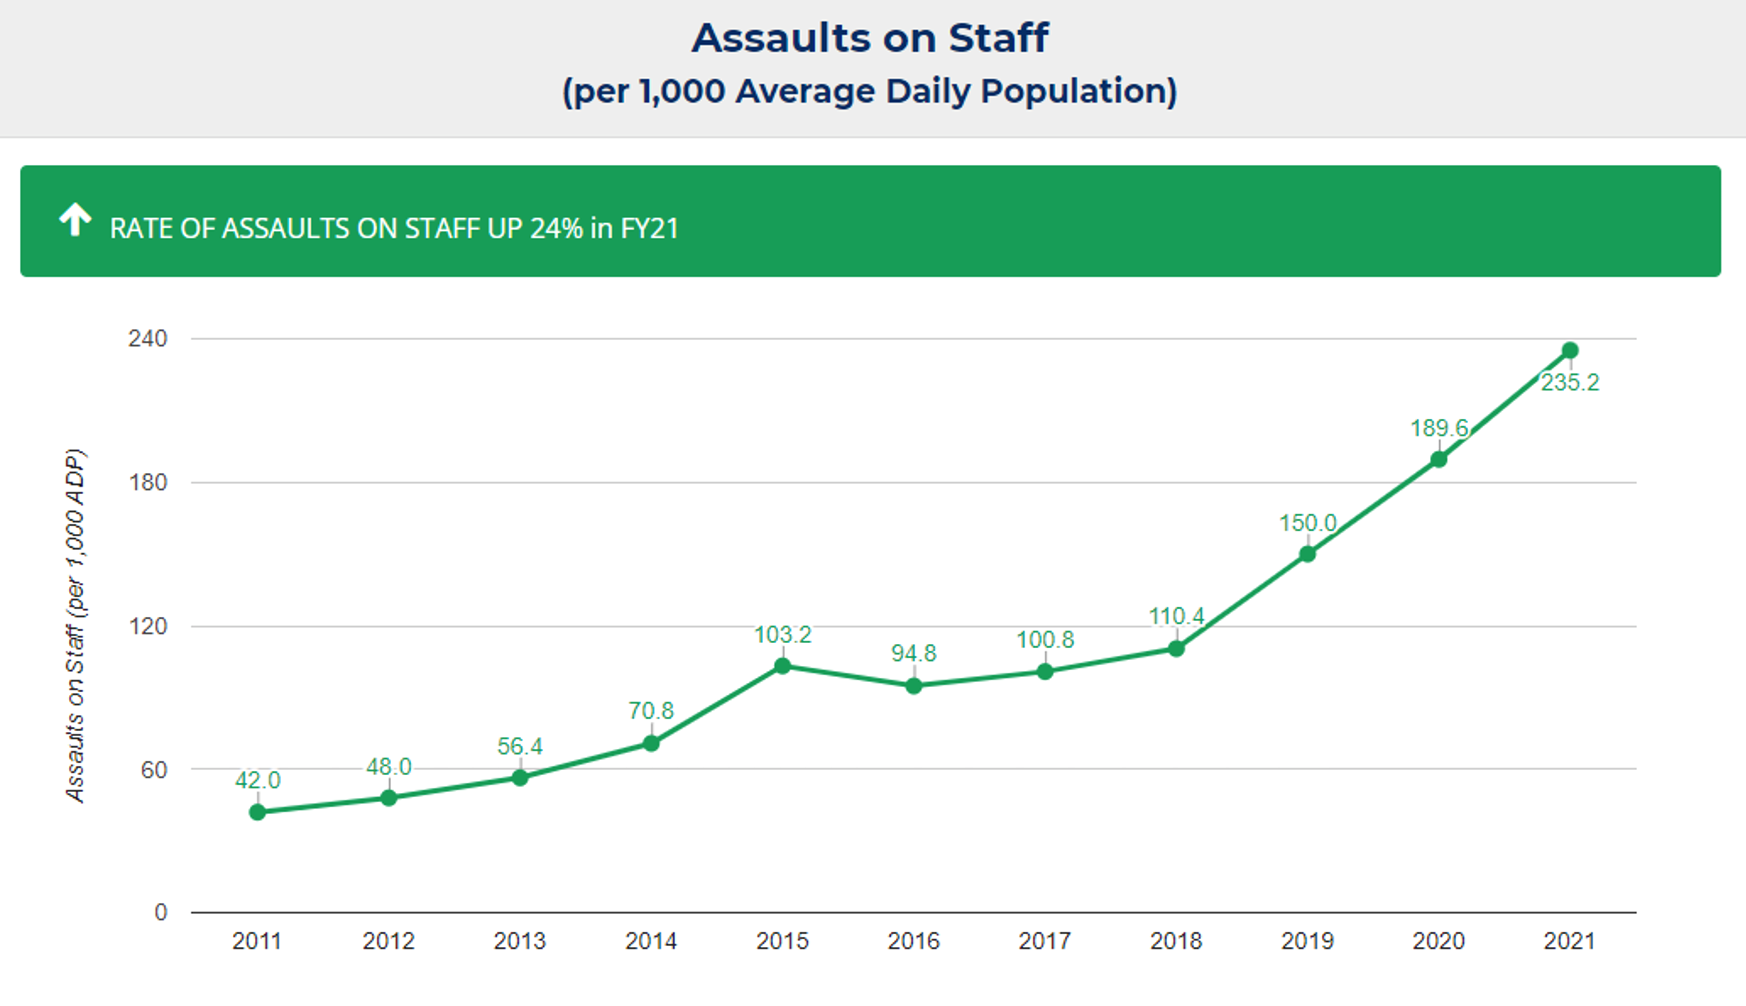
- Over the last ten years, the annual rate of assaults on DOC staff more than quintupled from 42.0 per 1,000 incarcerated individuals in FY 2011 to 235.2 in FY 2021. The rate increased by 24% in FY 2021 alone.
- The absolute number of use of force incidents and allegations also rose in FY 2021, rising 10% from 7,047 in FY 2020 to 7,743 in FY 2021. Adjusted for the jail population, the use of force rate increased 779% from 178 per 1,000 incarcerated individuals in FY 2011 to 1,561 in FY 2021.
- As of FY 2021, more than half of incarcerated individuals had a mental health diagnosis. The share steadily rose from 32% in FY 2011 to 46% in FY 2020 prior to jumping to 53% in FY 2021.
- Tort claims filed for personal injury at a correction facility fell for the second consecutive year in FY 2020 but were still nearly triple the number in FY 2011.
To read the full analysis, click here.
###