Comptroller Stringer Releases New “Affordability Index” to Monitor Escalating Affordability Crisis

First-of-its-kind NYC Affordability Index tracks incomes and expenditures of four representative New York City households
Costs of basic needs outpacing incomes, leaving New Yorkers with less money for savings, education, or emergencies
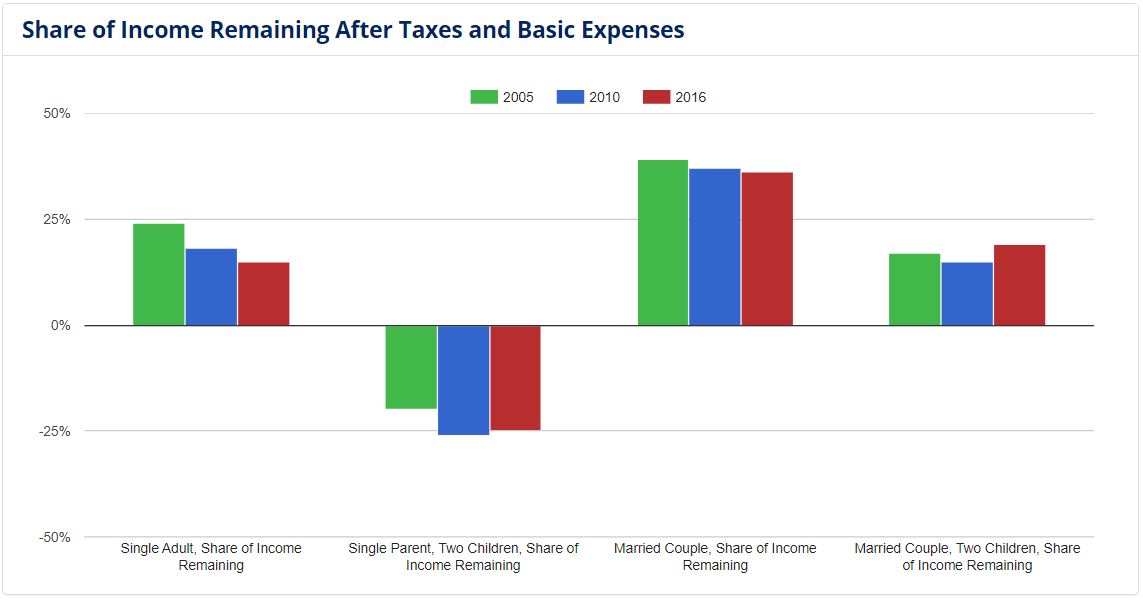
(New York, NY) – New York City Comptroller Scott M. Stringer today released a new first-of-its-kind tool for examining how the City’s mounting affordability crisis strains the everyday lives of representative New Yorkers. The new “Affordability Index” specifically tracks how much money New York City households have left over after taxes and basic expenses – money which they could use to save for retirement, pay for college expenses, or just take a family vacation – which the index finds has declined substantially, leaving New Yorkers with less money saved for a rainy day.
The NYC Affordability Index analyzes the particular challenges that New York City residents face as affordability declines, which other indicators fail to capture. The Index shows that basic costs for necessities like housing, transportation, health- and child-care, as well as food, have risen at nearly twice the rate of incomes, with damaging effects for New York City households:
- For New York City’s single adults, basic monthly expenses rose almost $200 more than incomes from 2005 to 2016, leaving those households with only $641 leftover after taxes and basic needs in 2016, down from $831 a decade ago.
- Single parents with two children struggle the most to afford living in New York City and have significant trouble paying for basic necessities. For these households, the costs of basic expenses exceeded incomes by nearly 25 percent in 2016.
- In fact, the analysis showed that since 2005 single adults with children saw monthly basic expenses rise by $1,219, outpacing income growth by over 40 percent.
“We all feel the squeeze from incomes that lag behind rising costs – but now, we’re showing exactly what that means for New Yorkers across our city. With this tool we’re taking a long-term look at how the City’s changing economy is affecting our neighbors and friends,” said New York City Comptroller Scott M. Stringer. “Over the last decade, the money that New Yorkers could be putting away – for retirement, for college, or even for a simple family night out – has been shrinking. Our growing affordability crisis is making it harder for families to enjoy a basic middle-class lifestyle – and is forcing them to choose between staying in New York City and leaving. We can’t allow working people to be pushed out of New York and become a city where only the wealthy can afford to live. To keep New York an aspirational city, we have to do more.”
The Affordability Index will be updated annually to monitor the economic struggles of four typical City household types: single adults, married couples with no children, single parents with two children, and married couples with two children.
In its analysis of incomes, tax rates, household budgets, and spending on basic necessities, the Affordability Index shows that from 2005 to 2016:
Rising Costs of Basic Necessities Outpace Income Growth
- Typical household incomes increased by just 2.7 percent per year for a single parent, two-children household; 1.8 percent for a single adult household; 2.9 percent for a married couple household; and 3.3 percent for a married couple, two-children household;

- At the same time, median rents in New York City increased on average by 4 percent a year – nearly 50% since 2005;
- The median cost of a one-bedroom apartment increased $530, from roughly $990 for a one-bedroom apartment in 2005, to $1,520 in 2016. For a two-bedroom apartment, median rent increased at roughly the same rate, from $1,120 in 2005 to $1,670 in 2016;
- Food costs increased by an average 2.2 percent per year from 2005 to 2016, increasing food costs for married couples with two children from $708 in 2005, to $902 in 2016;
- Transportation costs increased by an average 3.2 percent per year over the same period, from $160 per adult in 2005, to $228 per adult in 2016;
- Health care costs increased by 5-6 percent per year from 2005 to 2016; and
- Child care costs increased by 3.2 percent per year from 2005 to 2016, from a monthly rate of $650 in 2005 to $867 in 2016.
“While declining affordability is a crisis in so many cities, it hits New Yorkers particularly hard,” said Comptroller Stringer. “We need to use every tool in the kit to tackle this crisis head-on. From building the next generation of affordable housing to addressing the rising cost of child care, we have to take a stand and make sure everyone gets a fair shot to succeed in New York.
###