Comptroller Stringer Releases New Report And Survey Results On The Human Impacts Of Subway Delays On Straphangers’ Lives

In last three months, 74% of respondents report being late to work; 65% late to pick up/drop off child; 29% late for doctor’s appointment
73% Give the MTA a “C,” “D,” or “F” Grade For Subway Service
Delays worst for residents of the Bronx, where 54% report delays “More than Half of the Time” or “Always”
(NEW YORK, NY) – New York City Comptroller Scott M. Stringer today released the results of a major citywide survey of subway riders, highlighting the effects of subway delays on people’s lives and livelihoods and illustrating widespread dissatisfaction with service. The results – based on more than 1,200 in-person surveys, gathered at 143 stations touching 150 unique zip codes across all five boroughs — also revealed that residents in lower-income communities are more likely to be reprimanded at work, lose wages or suffer other consequences as a result of delays than those living in higher-income areas.
“This is a crisis – there’s no doubt about it. Delays are rising, service is declining, and New Yorkers are frustrated like never before. What we show here is that behind every delay, there’s a human cost, and behind every service disruption, there are lives affected. This report shows that inconsistent and delayed service is impacting New Yorkers in big ways and small, each and every day,” Comptroller Stringer said. “This is a challenge that did not start overnight and won’t be fixed overnight. We have a signal system that is 70 years old, cars that are some of the oldest in the world, and overcrowding that make New Yorkers feel jam-packed like sardines. A failure to invest decades ago led us to where we are today. Let there be no doubt that we need an all-hands-on-deck approach now. New York City’s ability to stay on top in this century – and the next – hinges on the quality of our transportation system.”
The survey showed that delays are jeopardizing New Yorkers’ job and financial security. Respondents said that over the last three months alone, delays caused:
- 74 percent to be late for a work meeting
- 22 percent to be late for a job interview
- 18 percent to be reprimanded by their supervisors
- 13 percent to lose wages
- 2 percent to be fired from a job
As a result of subway delays, at some point over the last three months, many straphangers said they were forced to resort to alternative forms of transportation:
- 50 percent said they had to take a taxi or other for-hire vehicle to work
- 42 percent walked to work
- 40 percent took a bus
- 10 percent drove
- 6 percent biked
Outside of work, subway service also disrupted the personal lives of subway riders. Over the last three months, 65 percent of respondents said that delays had caused them to be late to pick-up, drop-off, or attend a child’s function, while 29 percent of straphangers were late for a medical appointment.
Overall, some 71 percent of respondents reported significant delays at least half the time they used the subways, while just one percent said they never experienced a significant delay. When asked to grade subway service:
- 14 percent of respondents graded subway service an “F”
- 24 percent graded it a “D”
- 35 percent graded it a “C”
That means nearly three-quarters of survey respondents graded service a “C” or lower, and one out of seven riders gave the subway a failing grade.
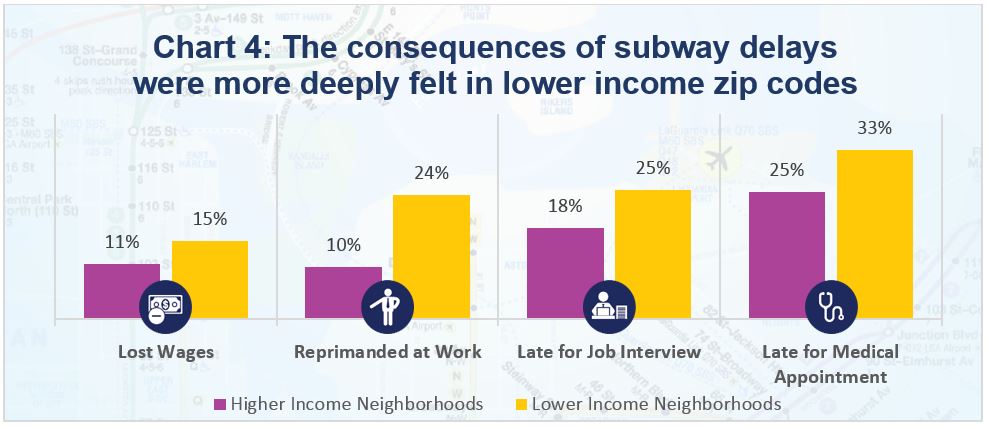
The survey also showed that late trains are affecting those from lower-income zip codes more than those from wealthier neighborhoods. Among respondents in lower-income areas, for instance, 24 percent reported being reprimanded at work because of subway delays, compared to just 10 percent among those living in higher income areas.
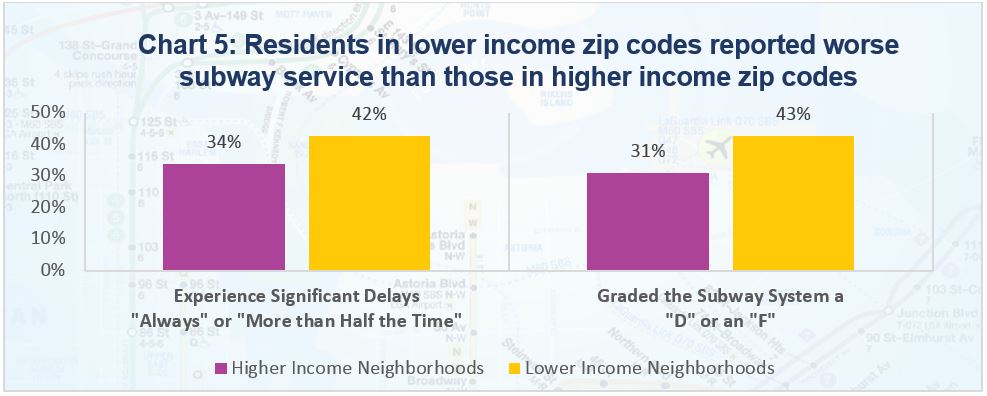
Overall, 42 percent of respondents from lower income areas experienced significant delays “Always” or “More than Half the Time,” compared to 34 percent of those from higher income zip codes.
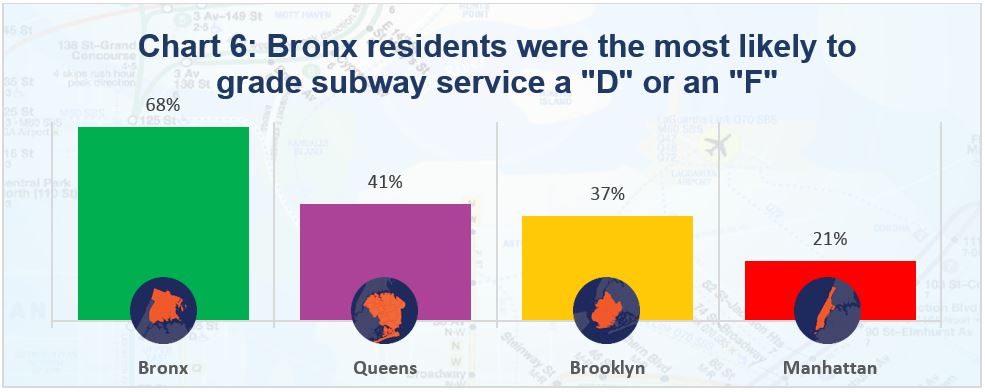
These disparities in service were also evident at the borough level. Residents outside of Manhattan reported far worse service, with 68 percent of Bronx respondents grading subway service a “D” or an “F,” compared to 41 percent of Queens residents, 37 percent of Brooklynites, and 21 percent from Manhattan.
In the Bronx, 54 percent of respondents experienced delays “More than Half of the Time” or “Always,” compared to 45 percent of Queens residents, 40 percent from Brooklyn, and 25 percent of Manhattanites.
When asked whether the subways had improved since this time last year, 46 percent of respondents said service was “Slightly” or “Far Worse” than it was at this time last year. Fifty-eight percent of Bronx residents reported that subway service was “Far Worse” or “Slightly Worse” than last year, compared to 42 percent of Manhattanites.
Further, while on-train announcements are meant to clarify the causes of delays and, where relevant, provide information about alternative routes, most riders do not find them useful. Nearly 85 percent of respondents graded these announcements a “C” or lower.
To view the full report, click here: http://comptroller.nyc.gov/reports/the-human-cost-of-subway-delays-a-survey-of-new-york-city-riders/
###