Comptroller Stringer Analysis: As Inmate Population Reaches New Low, Correction Budget Continues to Soar
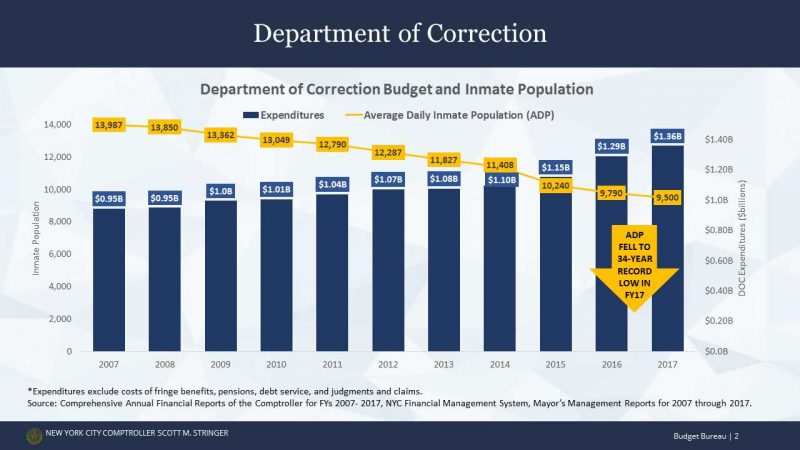
The DOC’s budget hit an all-time high of $1.36 billion in Fiscal Year 2017 — but the average daily inmate population fell to a 34-year low of 9,500
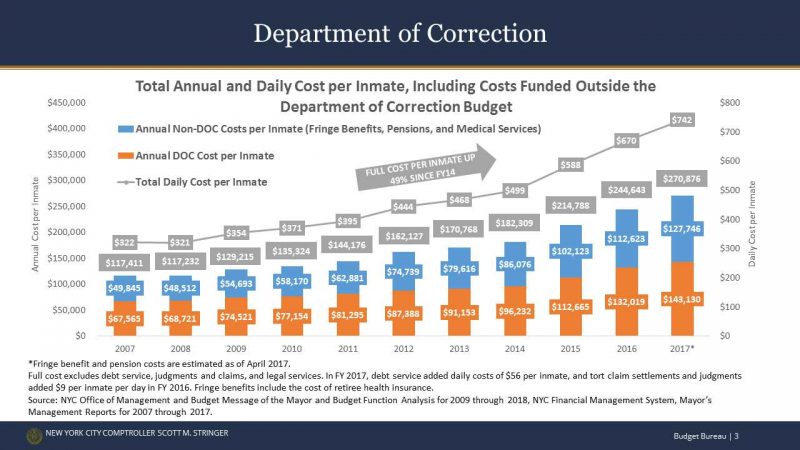
Annual cost per inmate has skyrocketed 112% over the last decade
(New York, NY) — During the past Fiscal Year, the City Department of Correction (DOC) budget has soared to a record-high $1.36 billion, despite a 34-year low average daily population of 9,500, according to a new analysis released today by New York City Comptroller Scott M. Stringer. The new analysis also highlights how – despite employing more than a 1-to-1 ratio of officers to inmates – the cost per inmate has risen significantly while overtime has nearly doubled over the past several years.
“We need to transform criminal justice in this city and in this country. We need a smart, modern, and fair corrections system. Right now, the inmate population is at its lowest point in decades, but costs continue to rise dramatically. An extraordinary decline in inmates should yield cost-savings and better all-around outcomes – not dramatic spending increases. That’s what’s so alarming about the numbers,” New York City Comptroller Scott M. Stringer said. “We have to do better, and as this analysis makes clear, we’re putting far more money into far fewer inmates. It’s one of the many reasons that I believe we need to close Rikers on a quick timeline and take a 21st century approach to criminal justice.”
Comptroller Stringer’s analysis uses budget data, claims against the City, reports of violence in City jails, and personnel data to analyze the Department of Correction’s operations. According to the analysis:
The DOC’s Budget Reached an All-Time High in FY 2017 — Even as the Inmate Population has Plummeted
- In Fiscal Year 2017, the DOC’s budget reached $1.36 billion — up 44% since FY 2007.
- Over the same time period, the average daily inmate population (ADP) fell to a 34-year low of 9,500. Just a decade ago, the ADP was nearly 14,000.

Per-Inmate Costs Rise Dramatically
- The annual cost per inmate to the Department of Correction (DOC) has reached $143,130. That is up 112% over the last decade.
- The annual cost per inmate when including expenses funded outside of the DOC budget, such as fringe benefits, pension costs, and medical services, has reached $270,876. That reflects a 131% rise over the last decade and a 49% jump since FY 2014.
- The daily cost per inmate – when including fringe benefits, pension costs, and medical services – is now $742.

The DOC has More Correction Officers than Inmates — but Overtime Costs have Remained High
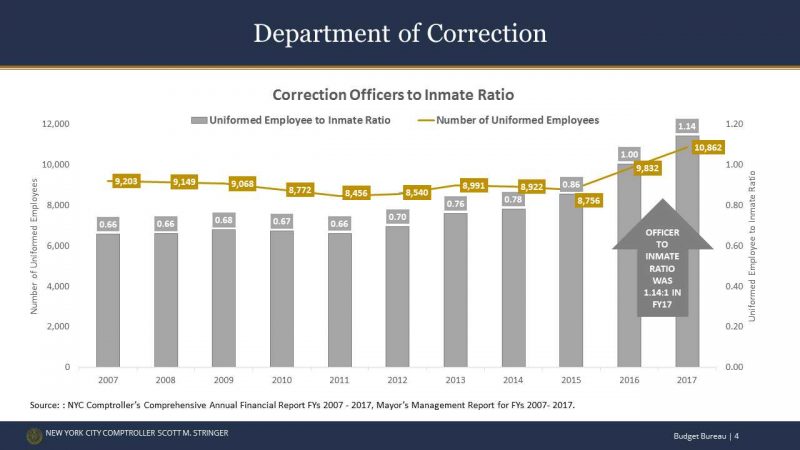
- At the end of Fiscal Year 2017, the DOC employed 10,862 uniformed employees, up from 9,832 in FY 2016. The average daily inmate population was 9,500.
- The ratio of correction officers to inmates has reached 1.14. For the second consecutive year, New York City has had more uniformed employees than inmates in the system.
- Despite the high staffing ratio, the average overtime expense per inmate – which has soared in recent years, rising to $28,045 in FY 2017 — remained effectively flat when compared to the year prior.

More Staffing Has Not Yielded A Safer Corrections System
Part of the increase in costs and staffing stems from an expansion of jail programs, greater security measures, and new training – all laudable goals and initiatives. Yet, so far, those investments have yielded few positive outcomes when it comes to lowering violence.
- In FY 2017, the rate of fight/assault infractions per 1,000 average daily population grew to 1,332. This represents a 16% increase since FY 2016 and a 183% increase since FY 2007.
- The rate of inmate assaults on staff per 1,000 ADP grew 6% from FY 2016 to FY 2017, reaching 100.8. Since FY 2007, the rate of inmate assaults on staff has grown by nearly 220%.
- The rate of use of force by correction officers on inmates fell 1% to 534 incidents per 1,000 ADP from FY 2016.
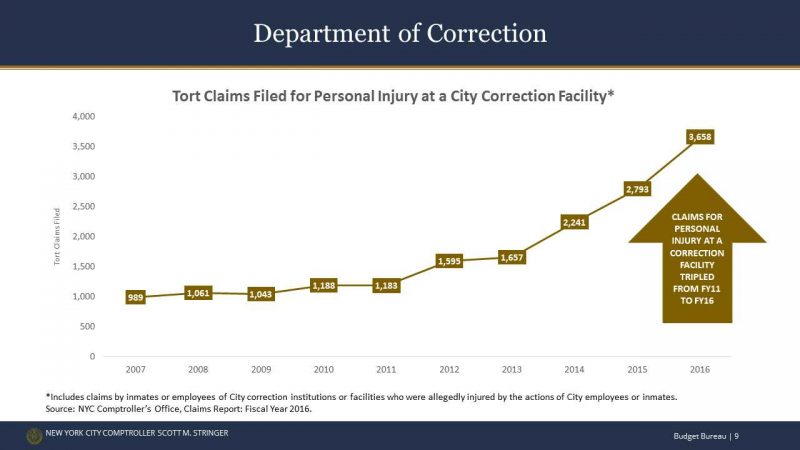
- The number of tort claims filed for personal injury at City Correction Facilities reached 3,658 in FY 2016, up 31% from FY 2015. Since FY 2007, the number of claims has jumped 270%.

To view the full analysis, click here.
###