
Why is This Agency on the Watch List?
Homeless services provider agencies are on the Comptroller’s Agency Watch List for the second consecutive year. First announced in 2018, the Agency Watch List spotlights city agencies that raise the most budgetary concerns due to rapidly increased spending and meager measurable results. The following report reviews trends and recommends indicators that should be reported and monitored to evaluate the effectiveness of agency spending in achieving the Administration’s stated goals.
Despite extraordinary increases in spending for homelessness prevention and permanent housing, the homeless population in shelter has remained stubbornly high, resulting in rising costs for shelter and associated homeless services to meet the legal mandate to provide shelter.
New York City’s homeless services expenditures cross six agencies that share responsibilities for supporting, sheltering and permanently housing every eligible person or family that seeks assistance, including the Department of Homeless Services (DHS), the Department of Social Services (DSS), the Department of Youth and Community Development (DYCD), the Department of Health and Mental Hygiene (DOHMH), the Department of Housing Preservation and Development (HPD) and the Department of Veterans Services. In this report, we present an update to our methodology for measuring homeless services expenses to account for the increasing breadth of spending for homeless populations across multiple city agencies.
Recent Developments
- The City has laudably pledged to phase out cluster site shelter units which are private apartments that have been used as shelter. This program, which was first instituted in 2000, has come under criticism for its exceptionally high expenses, among other concerns. At the beginning of 2016, the City was utilizing more than 3,600 of these housing units for shelter. These units are planned for conversion to either Tier II shelters that will be run by local non-profit organizations or as permanent affordable housing.
- The Comptroller’s Office has expressed concern about the expense and transparency of the City’s cluster site conversion process. In particular, the City has recently committed to purchase 17 cluster site buildings in the Bronx and Brooklyn at a cost of $173 million.
Budget and Spending
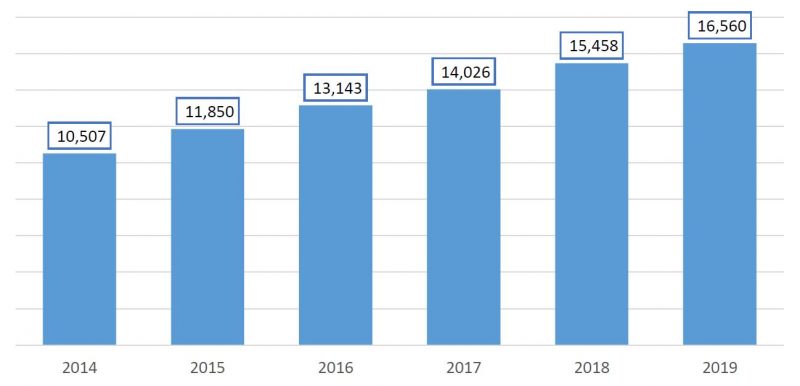
- Between FY 2014 and the current year, citywide spending on homelessness has more than doubled, to $3.2 billion.
- Shelter costs have more than doubled over the same period, to $1.9 billion in FY 2019.
- Spending on programs to prevent homelessness or provide successful permanent exits from shelter has risen from $436 million in FY 14 to $1.0 billion in FY 2019.
- As of the FY 2020 Executive Budget, the Comptroller’s homeless services construct has been revised and updated to include new expense categories introduced since the original construct was formulated, and refines the definition of shelter spending. This updated approach to measuring homeless services spending provides a more comprehensive summary of the City’s homeless services expenditures to date.
| ($ in millions) | FY 2014 | FY 2015 | FY 2016 | FY 2017 | FY 2018 | FY 2019* | FY 2020* |
| Adult Shelter Operations | $326 | $356 | $456 | $572 | $709 | $666 | $638 |
| Family Shelter Operations | 505 | 577 | 653 | 933 | 1,134 | 1,126 | 1,142 |
| Domestic Violence and Youth Shelters | 69 | 76 | 82 | 88 | 91 | 111 | 110 |
| Rental Assistance | 215 | 249 | 318 | 419 | 464 | 546 | 585 |
| Prevention, Diversion, Anti-Eviction & Aftercare | 221 | 290 | 362 | 430 | 425 | 463 | 442 |
| Homeless Administration & Support | 151 | 160 | 204 | 227 | 260 |
316 |
324 |
| TOTAL | $1,488 | $1,708 | $2,075 | $2,669 | $3,083 | $3,227 | $3,241 |
SOURCE: Office of the Comptroller; Financial Management System. NOTE: *Budgeted as of FY 2020 Executive Budget.
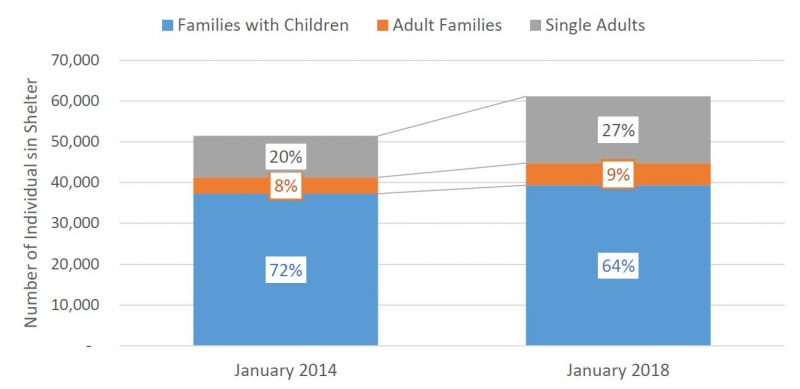
Shelter Population Trends
- As of April 24, 2019, the official New York City shelter census has increased by 11.5 percent overall since April 24, 2014. This growth is driven primarily by increases in the number of single adults in shelter, which has risen by 57.6 percent, and the adult family population, which has risen by 34.6 percent. The number of families with children has increased by 9.4 percent during this same time period, and the total number of children in shelter has decreased by 7.6 percent.
- The overall shelter census hit an all-time high of 61,415 individuals on January 12, 2019. However, some favorable short term shelter trends have emerged in the last year. Notably, the overall shelter census declined slightly from April 24, 2018 to April 24, 2019, dropping by 1.5 percent, and there are 1,150 fewer children in shelter over this same time period.
Single Adults in Shelter as of April 24th
SOURCE: Office of the Comptroller; NYC Open Data.
- The proportion of single adults in shelter continues to grow while the population of family with children declines as a share of the total shelter population.
Single Adults a Growing Share of Shelter Population
SOURCE: Office of the Comptroller; NYC Open Data.
Indicators to Watch
- Average daily shelter population, by household type (Daily DHS Shelter Census; http://www1.nyc.gov/assets/dhs/downloads/pdf/dailyreport.pdf).
- Changes in the youth and single adult shelter populations.
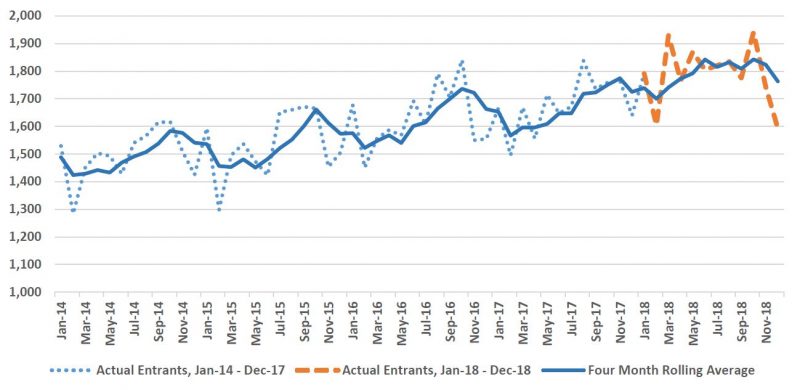
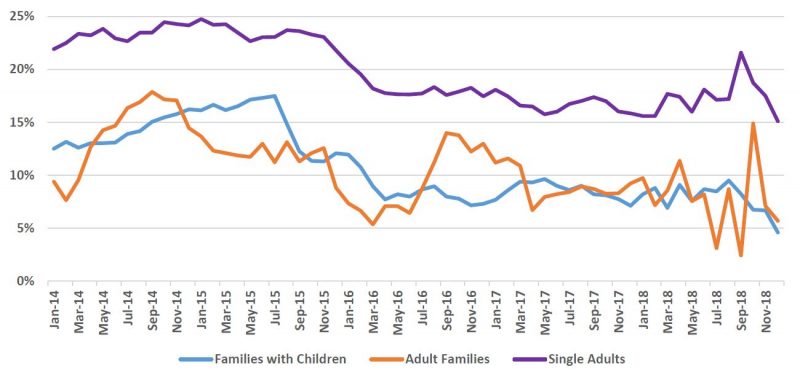
Shelter Entrants
- Among the most important indicators of the City’s homelessness outlook are the number of individuals and households that apply for shelter and enter the shelter system. The charts below detail monthly entrant totals, with entrants in calendar year 2018 colored in orange.
Families with Children Shelter Entrants
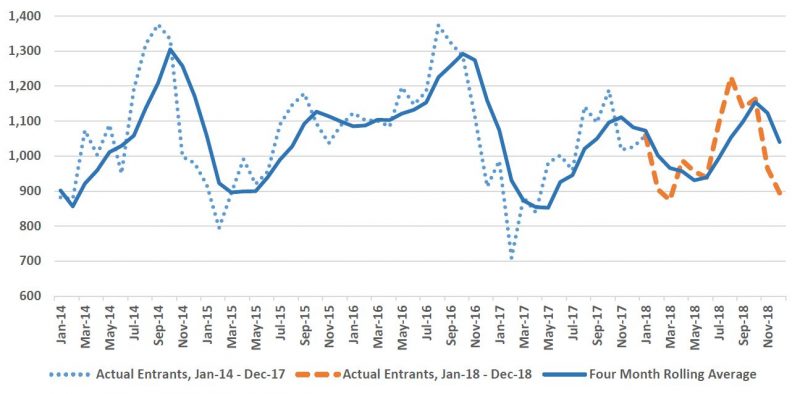
SOURCE: Office of the Comptroller; DHS STAT Reports.
Adult Family Shelter Entrants
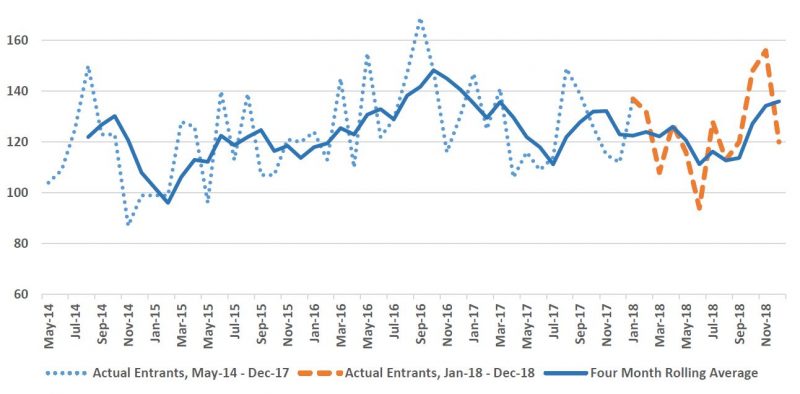
SOURCE: Office of the Comptroller; DHS STAT Reports.
Single Adult Shelter Entrants
SOURCE: Office of the Comptroller; DHS STAT Reports.
Indicators to Watch
- Applications for shelter by household type; quarterly (not publicly reported)
- Reasons for seeking shelter; quarterly (not publicly reported)
- Disposition of applications; quarterly (not publicly reported)
- Diversions from shelter at PATH Center; quarterly (MMR and Daily DHS Shelter Census)
Subsidized Housing Placements
- Subsidized housing placements from shelter has ramped up substantially since FY 2014, topping out at more than 11,000 placements in FY 2018. Based on data from the first half of FY 2019, subsidized housing placements are on pace to meet FY 2018 levels.
- Supportive housing programming expenses have ramped up since FY 2015 as the City works to introduce 15,000 units of supportive housing by 2030.
- The rate of returns to shelter has generally declined for all family types.
| Rental Assistance Spending ($$ thousands) |
FY 2014* | FY 2015 | FY 2016 | FY 2017 | FY 2018 | FY 2019** | FY 2020** |
| Rental Assistance Programming | — | $16,256 | $73,947 | $156,247 | $153,849 | $200,818 | $210,933 |
| Rental Assistance and Housing Placement (DHS) | $25,324 | $24,147 | $22,807 | $25,015 | $24,757 | $20,424 | $14,045 |
| Supportive Housing Programming | $189,294 | $208,361 | $220,286 | $237,587 | $285,379 | $325,229 | $360,314 |
| Total Rental Assistance | $214,619 | $248,763 | $317,839 | $481,849 | $463,985 | $546,470 | $585,292 |
| Total Subsidized Housing Placements from Shelter | 2,130 | 7,836 | 9,611 | 9,529 | 11,098 | 5,448 | N.A. |
NOTE: *Subsidized Housing Placements reflect the half-year period from Jan-14 – Jun-14; **Expenditures as of FY 2020 Executive Budget, Subsidized Housing Placements reflect the half-year period from July-18 – Dec-18.
Subsidized Permanent Housing Placements – Families with Children in Shelter
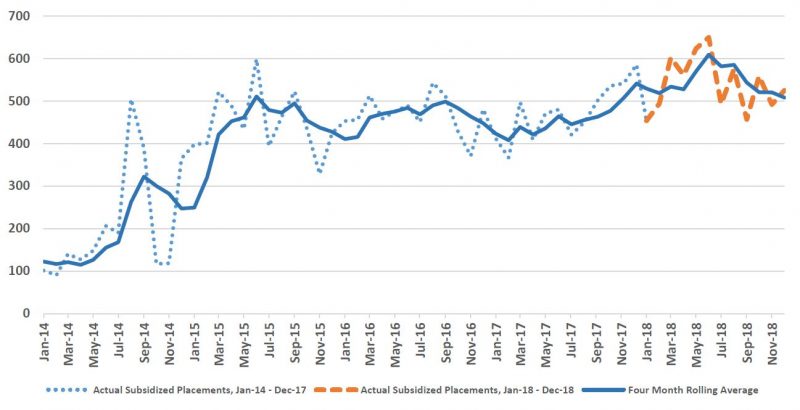
SOURCE: Office of the Comptroller; DHS STAT Reports.
Subsidized Permanent Housing Placements – Adult Families in Shelter
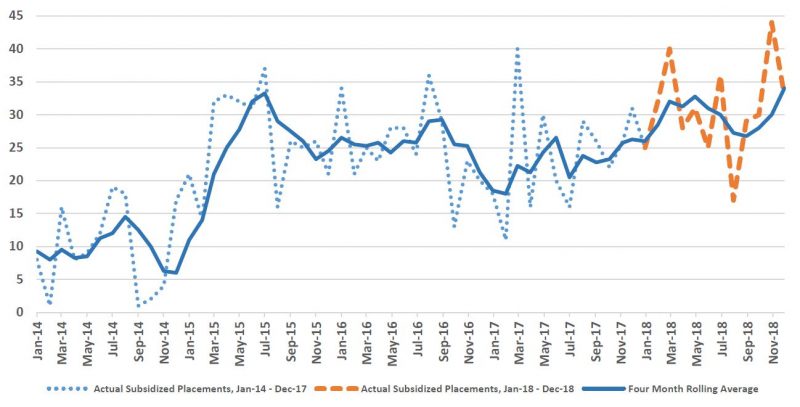
SOURCE: Office of the Comptroller; DHS STAT Reports.
Subsidized Permanent Housing Placements – Single Adults in Shelter
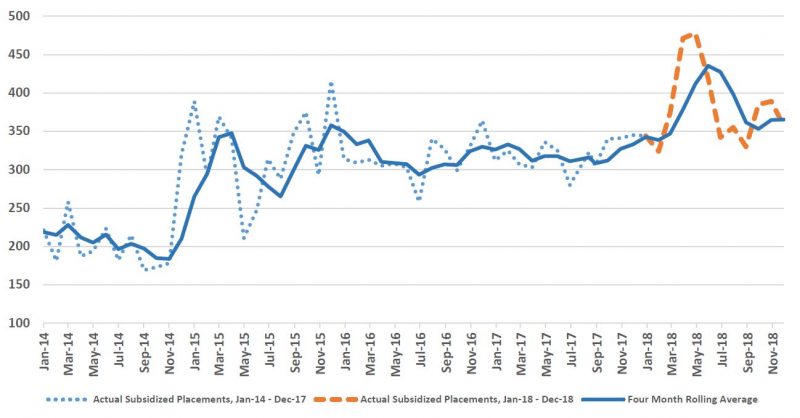
SOURCE: Office of the Comptroller; DHS STAT Reports.
One Year Shelter Return Rates: (Four-month rolling average)
SOURCE: Office of the Comptroller; DHS STAT Reports.
Indicators to Watch
- Subsidized housing placements by type of subsidy; monthly (not publicly reported)
- Number of households currently receiving subsidy, by type of subsidy; quarterly (not publicly reported)
- Unsubsidized shelter exits, by reason; quarterly (not publicly reported)
- Utilization rate of subsidized placements; quarterly (not publicly reported)
- Expiration rate of subsidized placements; annual (not publicly reported)
- Shelter return rates; annual (MMR)
Prevention, Diversion and Outreach
- The number of requests for emergency rent assistance rose 34% between FY 2014 and FY 2018, and remains high. There have been over 1,400 more requests for emergency rent assistance in the first four months of FY 2019 compared to the same period in FY 2018.
- The City has increased its anti-eviction legal services funding to provide representation to every eligible Housing Court eviction case. Cases in the first four months of FY 2019 are outpacing FY 2018 levels.
| FY 2014 | FY 2015 | FY 2016 | FY 2017 | FY 2018 | FY 2019* | |
| Diversions at PATH | N/A | N/A | N/A | N/A | 12.3% | 13.5% |
| Adults receiving preventive services not entering shelter | 96.0 | 93.5% | 90.6% | 92.6% | 93.8% | 91.6% |
| Adult families receiving preventive services not entering shelter | 97.3 | 91.5% | 90.7% | 94.0% | 95.9% | 96.0% |
| Families with children receiving preventive services not entering shelter | 94.0 | 94.5% | 94.1% | 94.2% | 93.7% | 93.6% |
| Request for emergency assistance at Rent Assistance Unit | 57,912 | 65,138 | 82,306 | 79,624 | 77,605 | 26,492 |
| Rent Assistance Unit emergency assistance requests approved | 66.5% | 74.2% | 67.6% | 66.7% | 75.1% | 80.4% |
| Housing Court anti-eviction legal service cases | N/A | 8,900 | 11,837 | 16,702 | 25,156 | 8,899 |
| HOME-STATE clients assisted with housing placements | N/A | N/A | N/A | 2,146 | 2,849 | 906 |
SOURCE: Mayor’s Management Report. NOTE: *As of 10/31/2018.
Indicators to Watch
- Number and rate of PATH diversions; monthly (partially reported in MMR).
- Preventive services provided, by household type and type of assistance; monthly (partially reported in MMR)
- Anti-eviction legal service cases and dispositions; monthly (partially reported in MMR)
- Street outreach assistance provided, by type of assistance, including shelter placements; monthly (partially reported in MMR)