Aging with Dignity: A Blueprint for Serving NYC’s Growing Senior Population
Executive Summary
Just like the nation at large, New York City is getting older as the Baby Boomer generation retires in greater and greater numbers, and medical advances allow more adults to live longer. From 2005 to 2015, the number of New Yorkers over 65 grew by 19.2 percent, which was more than double the rate of the total population (7.47 percent), and more than triple the rate of the population under 65 (5.9 percent). Today more than 1.1 million adults over 65, about 13 percent of the city’s total population, call the five boroughs home, a number which is projected to rise to over 1.4 million by 2040.
While this broad demographic shift is in many ways a testament to New York City’s inherent appeal as a place to grow older—with its robust transportation networks, diverse cultural offerings and world-class medical establishments—it also represents a critical opportunity for the City of New York to deepen its engagement with seniors across the five boroughs. Seniors are anchors of their local communities, and today’s seniors overwhelmingly indicate that they want to stay in their homes and neighborhoods as long as possible, rather than transitioning to more institutional settings that are both less personal and more expensive. Consequently, the City now has a chance to put forward a comprehensive blueprint that invests in seniors as a way of building stronger neighborhoods and a healthier city overall.
This report by New York City Comptroller Scott M. Stringer puts forward a number of policy proposals that, combined with long-range strategic planning from City agencies, could form the backbone of such a blueprint. The report begins by documenting the growth in the senior population across the City, as well as the neighborhoods with the largest number and highest concentration of seniors. Using this data, the report then analyzes the conditions in which New York City’s seniors live and looks at the senior-focused programs and services run by the City of New York, in some cases down to the neighborhood level.
Specifically, the report finds that:
- Between 2005 and 2015, the City’s population of adults over 65 increased by about 182,000 – from approximately 947,000 to 1.13 million – a rise of more than 19 percent.
- In 2015, adults over 65 composed about 13.2 percent of the City’s population, up from about 11.9 percent in 2005. The population of seniors was largest in Brooklyn, followed by Queens, Manhattan, the Bronx, and Staten Island.
- The neighborhoods with the largest numbers of seniors are:
- Queens Community District 7 (Flushing, Murray Hill & Whitestone) with over 46,000;
- Manhattan Community District 8 (Upper East Side) with almost 43,000;
- Manhattan Community District 7 (Upper West Side & West Side) with over 37,000;
- Queens Community District 12 (Jamaica, Hollis & St. Albans) with almost 32,000; and
- Queens Community District 13 (Queens Village, Cambria Heights & Rosedale) with over 30,000.
- Between 2005 and 2015, the number of working seniors in New York City grew by 62 percent, and during that same time, the share of seniors in New York City’s labor force grew from 13 percent to 17 percent.
- Over 40 percent of New York City senior-headed households depend on government programs (including Social Security) for more than half of their income, while more than 30 percent depend on these programs for three-quarters of their income.
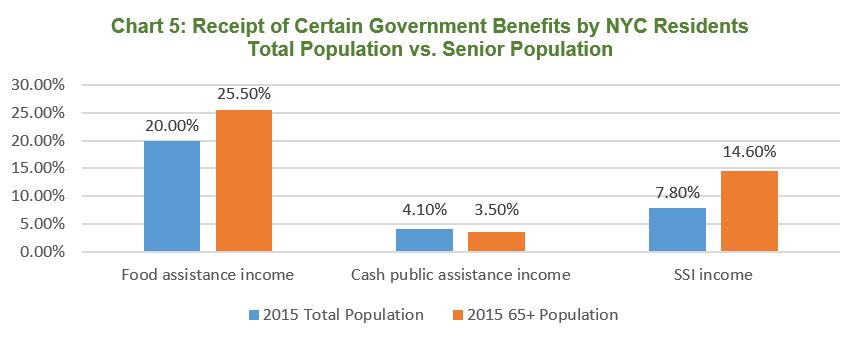
- A higher percentage of seniors benefit from government programs like nutrition assistance (25.5 percent) and Supplemental Security Income (14.6 percent) than the total population (20.0 percent and 7.8 percent, respectively).
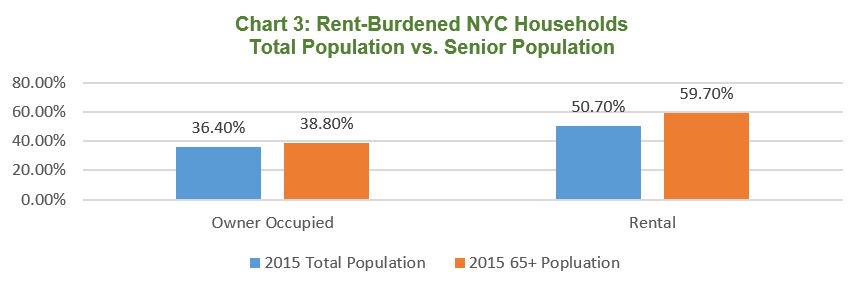
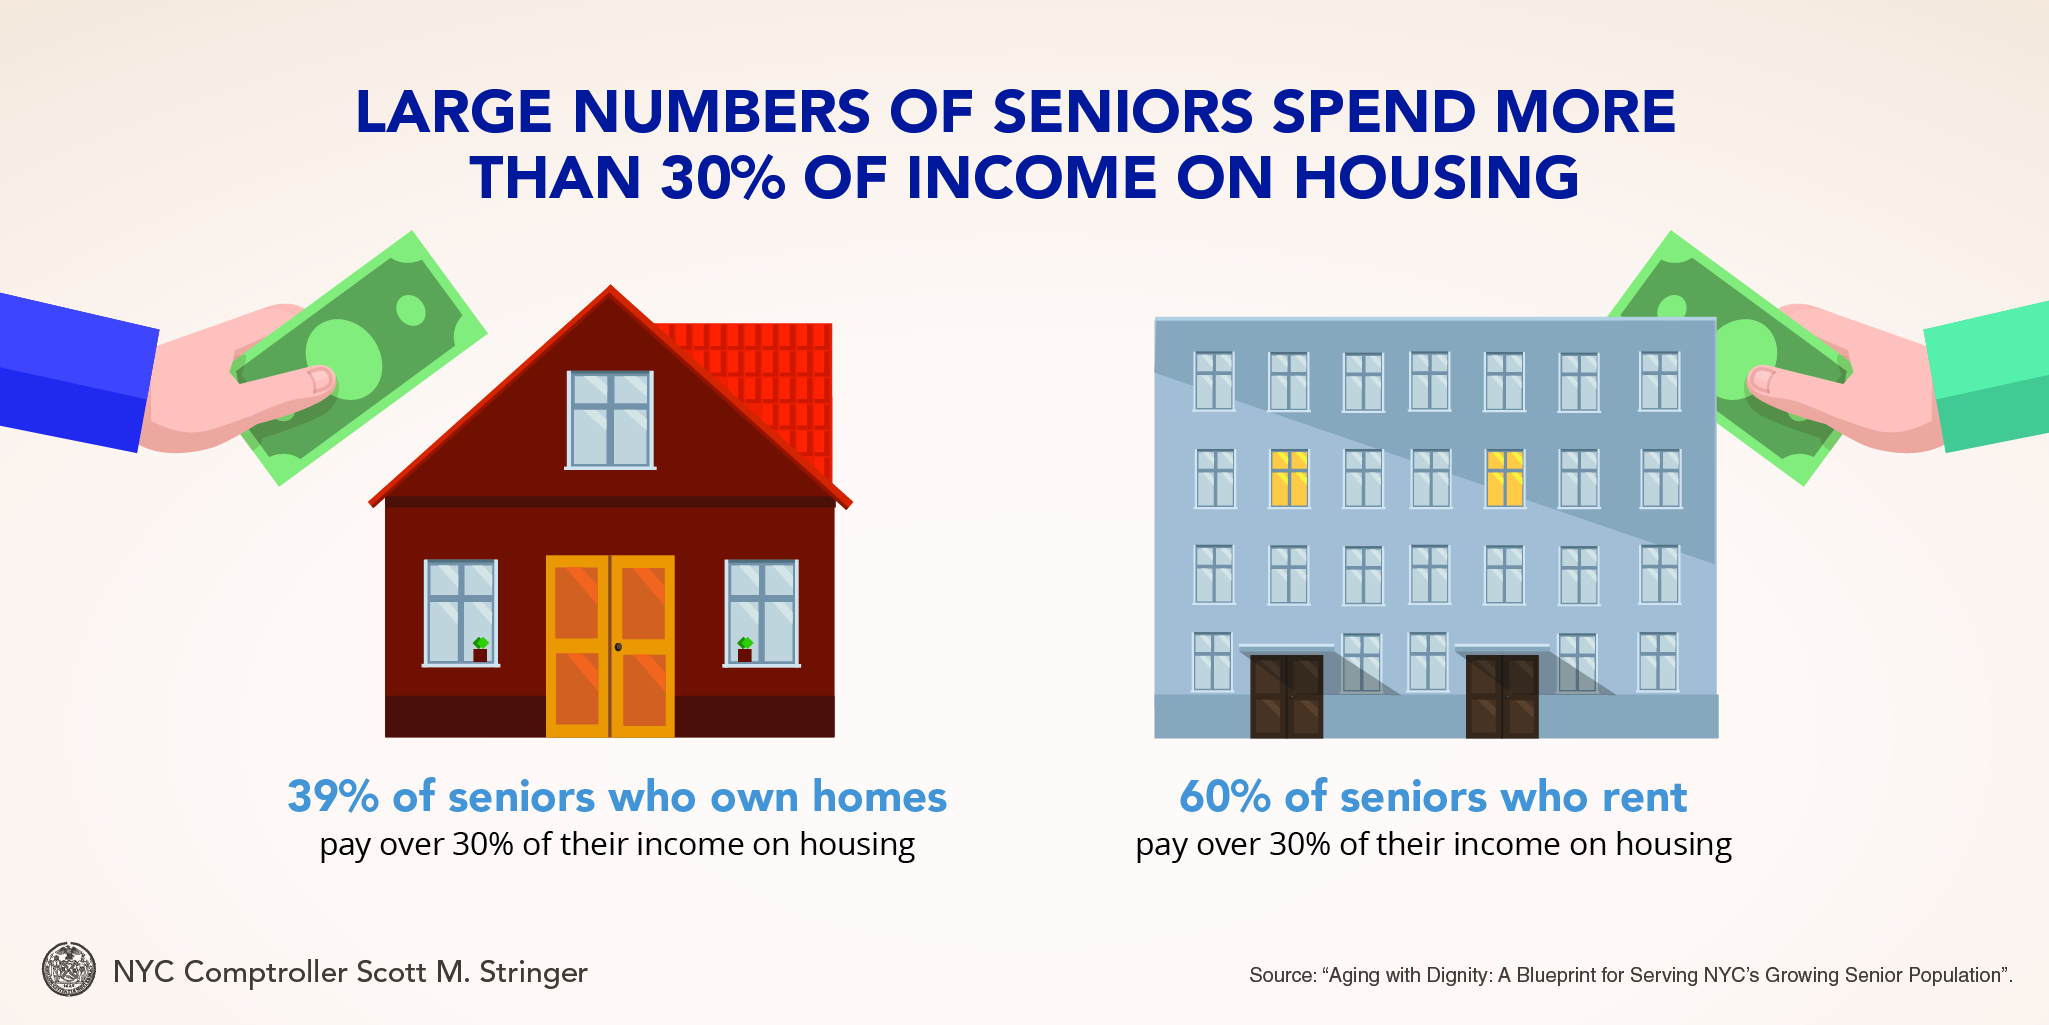
- Additionally, seniors are more likely to pay in excess of 30 percent of their income on housing than the total population, regardless of whether they rent or own their homes. Among tenants for instance, 6 out of 10 seniors spend more than 30 percent of their income on rent, compared to roughly half the general population of renters.
- There are notable gaps in where senior-focused programs are targeted and where seniors live. For example, certain neighborhoods with large numbers of seniors have relatively few senior centers or lack City Benches that are designed to make public transportation and walking easier for older adults.
These statistics demonstrate the scale of the challenges facing New York City seniors. Given these needs, it is critical that government programs provide effective supports to older New Yorkers who want to maintain healthy, independent lives. While there are already a number of effective programs geared toward seniors, there is compelling evidence that a more holistic set of policies that strengthen communities by helping seniors live independently are needed. Additionally, existing programs and services should be adapted to prepare for the inevitable growth in demand that will occur as the population continues to age.
Addressing these challenges starts with effective planning. To date, despite a multitude of plans and initiatives, City agencies have not clearly articulated how they plan to respond to the changing demographics of the City on a neighborhood-by-neighborhood basis or undertaken an analysis of the resources needed to better serve an older population. Each City agency that works with older adults should take this step. In addition, to enhance these efforts, this report makes a number of recommendations that fall into three key areas:
- Creating safe, healthy, and affordable housing options in which seniors can grow old, specifically by:
- Automatically enrolling eligible senior renters in the Senior Citizens Rent Increase Exemption (SCRIE) program, which is currently utilized by only half of eligible seniors. Enacting this policy would help an additional 26,000 seniors better afford rent so they could remain in their homes;
- Expanding eligibility for the Senior Citizens Homeowners’ Exemption (SCHE) to help about 29,000 older homeowners living on limited budgets make ends meet; and
- Developing a program to help seniors modify their homes to make them safer places to age, which could include installing grab bars, no-slip showers, or widening doors, while enhancing requirements on landlords to make reasonable modifications.
- Developing livable communities for seniors through:
- Doubling the number of Age-Friendly Neighborhoods to enable more communities to plan effectively to address the needs of an aging population;
- Strengthening investments in senior centers, particularly in communities with large numbers of seniors and relatively few centers; and
- Improving public transportation systems by building additional bus shelters and benches to better serve seniors, investing in accessible subway stations, piloting free transfers between the Long Island Railroad and MTA buses and subways, and bolstering the Safe Streets for Seniors program.
- Supporting the well-being of older New Yorkers by:
- Increasing the number of Naturally Occurring Retirement Communities (NORCs), with a focus on developing NORCs that serve broader communities instead of isolated buildings;
- Supporting caregivers through additional funding for City programs, federal tax credits, and flexible workplaces;
- Providing additional baseline funding for Department for the Aging (DFTA) programs, including support for caregiver services and funding to eliminate the 750 person homecare and 1,700 person case management waiting lists;
- Encouraging more seniors to take advantage of Medicare’s free annual wellness screening, which can help detect cognitive impairments; and
- Helping current and future seniors by improving Social Security’s annual cost of living adjustment (COLA) and strengthening the Federal Retirement Savings Contributions tax credit, encouraging more city residents to claim the credit, and creating a State and City match for the credit to help boost savings for low-income New Yorkers.
While taking some of these steps necessitates additional spending, the cost of inaction would mean more seniors living in dangerous and unsafe conditions, and greater long-term strains on City programs as a result of higher demands for services. Research has found that by keeping seniors healthy and reducing the need for costly institutional settings, investments in programs that help seniors age in place have the potential to reduce government costs in other areas over the long-term.
Introduction
The growth of New York City’s aging population is a phenomenon that has been well documented by researchers, practitioners, and policymakers alike, but the facts are worth repeating. According to U.S. Census Bureau data, from 2005 to 2015 the population of New York City’s 65+ population grew by 19.5 percent, faster than the growth of the total population (7.47 percent) or the population under 65 (5.9 percent). Consequently, in 2015, adults over 65 composed about 13.2 percent of the City’s population, up from about 11.9 percent in 2005.
One reason New York City is getting older is that the city can be an excellent place to age. Among others, the Milken Institute’s Best Cities for Successful Aging report ranked New York City the 14th best large metro area for seniors overall and the 4th best for seniors over age 80 out of 100 large metro areas in the country.[1]
Another reason is that as many as 96 percent of seniors and near-seniors today are aging in place in New York City.[2] That is, they are choosing to grow old in their local communities in increasing numbers. This is consistent with national trends. A recent study from the Joint Center for Housing Studies of Harvard University found that nationally almost 70 percent of adults between 65 and 79 years of age and almost 80 percent of adults over 80 have lived in their current residence for at least 10 years.[3]
The relative success of New York City in providing a supportive environment for seniors to grow old does not mean there is no room for improvement. The growth in the population over 65 will bring changes to local communities across the five boroughs and will put new, dynamic pressures on City government that can only be managed with long-range strategic planning, commitment, and resources. As the U.S. Department of Housing and Urban Development has explained, without such planning and actions, “the aging population will strain the capacity of government programs that support seniors (and, by extension, federal, state, and local budgets).”[4]
However, despite widespread documentation of these changes, neither the City nor its individual agencies that support and serve seniors have recently embarked on a comprehensive, robust neighborhood-by-neighborhood plan for how to seize this chance to both better serve seniors and help them do more in their communities. Indeed, just as making transportation systems more accessible for seniors can also help a mother or father with a stroller or a person with disability get around more easily, ensuring that seniors have adequate financial resources can also help the local small businesses where seniors shop.
To address these challenges, this report puts forward a number of proposals that Comptroller Stringer believes will help make New York City easier and safer for seniors to age in place. Developing a comprehensive aging in place strategy for New York City offers benefits to both seniors and government alike. Research has shown that creating opportunities for seniors to safely and securely age in place offers the potential to create financial savings for individuals and government programs like Medicare and Medicaid, as home and community-based care programs cost less than institutional programs.[5] In addition to financial savings, research also indicates that keeping seniors in their homes can reduce social isolation, help seniors stay active in their communities, and consequently can result in both physical and mental health benefits, as well as longer lives for seniors.[6]
Given these potential benefits, this report outlines a range of policy ideas that can help older New Yorkers age in place. Not every issue relating to aging, or more specifically aging in place, is discussed in this report. Many additional challenges are beyond the scope of this report but merit additional scrutiny because they impact older New Yorkers and will have ramifications for a wide range of City programs and services. But, by focusing on a few critical areas, this report aims to put forward ideas that can help shape the future direction of policymaking in New York City and beyond.
Aging by the Numbers
Just like the country as a whole, New York City is getting older as a result of the aging of the Baby Boomer generation and more adults living longer.[7] According to the U.S. Census Bureau, between 2005 and 2015 the City’s population of adults over 65 increased by about 182,000—from approximately 947,000 to 1.13 million. In 2015, adults over 65 composed about 13.2 percent of the City’s population, up from about 11.9 percent in 2005. Overall, New York City’s senior population is growing faster than its population of younger individuals. From 2005 to 2015 the population of New York City’s 65+ population grew by 19.2 percent, faster than the growth of the total population (7.47 percent) or the population under 65 (5.9 percent).
In December 2013, the New York City Department of City Planning estimated that the population of New Yorkers over 65 would increase from about 1 million in 2010 to approximately 1.18 million in 2020, for a total growth of 17.5 percent.[8] The actual rate may be higher; as shown in Chart 1, over 70 percent of the projected growth has already occurred in the first six years of the decade.
Chart 1: New York City Senior Population, Current and Projected Numbers
| Number of New Yorkers over 65 years of age: 2010 (Actual) |
Number of New Yorkers over 65 years of age: 2015 (Actual) | Number of New Yorkers over 65 years of age: 2020 (Projected) | City Planning Estimated Change 2010-2020 | Actual Change 2010-2015 | Percent Of Estimated 2010-2020 Change Reached By 2015 | |
| New York City | 1,002,208 | 1,128,653 | 1,177,215 | 175,007 | 126,445 | 72.25% |
| Bronx | 145,882 | 165,921 | 171,856 | 25,974 | 20,039 | 77.15% |
| Brooklyn | 294,610 | 326,955 | 351,609 | 56,999 | 32,345 | 56.75% |
| Manhattan | 214,153 | 240,100 | 250,806 | 36,653 | 25,947 | 70.79% |
| Queens | 288,219 | 322,803 | 325,300 | 37,081 | 34,584 | 93.27% |
| Staten Island | 59,344 | 71,184 | 77,644 | 18,300 | 11,840 | 64.70% |
Census Bureau data provides a closer look at some of the characteristics of New York City seniors and the conditions in which they live.
Race, Ethnicity, and Gender
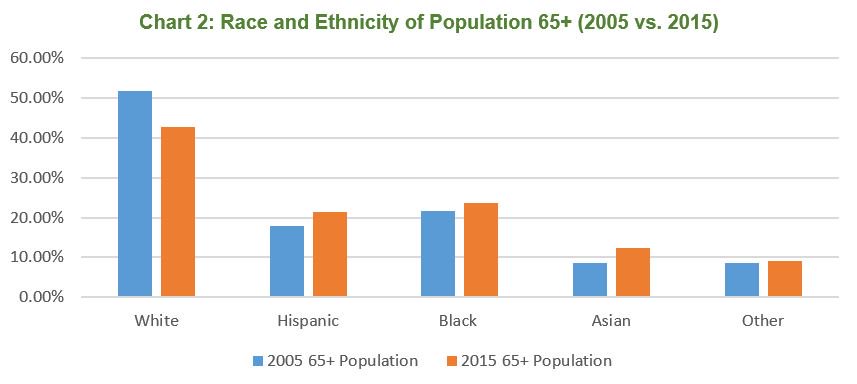
Of the 1.13 million adults over 65 years of age, about 40 percent are men and 60 percent are women. While the population over 65 is generally whiter than the overall population (42.8 percent of the 65+ population is non-Hispanic white, compared to 32.1 percent of the total population), as shown in Chart 2 below, the senior population living in New York City today is more racially diverse than a decade
ago.
 Source: American Community Survey
A potential explanation for this change is that the foreign-born senior population has increased by over 170,000 people in the last decade, from 40.5 percent of the over-65 population in 2005 to 49 percent of the same population in 2015. As documented in a 2013 report from the Center for an Urban Future, the fastest growing groups of immigrants are those from the Caribbean, China, India, the former USSR, and Korea, many of whom live in poverty and have limited English proficiency.[9] More recent data from the Census Bureau confirm that the percentage of seniors who spoke English “very well” declined in recent years, from about 69 percent in 2005 to 66 percent in 2015.
Housing
One of the largest expenses most New Yorkers face is housing, and finding affordable housing can be particularly difficult for seniors. In fact, as shown in Chart 3, in 2015 more seniors were rent- burdened (defined as paying more than 30 percent of their income on housing) than the total population, including both home-owning seniors and those who rent.
 Source: American Community Survey
While numerous city, state, and federal programs help seniors find and maintain affordable housing, and local investments have been made recently in new senior-focused affordable housing, the long waiting lists for these programs indicate that the demand for affordable, senior-accessible units far exceeds their supply. For instance, LiveOn NY has analyzed waiting lists in each City Council District and found that over 200,000 seniors wait an average of seven years for an apartment in the Department of Housing and Urban Development’s (HUD) Section 202 Supportive Housing for the Elderly program.[10] Similarly, according to the New York City Housing Authority (NYCHA), the backlog for HUD’s Section 8 Housing Choice Voucher program is so long that new applications have not been accepted since December 2009.[11] In addition, the waiting list for NYCHA apartments is approximately 270,000, meaning that it is very unlikely that a senior in need of affordable housing will get a NYCHA unit, let alone one of the NYCHA units that is specifically for seniors.[12]
Income and Employment
While seniors are much less likely to be employed or participate in the labor force than their younger peers, the number of working seniors in the City has grown dramatically. Between 2005 and 2015, the number of working seniors grew by 62 percent, and during that same time the share of seniors in the labor force grew from 13 percent to 17 percent. In 2015, about 38.3 percent of households with adults over 65 earned income from work.[13]
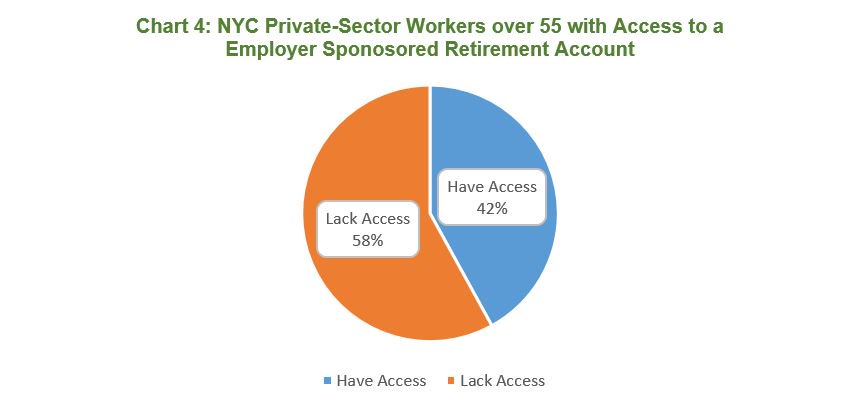
Meanwhile, fewer seniors reported receiving income from retirement savings accounts in 2015 than 2005: 37.5 percent received retirement savings income in 2015, compared to 38.6 percent in 2005. This phenomenon could be caused by multiple factors, including the possibility that many seniors lost or depleted their retirement savings in the wake of the Great Recession and can no longer rely on those savings for retirement income. What’s known for certain is that a shrinking percentage of New Yorkers have access to retirement savings plans through their employer, as Comptroller Stringer highlighted as part of his 2016 “New York Nest Egg” report, which outlined a broad agenda to increase the retirement security of all New Yorkers.[14] As shown in Chart 4, in 2015, 58 percent of New York City private sector workers over 55 lacked access to a workplace savings plan, which is a key factor in a worker’s ability to build a cushion for their retirement.[15]
Source: The New School’s Schwartz Center for Economic Policy Analysis
Social Security Benefits
With reduced earnings from work and limited retirement savings, a relatively high number of seniors rely on government assistance programs for help making ends meet. The most significant of these programs is Social Security. According to the Census Bureau, Social Security is the largest source of income for New York City’s seniors, with almost 83 percent of New Yorkers over 65 receiving income from Social Security in 2015. Seniors in New York City who receive Social Security benefits have an average annual benefit of $17,800, or slightly less than $1,500 per month.
These modest benefits are a significant source of retirement income for many. According to an analysis of Census Bureau data, of the New York City senior-headed households with income in 2015, Social Security benefits (including old-age, disability, and Supplemental Security Income benefits) made up more than half of income for 40 percent of households (about 397,000 households). Further, 30 percent of senior-headed households (about 293,000 households) rely on Social Security for more than 75 percent of their income, and 26 percent (about 253,000 households) rely on Social Security for more than 90 percent of their income.[16]

Other Government Benefit Programs
In addition to Social Security, many New York City seniors also receive assistance from programs that provide food and cash assistance, as shown in Chart 5. While a quarter of all seniors receive food assistance from programs like the Supplemental Nutrition Assistance Program (SNAP), the program is underutilized, which helps explain why one in eight seniors (about 171,000 persons) in New York City was food insecure between 2013 and 2015, according to Hunger Free America.[17]
Source: American Community Survey
Overall, 41 percent of New York City senior-headed households depend on government transfer programs, including Social Security and others for more than half of their income. Indeed, 31 percent depend on these programs for 75 percent of their income, and 27 percent depend on transfers for more than 90 percent of their income.[18]
Poverty
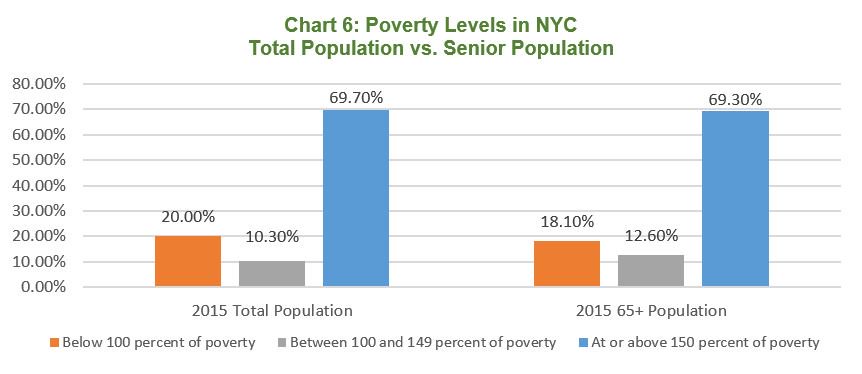
While these government benefit programs help keep many of the City’s seniors out of poverty, seniors as a group in New York City experience poverty at similar rates to the total population. However, while a slightly lower percentage of seniors lived under the poverty line in 2015, more live under 150 percent of poverty than the total population as shown in Chart 6.
Source: American Community Survey
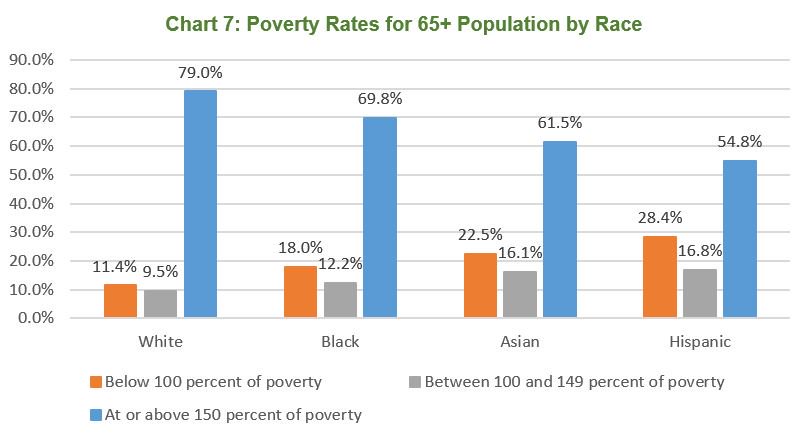
There are stark differences in the poverty rates of seniors based on race and ethnicity. Among older New Yorkers, about 11 percent of White seniors live below the poverty line compared to 18 percent of Black seniors, 23 percent of Asian seniors and 28 percent of Hispanic seniors. Almost half of Hispanic seniors live at or below 150 percent of poverty, as shown in Chart 7.
Source: American Community Survey
Disability
Additionally, seniors confront higher rates of disability than the general population. In fact, according to the Census Bureau, 35.5 percent of seniors in New York City are living with a disability, about three times higher than the percentage of the total population. Consequently, there is a need to focus on issues of inclusion and accessibility in housing, transportation, healthcare, and other policy areas when developing programs and services for seniors.
Geography of Aging
New York City’s seniors live in all corners of the five boroughs. As shown in Chart 8 below, in 2015 the largest number of the city’s adults over 65 resided in Brooklyn, followed by Queens, Manhattan, the Bronx, and Staten Island.
Chart 8: Population of Seniors by Borough, 2015
| Borough | Total 65+ | Total Population (2015) | Percent 65+ |
| Brooklyn | 326,955 | 2,636,735 | 12.40% |
| Queens | 322,803 | 2,339,150 | 13.80% |
| Manhattan | 240,100 | 1,644,518 | 14.60% |
| Bronx | 165,921 | 1,455,444 | 11.40% |
| Staten Island | 71,184 | 474,558 | 15.00% |
Source: American Community Survey
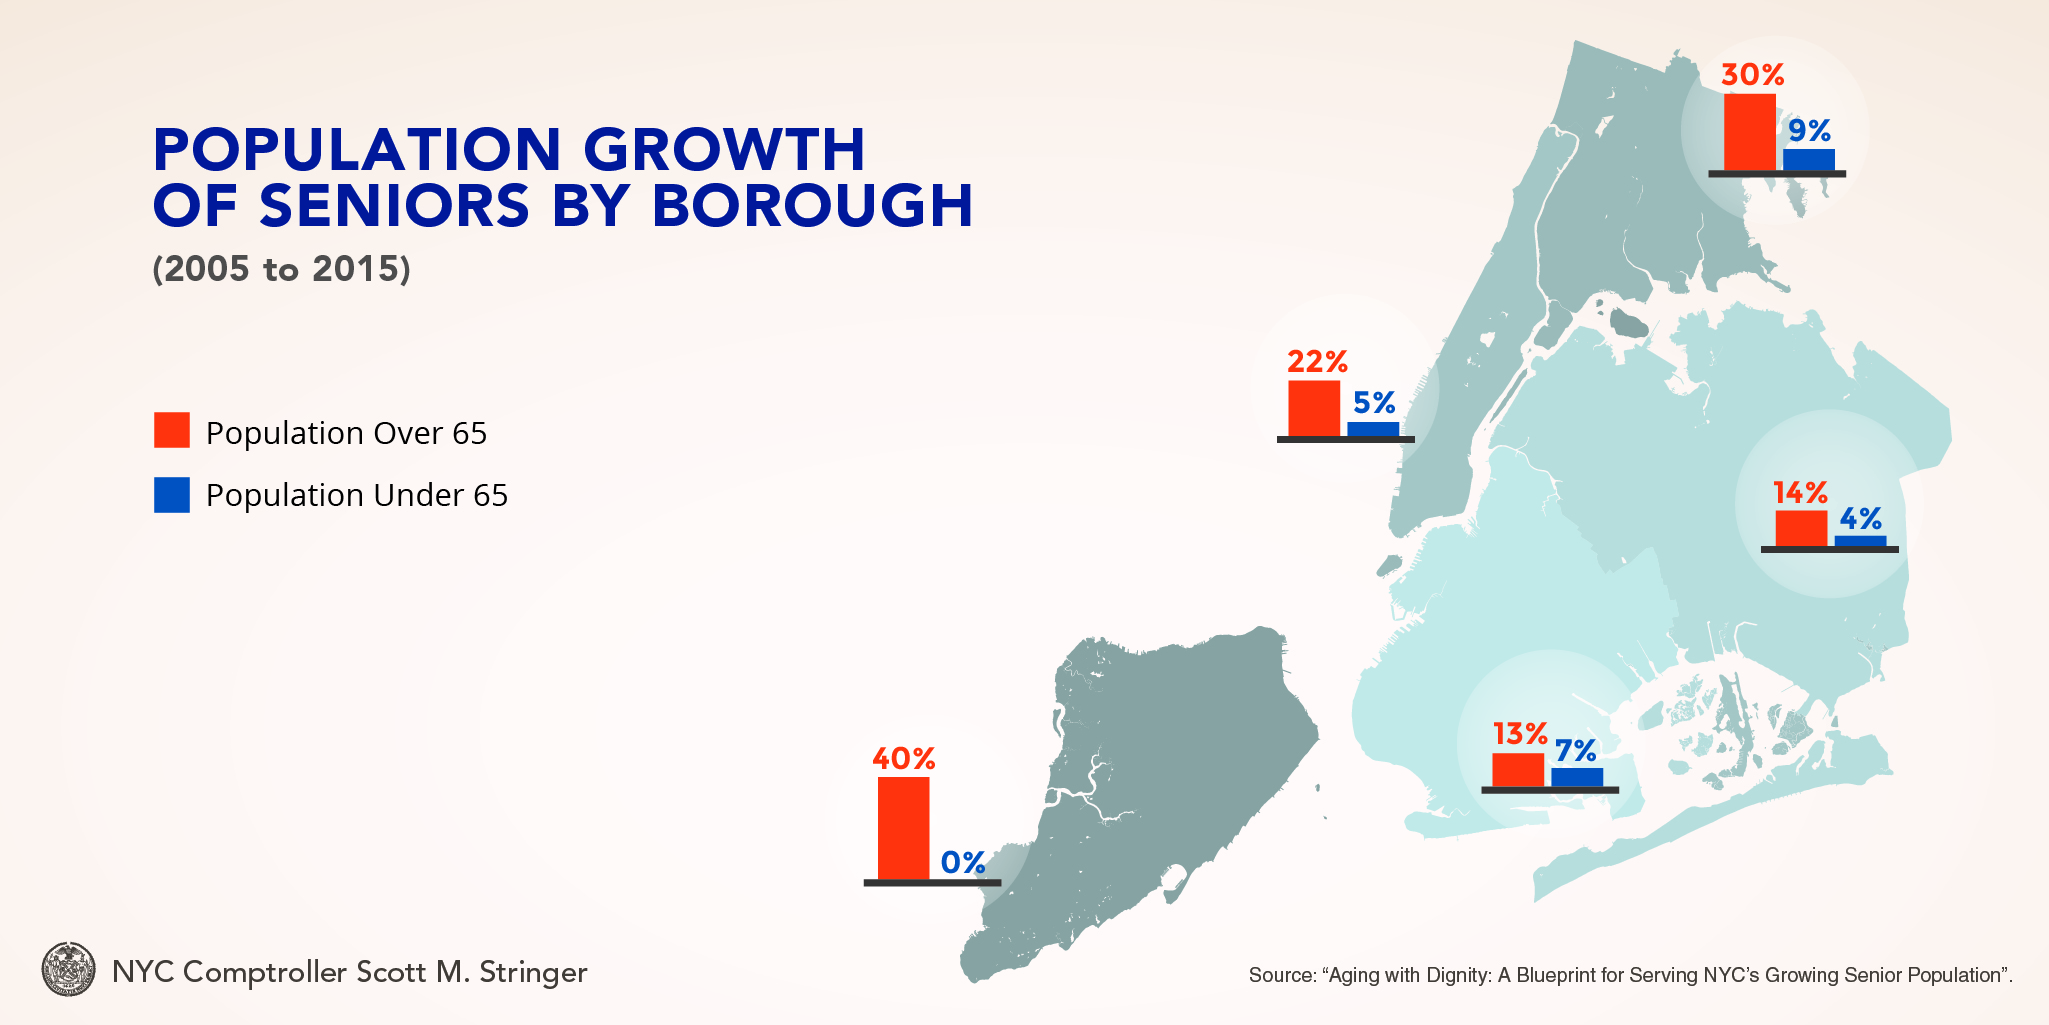
The number of New Yorkers over 65 years of age has grown in each borough over the last 10 years, with the largest numerical growth in the last ten years in Manhattan (44,289), followed by Queens (41,455), the Bronx (38,886), Brooklyn (38,325), and Staten Island (20,641). The graphic below shows the pace of the growth of the 65+ population by borough compared to the population under 65.
Source: American Community Survey
Despite having the lowest number of individuals over 65, the population of adults over 65 has grown the fastest in Staten Island and the Bronx. In Staten Island, the borough with the highest concentration of individuals over 65, the population under 65 has actually declined since 2005.
A deeper look into the boroughs reveals the neighborhoods with the highest concentration of New Yorkers over 65 and the fastest growth rates among that population. Map 1, below, shows the number of New Yorkers over 65 residing in each of New York City’s community districts. Overall, the median community district in the City has about 19,000 individuals over 65 and comprises about 1.7 percent of the total New York City population over 65.
Map 1: Number of Residents 65 + by Community District, 2015

As shown in Map 1, the neighborhoods with the largest number of seniors in the five boroughs are:
- Queens Community District 7 (Flushing, Murray Hill & Whitestone) with over 46,000 seniors;
- Manhattan Community District 8 (Upper East Side) with almost 43,000 seniors;
- Manhattan Community District 7 (Upper West Side & West Side) with over 37,000 seniors;
- Queens Community District 12 (Jamaica, Hollis & St. Albans) with almost 32,000 seniors;
- Queens Community District 13 (Queens Village, Cambria Heights & Rosedale) with over 30,000 seniors.
Map 2, below, shows the concentration of New Yorkers over 65 residing in each of New York City’s community districts. Among the many neighborhoods with a high concentration of seniors, the highest percentages are found in:
- Bronx Community District 10 (Co-op City, Pelham Bay & Schuylerville) where 20.5 percent of residents are 65 years of age or older;
- Manhattan Community District 8 (Upper East Side) and Brooklyn Community District 13 (Brighton Beach & Coney Island) where 20 percent of residents are seniors.
Map 2: Percent of Residents 65+ by Community District, 2015
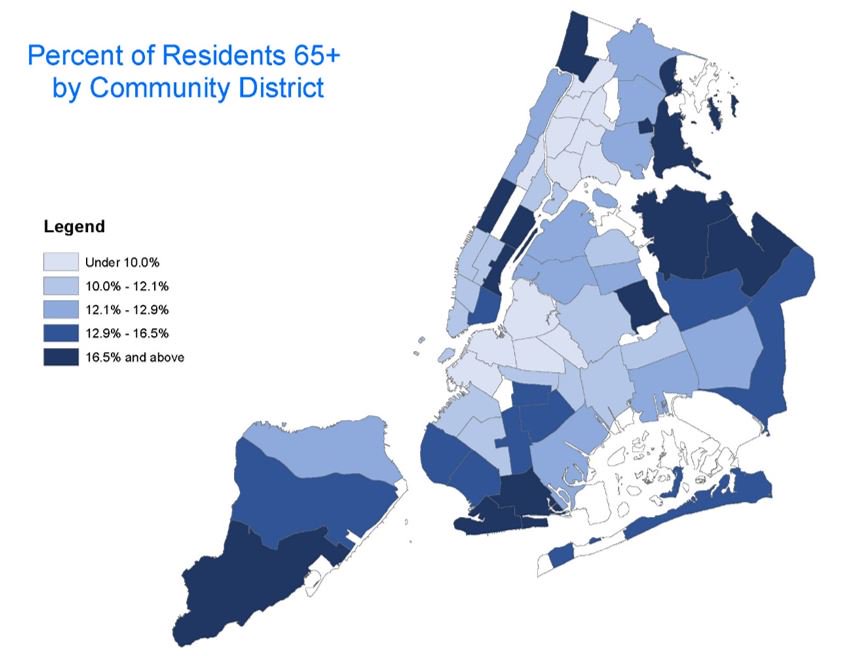
Maps 1 and 2 demonstrate that a number of the City’s neighborhoods stand out as having a potentially high need for senior services.
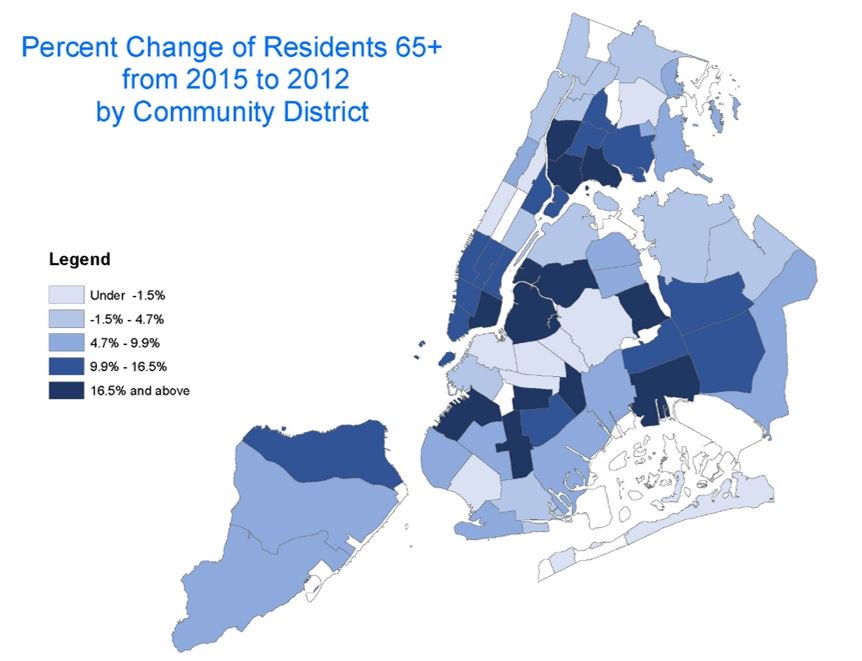
While the Census Bureau only makes neighborhood level data available beginning in 2012, Map 3 shows the percent change in the number of 65+ New Yorkers between 2012 and 2015 for each community district.
Map 3: Percent Change of Residents 65+ from 2012 to 2015 by Community District
Additionally, several neighborhoods have a large population of New Yorkers that are traditionally considered to be on the cusp of retirement: those between 60 and 64 years of age. Specifically, as shown in Map 4 the following neighborhoods stand out as having a relatively large number of residents just shy of 65 years of age.
Map 4: Number of Residents 60-64 by Community District, 2015
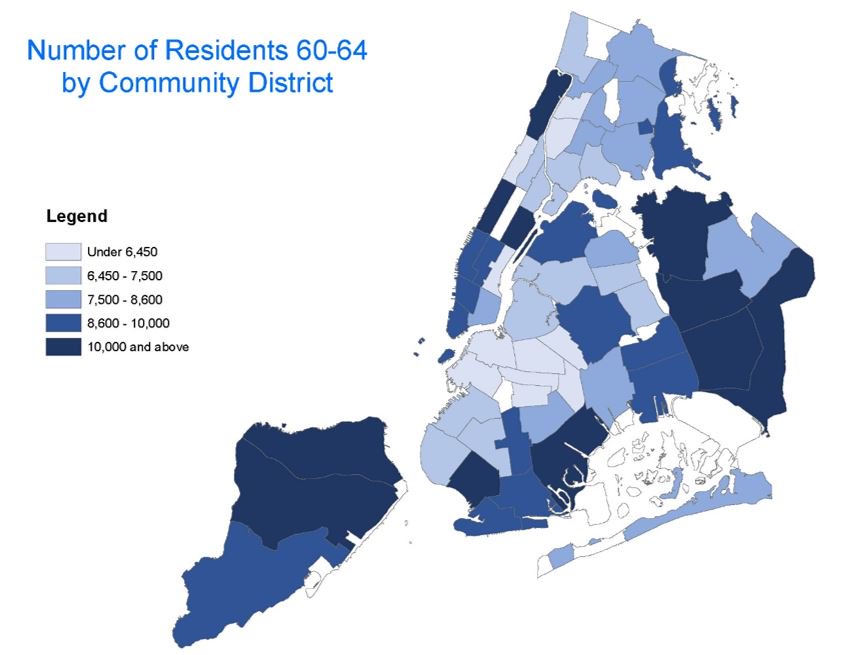
In general, neighborhoods with a large number and/or concentration of New Yorkers between 60 and 64 years of age also have a relatively large number and/or concentration of those over 65. However, Queens Community District 11 (Bayside, Douglaston & Little Neck) and Staten Island Community District 2 (New Springville and South Beach) stand out for having a large number and/or concentration of 60 to 64 year olds without having a relatively high number or concentration of those over 65.
Understanding how these changes are playing out at the local level is particularly critical so that the City can best target services to seniors now and in the future. Neighborhoods with a high concentration of individuals over 65 today may need immediate improvements to certain City services while those that have a coming wave of seniors will need resources today to plan accordingly for the future.
The appendix to this report contains information about the population between 60 and 64 and the population over 65 in each of the City’s community districts.
Policy Proposals
Creating a vibrant city in which all older New Yorkers can age with dignity will require a multi-faceted approach that develops safe, affordable housing, livable communities, and robust services to support the wellbeing of seniors of all ages.
In some respects the City is well-prepared to confront this challenge. Despite the high cost of living, many have noted that New York City has much to offer seniors, including an extensive public transportation network, a world-class array of cultural offerings, and a number of publicly-funded programs that support aging adults. For example, the Milken Institute’s Best Cities for Successful Aging report ranked New York City the 14th best large metro area for seniors overall, and the 4th best for seniors over 80 years old.[19] In conducting this analysis, the Milken Institute graded New York City positively for its extensive transportation networks, access to high quality arts and culture, employment opportunities for seniors, high quality hospitals, and low levels of obesity. Detracting from these positive features, the Milken Institute found that the high cost of living, long emergency room wait times, lengthy commutes, and relatively high taxes pose continuing challenges for the metro area.
However, even with notable accomplishments, the rapid aging of the City means that complacency is not an option. Successful programs need to be ramped up while new programs, based on thoughtful community-based planning, need to be created so that the City can adapt to this powerful demographic change, meet the needs of an aging population, and strengthen the communities in which older New Yorkers live.
In addition, specific policy proposals that would help New York City become a better place for seniors and their families are discussed below based on the following themes:
1. Creating safe, healthy, and affordable housing in which seniors can grow old.
2. Developing livable communities for seniors.
3. Supporting the wellbeing of older New Yorkers.
As discussed in the following pages, doing so will require changes across a wide range of City policies and programs that can only be done effectively with planning. Specifically, each relevant City agency should develop a strategic plan that analyzes how their work currently impacts seniors and how it can be improved to better serve seniors who want to age in place.
Creating Safe, Healthy, and Affordable Housing in Which Seniors Can Grow Old
AARP New York reports that 90 percent of those 50 years of age and older in New York City say it is very-to-extremely important that they be able to remain in their homes as they age.[20] Studies have found that seniors who age in place are more socially engaged than seniors who live in institutional settings like nursing homes, which results in better health outcomes in areas including depression, physical function, and muscular strength.[21] To realize these benefits, aging New Yorkers need safe, affordable, and accessible homes to live in, which as detailed below, can be very difficult to obtain in a city as expensive as New York.
Mayor de Blasio’s Zoning for Quality and Affordability plan includes a number of changes designed to spur development of 5,000 units of senior housing, including allowing the development of smaller “micro-units” and allowing for additional development in lieu of parking.[22] In addition to this effort, the Mayor also recently announced the setting aside of 5,000 more units of affordable housing for seniors and proposed a new rental assistance program for 25,000 seniors to be funded through a “mansion tax.”[23]
While these efforts will increase the number of senior-friendly housing units, alone they are not enough to produce a sufficient supply of housing that will accommodate the needs of a growing senior population seeking to age in place. Consequently, New York City could do more to help its older residents live safely and securely in their homes by taking the steps outlined below.
Automatic Enrollment for the Senior Citizens Rent Increase Exemption (SCRIE) Program
To help some of the many seniors living on limited incomes and facing high rents, the City’s existing Senior Citizens Rent Increase Exemption (SCRIE) program freezes rent levels for eligible seniors. In order to qualify for the program, individuals must be over 62 years old, earn less than $50,000 per year, pay more than a third of their income in rent, and rent an apartment that is rent-controlled, rent-stabilized, or hotel-stabilized.[24] Under the program, which is administered by the Department of Finance, an eligible individual’s rent is frozen at one-third of monthly income, or the prior month’s rent (whichever is greater).[25] Individuals younger than 62 may be eligible for the Disabled Rent Increase Exemption (DRIE) program, which provides a similar benefit to certain individuals with a disability.[26]
As a result of enhanced outreach efforts and an increase in the SCRIE income threshold from $29,000 to $50,000, the City has enrolled additional seniors in the program.[27] According to the Mayor’s Management Report, there were 15,713 initial SCRIE applications received in FY15 and another 8,951 received in FY16. Renewal applications increased from 23,321 in FY15 to 27,760 in FY16.[28]
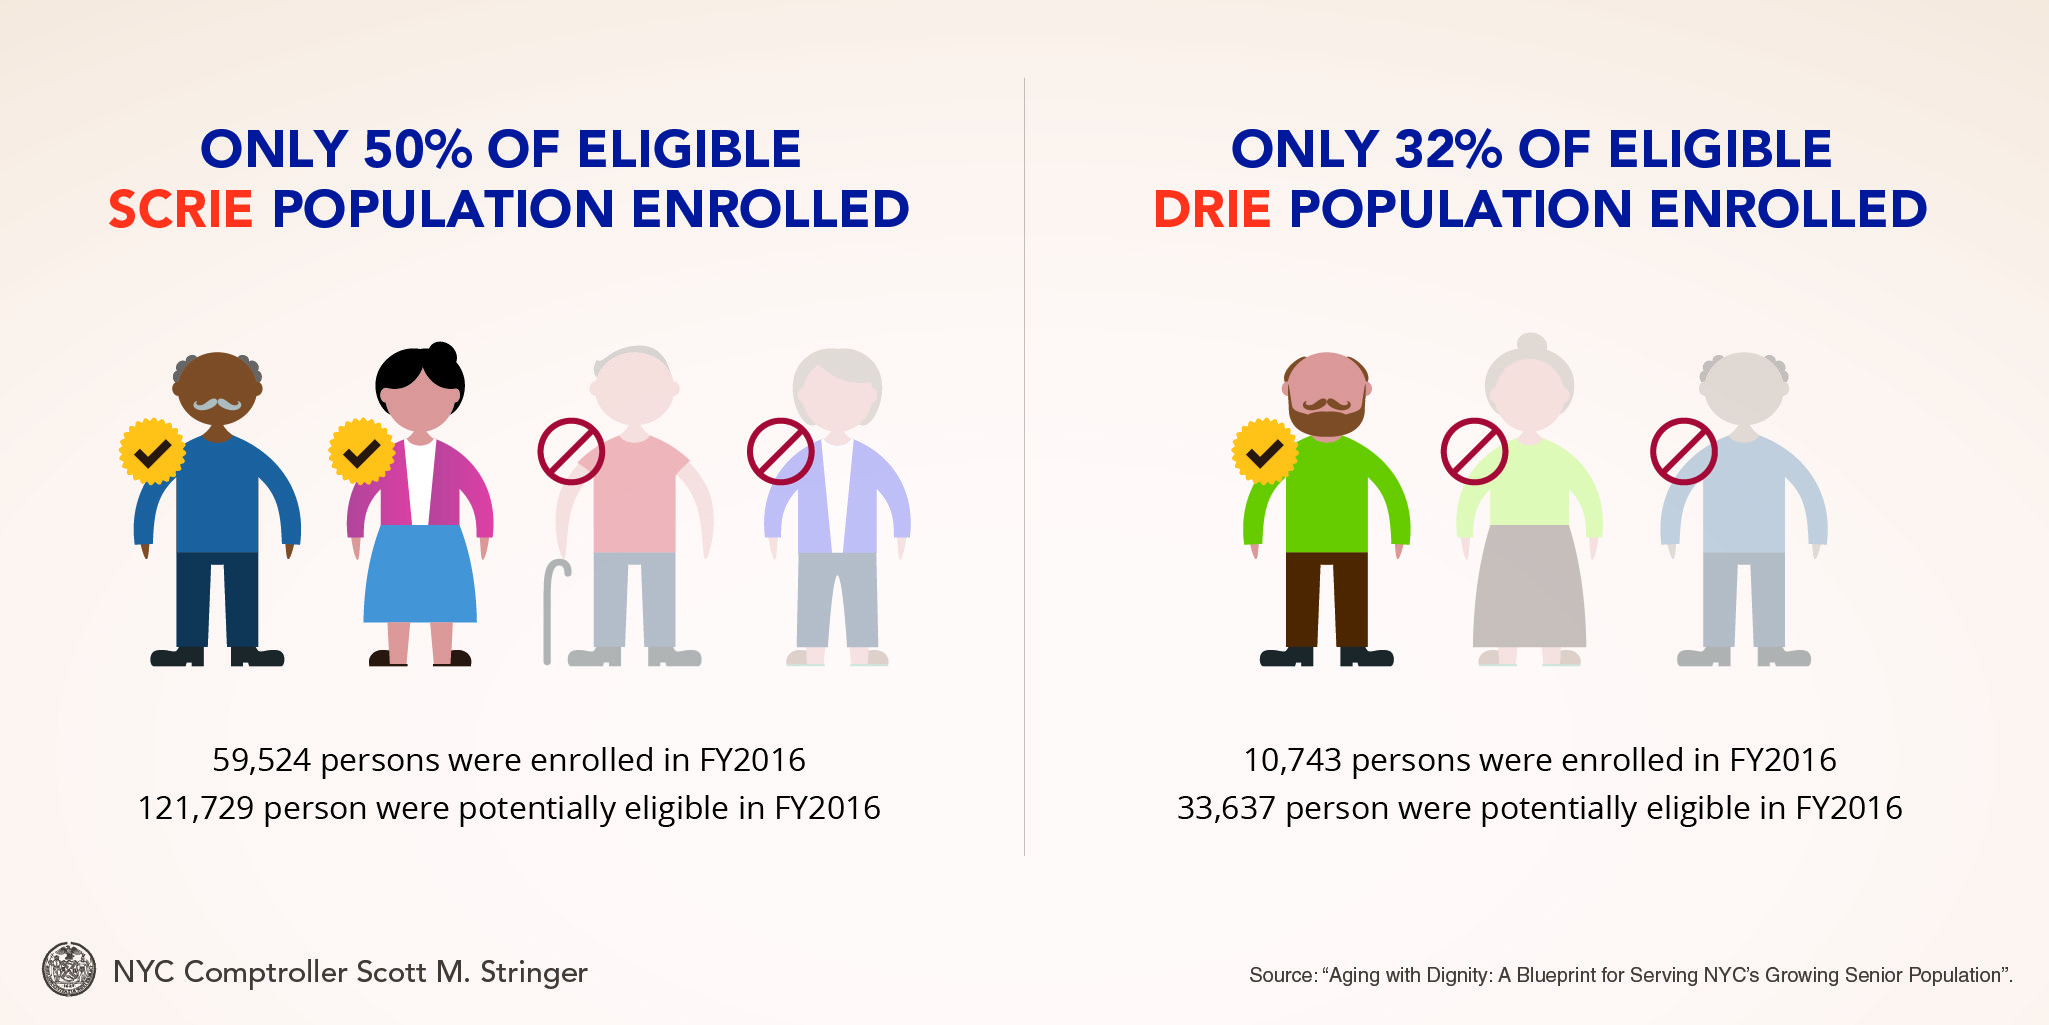
However, the SCRIE program remains underutilized across the City, with less than half of all potential beneficiaries enrolled in the program. According to the NYC Department of Finance, in FY16, 59,524 persons were enrolled in SCRIE and 10,743 in DRIE compared to the estimated potentially eligible population of 121,729 SCRIE recipients and 33,637 DRIE recipients.[29] In addition, as highlighted in a report by LiveOn NY and Enterprise Community Partners, Inc., many of those who do benefit from SCRIE nevertheless struggle to pay rent.[30]
One way the City could strengthen the SCRIE programs is to partner with the State to explore opportunities to automatically enroll eligible seniors in the program. Eligibility for SCRIE depends on age, income, whether the apartment is rent-regulated, and if the senior is paying at least a third of his or her income in rent. In general, the age, income, and residence of an individual can be determined from an income tax filing. While not all seniors file income tax returns, individuals must file a State income tax return if their modified adjusted gross income exceeds $4,000.[31] The Comptroller’s Office estimates that about 70 percent of senior-headed households with incomes below the SCRIE eligibility threshold of $50,000 file taxes.[32]
The State also maintains the list of rent-regulated apartments in New York City and the rents associated with those apartments at New York State Homes and Community Renewal (HCR). Therefore, by matching income tax data with HCR’s data it should be possible to automatically identify, notify, and enroll additional eligible seniors in the SCRIE program.
To do so, the NYC Department of Finance, which administers the SCRIE program in New York City, should partner with HCR to share data that would enable eligible seniors to be automatically enrolled in SCRIE. This can be done without running afoul of privacy laws, as HCR is allowed to disclose data for the purposes of carrying out programs and statistical analysis.[33] In addition, doing so would be consistent with the spirit of recent changes made to New York State real property tax law, which now require both administering entities and landlords to conduct outreach about SCRIE to expand utilization of the program.[34]
By adopting this approach, the Comptroller’s Office estimates that the SCRIE enrollment rate could be increased from today’s level of 49 percent to approximately 70 percent, which would benefit about 26,000 seniors. Enrolling more seniors in the program would increase the cost of SCRIE by about $34.5 million.
Expand the Senior Citizen Homeowners’ Exemption (SCHE)
Certain seniors who own their homes may be eligible for a property tax exemption through the Senior Citizen Homeowners’ Exemption (SCHE) to help them continue to live in their homes as they age. To be eligible for the program, the homeowner must be over 65, live in the home, and the combined income of the homeowner and his/her spouse cannot exceed $37,399. The size of the exemption varies depending on the amount of income, phasing down from a 50 percent exemption for homeowners with income under $29,000, to a 5 percent exemption for homeowners with income between $36,500 and $37,399.[35] Seniors eligible for the SCHE are also automatically eligible for the Enhanced STAR tax program, which provides an additional property tax exemption for senior homeowners.[36]
To support more seniors, the SCHE income restrictions could be expanded. Currently, while localities have discretion about implementing the program, State law limits SCHE eligibility to those with incomes less than $38,000.[37] In the 2015-2016 legislative session in Albany, legislation that would have authorized localities to increase this threshold passed the State Senate and was introduced in the State Assembly.[38] This specific proposal, S1074/A5416, granted local jurisdictions like New York City the ability to expand eligibility for the program to those making as much as $45,800 in 2021, but was not enacted into law.
Another option would be to equalize the SCRIE and SCHE income limitations by increasing the SCHE income restriction to $50,000. The Comptroller’s Office estimates that doing so would make approximately 29,000 homeowners newly eligible for the program and cost about $2 million.[39]
Create Tax Credits to Encourage Age-Friendly Renovations to Apartments and Homes
According to the 2014 U.S. Census, two-thirds of seniors report that one of the most significant challenges they face is getting around, particularly walking and climbing up stairs.[40] Consequently, creating an accessible home in which seniors can age may require modifications like redesigning kitchens to lower cabinets and counters, widening doors and hallways to accommodate wheelchairs, or installing grab bars for showers, toilets, and stairs. As previously discussed, these types of improvements are often necessary to keep people in their homes, given that adults over 65 are more likely to have a disability than those under 65 years of age. For instance, according to a study from the Joint Center for Housing Studies of Harvard University, nationally more than 20 percent of seniors over 70 and over 40 percent of seniors over 80 experience mobility impairments that make it difficult to walk up and down stairs.[41] Further, according to the Census Bureau, nationally about 56 percent of wheelchair users are over 65 (2 million of 3.6 million total wheelchair users in 2010).[42]
In general, New York City’s existing housing stock, both owner-occupied and renter-occupied, is not suited to accommodate the needs of an aging population. As shown in Chart 9, according to the 2014 New York City Housing and Vacancy Survey, of the 3,124,138 occupied residential units in New York City for which the following factors were observed, about 51 percent do not have a wheelchair accessible unit entrance, about 61 percent do not have a wheelchair accessible building entrance, and about 68 percent of housing units are not accessible from the sidewalk without the
use of stairs.[43]
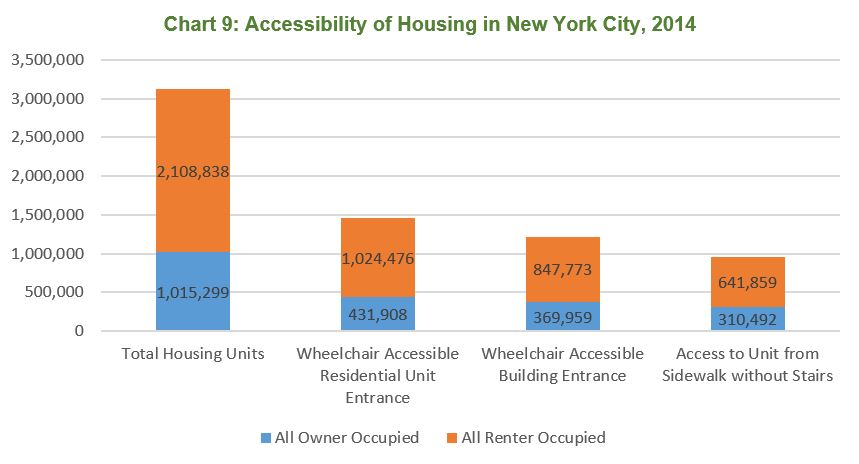
Source: 2014 New York City Housing and Vacancy Survey
The percentages are only slightly better for housing units headed by a person 65 years of age or older. For these households, 54 percent are living in homes with a wheelchair accessible unit entrance and 47 percent live in a building with a wheelchair accessible entrance.[44]
Seniors who live in unsuitable housing may be at particular risk of fall-related injuries, the leading cause of injury-related hospitalizations among seniors and the cause of death for as many as two seniors each day in New York.[45] Falls have a significant cost beyond the physical pain and suffering of the individual. Overall, total hospitalizations as a result of falls cost $722 million per year according to the New York City Department of Health, and the State estimates that 95 percent of those costs are borne by taxpayer funded programs like Medicare and Medicaid.[46] According to the Department of Housing and Urban Development, approximately 80 percent of all accessibility modifications are paid for out of pocket.[47]
Given the size of the senior population that is already rent-burdened and/or living on a fixed income, it is unreasonable to expect New York City seniors to self-fund accessibility modifications to the extent that will be needed to create homes in which that person can safely age in place. Consequently, those who cannot afford such modifications are faced with the reality of living trapped in an inappropriate home or moving to more costly institutional settings that are often paid for with taxpayer dollars.
This reality can be addressed with effective public policy. Faced with a similar challenge, a number of states and localities have developed tax credits to encourage people to modify their homes in accordance with universal design features to make them more accessible as they age.[48] In addition, a number of large cities across the country have developed programs to modify existing housing. For instance, a $3.6 million program in Washington D.C. called “Safe at Home” provides adults over 60 and people with disabilities with incomes at or below 80 percent of Area Median Income (AMI) with up to $10,000 in grants to make home modifications following an in-home visit from an occupational therapist.[49] In Chicago, a similar program called Small Accessible Repairs for Seniors (SARFS) with an approximately $2 million budget allocation supports seniors with incomes at or below 80 percent of AMI making home modifications.[50] Alternatively, the states of Minnesota and Pennsylvania and the city of Atlanta, GA, have developed Deferred Payment Loan programs that allow people to make home modifications and pay back a loan in one lump sum at the end of the life of the loan.[51]
Relatively small versions of these programs are underway in New York but are insufficient to meet the significant need. For instance, Project Open House, which is run by the Mayor’s Office of People with Disabilities and the Department of Housing Preservation and Development, helps remove architectural barriers from the homes of people with disabilities. The program received about $175,000 in FY17.[52] At the state level, New York’s Access to Home program, funded at $1 million in 2016, provides assistance to homeowners and/or landlords to make modifications that cost less than $25,000 that make homes more accessible to low and moderate income people with disabilities or who have substantial difficulty with daily living activity due to aging.[53] Versions of this program exist specifically for people receiving Medicaid benefits and veterans. Another State program called the Residential Emergency Services to Offer (Home) Repairs to the Elderly (RESTORE), funded at $3.9 million in 2016, provides up to $10,000 per building to make emergency repairs in homes owned by low-income seniors.[54]
In addition to being cheaper than a nursing home, which according to the life insurance company Genworth can cost between $120,000 and $164,000 annually across the five boroughs, modifications to existing homes are permanent.[55] Consequently, future residents of those homes may also be able to benefit from the modifications.
To build on these programs, New York City and/or New York State should develop a more comprehensive program to help senior homeowners and renters make improvements to their homes so that they can safely age in place. Currently, New York City Human Rights Law requires landlords to make reasonable accommodations requested by tenants with disabilities, which can include installing a ramp at a building entrance or grab bars in a bathroom.[56] While this law provides important protections for seniors with disabilities, because it only applies to requests made by people with disabilities that are financially feasible for the landlord, it alone does not ensure that all older New Yorkers live in appropriate, safe housing.
Consequently, a more robust program that that helps New Yorkers finance and make modifications to their homes is still needed. Recognizing the large number of senior renters and homeowners, such a program could take the form of grants, tax credits, and/or a revolving loan fund to deliver benefits most efficiently. Jurisdictions with such programs generally provide financial support between $2,500 and $10,000 to help seniors make modifications, including widening doors and hallways, creating no-step entrances, and creating accessible bathrooms on main floors and/or installing no-slip surfaces and grab bars.[57]
While tax credits, grants, or loans can help encourage such modifications, landlords should also be asked to shoulder more of the burden for making their units safe and accessible for all seniors. Just as the City has required window guards to be installed in units that house young children, the City should explore whether landlords should assume similar responsibility for making low-cost improvements to units for seniors, including installing no-slip surfaces or grab bars. Furthermore, the City should examine whether changes are needed to building codes and enforcement efforts so that more newly constructed or significantly altered structures are age-friendly. In addition, the City and State should work together to ensure that such modifications are not considered Individual Apartment Improvements that would otherwise allow landlords to raise rents as a result of paying for such modifications.
Given the significant need for these programs and the rapidly aging population, the cost of such a program could be considerable in New York City if applied to all seniors living in housing that requires modifications. One way to mitigate costs would be to limit the program to middle and low-income homeowners, as is done in Chicago and Washington D.C. For comparison, however, if a program similar to the Washington D.C. model were created in New York City, its annual cost could exceed $50 million.[58] Therefore, as the program is established, parameters should be developed to ensure that costs are sustainable.
Developing Livable Communities for Seniors
AARP defines a livable community as one that is “safe and secure, has affordable and appropriate housing and transportation options, and has supportive community features and services. Once in place, those resources enhance personal independence; allow residents to age in place; and foster residents’ engagement in the community’s civic, economic, and social life.”[59] While a number of programs are designed to help create livable communities, the proposals discussed below can further help to address this challenge.
Age-Friendly Neighborhoods
In 2010, as part of the Age Friendly NYC initiative, a partnership between the Mayor’s Office, the City Council, and the New York Academy of Medicine, three neighborhoods—East Harlem, the Upper West Side, and Bedford-Stuyvesant—were placed in a pilot program called Aging Improvement Districts. The purpose of the program was to consult with seniors in those neighborhoods to identify problems and put forward tangible plans to improve the quality of life for seniors in those neighborhoods.
Following the pilot program, the Age-Friendly Neighborhoods program was launched, which expanded the Age-Friendly designation to 10 additional neighborhoods across the City.[60] In 2015, based on conversations with seniors in their local communities, a Neighborhood Action Plan was created for each Age-Friendly Neighborhood to identify concrete steps that could help the neighborhood become a better place for seniors.[61] Steps identified in these action plans range from additional benches on city streets to expanded mental health services for seniors to age-friendly training for bus drivers.
While expanding this program citywide would help all New Yorkers, the program could easily double in size to include additional neighborhoods with large and/or growing populations over 65. In particular, the following areas of the City that contain about 325,000 New Yorkers over 65 (about 29 percent of the City’s total population over 65) could be targeted for an expansion of the program:
Targets for Expansion of Age Friendly Neighborhoods Program
| Community District | Neighborhoods | Percent 65 years and over (2015) | Number 65 years and over (2015) | Percent of NYC Population 65 years and over (2015) |
| Bronx Community District 8 | Riverdale, Fieldston & Kingsbridge | 17.00% | 19,126 | 1.69% |
| Brooklyn Community District 1 | Greenpoint & Williamsburg | 9.80% | 16,446 | 1.46% |
| Brooklyn Community District 18 | Canarsie & Flatlands | 12.50% | 26,655 | 2.36% |
| Manhattan Community District 3 | Chinatown & Lower East Side | 15.90% | 26,082 | 2.31% |
| Manhattan Community District 6 | Murray Hill, Gramercy & Stuyvesant Town | 17.70% | 24,882 | 2.20% |
| Manhattan Community District 8 | Upper East Side | 20.00% | 42,914 | 3.80% |
| Manhattan Community District 12 | Washington Heights, Inwood & Marble Hill | 12.70% | 28,871 | 2.56% |
| Queens Community District 2 | Sunnyside & Woodside | 12.90% | 18,692 | 1.66% |
| Queens Community District 6 | Forest Hills & Rego Park | 17.10% | 21,877 | 1.94% |
| Queens Community District 8 | Briarwood, Fresh Meadows & Hillcrest | 14.70% | 23,757 | 2.10% |
| Queens Community District 10 | Howard Beach & Ozone Park | 12.70% | 17,253 | 1.53% |
| Queens Community District 12 | Jamaica, Hollis & St. Albans | 12.80% | 31,609 | 2.80% |
| Staten Island Community District 3 | Tottenville, Great Kills & Annadale | 16.90% | 28,331 | 2.51% |
Analysis by Office of the New York City Comptroller
Community-based planning centered on engagement with older New Yorkers in their local neighborhoods is essential to developing appropriate strategies to address the continued aging of the city’s population. By doubling the number of Age-Friendly Neighborhoods, the City can ensure that more seniors have the chance to provide input in making their neighborhoods more livable.
Senior Centers
Part of building livable communities is ensuring that seniors have opportunities to engage with their neighbors, participate in the community, and receive supportive services as required. One of the ways seniors can do so is by visiting a senior center. New York City has an extensive network of about 250 senior centers that provide an array of services like meals, activities, and help obtaining benefits.[62] The centers—visited by over 29,680 seniors daily—served over 160,000 New Yorkers in FY16.[63] Of the senior centers, 120 are located in New York City Housing Authority (NYCHA) developments.[64]
Sixteen of New York City’s senior centers are classified as innovative senior centers. Innovative senior centers differ from the traditional senior centers in that they provide more robust programming and services and are open for more hours to serve a broader community than just local seniors. A number of the innovative senior centers are targeted to better serve particular segments of the population, such as LGBT seniors or seniors with visual impairments.[65]
The Department for the Aging (DFTA) is the lead agency that funds and operates senior centers. Innovative senior centers individually receive about $1 million annually from the City while neighborhood senior centers receive about $500,000. The largest percentage of DFTA’s budget—almost 44 percent—is spent on senior center programs. As shown in Chart 10, in FY17, DFTA is estimated to spend $149 million for senior center programs, up from $100 million in FY10 when senior center funding accounted for 35 percent of DFTA total expenses.
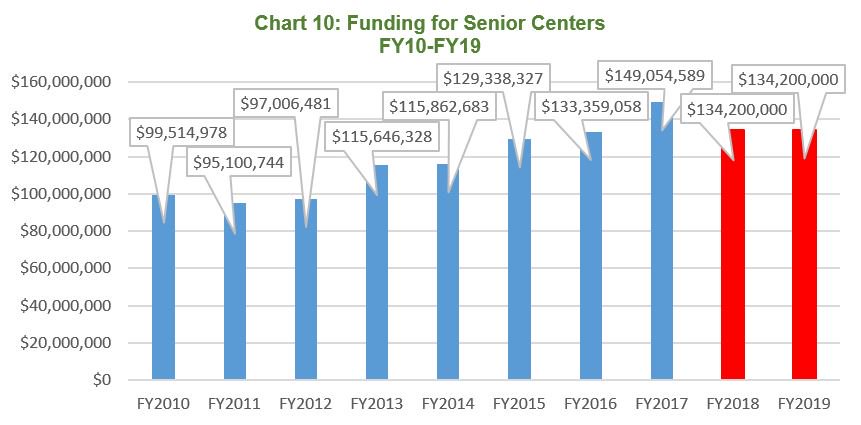
Source: New York City Comptroller Analysis of New York City Financial Management System
A significant part of the spending increase in recent years can be attributed to the fact that DFTA has taken over responsibility from NYCHA for a number of senior centers that were otherwise scheduled to close and also to changes to insurance programs.[66]
Despite funding growing to an estimated $149 million in FY17, the City’s financial plan currently projects senior center program funding will fall $14.8 million in FY18 and then remain flat at $134.2 million in future years.[67] In the coming years, the City will need to provide additional funding for senior centers to sustain current spending levels.
Additional baseline funding for senior centers represents a good investment of resources. A 2016 study authored by two Fordham University researchers found that senior centers, both innovative and traditional, are providing critical and effective services to vulnerable seniors. According to the study, “senior center participants reported improved physical and mental health, increased participation in health programs, frequent exercising, positive behavior change in monitoring weight and keeping physically active. Participation in a senior center also helped to reduce social isolation.” The study further found that “[senior center] members experience improved physical and mental health not only in the time period after joining a senior center, but maintain or even continue to improve even one year later.”[68]
The increasing size and needs of the aging population combined with the success of the existing senior center program suggests that senior center services will continue to be required in the future. Indeed, the previously mentioned 2016 study found that seniors who do not utilize senior centers cite inconvenient locations as one of the top five reasons they do not attend.[69]
Furthermore, comparing the location of senior centers to the neighborhoods with the most seniors demonstrates that certain neighborhoods with large number of seniors have relatively few senior centers. Map 5, below, shows the location of senior centers listed in the City’s Open Data portal compared to the number of seniors in each community district from the 2015 American Community Survey.[70]
Map 5: Number of Residents 65+ by Community District with Senior Center Locations
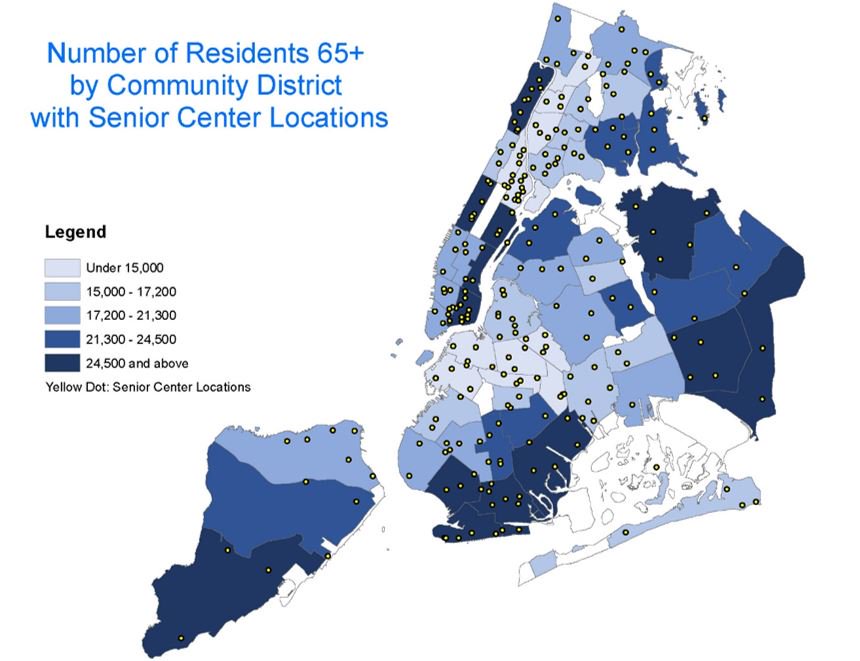
Map 5 documents the fact that senior centers are not consistently located in places with a large number of seniors, reinforcing the fact that inconvenient locations may be preventing seniors in certain neighborhoods from visiting senior centers. Based on the geographic distribution, this may be particularly true in the following Community Districts:
Community Districts with Relatively Large Senior Populations but Few Senior Centers
| Community District | Neighborhoods | Percent 65 years and over (2015) | Number 65 years and over (2015) | Percent of NYC Population 65 years and over (2015) |
| Brooklyn Community District 11 | Bensonhurst & Bath Beach | 14.80% | 27,803 | 2.46% |
| Queens Community District 8 | Briarwood, Fresh Meadows & Hillcrest | 14.70% | 23,757 | 2.10% |
| Queens Community District 11 | Bayside, Douglaston & Little Neck | 19.00% | 21,577 | 1.91% |
| Queens Community District 13 | Queens Village, Cambria Heights & Rosedale | 15.10% | 30,655 | 2.72% |
| Staten Island Community District 3 | Tottenville, Great Kills & Annadale | 16.90% | 28,331 | 2.51% |
Analysis by Office of the New York City Comptroller
Additional evidence suggests that there is opportunity for DFTA to expand culturally competent programming to serve specific populations in need of senior center programs and resources throughout the City, particularly those with limited English proficiency and immigrants. For instance, a 2014 study in the Journal of Urban Health suggested that there may be “substantial unmet need” for senior center programs and services among Spanish-speaking Hispanic seniors because Spanish-speaking Hispanic seniors were less likely to attend a center than English-proficient Hispanic seniors.[71] Similarly, a 2013 report from the Center for an Urban Future recommended that one way the City could respond to the growing number of immigrant seniors is to increase the number of senior centers providing “culturally and linguistically appropriate services.”[72] While the City Council has provided funding to support senior centers that serve immigrant populations, more can be done to ensure that senior centers are welcoming to all.[73]
Safe Streets for Seniors
Seniors are disproportionately at risk of being killed or injured in traffic accidents. Adults over 65 years of age made up 39 percent all pedestrian fatalities in the City in 2014, despite accounting for only 13 percent of the City’s population.[74] Additionally, in an AARP survey of New Yorkers 50 and above, 72 percent said that the condition of streets is a problem, 68 percent said that cars not yielding to pedestrians is a problem, 56 percent said that the condition of sidewalks is a problem, and 55 percent said that traffic lights being timed too fast is a problem.[75] Given that many seniors in New York get around on foot, the senior pedestrian fatality rate is substantially higher in New York City (5.3 fatalities per 100,000 people) than nationally (2.0 fatalities per 100,000 people).[76]
The Department of Transportation’s Safe Streets for Seniors program is designed to combat this challenge.[77] Begun in 2008, the program consists of 37 target neighborhoods across the City where the Department of Transportation is making improvements to reduce accidents by lengthening walk times, installing medians, creating dedicated turning lanes, and more.
As with the Age-Friendly Districts program, a number of neighborhoods with a higher-than-average number and concentration of individuals over 65 could potentially benefit from inclusion into the program. Ten Community Districts do not contain any areas covered by the Safe Streets for Seniors program despite being among the neighborhoods with a high concentration and/or amount of seniors in New York City including: Bronx Community Districts 9 and 10, Brooklyn Community Districts 10 and 18, Queens Community Districts 10, 11, 12, and 13, and Staten Island Community Districts 1 and 3.
Among these community districts a few stand out for relatively high traffic fatality or injury counts between January and October 2016. Specifically, in Queens Community Districts 12 and 13, the two portions of the city with the largest senior population not participating in the Safe Streets for Seniors program, there were 1,876 traffic injuries and 1,428 traffic injuries respectively and five total traffic fatalities.[78] In addition, there were 926 injuries and five fatalities in the Canarsie/Flatlands portion of Brooklyn during this time period.[79]
While the City has focused significant resources on improving traffic safety through Vision Zero, it could supplement those efforts with a targeted expansion of Safe Streets for Seniors. According to the Department of Transportation, the Safe Streets for Seniors program has not been expanded to new neighborhoods or localities since 2012-2013.[80] Yet, as the injury and fatality data indicates, certain neighborhoods that have a large number of seniors and are not enrolled in the program suffer from a relatively high amount of traffic injuries and/or fatalities. Expanding the Safe Streets for Seniors program could help to reduce the number of New Yorkers involved in traffic accidents while also helping the many seniors in these communities live more safely and comfortably.
Transportation
Creating livable communities for seniors requires that public transportation systems be accessible for older adults. However, certain areas of the City with large numbers of seniors lack adequate public transit. In 2011, Transportation for America published a report estimating that 41 percent of New York City seniors, or approximately 560,000 persons between 65 and 79 years of age, would have poor access to public transit in 2015.[81]
The fact that many seniors lack access to adequate public transportation is also supported by data included in the City’s OneNYC Plan. According to the OneNYC Plan, 35 city neighborhoods have below average job access via public transit and below average incomes and therefore need more reliable public transit services.[82] Of those 35 neighborhoods, more than half are located in community districts that exceed the citywide average concentration of seniors.
A primary mode of transportation for many older New Yorkers is the Access-A-Ride (AAR) program. AAR is a door-to-door paratransit service provider in New York City that is operated by the Metropolitan Transportation Authority (MTA) in order to comply with the requirements of the Americans with Disabilities Act to provide comparable transportation service for individuals who are unable to use the bus or subway system. In 2015, AAR provided over six million trips to approximately 145,000 New Yorkers, 69 percent of whom were older than 65 years of age.[83] A November 2016 report from the Rudin Center for Transportation at New York University indicates that as the city’s population ages, the MTA expects AAR usage to more than double to 14,322,120 trips for 316,907 New Yorkers by 2022.[84]
However, the AAR program is plagued by inefficient service and high costs. According to the Citizens Budget Commission, AAR costs more on a per-trip basis ($71 in 2014) than paratransit programs in other, large metro areas.[85] Despite these high costs, an audit of the program by the Comptroller’s office found that service was “unreliable,” due in part to lengthy travel times and the fact that an AAR vehicle failed to show up for a scheduled trip more than 31,000 times in 2015.[86]
These analyses indicate that many seniors lack access to the reliable transportation services they need to go to the doctor, buy groceries, and visit their family and friends. However, the Department of Transportation’s most recent strategic plan makes almost no reference to seniors at all.[87] More needs to be done on the citywide level to build a public transportation system that can effectively serve an aging population.
Bus Shelters and Benches
Many seniors in New York City rely on the bus system to travel, and bus riders tend to be older than other users of public transportation. According to the Tri-State Transportation Campaign’s analysis of Metropolitan Transportation Authority (MTA) data, 27 percent of individuals between 55 and 64 years of old report using the bus only, compared to 16 percent who report using the subway only and 19 percent who use a combination of bus and subway.[88]
One way the City can make the bus system friendlier to seniors is to install bus shelters and benches at more stops, particularly in areas with a large population of seniors. Bus shelters and benches allow individuals to comfortably sit in a covered space while waiting for a bus. For seniors, who are more likely than the general population to have mobility impairments, a bus shelter and bench can be the difference between using the bus and not leaving the house. Furthermore, by making these investments, the City could potentially reduce the number of seniors relying on very expensive AAR services, helping to reduce the costs of the program.
Yet, according to an MTA report from September 2015, of the 24,798 bus stops in the city only 27.2 percent have bus shelters.[89] Currently, bus shelters are installed at no cost to the City through a 2005 contract with Cemusa (which was since acquired by JCDecaux) in which Cemusa receives the right to sell advertising at the bus shelter.[90] Under the contract, Cemusa is to construct 3,300 bus shelters at existing locations and up to 200 shelters at new locations at the direction of DOT. Therefore, to construct additional bus shelters, the City would either need to reach agreement with JCDecaux to do so or enter into a new franchise agreement with an entity other than JCDecaux.
In recent years the City has increased the number of benches throughout the five boroughs via the City Bench program. Through the program, funded largely by a federal grant, the City has installed about 1,500 benches with a plan to reach 2,100 by 2019, with an average cost of about $3,000 per bench.[91] According to DOT, the program is targeted to serve bus stops, retail corridors, and areas with a high concentration of seniors. However, based on an analysis of the location of City Benches, the community districts with the highest numbers of seniors generally have the fewest number of City Benches, whereas the community districts with the lowest number of seniors have the highest number of City Benches. In fact, 14 of the 20 community districts with the largest number of seniors have among the lowest ratio of City Benches per 10,000 seniors.[92] Consequently, as the DOT continues to install City Benches, it will need to do more to rectify this imbalance to ensure the program is serving its stated intent.
Trains
New York City’s extensive subway and train system helps millions of New Yorkers get to and from work and move about the city. However, for seniors with mobility impairments or difficulty walking up stairs, the subway can be a daunting challenge, if usable at all. For example, a senior who lives in Sheepshead Bay currently has to travel a considerable distance to reach the closest accessible subway station, making it difficult, if not impossible, to use the subway.[93]
According to a report from the Rudin Center for Transportation Policy & Management at New York University, only 23 percent of subway stations—115 of 494—are fully accessible, including the Staten Island Railway.[94] Consequently, many neighborhoods with large numbers of seniors have few to no accessible subway stations.
To keep up with the needs of its customers, the MTA will need to significantly expand the number of stations that are accessible for seniors and others with mobility impairments. In 1994, the MTA committed to making 100 “key” stations fully accessible by 2020, a goal the agency plans to meet according to the MTA’s 2015-2019 Capital Plan. [95] Key stations are those with high levels of usage, provide transfer points to other lines or modes of transportation, are end-of-line stations, or serve key areas for employment, government, education, health care, or other services for people with disabilities.[96] The Capital Plan includes $176 million to make additional “non-key” stations accessible as well.[97]
With the MTA on the verge of meeting this commitment, the agency needs to articulate a plan to continue making the system accessible to all users and to properly maintain elevators and escalators upon which seniors depend. Meeting its 1994 obligation must not be an excuse to cease or reduce funding for accessibility projects. Indeed, the aging of the City’s population means that more users will likely have mobility impairments than ever before.
Consequently, when deciding how to prioritize the next group of stations to be made accessible, the MTA should also consider whether the accessibility modification would benefit a large group of New Yorkers beyond those with disabilities. While the MTA should strive to make all stations accessible throughout the system, doing so would allow the MTA to consider the overall size of the senior population located near a station in determining the priority for future accessibility modification to subway stations.
Beyond the subway system, other rail lines also help move New Yorkers, including seniors, from place to place. For example, in Queens Community Districts 7 and 11, which combined are home to more than five percent of the city’s population over 65, there are many more Long Island Rail Road (LIRR) stations than MTA subway stations. While seniors benefit from reduced fares on these systems, there are no free transfers between the LIRR and MTA subways or buses. One way of expanding public transit access in these parts of Queens would be to pilot a program allowing free transfers between the two systems for seniors. Doing so could allow policymakers to collect data and gauge whether or not making it cheaper to transfer between the two systems would have a beneficial impact on seniors in other parts of the city.
Supporting the Wellbeing of Older New Yorkers
Delivering effective and appropriate services to seniors is a critical component of ensuring that seniors can age in place. In New York City, much of that responsibility falls on DFTA, which operates a number of programs designed to help seniors. While many DFTA programs are serving a higher number of seniors than ever before, according to the 2016 Mayor’s Management Report, funding for the agency makes up a small percentage of the City’s overall spending.[98] In FY17, DFTA’s estimated budget of $340 million represents a total of 0.4 percent of total City expenditures, or about $300 per New Yorker over the age of 65.[99]
Chart 11 below shows the change in overall DFTA funding since FY10 to the projected FY17 levels. Overall, total DFTA funding has increased by about 20 percent during this period, from $281 million in FY10 to an estimated $340 million in FY17. At the same time, the headcount at the agency has declined from 900 to 731 full time employees.[100] The increase in DFTA funding has been driven by increased City funding, which rose by about 38 percent during this time from $158 million to an estimated $216 million.[101]
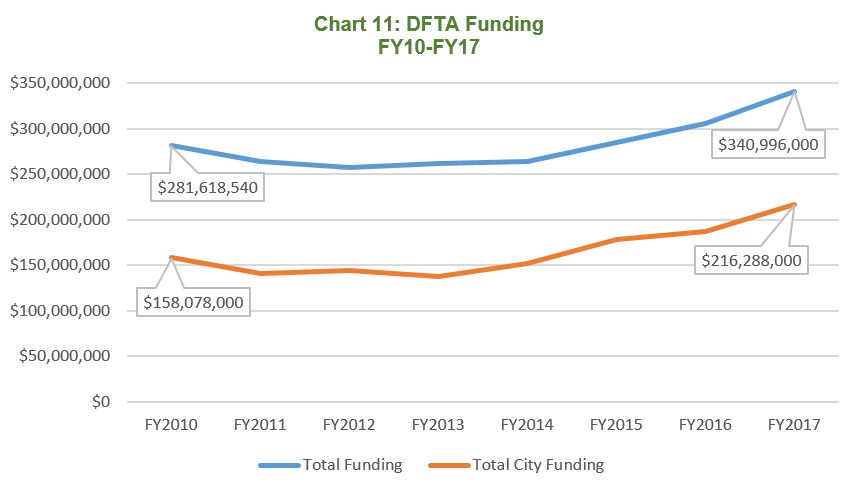
Source: New York City Comptroller Analysis of New York City Financial Management System
In recent years, the City Council has taken steps to provide additional funding for DFTA above the levels included in the Mayor’s budget proposals. Most recently, in FY17 the Council provided an additional $30.1 million to DFTA programs.[102] This investment built on the additional $33.8 million provided by the Council in FY16 and $20.0 million in FY15.[103] Overall, the Council estimates that since FY11 an average of 11 percent of DFTA’s funding has come through Council funding.[104] While these investments have provided important resources to DFTA, because they are not included in the budget baseline, the agency is not able to accurately predict their future funding levels and plan accordingly.
As discussed in more detail below, a number of important DFTA programs that deliver services to seniors and their caregivers will likely need to be enhanced to meet the demands of an aging population. In addition, as part of the City’s efforts to promote the well-being of seniors, more attention needs to be given to helping New Yorkers build their retirement savings so they have more resources available as they grow older.
Naturally Occurring Retirement Communities (NORCs)
NORCs are buildings, housing complexes, or neighborhoods that house a significant number of seniors despite not being built for that purpose. According to Fredda Vladeck, one of the founders of the NORC program model, “The ultimate goal of NORC Supportive Service Programs is to help transform communities into good places to grow old—communities that support healthy, productive, successful aging and respond with calibrated supports as individual needs change.”[105]
Federal, state, and city governments have different definitions of NORCs, but in general NORCs are geographic areas like buildings or neighborhoods in which more than 40 percent of the population consists of seniors.[106] Through DFTA, the City funds programs in NORCs in order to provide services and supports to older residents including preventive health care, wellness activities, classes and educational activities, volunteer opportunities, and other services.[107] Combined, the services offered in NORCs help seniors participate in their local communities, remain in their homes, and avoid costly and difficult moves to nursing homes.
New York City has a long history with NORCs, as the first NORC program was created in 1985 at the Penn South housing development in Manhattan.[108] Today there are two types of NORCs in New York City. The majority of NORCs are called “classic” or “vertical” NORCs, and they serve a specific building or housing development. A more recent type of NORC, called a “neighborhood” or “horizontal” NORC, supports seniors in a broader geographic area than a single building. City- designated NORCs are generally classic NORCs, although more recently the City has funded hybrid programs that bring NORC service providers and senior centers together to provide services. At the same time, the State has funded seven neighborhood NORCs in the five boroughs.[109]
The NORC model has proven to be an effective means of helping seniors age safely and healthily in their communities. For instance, a 2010 study of NORC participants in Maryland found that the programs operated in NORCs improved the quality of life for program participants and made it more likely that they would be able to age in place.[110] Other studies have found that seniors living in NORCs are more likely to socialize with others, leave the home, volunteer in their communities, and access appropriate supportive services.[111]
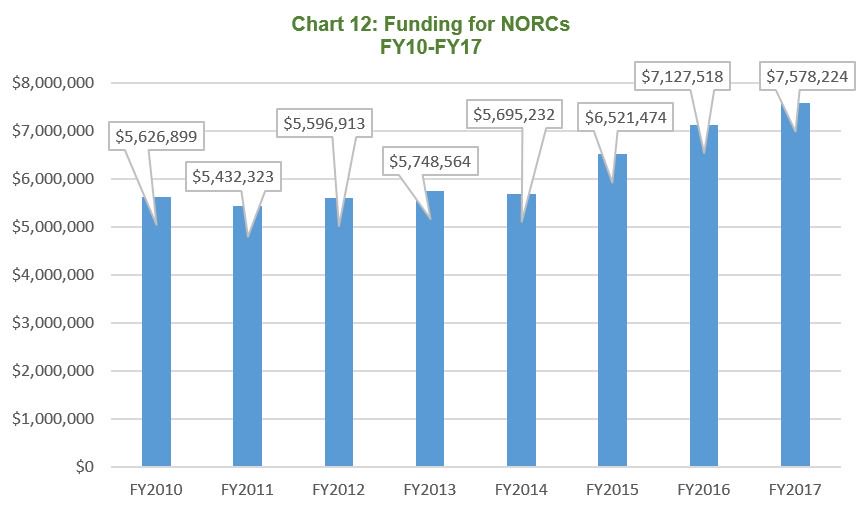
As shown in Chart 12, DFTA funding for NORCs has increased from about $5.6 million in FY10 to an estimated $7.6 million in FY17. In FY17, $3.85 million of this funding was provided by the City Council, which has consistently provided additional funding for NORC programs beyond the levels in the baseline budget.[112] A portion of the City Council funding is allocated to neighborhood NORCs that do not receive funding from DFTA.[113]
In testimony to the City Council in February 2016, DFTA indicated that there are 53 City designated NORCs, of which 28 are supported by baseline DFTA funds and 25 by discretionary funds from the City Council.[114] The locations of those NORCs are detailed in Map 6, seen below.
Map 6: Number of Residents 65+ by Community District with NORC Locations
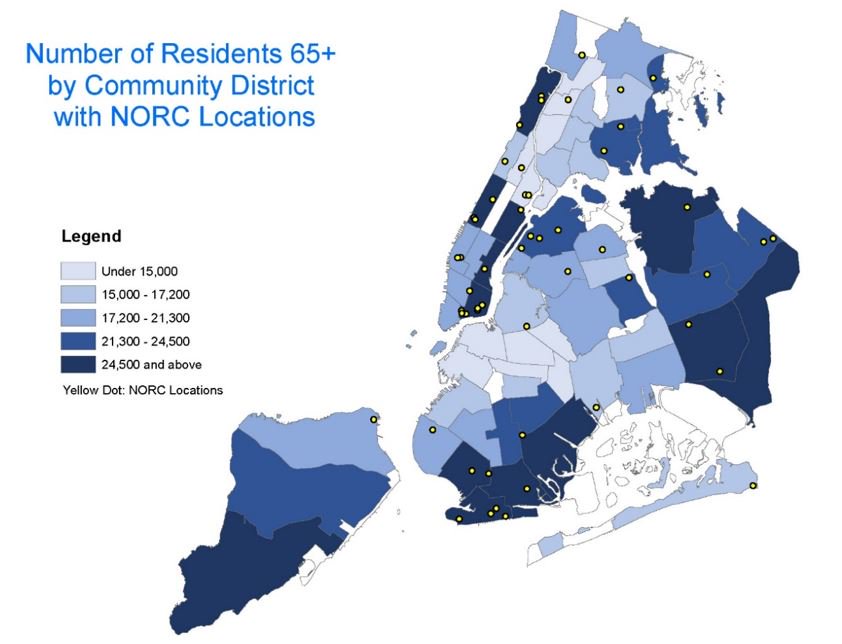
In general, there is at least one NORC in community districts with large populations and/or concentrations of seniors, and currently at least one NORC is located in 30 of the city’s community districts. As with senior centers, however, there are community districts that lack a NORC despite having a significant number or concentration of seniors including, Queens Community District 6 (Forest Hills & Rego Park), Queens Community District 13 (Queens Village, Cambria Heights & Rosedale), and Staten Island Community District 3 (Tottenville, Great Kills & Annadale).
With almost 30 percent of the NORCs concentrated in three community districts (Manhattan Community District 3, Brooklyn Community District 13, and Queens Community District 1) that house only seven percent of the city’s population over 65, more can be done to expand the reach of the program in New York City. In doing so, the City should consider targeting additional funding to create new neighborhood NORC models in New York City communities with a high density of seniors that would benefit from the services, which should include the creation of annual baseline funding for such a program. If consistent with current funding levels, each additional NORC would require between $200,000 and $500,000 in annual funding.[115]
Supporting Caregivers
Citywide, it is estimated that as many as 1.5 million people including family members, neighbors, and friends are informal caregivers, doing everything from helping with grocery shopping, to providing financial support and giving rides to a senior center.[116] In most cases, these caregivers are not trained and perform these caregiving activities while also juggling their own personal and working lives.
DFTA supports over 10,000 caregivers through services such as informational guides and direct assistance, including helping caregivers access public benefits, counseling and support group workshops, and supplemental services like transportation and health equipment.[117] Despite the large size of the caregiving population, however, DFTA receives only approximately $4 million annually to support caregivers. This funding is entirely from the federal government and not supplemented by any City funds.[118] While the Council proposed matching the $4 million federal contribution during the FY17 budget process, additional funding was ultimately not provided.[119] Providing this additional funding would benefit caregivers and seniors alike.
While this additional funding would help support local programs, adequately supporting caregivers extends beyond the means of the City of New York. Consequently, federal action is also necessary. Specifically, Congress should adopt one of the various proposals to provide tax credits to caregivers to help offset the costs of caregiving. Recently, Congresswoman Barbara Lee (CA) introduced H.R. 329, which would provide a tax credit to reduce the costs of certain caregiving services, like household services, so that the children of aging parents can better afford to provide care to their loved ones and remain in the workforce. Alternatively, in the previous session of Congress, Senators Amy Klobuchar (MN) and Barbara Mikulski (MD) introduced S. 879, the Americans Giving Care to Elders (AGE) Act of 2015.[120] This legislation would help adult children care for their aging parents by providing those children with a tax credit to offset up to $6,000 in caregiving expenses.[121] These proposals would provide additional support to the 1.5 million informal caregivers across the five boroughs and would make it possible for more seniors to comfortably age in place.
At the same time, the City and State should advance legislation that would help support caregiving. That includes passing “Right to Request” laws, which allow caregivers to request a flexible schedule without fear of retaliation so that they can take the time to care for their loved ones. Comptroller Stringer first called for passage of Right to Request laws in September 2015, and legislation was recently introduced in the City Council to provide all New Yorkers with this right.[122]
DFTA-Funded Case Management and Homecare Programs
A number of other programs are included in DFTA’s budget that make it possible for seniors to age in place and also make it easier for the family and friends who care for those seniors. Chart 13 shows funding levels for two of those key programs at DFTA: case management and homecare. While both programs saw funding reductions in FY11 and FY12, funding for case management has grown steadily despite homecare funding in FY17 remaining below FY10 levels.
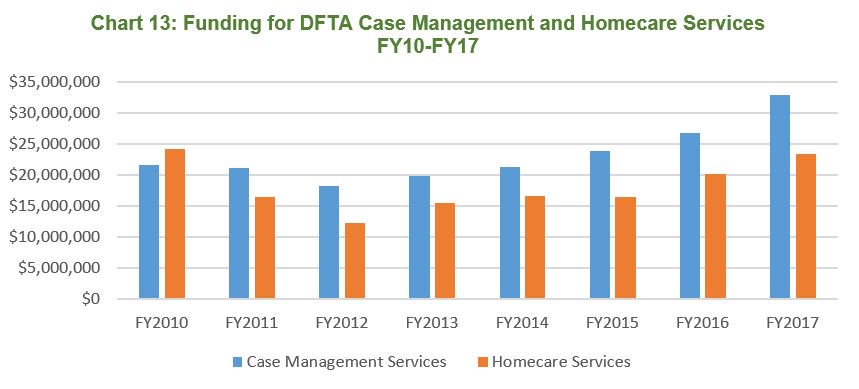
The DFTA case management system, funded at an estimated $33 million in FY17, is the gateway for seniors seeking support from the agency, including meal delivery and other supportive services. Consequently, case management services are vital to protecting the health and wellness of seniors in New York City who are not eligible for personal care through Medicaid. The number of clients served by DFTA case managers has doubled since 2012 to 32,773 persons in FY16.[123] Despite increasing the number of seniors served by the program, another 1,700 remain on wait lists for critical services.[124] According to the Comptroller’s Office, supporting the estimated 1,700 seniors waiting for case management services would cost approximately $1.5 million annually based on an average annual cost of $906 per senior served.
The City has recently provided additional funding for DFTA to raise the salaries of case managers, which were below those of other case managers in City government. Doing so will allow the agency to hire and retain more highly qualified case managers, which should help to reduce the case management backlog.
Homecare programs are closely related to case management because seniors must first receive case management services in order to be assessed and receive homecare services. The DFTA homecare program serves seniors without access to Medicaid benefits by assisting seniors who need additional help with things like daily chores and personal care to remain in their homes. However, despite there being a backlog of about 750 seniors seeking homecare services, FY17 funding for the program is an estimated $23.4 million, slightly below the $24.3 million provided for these services in FY10.[125] Expanding the program to serve an additional 750 clients is estimated by the Comptroller’s Office to cost approximately $5.5 million based on a per-client estimated annual cost of $7,300.
It seems reasonable to expect that the growing population of seniors, many of whom live on the cusp of poverty, will put additional pressure on these DFTA programs in the coming years, including the case management system and home care programs. This likely pressure, combined with the existing backlog, is a strong reason for the City to expeditiously allocate the funds needed to reduce the case management and homecare backlogs, totaling approximately $7 million. These programs are critical to providing seniors with the care and support they need to safely age in their homes and remain vibrant parts of their local communities.
Prevention and Wellness
Helping New York’s older adults stay healthy is an important part of building a City in which seniors can safely age in place. A key component of doing so is ensuring that seniors have access to annual wellness and preventive services.[126] As part of healthcare policy changes enacted in the Affordable Care Act, Medicare beneficiaries are now entitled to receive a wellness session with their doctor each year.[127] The wellness visit includes both a routine check of key health indicators like weight and blood pressure, and also an evaluation of cognitive health to screen for impairments like dementia that are more common in seniors.[128] The first annual wellness visit is also required to identify risks of depression, although a full depression screening is not required.[129] Access to this important benefit could be jeopardized if the Affordable Care Act were repealed by Congress.[130]
Despite the fact that Medicare beneficiaries can access annual wellness services without copays, data from the Center for Medicare and Medicaid Services (CMS) indicates that relatively few seniors take advantage of free preventive services. Specifically, in 2015 in New York State, only 17.9 percent of seniors (574,405 out of the 3.2 million seniors receiving health benefits through Medicare Part B or Medicare Advantage) took advantage of their annual wellness visit. By comparison, about 29 percent of eligible seniors in Massachusetts and 30 percent of eligible seniors in Rhode Island used this service, the highest levels in the country according to CMS.[131]
Increasing the number of seniors who take advantage of this benefit can help more New Yorkers safely age in place. To do so, the New York City Department of Health and Mental Hygiene (DOHMH), the City agency responsible for public health programs, should work with DFTA to create an outreach campaign to educate seniors and health care providers about the importance of annual wellness screenings. In conducting this outreach, DOHMH and DFTA should utilize the existing network of senior-focused service providers, including senior centers, NORCs, DFTA-funded case managers, and others to make sure that seniors are accessing annual wellness and prevention services along with hospitals and other health care providers.
While expanded use of annual wellness visits will benefit seniors more broadly, the visits can be particularly helpful at improving early detection of diseases like Alzheimer’s and other dementias. According to a report from the Alzheimer’s Association, only about half of all individuals living with Alzheimer’s and other dementias have been diagnosed.[132] Expanding access to cognitive screenings can help identify those impacted by these diseases and, through greater early detection, identify steps that can help provide the appropriate levels of services and care for patients that are critical components of helping these individuals safely age in their homes instead of institutional settings.
Through the ThriveNYC initiative, the City recently expanded mental health services at 25 senior centers and has launched new efforts to engage homebound seniors through the DFTA case management system.[133] These programs are an important step forward, but can be enhanced with a greater effort on encouraging seniors to access preventative services and better engagement with senior service providers.
Retirement Security
As previously discussed, many New Yorkers over 65 are living in precarious financial circumstances. Consequently, policy changes to expand existing benefit programs and help younger New Yorkers better prepare for retirement are urgently needed.
To help more New Yorkers save for retirement, Comptroller Stringer recently unveiled a proposal called the New York City Nest Egg. If implemented, the proposal would create new, easy-to-use savings plans for all private sector workers. Employers that do not sign up for one of these plans or provide one of their own would be required to enroll their workers in Individual Retirement Accounts (IRAs), ensuring that all New Yorkers are easily able to participate in a retirement savings plan.[134]
Ensuring that both current and future seniors have adequate retirement income is important not just for that individual adult and their family, but also for the economic wellbeing of local communities and businesses across New York City where seniors spend their money.
As outlined below, additional steps would build on the New York City Nest Egg proposal and help accomplish this goal.
Expand Social Security
As previously discussed, Social Security plays a critical role in keeping New York’s seniors out of poverty. But, in the most expensive city in the country, the modest benefits are not keeping up. Each year Social Security benefits are supposed to increase through a cost of living adjustment (COLA), which is designed to help seniors keep up with inflation. However, in recent years the annual COLAs have been quite small; the COLA for 2017 will be 0.3 percent and there was no COLA in 2016.[135]
While designed to help seniors cope with inflation, Social Security’s COLA is based on a formula that does not accurately take into account the inflationary pressures felt specifically by seniors. For instance, seniors are more likely than non-seniors to be particularly sensitive to price increases in items like health care, which has seen higher price increases than many other items in recent years. However, the formula used to calculate Social Security COLAs does not account for the fact that seniors spend more of their income on health care than non-seniors.[136]
To improve the way the annual COLA is calculated, Congress should pass legislation that would base future Social Security COLAs on a more accurate measure of inflation as experienced by seniors. Doing so would provide an immediate increase in Social Security benefits for current retirees and also ensure that the benefits of future retirees adequately keep up with rising costs of living.
Improve the Federal Savers Credit and Create a State Saver’s Credit
The federal Retirement Savings Contribution Credit, also called the Saver’s Credit, provides low and moderate income families with a tax credit of up to $2,000 for money they put into retirement savings accounts. In 2017, the amount of the credit is based on a formula that takes into account the amount of retirement contributions and overall earnings, but in no case can exceed $2,000 overall. To be eligible for the credit, an individual must be over 18 and not a full time student or dependent. The credit is not refundable.[137] In 2014, 129,320 New York City tax filers claimed the Saver’s Credit out of an income-eligible population of approximately two million tax filers.
Consistent with the low utilization rate in New York City, evidence indicates that relatively few eligible tax filers are aware of and claim the credit. For instance, Transamerica recently found that only 30 percent of workers were aware of the Saver’s Credit.[138]
Therefore, to grow awareness of the credit and ensure that all eligible New Yorkers are benefiting, the Department of Consumer Affairs (DCA) should begin highlighting the Saver’s Credit in its annual tax preparation outreach, which in recent years has focused heavily on expanding enrollment in the Earned Income Tax Credit (EITC).[139] Given the successes that DCA has had in expanding EITC utilization and the credit’s relatively low usage, a similar effort to encourage more people to claim the Saver’s Credit has the potential to significantly increase the number of New Yorkers that claim the credit.
At the federal level, Congress should modify the credit by adopting the Encouraging Americans to Save Act (S. 2492 in the 114th Congress).[140] The legislation would make the Saver’s Credit refundable, expand the number of individuals eligible for the credit, and allow the credit to be directly deposited into a retirement savings vehicle. Making the credit refundable is particularly important as refundable credits can reduce a taxpayer’s tax liability below zero, meaning that they can result in the government returning money to the taxpayer. A refundable Saver’s Credit would therefore better reward and encourage saving for retirement.
In addition, New York State and/or New York City should also consider creating a saver’s tax credit that would match a portion of the federal credit, as both have done with the EITC. Currently, New York State provides a 30 percent match of the federal EITC, while New York City provides a five percent match of the credit. A similar model could be applied to create a local version of the Saver’s Credit in which either or both the State and City would provide a tax refund to further encourage eligible individuals to save for retirement. Based on the number of New York City tax filers who claim the credit, a 30 percent match from the State would cost approximately $7 million while a 5 percent match from the City would cost about $1 million.
Conclusion
The aging of New York City’s population presents an opportunity for the City, working with State and Federal partners, to take stock of how current programs are meeting the needs of an aging population and determine the additional steps that need to be taken to ensure that all New Yorkers can enjoy their golden years. Despite a number of successful and well-regarded policies and programs designed to help older New Yorkers, a more comprehensive set of solutions, informed by rigorous long-term planning, is needed to allow New York City’s older residents to safely and securely age in place and make even more meaningful contributions to their local communities. While developing these policies will take additional resources at all levels of government, failing to respond to the needs of this growing segment of New York City’s population is an unacceptable alternative.
Appendix
Appendix: New York City Community Districts by Age
| Community District | Total population (2015) | Percent 65 years and over (2015) |
Number 65 years and over (2015) |
Number Under 65 years (2015) | Number 60-64 years (2015) |
| Bronx Community District 1 & 2 | 165,085 | 9.20% | 15,188 | 149,897 | 6,603 |
| Bronx Community District 10 | 116,042 | 20.50% | 23,789 | 92,253 | 9,051 |
| Bronx Community District 11 | 133,573 | 12.70% | 16,964 | 116,609 | 7,614 |
| Bronx Community District 12 | 145,536 | 12.30% | 17,901 | 127,635 | 8,150 |
| Bronx Community District 3 & 6 | 176,226 | 8.60% | 15,155 | 161,071 | 8,106 |
| Bronx Community District 4 | 154,296 | 8.70% | 13,424 | 140,872 | 5,400 |
| Bronx Community District 5 | 143,996 | 7.40% | 10,656 | 133,340 | 4,176 |
| Bronx Community District 7 | 129,884 | 8.60% | 11,170 | 118,714 | 7,923 |
| Bronx Community District 8 | 112,505 | 17.00% | 19,126 | 93,379 | 6,638 |
| Bronx Community District 9 | 178,301 | 12.90% | 23,001 | 155,300 | 8,558 |
| Brooklyn Community District 1 | 167,820 | 9.80% | 16,446 | 151,374 | 7,216 |
| Brooklyn Community District 10 | 122,418 | 16.50% | 20,199 | 102,219 | 6,978 |
| Brooklyn Community District 11 | 187,861 | 14.80% | 27,803 | 160,058 | 10,708 |
| Brooklyn Community District 12 | 161,856 | 11.20% | 18,128 | 143,728 | 7,284 |
| Brooklyn Community District 13 | 122,781 | 20.00% | 24,556 | 98,225 | 9,331 |
| Brooklyn Community District 14 | 163,459 | 13.40% | 21,904 | 141,555 | 8,827 |
| Brooklyn Community District 15 | 147,318 | 17.20% | 25,339 | 121,979 | 9,428 |
| Brooklyn Community District 16 | 127,468 | 10.70% | 13,639 | 113,829 | 4,716 |
| Brooklyn Community District 17 | 143,028 | 15.60% | 22,312 | 120,716 | 8,153 |
| Brooklyn Community District 18 | 213,242 | 12.50% | 26,655 | 186,587 | 14,074 |
| Brooklyn Community District 2 | 134,656 | 9.50% | 12,792 | 121,864 | 6,194 |
| Brooklyn Community District 3 | 150,857 | 9.30% | 14,030 | 136,827 | 5,883 |
| Brooklyn Community District 4 | 122,010 | 8.30% | 10,127 | 111,883 | 4,392 |
| Brooklyn Community District 5 | 158,756 | 10.60% | 16,828 | 141,928 | 7,938 |
| Brooklyn Community District 6 | 117,037 | 9.90% | 11,587 | 105,450 | 5,501 |
| Brooklyn Community District 7 | 149,773 | 11.40% | 17,074 | 132,699 | 6,890 |
| Brooklyn Community District 8 | 131,303 | 10.10% | 13,262 | 118,041 | 4,202 |
| Brooklyn Community District 9 | 115,092 | 13.50% | 15,537 | 99,555 | 6,445 |
| Manhattan Community District 1 & 2 | 153,302 | 11.40% | 17,476 | 135,826 | 8,892 |
| Manhattan Community District 10 | 140,209 | 8.40% | 11,778 | 128,431 | 7,431 |
| Manhattan Community District 11 | 122,434 | 12.10% | 14,815 | 107,619 | 6,489 |
| Manhattan Community District 12 | 227,328 | 12.70% | 28,871 | 198,457 | 13,640 |
| Manhattan Community District 3 | 164,036 | 15.90% | 26,082 | 137,954 | 8,038 |
| Manhattan Community District 4 & 5 | 159,606 | 12.10% | 19,312 | 140,294 | 9,257 |
| Manhattan Community District 6 | 140,575 | 17.70% | 24,882 | 115,693 | 5,342 |
| Manhattan Community District 7 | 189,827 | 19.80% | 37,586 | 152,241 | 14,047 |
| Manhattan Community District 8 | 214,571 | 20.00% | 42,914 | 171,657 | 11,158 |
| Manhattan Community District 9 | 132,630 | 12.40% | 16,446 | 116,184 | 5,968 |
| Queens Community District 1 | 175,460 | 12.60% | 22,108 | 153,352 | 8,773 |
| Queens Community District 10 | 135,849 | 12.70% | 17,253 | 118,596 | 9,781 |
| Queens Community District 11 | 113,563 | 19% | 21,577 | 91,986 | 8,177 |
| Queens Community District 12 | 246,946 | 12.80% | 31,609 | 215,337 | 13,335 |
| Queens Community District 13 | 203,013 | 15.10% | 30,655 | 172,358 | 12,790 |
| Queens Community District 14 | 121,595 | 13.40% | 16,294 | 105,301 | 7,782 |
| Queens Community District 2 | 144,899 | 12.90% | 18,692 | 126,207 | 7,245 |
| Queens Community District 3 | 186,415 | 10.70% | 19,946 | 166,469 | 8,016 |
| Queens Community District 4 | 129,606 | 12.50% | 16,201 | 113,405 | 6,740 |
| Queens Community District 5 | 186,458 | 11.20% | 20,883 | 165,575 | 8,764 |
| Queens Community District 6 | 127,938 | 17.10% | 21,877 | 106,061 | 7,420 |
| Queens Community District 7 | 247,398 | 18.60% | 46,016 | 201,382 | 17,813 |
| Queens Community District 8 | 161,612 | 14.70% | 23,757 | 137,855 | 11,636 |
| Queens Community District 9 | 158,478 | 10.80% | 17,116 | 141,362 | 9,509 |
| Staten Island Community District 1 | 170,280 | 12.50% | 21,285 | 148,995 | 10,217 |
| Staten Island Community District 2 | 136,638 | 15.70% | 21,452 | 115,186 | 10,794 |
| Staten Island Community District 3 | 167,640 | 16.90% | 28,331 | 139,309 | 9,220 |
Acknowledgements
Comptroller Scott M. Stringer thanks Zachary Schechter-Steinberg, Deputy Policy Director and lead author of this report. He also recognizes the important contributions made by David Saltonstall, Assistant Comptroller for Policy; Susan Scheer, Associate Policy Director; Adam Forman, Associate Policy Director; Preston Niblack, Deputy Comptroller for Budget; Tammy Gamerman, Director of Budget Research; Selcuk Eren, Senior Economist; Jessica Silver, Director of Strategic Operations; Marvin Peguese, Deputy General Counsel, and Angela Chen, Senior Web Developer and Graphic Designer.
The Comptroller also acknowledges the work of: Kathryn Diaz, General Counsel; Jennifer Conovitz, Special Counsel to the First Deputy Comptroller; Devon Puglia, Communications Director, and Tyrone Stevens, Press Secretary.
Endnotes
[1] http://successfulaging.milkeninstitute.org/2014/best-cities-for-successful-aging-report-2014.pdf
[2] http://www.nyc.gov/html/dfta/downloads/pdf/publications/AIPGuide2016.pdf
[3] https://www.nado.org/wp-content/uploads/2014/09/Harvard-Housing-Americas-Older-Adults-2014.pdf
[4] https://www.huduser.gov/portal/periodicals/em/EM_Newsletter_fall_2013.pdf
[5] https://www.huduser.gov/portal/periodicals/em/fall13/highlight2.html
[6] https://www.huduser.gov/portal/periodicals/em/fall13/highlight2.html and http://www.cbsnews.com/news/social-isolation-loneliness-may-shorten-your-life/
[7] http://www1.nyc.gov/assets/doh/downloads/pdf/epi/epiresearch-lifeexpectancy.pdf
[8] https://www1.nyc.gov/assets/planning/download/pdf/data-maps/nyc-population/projections_report_2010_2040.pdf
[9] https://nycfuture.org/pdf/The-New-Face-of-New-Yorks-Seniors.pdf
[10] http://www.liveon-ny.org/action-alerts/2016/3/11/alert
[11] http://www1.nyc.gov/site/nycha/section-8/applicants.page
[12] Specifically, fifty-six NYCHA developments include at least one building that is exclusively occupied by seniors, of which 42 developments are exclusively for seniors: http://www.nyc.gov/html/dfta/downloads/pdf/publications/housing_guide_14.pdf. http://therealdeal.com/2015/06/25/thousands-of-nycha-units-lay-vacant-due-to-delayed-repairs/
[13] Comptroller’s Office Analysis of American Community Survey 2015.
[14] https://comptroller.nyc.gov/wp-content/uploads/documents/The-New-York-City-Nest-Egg_October_2016.pdf
[15] https://comptroller.nyc.gov/wp-content/uploads/documents/The-New-York-City-Nest-Egg_October_2016.pdf
[16] Comptroller’s Office Analysis of American Community Survey 2015.
[17] http://www.hungerfreeamerica.org/sites/default/files/atoms/files/Testimony%20by%20Joel%20 Berg%20to%20City%20Council%20General%20Welfare%20Oversight%20on%20Hunger%20Jan%2025,%202017.pdf and http://www1.nyc.gov/office-of-the-mayor/news/254-15/mayor-de-blasio-human-resources-administration-commissioner-steven-banks-foodhelp-nyc
[18] Comptroller’s Office Analysis of American Community Survey 2015.
[19] http://successfulaging.milkeninstitute.org/2014/best-cities-for-successful-aging-report-2014.pdf
[20] http://www.aarp.org/content/dam/aarp/research/surveys_statistics/general/2014/State-of-the-50-Plus-in-NYC-2014-AARP-res-gen.pdf
[21] https://www.huduser.gov/portal/periodicals/em/fall13/highlight2.html
[22] http://www1.nyc.gov/assets/planning/download/pdf/about/cpc/160049.pdf http://www1.nyc.gov/assets/planning/download/pdf/zoning/zoning-text/allarticles.pdf?r=102016
[23] http://www1.nyc.gov/office-of-the-mayor/news/075-17/state-the-city-mayor-de-blasio-rolls-out-new-affordable-housing-initiatives-seniors-
[24] http://www1.nyc.gov/site/finance/benefits/tenants-scrie.page
[25] http://www1.nyc.gov/assets/finance/downloads/pdf/brochures/scriedriebrochure.pdf
[26] http://www1.nyc.gov/site/finance/benefits/tenants-drie.page
[27] http://www.nyc.gov/html/mopd/downloads/pdf/scrie_drie_report.pdf
[28] http://www1.nyc.gov/assets/operations/downloads/pdf/mmr2016/2016_mmr.pdf
[29] http://www.nyc.gov/html/mopd/downloads/pdf/scrie_drie_report.pdf and http://www1.nyc.gov/assets/finance/downloads/pdf/reports/reports-tax-expenditure/ter_2016_final.pdf
[30] https://static1.squarespace.com/static/562a3197e4b0493d4ffd3105/t/573b1f43f699bb95a67 fea6b/1463492553384/Reducing+Rent+Burden+SCRIE+Report+Final+5.16.16.pdf
[31] https://www.tax.ny.gov/pit/file/information_for_seniors.htm
[32] Comptroller’s Office analysis: Comparing U.S. tax return filers with the primary taxpayer age 65 and older to the number of senior-headed households suggests about 70 percent of households with income below $50,000 file taxes.
[33] http://www.nyshcr.org/AboutUs/privacy.htm
[34] http://nyassembly.gov/leg/?default_fld=&leg_video=&bn=A02124&term=2015&Summary=Y& Actions= Y&Text=Y
[35] http://www1.nyc.gov/site/finance/benefits/landlords-sche.page
[36] https://www.tax.ny.gov/pit/property/exemption/seniorexempt.htm and http://www1.nyc.gov/site/finance/benefits/landlords-star.page
[37] §467 of New York State Real Property Tax Law
[38] https://www.nysenate.gov/legislation/bills/2015/a5416/amendment/a and https://www.nysenate.gov/legislation/bills/2015/s1074/amendment/a
[39] Estimate from the Office of the Comptroller. This estimate is based on utilization of the program remaining consistent with the current utilization level of about 30 percent.
[40] http://www.census.gov/newsroom/press-releases/2014/cb14-218.html
[41] https://www.nado.org/wp-content/uploads/2014/09/Harvard-Housing-Americas-Older-Adults-2014.pdf
[42] http://www.census.gov/prod/2012pubs/p70-131.pdf
[43] http://www.census.gov/housing/nychvs/
[44] Office of the Comptroller analysis of 2014 New York City Housing and Vacancy Survey Microdata.
[45] https://www.health.ny.gov/prevention/injury_prevention/docs/falls_in_older_adults_nys.pdf
[46] https://www.health.ny.gov/prevention/injury_prevention/docs/falls_in_older_adults_nys.pdf and https://www1.nyc.gov/assets/doh/downloads/pdf/epi/databrief14.pdf
[47] https://www.huduser.gov/portal/periodicals/em/EM_Newsletter_fall_2013.pdf
[48] http://www.nextavenue.org/is-it-time-for-tax-credits-to-help-people-age-in-place/
[49] http://www.aarp.org/content/dam/aarp/states/dc/LCE/2016/dc-safe-at-home.pdf
[50] https://www.cityofchicago.org/city/en/depts/dcd/provdrs/afford_hous/svcs/make_your_home_ wheelchairaccessible.html and https://www.cityofchicago.org/content/dam/city/depts/obm/supp_info/2017%20Budget/DepartmentResponses/DPD_Responses.pdf
[51] http://www.aarp.org/content/dam/aarp/livable-communities/plan/planning/aging-in-place-a-toolkit-for-local-governments-aarp.pdf http://www.atlantaga.gov/modules/showdocument.aspx?documentid=2190
[52] http://www1.nyc.gov/assets/omb/downloads/pdf/ss6-16.pdf
[53] http://www.nyshcr.org/Funding/Awards/2016-OCR-HOUSING-RESOURCES-NOFA.pdf
[54] http://www.nyshcr.org/Funding/Awards/2016-OCR-HOUSING-RESOURCES-NOFA.pdf
[55] https://www.genworth.com/about-us/industry-expertise/cost-of-care.html
[56] http://www1.nyc.gov/site/cchr/law/in-housing.page
[57] http://cdn.bipartisanpolicy.org/wp-content/uploads/2016/05/BPC-Healthy-Aging.pdf
[58] New York City’s population of adults over 65 is 15 times larger than that of Washington D.C. A caveat to this analysis is that the condition of housing in Washington D.C. may not be similar to that of New York City’s housing stock.
[59] http://livabilityindex.aarp.org/livability-defined
[60] http://www.agefriendlyneighborhoods.nyc/
[61] http://www.agefriendlyneighborhoods.nyc/age-friendly-neighborhoods-neighborhood-action-plans/
[62] http://www1.nyc.gov/assets/operations/downloads/pdf/mmr2016/2016_mmr.pdf
[63] http://www1.nyc.gov/assets/operations/downloads/pdf/mmr2016/2016_mmr.pdf
[64] https://www1.nyc.gov/site/nycha/residents/senior-centers.page
[65] http://www.nyc.gov/html/dfta/html/community/innovative_senior_centers.shtml
[66]The City ended its Central Insurance program in FY2013, which provided liability insurance,
workers’ compensation, and disability benefits to contracted service providers. Its elimination had
the effect of increasing the cost of senior center contracts. In FY2012, DFTA spent $24 million on the program. http://legistar.council.nyc.gov/LegislationDetail.aspx?ID=2824317&GUID=1C13396A-E49C-4A8C-8627-51CFE6B27995&Options=&Search=
[67] Comptroller’s Office analysis of Financial Management System, as of November 2016 and http://www1.nyc.gov/assets/omb/downloads/pdf/de1-17.pdf
[68] http://www.nyc.gov/html/dfta/downloads/pdf/publications/SeniorCenterStudy2016.pdf
[69] http://www.nyc.gov/html/dfta/downloads/pdf/publications/SeniorCenterStudy2016.pdf
[70] Location of senior centers from NYC Open Data Portal
[71] http://www.ncbi.nlm.nih.gov/pmc/articles/PMC4242850/
[72] https://nycfuture.org/pdf/The-New-Face-of-New-Yorks-Seniors.pdf
[73] http://legistar.council.nyc.gov/MeetingDetail.aspx?ID=533036&GUID=3DB4A8E4-8410-420E-BF08-AAB458515FEB&Options=info&Search=
[74] http://www.nyc.gov/html/dot/downloads/pdf/safestreetsforseniors.pdf
[75] http://www.aarp.org/content/dam/aarp/research/surveys_statistics/general/2014/State-of-the-50-Plus-in-NYC-2014-AARP-res-gen.pdf
[76] http://www.nyc.gov/html/dot/downloads/pdf/safestreetsforseniors.pdf
[77] http://www.nyc.gov/html/dot/html/pedestrians/safeseniors.shtml
[80] http://www.nyc.gov/html/dot/html/pedestrians/safeseniors.shtml
[81] http://t4america.org/maps-tools/seniorsmobilitycrisis2011/
[82] http://www.nyc.gov/html/onenyc/downloads/pdf/publications/OneNYC.pdf
[83] http://wagner.nyu.edu/rudincenter/wp-content/uploads/2016/12/OlderNYersandAccess-A-Ride.pdf
[84] http://wagner.nyu.edu/rudincenter/wp-content/uploads/2016/12/OlderNYersandAccess-A-Ride.pdf
[85] http://www.cbcny.org/sites/default/files/REPORT_ACCESS-A-RIDE_09202016.pdf
[86] http://comptroller.nyc.gov/wp-content/uploads/documents/FK15_098A.pdf
[87] http://www.nycdotplan.nyc/PDF/Strategic-plan-2016.pdf
[88] http://blog.tstc.org/2014/04/11/nyc-bus-riders-tend-to-be-older-and-poorer-than-subway-riders/
[89] http://www.mta.info/sites/default/files/northeast_queens_bus_study_-_final_9-28-15.pdf
[90] http://www.nyc.gov/html/dot/downloads/pdf/2013-dot-sustainable-streets-4-worldclassstreets.pdf
[91] http://www.nyc.gov/html/dot/html/pedestrians/citybench.shtml
[92] Location of City Benches based on http://a841-dotweb01.nyc.gov/citybench_map/
[93] http://www.brooklyndaily.com/stories/2017/6/bn-sheepshead-bay-station-elevator-2017-02-03-bk.html
[94] http://wagner.nyu.edu/rudincenter/wp-content/uploads/2016/12/OlderNYersandAccess-A-Ride.pdf The analysis in this report includes the three new accessible stations on the Q line that opened since publication of the Rudin Center report in December 2016.
[95] http://web.mta.info/capital/pdf/MTA_15-19_Capital_Plan_Board_WEB_Approved_v2.pdf
[96] https://www.transit.dot.gov/regulations-and-guidance/civil-rights-ada/part-37-transportation-services-individuals-disabilities#sec.37.53
[97] http://web.mta.info/capital/pdf/MTA_15-19_Capital_Plan_Board_WEB_Approved_v2.pdf
[98] According to the 2016 Mayor’s Management Report, DFTA served 12,102 meals in FY16 (up from 11,671 in FY15), daily attendance at senior centers was 29,682 in FY16 (up from 27,812 in FY15), 11,342 persons received information/supportive services through DFTA caregiver
programs in FY16 (up from 11,033 in FY15), 3,826 seniors received home care services (up from 2,928 in FY15), and 32,773 seniors received case management services (up from 28,898 in FY15).
[99] Comptroller’s Office projected FY17 spending based on the November modification. Funding in the Adopted FY17 budget totaled $83,879,635,413.
[100] http://www1.nyc.gov/assets/omb/downloads/pdf/jan17-bfa.pdf and http://www1.nyc.gov/assets/omb/downloads/pdf/adopt12_bfa.pdf
[101] Analysis is based on actual spending for FY2010 through FY2016. Projected FY2017 as of January 2017. http://www1.nyc.gov/assets/omb/downloads/pdf/jan17-bfa.pdf
[102] http://legistar.council.nyc.gov/LegislationDetail.aspx?ID=2955228&GUID=2369E37D-D1CF-4B93-B47C-D06C40792A52&Options=&Search=
[103] http://council.nyc.gov/html/budget/2017/ex/dfta.pdf http://council.nyc.gov/html/budget/2016/Pre/dfta.pdf
[104] http://legistar.council.nyc.gov/LegislationDetail.aspx?ID=2955228&GUID=2369E37D-D1CF-4B93-B47C-D06C40792A52&Options=&Search=
[105] http://www.help.senate.gov/imo/media/doc/Vladeck.pdf
[106] https://www.law.cornell.edu/uscode/text/42/3032k New York Elder Law § 209 http://www.nyc.gov/html/dfta/downloads/pdf/norc_concept_paper.pdf
[107] https://www.uhfnyc.org/initiatives/aging-in-place/frequently_asked_questions/
[108] http://www.help.senate.gov/imo/media/doc/Vladeck.pdf
[109] Testimony of Anita Altman before the New York City Council on February 26, 2016 accessible at: http://legistar.council.nyc.gov/LegislationDetail.aspx?ID=2570475&GUID=4CCCD2A0-E653-4669-82F1-5A82B73BD7F8&Options=&Search=
[110] http://heapro.oxfordjournals.org/content/25/2/210.long
[111] https://fedwebassets.s3.amazonaws.com/fed74/2/Exploring%2520the%2520Impact%2520of% 2 520NORCSSPs%2520on%2520Participants%2520%2520Annual%2520Report%25202009.pdf
[112] http://council.nyc.gov/budget/wp-content/uploads/sites/54/2016/05/FY17-Schedule-C.pdf and http://council.nyc.gov/budget/wp-content/uploads/sites/54/2016/05/125-DFTA.pdf
[113] http://council.nyc.gov/html/budget/2017/skedc.pdf
[114] Testimony of Caryn Resnick, Deputy Commissioner External Affairs at the Department for the Aging, before the New York City Council on February 26, 2016 accessible at: http://legistar.council.nyc.gov/LegislationDetail.aspx?ID=2570475&GUID=4CCCD2A0-E653-4669-82F1-5A82B73BD7F8&Options=&Search=
[115] http://www.agingandcommunity.com/wp-content/uploads/2012/12/NY-NORC-FINAL.pdf
[116] http://council.nyc.gov/html/budget/2017/ex/dfta.pdf
[117] http://www1.nyc.gov/assets/operations/downloads/pdf/pmmr2017/dfta.pdf
[118] http://www1.nyc.gov/assets/omb/downloads/pdf/ss6-16.pdf http://council.nyc.gov/html/budget/2017/ex/dfta.pdf
[119] http://council.nyc.gov/html/budget/2017/ex/dfta.pdf
[120] https://www.govtrack.us/congress/bills/114/s879/text
[121] https://www.govtrack.us/congress/bills/114/s879/text
[122] http://comptroller.nyc.gov/reports/families-and-flexibility-building-the-21st-century-workplace/ and http://legistar.council.nyc.gov/LegislationDetail.aspx?ID=2900941&GUID=68DC01AE-C577-4B86-B3E5-B9D98836C1E2&Options=&Search
[123] Comptroller’s Office calculation based on the Mayor’s Management Report
[124] Testimony of DFTA Commissioner Donna M. Corrado to the City Council Committee on Aging, March 13, 2017.
[125] Testimony of DFTA Commissioner Donna M. Corrado to the City Council Committee on Aging, March 13, 2017 and http://council.nyc.gov/html/budget/2017/ex/dfta.pdf and https://static1.squarespace.com/static/562a3197e4b0493d4ffd3105/t/5820b68946c3c40f06268928/1478538890489/Home+Care+Waitlists+Report+November+7+2016.pdf
[126] https://www.surgeongeneral.gov/priorities/prevention/about/healthy-aging-in-action-final.pdf
[127] https://www.medicarerights.org/pdf/2012-aca-fact-sheet.pdf
[128] https://www.medicare.gov/coverage/preventive-visit-and-yearly-wellness-exams.html
[129] https://www.medicareinteractive.org/get-answers/medicare-covered-services/preventive-care-services/medicare-coverage-of-yearly-screenings-for-depression
[130] http://kff.org/health-reform/issue-brief/what-are-the-implications-of-repealing-the-affordable-care-act-for-medicare-spending-and-beneficiaries/
[131] https://downloads.cms.gov/files/Beneficiaries%20Utilizing%20Free%20Preventive%20Service s%20by%20State%20YTD%202015.pdf
[132] http://www.alz.org/publichealth/downloads/policy-brief.pdf
[133] http://www1.nyc.gov/office-of-the-mayor/news/934-16/first-lady-chirlane-mccray-launches-mental-health-programs-seniors-nyc-department-the
[134] https://comptroller.nyc.gov/reports/the-new-york-city-nest-egg-a-plan-for-addressing-retirement-security-in-new-york-city/
[135] https://www.ssa.gov/news/cola/
[136] http://www.ncpssm.org/PressRoom/NewsReleases/Release/ArticleID/1159/The-CPI-E-%E2%80%93-A-Better-Option-for-Calculating-Social-Security-COLAs
[137] https://www.irs.gov/retirement-plans/plan-participant-employee/retirement-savings
[138] https://www.transamericacenter.org/docs/default-source/resources/center-research/16th-annual/tcrs2015_sr_16th_compendium_of_workers.pdf
[139] http://www1.nyc.gov/office-of-the-mayor/news/242-15/city-s-expanded-tax-credit-campaign-pays-off-big-new-yorkers
[140] https://www.congress.gov/bill/114th-congress/senate-bill/2492