Audit Report of the Department of Design and Construction’s Mitigation of Delays and Cost Overruns on Capital Construction Projects
Audit Impact
Summary of Findings
The audit found that while ensuring capital projects are delivered on time and within budget is inherently complex, DDC’s project oversight and public reporting of outcomes need improvement.
Although DDC has established policies and procedures that are intended to ensure adequate project oversight and risk management, the agency did not ensure that these were consistently followed, leading to delays and cost overruns.
Overall, 80% of DDC-managed projects that reached or were projected to reach Substantial Completion after FY2018 were behind the originally scheduled completion date. An analysis of large-scale construction projects found that DOT, DEP, and DSNY were among the agencies with the highest average number of days delayed.[1] Detailed analyses of sampled contracts that were completed well after the scheduled dates found that a significant portion of the delays related to inadequate monitoring of the planning and design phases. Despite this, the audit found that funds set aside for agencies to improve planning have been underutilized.
Auditors also reviewed a sample of 18 large-scale projects and found that the construction costs went from $4.14 billion at construction start to $4.51 billion as of August 2025, an increase of approximately $370 million. If the results for the sampled projects were extrapolated across the universe of large-scale projects, the total cost to the City for these projects would be $10.4 billion to date, an increase of approximately $870 million or 9.1%.
Auditors note that many of these projects analyzed for time and cost delivery are still ongoing; once all are completed, the full extent of time and cost overruns may well be greater.
In the interest of transparency and to support planning, DDC should also re-evaluate the way it tracks and reports delays and cost overruns. DDC does not track all delays from the beginning—it rebases the starting point for counting days to completion as projects progress, continually replacing the completion date before reporting outcomes. The reported figures are therefore distorted and total changes in time are obscured.
The audit also found that DDC does not have a system capable of tracking real-time project costs from initiation to completion, or for forecasting future costs across its project portfolio. DDC cannot readily determine the actual percentage of projects experiencing cost overruns and is unable to effectively monitor or report variances from original cost to completion cost on individual projects or an aggregate level. This deficiency resulted in a suspension of reporting project cost against original budget in the Mayor’s Management Report (MMR) from 2021 to 2024.
The audit also found that the City is underutilizing a program intended to assist in upfront planning on complex projects and found issues with the capital project dashboard established for the stated purpose of providing transparency into the City’s capital spending.
Intended Benefits
The audit identified the need for better mitigation of time and cost overruns in City construction projects and for DDC to demonstrate improved oversight of capital projects. It also identified the need for DDC to provide more complete and transparent information to the City and stakeholders.
Introduction
Background
DDC began operations in 1996 to centralize the construction of the City’s capital projects and improve project management efficiency.[2] In partnership with over 20 City agencies, DDC manages the design and construction of civic facilities. DDC is also responsible for maintaining and improving the City’s street infrastructure system by upgrading and constructing storm and sanitary sewers, water mains, roadways, sidewalks, and plazas. By leveraging best practices in project management, risk mitigation, and technological advancements, DDC aims to deliver projects on time and within budget.
DDC’s Public Buildings and Infrastructure Divisions manage various construction projects throughout the City and are managed by Deputy Commissioners. The Public Buildings Division (Public Buildings) manages architectural projects from beginning to end for more than 20 City agencies, the three library systems, and certain cultural institutions. Public Buildings manages the design and build of new construction and the rehabilitation and renovation of older City buildings. DDC’s Infrastructure Division (Infrastructure) builds and upgrades the City’s network of streets, sidewalks, water mains, and storm and sanitary sewers. In addition, Infrastructure also builds and rehabilitates step streets, retaining walls, community plazas, and pedestrian bridges.[3] DOT and DEP provide the planning for these projects, while the City’s Office of Management and Budget (OMB) provides the funding.
Agencies generally define the programmatic needs of their respective projects. DDC provides technical expertise, procurement, and design and construction management to bring projects to completion. Through close coordination, DDC aims to ensure that projects align with each agency’s infrastructure and public service goals.
DDC’s Process Overview
The lifespan of a project encompasses several phases. For the purposes of this report, these are segregated into the following five phases: (1) project planning and initiation (sponsor agency establishes need, seeks OMB funding and refers projects to DDC);[4] (2) design (consisting of pre-design, design, and post-design); (3) procurement; (4) construction; and (5) closeout. For Public Buildings projects, the preparation of a Capital Project Scope Development (CPSD) package, which details the extent of work and estimates the amount of personnel, equipment, and space necessary and the cost associated with the project, occurs during the project planning and initiation phase.[5] For Infrastructure projects, that phase begins with the sponsor agency working with the Front-End Planning (FEP) group to prepare a feasibility study to ensure that the necessary scope and funding are in place before DDC accepts the project. For both Public Buildings and Infrastructure projects, this phase also includes the submission of an Electronic Project Initiation (ePI) form or Capital Project Initiation (CPI) form from the sponsor agency (i.e., the agency requesting the work) that outlines the planned project scope, schedule, and cost. During this phase, a design consultant (DC) is selected through a competitive Request for Proposal (RFP) process. For Infrastructure projects, the DC meets with the DDC project design team and conducts a constructability review that includes a meeting at the site to review logistics. It is during the constructability review that the schedule and estimate are finalized through an alignment meeting between the DC and project design team. For both Public Building and Infrastructure projects, a schedule for the design process with milestones is created with an anticipated design completion date.[6] Construction documents (e.g., Technical Specifications, drawings, NYC Standard Construction contract) are also prepared. Once these documents and the design process are complete, the project is ready to go out to bid (procurement phase).
There are three project delivery methods used by DDC: Design-Bid-Build (generally required by the City), Construction Manager (CM)-Build, and Design-Build. According to DDC officials, in a standard Design-Bid-Build project (the project delivery method most commonly utilized by the City), the procurement phase typically lasts about a year, with the project awarded to the lowest responsible and responsive bidder. [7] The selected bid determines the construction budget, while the design consultant’s schedule establishes the project duration. The construction contractor must prepare a baseline construction schedule aligned with the specified end date.
Once the project is bid, DDC and the sponsor agency prepare a Certificate to Proceed (CP) for submission to OMB for approval. The CP sets forth the terms and conditions under which the capital project shall proceed and identifies the initial funding obligation for financing the capital project. The accepted bid amount becomes the construction budget for the project. A contingency of 10% of the construction cost is included in the CP. Any amendments to the CP to increase the project budget must be approved by OMB. Once a project is approved, the contract is registered with the Comptroller’s Office and a Notice to Proceed (NTP) is issued to the contractor. The NTP includes the contract price and project duration.
Project budgets and schedules are managed on the project level by DDC project managers at the job sites and monitoring is done in real time. Projects are actively monitored by DDC upper management as well. A Deputy Director is on each job site biweekly, an Assistant Commissioner is on each jobsite monthly, and the Commissioner meets with project management teams semiannually. This can vary depending on the size and complexity of the project.
For Infrastructure-managed projects, DOT and DEP issue blanket CPs ($8 million for DOT projects and $19 million for DEP projects) so that smaller projects will not have to apply for a CP amendment if the projects exceed the budget contingency established during the design process and constructability review.
Once a project is approved, it enters the construction phase. Projects follow one of four project delivery tracks according to the type of work and level of complexity. The project track is identified in DDC’s Front-End Planning (FEP) Report and Project Objectives (PO).
- Track 1 includes new construction, major renovations, and additions.
- Track 2 includes complex building system upgrades involving more than one system, such as building envelope or HVAC system reconstruction/rehabilitation.
- Track 3 includes simple building system upgrade projects.
- Track 4 includes projects with very limited scope.
The construction phase ends at Substantial Completion. By this stage, the work is substantially complete and a final punch list (a list of items to be completed with completion dates) is approved. Substantial Completion marks the end of the Construction Phase and the beginning of the closeout phase. The closeout phase involves fulfillment of all terms of the construction contract and final turnover to the sponsor agency. In this phase the contractor completes the punch list, closes out its permits, obtains all regulatory approvals, and DDC processes final payments. The final step in closing out a project is issuing the final payment to the contractor.
Once planning on a project is completed, DDC manages the project’s design and construction phases. This audit concerns DDC’s processes from project start[8] to Substantial Completion.
Systems Usage Overview
DDC project managers utilize a web-based project management tool, Benchmark, to store and access essential project information, including project scope and location, client agency and contractor details, information on internal team members and consultants, budgets, high-level delay logs, and status and daily reports.[9]
Additionally, project schedules are prepared and updated using the following:
- Primavera P6, an integrated project portfolio management application that includes interactive Gantt Charts[10]
- Procure, a cloud-based project management system in which Construction Managers store monthly Critical Path Method (CPM) updates.[11]
- Dat, an in-house DDC system that tracks contract registrations. DDC uses Certificate to Proceed (CP) Tracker, an in-house system, to manage CP requests along with all necessary supporting documentation.
Recent Initiatives to Improve the Capital Project Delivery Process
As stated in its 2024 Strategic Blueprint Progress Update, DDC recognized that “early planning is key to delivering projects successfully, and that many projects were initiated without the funding, scope, legal authorizations, and other elements needed to complete the work.” Since many changes that result in delay and cost overruns are the result of incomplete planning in the early stages of the project, DDC has indicated that it is focused on improving early planning and coordination with the sponsor agencies. The introduction of the Front-End Planning (FEP) unit during 2016 and 2017 (according to DDC this was fully implemented in 2019) was intended to improve the success of projects by ensuring that projects are well-defined and that necessary resources are in place before they start.
In April 2022, the City formed a Capital Process Reform Task Force that brought together diverse stakeholders from government and the building and design industry for the purpose of conducting a comprehensive review of the City’s capital process, aimed at developing recommendations for reforming capital project delivery. The Task Force aimed to improve the project pipeline, reform procurement, make participation in capital projects easier, and manage projects more effectively and transparently.
The Task Force delivered 39 recommendations (divided into a nine-point State legislative agenda and 30 internal reforms) in a report released in January 2023.[12]
Due to its recent introduction—and the time involved in designing, procuring, and completing capital projects—this audit was not able to assess the impact of reforms recommended by the Capital Process Reform Task Force.
Objective
The objective of this audit was to evaluate DDC’s construction management practices and their effectiveness in mitigating time and cost overruns.
The scope of this audit included an evaluation of capital projects with Substantial Completion dates after FY2018.[13] The audit included an analysis of DDC’s Project List from November 2022 to August 2025.
Discussion of Audit Results with DDC
The matters covered in this report were discussed with DDC officials during and at the conclusion of this audit. An Exit Conference Summary was sent to DDC on October 9, 2025, and discussed with DDC officials at an Exit Conference held on October 23, 2025. On December 8, 2025, we submitted a Draft Report to DDC with a request for written comments. We received a written response from DDC on December 19, 2025. In its response, DDC agreed with nine recommendations and disagreed with one recommendation. The Mayor’s Office did not respond to the recommendation made.
DDC’s written response has been fully considered and, where relevant, changes and comments have been added to the report.
The full text of DDC’s response is included as an addendum to this report.
Detailed Findings
The audit found that although DDC has established policies and procedures to support project oversight and risk management, they were not adequately enforced to effectively mitigate time or cost overruns.
The audit found that DDC lacks a mechanism to ensure that its procedures are consistently followed. The audit’s analysis of sampled projects found that certain procedures were not satisfactorily carried out, leading to delays. The audit recognizes that certain factors contributing to delays are outside DDC’s direct control, such as scope changes made by sponsor agencies or additional work due to utility companies providing incorrect information about the location of their assets. However, by mitigating delays that are within DDC’s control, total delays could be minimized.
Overall, the audit found that 80% of DDC-managed projects that reached or were projected to reach Substantial Completion after FY2018 were behind schedule, according to the target date established at project initiation. As of April 2025, the average amount of time that projects were behind schedule was 3.5 years, with at least half of them behind schedule by 2.5 years or more.
The audit also found that DDC management does not adequately track costs either on a project or agency basis. This is due in part to the lack of a module in Benchmark that would support accurate cost tracking, but this is also due to DDC’s practice of continually rebasing the cost estimate as each project proceeds. As a result, DDC does not readily know the full extent of the cost differential of any project without consulting with the project manager, from construction start to completion. Auditors used Certificates to Proceed (CPs) to determine the cost differentials. The CP, which is granted when OMB approves capital funding for a project, is also based on cost estimates that exclude DDC’s direct costs (which come from the agency’s expense budget). Auditors’ analysis of sampled projects (including those not yet completed) shows that these excluded costs range from 3% to 9% of project costs incurred as of August 5, 2025.
To estimate the degree of cost overruns, auditors conducted a review of 18 large-scale projects (budget of $100 million or more) in the construction phase as of August 2025. However, due to DDC’s failure to track the initial cost of projects, the analysis was limited to construction costs only and did not include DDC’s overhead costs on the project. The overall increase for the 18 projects went from $4.14 billion to $4.51 billion, an overall net increase of 9.1%.[14] Overall, 12 of the 18 projects experienced cost increases—four increased by more than 20% and two increased by more than 300% each. There were 49 large-scale projects in the universe from which the sample of 18 was drawn. The total reported budget for these 49 projects was $9.56 billion in April 2025. If the results for the sampled projects were extrapolated across this universe, the total cost to the City for these projects would be $10.4 billion to date, an increase of approximately $870 million, or 9.1%.
Auditors note that many of the projects assessed during this audit are not yet completed. Total cost and budget delays will not be known until projects are completed. Figures provided in this audit are based on status as of the date of each review; the full extent of time and cost overruns upon completion could well be greater.
An analysis of DDC construction projects ongoing in August 2025 with total costs of $750 million or more found that DOT, DEP, and DSNY were among the agencies with the highest number of average days delayed. Auditors conducted a detailed analysis of one significantly delayed project from each of the three agencies and identified deficiencies across sampled projects which collectively resulted in significant time and cost overruns. The auditors found that a significant portion of the delays related to inadequate monitoring of the planning and design phases, resulting in delays due to incomplete design plans; poor coordination among stakeholders (e.g., utilities, sponsor agencies) resulting in dependence on outdated utility information and insufficient pre-construction utility investigations; and inaccurate cost and quality estimates.
The audit also notes that the City is underutilizing a program intended to assist in upfront planning on complex projects, and the City’s capital project dashboard, which is intended to provide information on the City’s capital spending, is not accurate.
DDC’s Overall Oversight of Projects Needs Improvement
While many of the challenges DDC faces stem from inherent complexities in managing projects in New York City, DDC does not adequately mitigate schedule delays and does not adequately track or mitigate cost increase from CP to completion. DDC does not attempt to track cost changes from CP to completion as it should.
DDC Lacks Mechanisms to Ensure Its Procedures Are Consistently Followed
Significant factors that result in project delays often occur during the early stages of projects. Such factors include incomplete planning, misaligned scopes, and unrealistic budgets.
As part of project planning, the design phase includes input from the sponsor agency to identify the complete scope of work. Sponsor agency input may be incomplete and constructability reviews (conducted to confirm that the project can proceed as planned) may be deficient.[15] These potentially result in changes during construction that result in cost increases and/or delays. CPSD packages and FEP are vital to minimizing these types of issues.
As described in its Design Consultant Guide, DDC is responsible for helping sponsor agencies define their needs at the beginning stages of project planning and design. DDC procedures also call for preparation of a scope of work acceptable to all stakeholders to be performed during the design to minimize issues that lead to delays and increases in costs. DDC is responsible for planning once design is agreed to.
However, DDC has not identified the mechanisms it employs to ensure that these procedures are consistently followed, or performed satisfactorily, on the projects it manages. The auditors’ analysis of several sampled projects revealed that necessary procedures were not satisfactorily carried out, resulting in further delays on the projects. For example, a construction contract was put out to bid with incomplete architectural drawings. This led to the need for change orders almost immediately after the contract was awarded in order to rectify errors, causing delays and cost increases. In another case, no section U drawings detailing the location of underground infrastructure were prepared by utilities, and no test pit investigations or scans were conducted during design.[16] Both caused avoidable delays and increased costs. Other sampled projects were affected by inaccurate information about existing utilities buried beneath the street. A brief overview of other factors contributing to project delays follows.
Sponsor Agency Delays
A sponsor agency may change project scope after the design has begun or during construction or may end the planning stage prematurely. The design of the DSNY project sampled by the auditors, for example, was accelerated at DSNY’s request and may have been released for bid too early, as evidenced by incomplete MEP drawings and a substandard BIM Model.[17] [18] This resulted in a cascade of change orders and the need for the contractor to upgrade the BIM model.
DDC accepted the project without ensuring complete MEP drawings and an acceptable BIM model were in place. This was done at DSNY’s request and ultimately caused significant delays and cost overruns.
Misidentified Location of Existing Utilities
According to DDC, the agency has no control over private utility companies and must rely on these companies to perform their own assessments and advise DDC where its underground assets are located.
Officials stated that utility relocation is a common source of delays and cost overruns on capital projects. Under their franchise agreements with the City, utilities bear the cost of relocating and protecting their utility lines whenever those lines interfere with City construction work. Historically, the City’s contractors negotiated the cost of this utility interference work directly with the utility companies, as that work was outside the scope of their City contracts. City capital projects stalled while these private negotiations took place.
Public utility companies do not always know where their underground assets are located, and there are instances of abandoned assets that can only be discovered once the ground is excavated. Test pits are the primary mitigation measure for discovering what is below ground, but they do not always capture everything. Even when test pits have been performed, there are instances where excavations uncover utilities that were missed by test pits.
Additionally, there may be other delays that arise from sources outside of DDC. For instance, there may be funding issues relating to a project. A review conducted by the NYS Comptroller that looked at capital project delivery in the City and included an examination of why projects were delayed, found that agencies cited (1) budgetary constraints, (2) changes in scope and design, and (3) unforeseen site and field conditions as the explanation for over 70% of project delays.[19]
Projects can spend months in limbo while determinations are made on scope changes, design elements, and capital eligibility. While these issues may be beyond DDC’s direct control, DDC’s effectiveness in mitigating delays that are within the agency’s power to mitigate would help to improve the timeliness of projects.
These include ensuring that all MEP drawings are complete, BIM models meet established standards, that current utility maps are reviewed and test pits are dug when there is a need to identify the location of utilities, and including all possible estimated costs included in the CP package upfront, when it is submitted to OMB. DDC is ultimately responsible for ensuring that planning is as good as it can be, and that potential issues are identified and all known costs estimated as early in the process as possible.
DDC Lacks an Integrated Cost Tracking System and Does Not Identify Actual Cost Overruns From Project Initiation
DDC is responsible for delivering capital projects in accordance with citywide performance standards, including the requirement specified in the MMR to complete projects on time and within budget. This obligation requires the agency to track project expenditures accurately, forecast potential overruns, and align actual costs with approved budgets throughout the construction lifecycle.
However, the audit found that DDC does not have a system capable of tracking real-time project costs from initiation to completion, or for forecasting future costs across its project portfolio. Benchmark does not maintain the initial approved project cost or later cost estimates. DDC replaces the first cost estimate in Benchmark with updated cost estimates as each project proceeds, effectively rebasing the completion target along the way. As a result, Benchmark cannot be used to assess total cost from construction start to completion—it only tracks costs incurred from the most recently entered estimate.
The auditors found that DDC does not compensate for this gap in system functionality by manually tracking data needed to report its core metric “construction contracts completed within budget,” which is supposed to report the percentage of projects that are completed within construction budget with 10% contingency.
As a result of these issues, DDC cannot readily determine the actual percentage of projects experiencing cost overruns and is unable to effectively monitor or report variances from original cost to completion cost on individual projects or an aggregate level. While individual project managers maintain spreadsheets to monitor funding status and budget staff track expenditures in detail for certain projects, these efforts are fragmented and not coordinated through a centralized platform, and they are not manually tracked in the aggregate. This would currently require an in-depth review of every project file to locate information that is not readily captured.
The agency acknowledged this limitation and clarified that its project management system, Benchmark supports schedule tracking but does not include a cost-tracking module. According to DDC, the Project Controls Division (PCD) provides data analytics to support delivering projects on time and within budget. DDC stated that it plans to implement the cost module but is uncertain when this will occur. DDC cited a lack of funding as the reason for the delay.
Additionally, DDC pointed out that the complex nature of its contract structures contributes to the challenge, as a single contract may cover multiple projects, a project may use multiple contracts, and contractors often receive lump-sum payments for multiple projects that are not easily attributable to specific projects. This makes it difficult to allocate actual expenditures at the project level, particularly when multiple contracts overlap within a single capital project.
DDC Project Controls has also stated that it cannot identify cost overruns until late in the construction process.[20] This hinders the agency’s ability to proactively manage financial risks or accurately forecast total expenditures relative to approved funding.
Implementing a cost performance module would help DDC manage cost overruns and associated financial risks. Maintaining the original cost estimate and tracking against the original as well as later estimates, through to total upon completion, is also necessary. While Benchmark is being modified, DDC should collect the information needed to project total expenditures and to track variances from CP through to completion from individual project managers and compile the information manually. DDC should also attempt to categorize reasons for cost increases as estimates are altered.
Timeliness of Projects
As the City’s lead capital construction agency, DDC is expected to manage and deliver infrastructure projects efficiently and effectively, in alignment with internal guidance and citywide performance indicators established in the MMR. While DDC has established governance structures and maintains policies and procedures to support project oversight, stakeholder communication, and risk management, the analysis conducted by the auditors reveals significant problems with project scheduling and management.
80% of DDC-Managed Projects Behind Original Schedule by an Average of 3.5 Years
An assessment of data for 1,092 DDC-managed projects that reached or were projected to reach Substantial Completion after FY2018 reveals that, as of April 16, 2025, 877 projects (80%) were behind the original schedule at project initiation with an average delay of 1,265 days (3.5 years) since project initiation;[21] at least half of these projects were behind schedule by 913 days (2.5 years) or longer.[22]
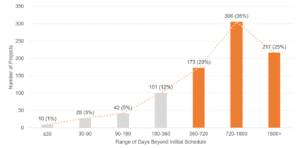
As shown below in Chart 1, 696 (79%) of the 877 projects were behind the originally scheduled completion date by more than 360 days. Further, 217 (25%) were later than originally anticipated by more than 1,800 days. Of these, 35 (16%) were late by more than 10 years and were still active as of April 2025, and four were late by as long as 15 years and were also still active.
Chart 1: Overall Distribution of Completions as Initially Scheduled for 877 Projects as of April 2025[23]
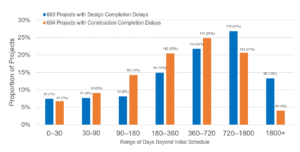
The audit team reviewed late completions to identify their distribution by phase and found that late completions during the design phase tend to become more severe in long-duration cases, while late completions during the construction phase are more frequent in mid-range durations.[24] [25] (For the purposes of this audit, late completions were calculated as the difference between the completion date anticipated at a project’s initiation and the actual completion date, minus the delays in project start.) Generally, these late phase completions indicate a need for stronger early-phase project planning (evidenced in some cases by inadequate design) and readiness, as well as a need for better coordination and communication with external stakeholders (e.g., utilities, other government agencies).
Late Completions in the Design Phase
Chart 2 (below) highlights both the breadth and severity of the issue. While a small portion of the 663 projects (49, or 7%) for which the design phase ended late faced relatively minor delays of less than 30 days, 410 (62%) experienced late completions of over 360 days, including 88 projects (13%) for which the design phase was completed over 1800 days late (almost five years), suggesting issues with project planning, coordination, and/or scoping. Eight of these projects were delayed between 10 and 14 years. Over 60% of impacted projects had late completions of more than 360 days, suggesting that design-related delays are not only common but frequently severe.
Late completions of the design phase can severely impact overall project delivery schedules and cost performance. The occurrence of such late completions warrants further examination of potential root causes including initial coordination with client agencies, multi-agency review process, late agency feedback, design consultant performance, inefficiencies in the design review and approval process, and/or scope changes.
Late Completions in the Construction Phase
Chart 2 also highlights that of the 694 projects that experienced late completions of the construction phase, 343 (approximately 50%) projects experienced late completions of more than 360 days, including 28 projects (4%) that were completed over 1,800 days late. Late completions of the construction phase may be a result of poor planning and design and conditions discovered during the construction project that were not detailed in construction documents (e.g., construction drawing, technical specifications, general conditions, NYC Standard Construction Contract). These may require changes in the scope of the project and/or the approval of change orders. These changes may not only result in construction being completed later than anticipated, but they potentially increase project costs. Three projects each completed construction over eight years later than originally budgeted. These delays suggest issues with permits and unanticipated site conditions requiring redesign and/or additional work.
Chart 2: Distribution of Completions as Initially Scheduled during Design and Construction Phases
Project Delays Not Accurately Tracked or Reported in the MMR
DDC officials stated that scheduled baselines—which are the schedules reflecting all activities during the project against which all future updates are compared—are updated at the end of each phase (e.g., design, construction), reflecting the changing circumstances of projects. DDC does not track timeliness of project completion against scheduled completion dates that were established when projects were initially approved (the initial baselines). This means the agency does not track the actual days delayed from start to finish. Such information is essential for DDC to identify trends that may exist among certain types or common factors causing delayed completion of projects, and to develop strategies for mitigating delays going forward.
Although DDC reports various KPIs related to completion times (including FEP completed, designs completed, construction completed, roadway lanes constructed, and completed construction early/on time) and generally considers a project completed within 30 days of the scheduled completion date “on time,” DDC unilaterally excludes all delays it considers outside of its control.[26] As a result, the MMR does not provide a complete picture of the delays that occur.
In the MMR, DDC excludes time added to the project duration due to changes in programmatic scope and delays it considers beyond its control. According to DDC, any scope change and the effects that flow from scope change—including, for example, design changes that occur before construction starts or issues caused by utilities or due to third-party coordination—are delays that are unavoidable and therefore unreportable.
DDC cited limitations in its current systems and the fragmented nature of City coordination as contributing to its inability to prevent delays across all projects. For example, contracts frequently require mid-project adjustments due to added scope, unforeseen underground conditions, or delayed utility responses.
However, the audit’s review of project records and sampled project files (see further below) suggests that in many cases, delays categorized as external (e.g., “field conditions” or “scope changes”), and therefore deemed unavoidable by DDC, may stem from avoidable causes such as design omissions or insufficient project readiness.
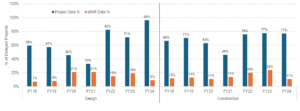
The result of this policy by DDC is that the MMR is misleading. Auditors undertook analysis of the project data and compared it to reporting by DDC in the MMR and found that the MMR consistently underreported total delays, as shown below in Table 1 and Chart 3. These show the percentage of projects experiencing delays at the completion of design and construction phases for the period covering FYs 2018 through 2024, as reported in the MMR, versus total delays based on auditors’ analysis of original and project/actual milestone dates from Benchmark reports.[27]
As shown below in Table 1, the MMR under-reported design delays by between 12% and 87% and construction delays by between 32% and 66% over this six-year period. As shown below in Table 1, from FYs 2018 to 2024, the MMR reported that an average of 15% of projects each year experienced delays during the construction phase, but the auditors’ review of the data for those years reveals that an average of 68% projects per year were delayed during that phase. In FY2024, which is the year with the greatest under-reporting, the MMR shows only 9% of all projects were delayed at design phase, but Benchmark shows that 96% were delayed; in the same year, DDC reported that 11% of projects experienced construction delays, versus the 77% shown in Benchmark.
Table 1: Design and Construction Completion Delay Trends (All Agencies) – MMR vs. Auditor Analysis of Project Data
| Performance Indicators | FY18 | FY19 | FY20 | FY21 | FY22 | FY23 | FY24 | Average per year |
| MMR reported design delays (%) | 7% | 8% | 21% | 21% | 15% | 19% | 9% | 14% |
| Auditor analysis design delays (%) | 59% | 57% | 45% | 33% | 82% | 71% | 96% | 63% |
| Variance (%) | 52% | 49% | 24% | 12% | 67% | 52% | 87% | 49% |
| MMR reported construction delays (%) | 12% | 13% | 11% | 14% | 20% | 24% | 11% | 15% |
| Auditor analysis construction delays (%) | 66% | 71% | 63% | 46% | 76% | 77% | 77% | 68% |
| Variance (%) | 54% | 58% | 52% | 32% | 56% | 53% | 66% | 53% |
Chart 3: MMR Delay vs. Actual Projects Data
Control Over Budgeted Costs
DDC lacks a system to facilitate real-time tracking of changes in project costs. They also have no process in place to manually collect and track this information across its portfolio of projects. Consequently, auditors were unable to ascertain the aggregate number of projects that exceeded their initial budget or the aggregate amount in dollars.
The auditors conducted reviews of sampled projects to gain an understanding of the variance between cost estimates and performance. This was done for projects that are not yet completed, so they offer only a partial picture of the changes in cost as of their respective statuses when reviewed.
A Random Sample of Large-Scale Projects Exceeded Their Original Budget by an Aggregate of 9.1%
An examination of 18 randomly selected projects with budgets of $100 million or more found that the aggregate total of the projects increased 9.1% (above contingency of 10%) going from $4.14 billion to $4.51 billion.
Alternatively, auditors selected a random sample of 25 projects, each with a current budget of $100 million or more, and attempted to determine the extent to which they remained within their originally authorized budgets. Of the 25 projects selected, auditors learned from DDC that seven are not yet in the construction phase. These were excluded from the sample. Of the remaining 18 projects, auditors reviewed the Certificates to Proceed (CPs) which were obtained from the Comptroller’s Office’s Omnibus Automated Image Storage and Information System (OAISIS) to determine the original funded amounts after construction contract award at the start of construction.[28]
According to the CPs, these 18 projects collectively had initial budgets totaling $4.14 billion, as shown in the table below. This was compared to the plan amount in Benchmark (excluding direct DDC costs, which come from the agency’s expense budget and are not included in the original capital funded amounts in the CPs) as of August 5, 2025.
Table 2: Analysis of Cost Budgets for 18 Randomly Selected Large-Scale Projects
| Project # (FMS ID) | Sponsor Agency[29] | Budget Approval Date | Original Budget | Budget as of 8/5/2025 | Difference Between Original and Modified Budgets | % increase/ (decrease) |
| CRO-AGS | DEP | 8/7/2018 | $84,739,748 | $109,923,000 | $25,183,252 | 29.7% |
| HR25BRCS | DSS | 2/22/2022 | $128,708, 495 | $128,698,000 | -$10,495 | 0.0% |
| HWHARPADM | DOT | 12/8/2021 | $129,970,529 | $138,611,000 | $8,640,471 | 6.6% |
| HWKKP005 | DOT | 6/14/2018 | $119,279,169 | $128,929,000 | $9,649,831 | 8.1% |
| NDF-CRLYN | DPR | 4/14/2021 | $92,000,000 | $91,500,000 | -$500,000 | -0.5% |
| P-217SCRC | DPR | 10/20/2021 | $140,873,619 | $140,989,000 | $115,381 | 0.1% |
| PO79ROD | NYPD | 11/26/2024 | $314,113,000 | $316,378,000 | $2,265,000 | 0.7% |
| RIKERSPMC | DOC | 11/29/2021 | $103,270,335 | $428,371,000 | $325,100,665 | 314.8% |
| S136-367 | DSNY | 7/23/2020 | $186,727,177 | $231,651,000 | $44,923,823 | 24.1% |
| SANDRESPC | DPR | 5/13/2022 | $196,409,438 | $212,343,000 | $15,933,562 | 8.1% |
| SANDTWOBR | MOR | 8/19/2022 | $450,288,035 | $450,972,000 | $683,965 | 0.2% |
| SE-842A1 | DEP | 8/23/2022 | $151,498,549 | $111,515,000 | -$39,983,549 | -26.4% |
| SE885AVWE | DEP | 9/29/2021 | $135,034,934 | $135,039,000 | $4,066 | 0.0% |
| GKOH15-03 | DEP | 12/26/2024 | $109,595,461 | $107,328,000 | -$2,267,461 | -2.1% |
| MED669 | DEP | 5/14/2024 | $116,251,545 | $121,805,000 | $5,553,455 | 4.8% |
| SANDRDHK | DOT | 5/23/2025 | $213,787,729 | $230,020,000 | $16,232,271 | 7.6% |
| SANDRESM1 | DPR | 5/06/2021 | $1,439,313,782 | $1,323,973,942 | -$115,339,840 | -8.0% |
| SANDRESM-1 | DPR | 01/10/2020 | $26,078,335 | $106,891,179 | $80,812,844 | 309.9% |
| Total | $4,137,939,880 | $4,514,937,121 | $376,997,241 | 9.1% |
As shown in the table above, 11 of the 18 (61%) projects experienced budget increases of $500,000 or more. Six (33%) projects exceeded budgets by at least $15 million each.[30] Of the 12 projects with increases, eight (44%) of them were less than 10% of the original budget, and four projects (22%) experienced an increase of more than 20% of the original budget, and two (11%)—one sponsored by DOC and the other by DPR—came in more than 300% over the initial budget. Overall, as shown in the chart, the aggregate total of these projects increased 9.1%. The median cost variance for these sampled projects was 2.75%.
Absent an in-depth review of project files, auditors are unable to identify the specific factors that led to changes in budgets for individual projects. The degree to which the budget changes for the sampled projects reflect changes for DDC’s entire portfolio of projects is also unknown to auditors. Much more troubling is the fact that DDC, the public, and other stakeholders do not know because DDC does not track or report the total value of cost overruns as it should.
Following the exit conference, DDC provided information relating to several projects listed in Table 2, arguing that these projects are not characteristic of standard DDC projects. For example, the agency stated that the design for project CRO-AGS was not managed by DDC and there were design errors resulting in increased cost. Officials also cited project RIKERSPMC as an outlier, stating that it was an emergency project to construct borough-based jail facilities.[31] The significant increase in cost has been largely due to an expansion of the project.
To underscore the importance of this information to the City, the auditors have estimated total increases based on the results of the random sample. There were 49 large-scale projects in the universe from which the sample of 18 was drawn—each over $100 million in budgeted costs— with a reported total budget of $9.6 billion. If sampled results were extrapolated across the universe of large-scale projects, and an overall increase of 9.1% occurred, the total cost to the City would be $10.4 billion, a total difference of approximately $870 million.[32] In reality, this may be lower or much higher. The range of budget overruns in the sample ran from marginal to well over 300%, highlighting the financial risk this issue presents.
DDC Discontinued Reporting Project Cost Against Original Budget in the MMR Between FY2021 and FY2024
Even though projects completed within budget is listed as one of DDC’s key performance indicators, DDC did not report performance against original budgets in the MMR for FY2021 through FY2024, and only recently provided figures for FY2025.[33] During this period, DDC suspended its reporting of the percentage of construction contracts completed within budget for the stated purpose of improving its internal cost tracking database. At that time, DDC reported that they expected to resume reporting of this key performance indicator toward the end of FY2022, more than three years ago. In September 2025, DDC posted figures for FY2025 for the first time in this administration.
DDC’s Project Controls Division (PCD) is dedicated to advancing DDC’s mission of delivering projects on time and within budget. According to DDC, a project “completed within budget” is one that has been delivered within the allowable budget, which includes the baseline budget plus a 10% contingency set aside to cover unforeseen circumstances, unexpected changes, or risks that may arise during the project. As noted above, individual project costs are tracked on spreadsheets and costs are traceable through documents maintained in files. However, during the conduct of much of this audit, DDC’s senior management and oversight bodies were unable to assess the original scope and cost against the final costs, or assess the fiscal performance of project oversight, without an individual project manager’s insight, explanation, and potentially an examination of related documentation.
According to DDC, it was difficult to report budget information in the MMR because of inconsistencies in how OMB and DDC track projects and their costs. OMB’s project list (using FMS IDs as the identifier) does not correspond 1:1 with DDC’s project list because DDC’s list includes projects having multiple FMS IDs, representing projects with multiple sponsor agencies (e.g., DOT and DEP). Conversely, one FMS ID can also be shared by two projects, making it difficult to use FMS for budget tracking. Finally, costs are not tracked the same way across City agencies, making it difficult to properly categorize costs across projects.
During a meeting held on July 28, 2025, DDC officials stated that for FY2025 they started tracking projects manually that have an Estimate at Completion (EAC) and that efforts were being made to calculate the construction cost variance from the original contract value to the project cost at the end, for reporting in the MMR for FY2025. That MMR reported a construction cost variance of 0.66%. The variance refers to the median value of the cost variances (i.e., percentage by which the cost estimate at completion exceeds the original construction contract amount) for construction contracts that were substantially completed during the period April 2024 through March 2025. In reporting a median construction cost variance of 0.66%, DDC states that at least half of the contracts completed during the above period had a cost increase of less than 1%.[34]
Auditors did not confirm the accuracy of the reported variance.[35] However, this value differs so significantly from the median cost variance for the sampled projects, and given that all of the sampled projects were not yet completed and that the original contract value does not include DDC’s direct costs in managing the project (from the agency’s expense budget and varied from 3% to 9% in the data set reviewed by auditors), the 0.66% variance figure reported in the MMR is not credible.
Case Study – Project Management of Three Sponsor Agencies: DOT, DEP, and DSNY
Because of the volume of projects, the magnitude of design and construction delays, the value of the project portfolio, and the average project cost, auditors examined the portfolio of projects sponsored by DOT, DEP, and DSNY for further analysis. To further review causes of time delays and cost overruns and to evaluate the effectiveness of DDC’s mitigation measures, auditors selected three projects for an in-depth review.
DOT, DEP, and DSNY Projects Among the Most Delayed
An analysis of DDC construction projects ongoing in August 2025 found that of the agencies with project portfolios totaling $750 million or more, DOT, DEP, and DSNY were among the agencies with the highest average number of days delayed, as shown in Table 3 below.
As shown in the table, four agencies—DOT, DEP, Public Libraries (New York, Brooklyn and Queens), and DSNY—sponsored projects that averaged delays of more than 1,000 days.[36] Of the four, Public Libraries had a significantly lower average project cost than the other three agencies—$7.7 million, compared to $26 million or more for the other three agencies. DOT and DEP also had the largest construction portfolios, with 304 projects valued at $8.01 billion and 225 projects valued at $7.15 billion respectively.
Table 3: Agencies with Construction Projects Totaling $750 Million or More as of April 2025
| Agency | No. of Projects | Total Project Cost as of April 2025 | Average Cost per Project | Average Design Delay (days) | Average Construction Delay (days) | Average Overall Delay (days) |
| DOT | 304 | $8,013,179,000 | $26,359,141 | 550 | 278 | 1098 |
| DEP | 225 | $7,153,302,698 | $31,792,456 | 353 | 392 | 1036 |
| DPR | 37 | $2,837,910,121 | $76,700,274 | 189 | 236 | 620 |
| DCAS | 88 | $1,502,207,646 | $17,070,541 | 460 | 348 | 930 |
| LIBRARIES | 147 | $1,139,988,118 | $7,755,021 | 936 | 320 | 1636 |
| DSNY | 15 | $974,280,038 | $64,952,003 | 317 | 655 | 1085 |
| Cultural Affairs | 116 | $953,658,000 | $8,221,190 | 274 | 79 | 533 |
| DOC | 7 | $856,924,889 | $122,417,841 | 15 | 267 | 273 |
Detailed Analysis of Sampled DSNY, DEP, and DOT Projects
Auditors selected a sample of three projects—one each from DSNY, DEP, and DOT—based on factors such as project size, severity of delays, and significance. This was done to ensure coverage of diverse infrastructure types and agency-specific challenges. Each chosen project represents critical investments in infrastructure that involved both above-ground and below-ground works, which can pose challenges during execution. The following projects were selected:
- Staten Island Garage 1 & 3 Construction and Rehabilitation Project (S136-367, Phase II) (DSNY): the largest project that began design after 2017.
- Installation of 36″ Water Main and other Infrastructure along 9th Avenue (MED609B) (DEP): a $125 million project contractually scheduled to be completed in October 2017 but the scheduled completion was extended to January 2021 to complete additional water main installation on 9th Avenue. The extended project experienced a delay of almost two years and was completed in December 2022.
- Owl’s Head Connector Section of the Brooklyn Waterfront Gateway (HWK104BG) (DOT): a $26.8 million project with 2 ½ years of design delay and 3 ¼ years of construction. (Also aligned with DOT’s Vision Zero goals for creating safer streets.)
The audit identified deficiencies across sampled projects, which collectively resulted in significant time delays based on the original plan and contractual dates prepared after design and procurement, as well as cost overruns. The primary causes were inadequate design coordination, insufficient pre-construction utility investigations (resulting in dependence on outdated utility information), and inaccurate cost and quantity estimates.
Together, these deficiencies underscore the need for DDC to implement stricter design reviews, improve stakeholder coordination, better manage risks associated with underground utilities data, and prioritize pre-construction investigations to improve project readiness and reduce avoidable delays and costs.
An analysis of these projects is discussed in more detail below.
Staten Island Garage 1 & 3 Construction and Rehabilitation Project (DSNY)
Auditors found that the delays in this project were primarily due to design errors and the associated cost increases were primarily due to increased construction costs and expanded construction management services.
This project (S136-367, Phase II), initiated in February 2017, was scheduled to be completed by September 1, 2023, and was initially budgeted at $186.7 million. The auditors’ review found that, as of March 4, 2025, the expected completion had been extended by 790 days (a little over two years) to October 30, 2025, and its budget had increased by 30%, up to $242.5 million, with $223 million currently committed due to change orders and the extension of construction management and design consultant services during construction.[37]
The project called for a new garage to be constructed that will feature updated vehicle and personnel facilities, such as indoor parking for weather sensitive vehicles; vehicular repair bays and wash bays; personnel offices; and locker rooms. The new building will also feature skylights providing daylighting and roof-top solar arrays. The existing Staten Island 3 building (currently containing the Staten Island 3 Garage and Richmond Borough Repair Shop) will also be rehabilitated, with an expansion of the building’s current use for the Borough Repair Shop, among other things. The site will also have a number of other features, including: a 2,000-ton capacity salt shed; a free-standing vehicular fueling facility; an open-air household waste drop-off area; and improved site drainage.
In accordance with DDC’s internal Building Information Modeling (BIM) Guide and the construction contract, design consultants were contractually obligated to deliver BIM models at Level of Development (LOD) 400 before construction could proceed.[38] [39] According to DDC’s procedures, before construction begins, all design-related submittals and Requests for Information (RFIs) were to be resolved. (Such resolutions may necessitate coordination between design consultants, DDC, and regulatory agencies.)
However, auditors found that DDC accepted a BIM model developed by Andrea Steele Architecture (ASA) at an LOD below 300. The incomplete model lacked sufficient detail in mechanical, electrical, and plumbing (MEP) systems. ASA also failed to respond to key submittals and design RFIs. DDC did not require the contractor to complete or upgrade the BIM to LOD 400 until construction was already underway.
This led to cascading delays and change orders as unresolved design issues surfaced in the field. For instance, the design of the boiler room (located on an upper floor near the garage ceiling) did not leave enough space for the equipment that would be in the room. There were 30 conduits entering the room but no space for them to fit in the room and no room to install pipe hangers. Platforms were installed to relocate some equipment outside of the boiler room and solar hot water tanks, pumps, heaters and roof panels and associated piping were removed from the project to relieve boiler room congestion. The redesign period ran from June 2021 to October 2022.
DDC indicated that the project’s original design timeline had been compressed by the client agency, DSNY’s leadership, which limited design development and oversight. Moreover, ASA misrepresented staffing capabilities during procurement and was unable to deliver a coordinated model in the time allowed. ASA did not coordinate their architectural design with the design of their subconsultants. ASA also failed to effectively manage its Mechanical Electrical and Plumbing (MEP) subconsultant, Ettinger Engineering Associates, resulting in unresolved MEP conflicts and permitting delays.
Overall, the project budget, segregated into six components (e.g., construction, design, commissioning), increased from an initial total of $186.7 million as documented in a July 2020 Certificate to Proceed (CP) to $242.5 million as documented in an April 2025 CP, representing a $55.7 million increase overall, with at least $36 million of the $55.7 million budget increase committed as of October 2025.
The outcome is a total delay of 790 days, as of Time Extension #3 Dated, March 4, 2025, of which 695 days are attributable to design errors and omissions. The contract drawings required to be used for the coordination of the construction were uncoordinated and incomplete, with missing architectural and engineering design details, resulting in an unexpected level of design and construction coordination during construction. The remaining 95 days are attributable to delayed submittal approval, which accounted for 62 days, and poor field conditions, which accounted for 33 days. Design errors and omissions have so far caused over $13.42 million in change orders, exceeding 10% of the $127.9 million original contract amount. Key additional costs include $2.8 million for BIM upgrades, $3.6 million for MEP errors, and $2 million for design revisions.
The auditors conclude that these issues could have been avoided with more effective oversight. DDC should have reviewed the construction drawings and determined they were incomplete and had the design consultant finalize the construction documents prior to releasing them for bid.
At the exit conference, DDC stated the City is moving away from BIM and that advances in AI are rendering BIM obsolete. The industry is moving to virtual design and construction. The project is designed in a virtual environment before it is built in the physical world. Design teams can review their design using virtual reality googles. DDC indicated that more funding is needed to implement the upgrades. Notwithstanding the anticipated move away from BIM, the contract in question called for BIM LOD levels of 400, yet DDC accepted a level below 300, which the audit found contributed to the delays and additional costs on the project.
9th Avenue Water Main Project (DEP)
Auditors found that this project was delayed because the project scope was expanded and it was impacted by COVID-19-related difficulties. However, the audit found that the lack of accurate utility information and insufficient discovery during design also contributed to delays.
The sampled project (MED609b) is one of four sub projects that comprised a mega project (MED609) to upgrade a critical segment of water main infrastructure in the Columbus Circle area of Manhattan.
According to the Benchmark project listing, the planned construction period was 24 months, to run from August 2011 through July 2013. However, the project was completed in December 2022, 113 months (9 ½ years) later than initially scheduled. The primary reasons for the late completion were that the initial schedule for design and construction phases was extended and there was a significant expansion of the project’s scope.
The auditors’ review of project documentation revealed that the construction start (initially scheduled to begin August 2011) was moved back nine months to April 2012, and the construction phase was extended 42 months resulting in a contractual Substantial Completion date in October 2017, 4 ¼ years later than the originally planned completion date recorded in Benchmark.
In February 2015, DEP decided to expand the scope of MED609b—using a portion of the $75 million in projected cost underruns in the mega project—to install trunk water mains and related infrastructure between West 51st and West 59th streets in Manhattan (known as the 9th Avenue Extension).[40] This expansion was anticipated to add another 39 months to MED609b (with an anticipated completion in January 2021) at a cost of $28.6 million. The 9th Avenue Extension was eventually completed in December 2022 at a cost of $29.7 million—669 days (23 months) and $1.1 million more than scheduled. (The additional cost on the project was for street lighting equipment, traffic signals, street lighting and traffic agents.) Based on a document review, auditors found 265 of the 699 days delay on the 9th Avenue extension were avoidable. Specifically, the lack of accurate utility information and insufficient discovery during design severely impacted the timeliness of project delivery.
In developing its design drawings, DDC relied on drawings previously submitted by Empire City Subway (ECS). The ECS drawings were believed to record the location of underground cable encased in clay ducts (duct banks). DDC indicated that the duct bank locations in its design drawings were taken from ECS drawings. However, the drawings referenced the duct location to the original curb line that was changed when the street was widened. Additionally, no section U drawings (prepared by utilities, detailing the location of their underground infrastructure) were prepared to ascertain whether any telephone lines or other utility relocation work was needed, and no test pit investigations or scans were conducted during design of the 9th Avenue Extension.
The ECS drawings referenced curb alignments that had shifted decades earlier, when streets were widened. DEP continued to use the original curb references, while DDC measured from the current curb, resulting in misalignment. As a result, additional work was needed to either relocate duct banks or work around them, resulting in a delay of 139 days with another 126 days lost due to the lack of section U drawings.
Of the remaining 434 (699 – 265) days delayed, 415 were due to COVID-19-related issues, such as outdoor dining structures on 9th Ave that interfered with restoration work, and 19 days were lost due to miscellaneous issues, such as an NYCDEP trunk water main shutdown. Regarding the COVID-19-related delays, DDC deemed these to be unavoidable.
Owl’s Head Connector Project (DOT)
Auditors found that this project was delayed due to critical design errors and poor coordination of the project, leading to cost overruns.
This project (HWK104BG), initiated in May 2011, was initially budgeted at $20.7 million and slated to be completed in May 2016. The audit’s review found that the project was completed in January 2022, a delay of more than 5 2/3 years and at a cost of $26.8 million, an increase of 29%.
This project, managed by DDC on DOT’s behalf, is a component of the Brooklyn Waterfront Greenway infrastructure program. This project encompassed 12 blocks of the 14–mile Brooklyn Waterfront Greenway and links the neighborhoods of Sunset Park and Bay Ridge. The Greenway is intended to ultimately connect to the Shore Parkway Esplanade.
The planned design period was from May 2012 through May 2014 (two years). However, the design phase did not start until in August 2013 (15 months late) and was not completed until November 2016, 3 ¼ years later, or 15 months longer than planned. The total design delay was 30 months (May 2014 through November 2016).
The planned construction period was May 2015 through May 2016 (one year). The construction phase did not begin until September 2017—28 months later than planned—and was scheduled to end in two years (September 2019), adding one year to the construction schedule. A 30-month delay in design completion resulted in a 28-month delay in the start of construction and the construction took one year longer than planned. In total, construction completion was pushed back 40 months from the initial completion date of May 2016 to September 2019.
During the construction phase, there were two time extensions that extended the project until January 2022, adding another 28 months to the project (September 2019 to January 2022). In total, the project was completed approximately 5 2/3 years later than it was originally planned to end (January 2022 versus May 2016).
Auditors found critical design errors and poor coordination of the project, leading to cost overruns. Per DDC’s Project Delivery Manual, designs must be constructible, coordinated across disciplines, and supported by validated field data. Contracts are expected to account for known utilities and incorporate logistical requirements for coordination with City agencies, including New York City Fire Department (FDNY) and New York City Police Department (NYPD).
However, the audit found that several key conditions were omitted or misrepresented in the design:
- NYPD electrical boxes attached to a retaining wall were not identified;
- Rebar quantity estimates were off by a factor of 100 (50 LF estimated vs. 5,271 LF required); and
- A 48-inch sewer connection at Manhole 1 was misaligned by seven feet, preventing installation as designed.
Additionally, FDNY conduits and alarm systems on 2nd Avenue conflicted with proposed sewer work, triggering the need for redesign and relocation.
DDC stated that it had contacted both NYPD and FDNY before finalizing the design, but responses were delayed, particularly due to security protocols that limited access to NYPD sites. Additionally, DEP drawings used for utility planning did not accurately reflect field conditions.
Underestimated field requirements, delayed third-party confirmations, design errors and omissions, and unanticipated field conditions drove both schedule and cost increases. As a result of these factors, the contractor was forced to perform substantial unplanned work on a time-and-materials basis, including relocation of electrical boxes ($700,000), adjustment of sewer work ($541,000), and extensive traffic control via flaggers ($1.6 million).
Perspective of Sponsoring Agencies
To obtain the perspectives of sponsoring agencies on DDC’s performance on these projects, auditors met with officials from DSNY, DEP, and DOT. Officials from both DSNY and DEP stated that they were satisfied with DDC’s performance. A DSNY official acknowledged that the cost overruns created funding challenges for the agency. The audit notes that these cost overruns were linked to insufficient design development, hindered due to the shortening of the project’s design timeline at DSNY’s direction (according to DDC). On the DEP water main project (MED-609B), a DEP official recognized the challenges of working with underground infrastructure specific to that area, as well as issues related to working around trees and traffic levels.
Regarding the Owl’s Head project (HWK-1048G), a DOT official acknowledged DDC’s resource challenges, the official emphasized the need for improved surveys, better coordination, and accurate identification of underground utilities. These steps primarily occur during the design phase.
Too Soon to Evaluate the Impact of FEP
To improve project outcomes and mitigate risks during the planning stage that historically caused delays later in the project, DDC introduced the FEP process in 2016, with full implementation occurring in 2019. According to DDC’s Strategic Plan and subsequent updates, the FEP process was designed to facilitate the proactive collaboration of DDC with sponsor agencies at the early stages of project development. The stated goal of FEP is to define clear scopes, timelines, and budgets, particularly for complex projects.
Of the 1,092 DDC-managed projects that reached or were projected to reach Substantial Completion after FY2018, 478 were started on or after 2017, after the FEP process was introduced. Of these, 240 had been completed and 238 were still under construction as of April 2025. DDC’s data shows that of these 240 projects, 39 followed the FEP process.
At the exit conference, DDC stated that the FEP process is currently being followed for every project. Auditors did not have sufficient information to conduct an analysis to determine the extent to which FEP improved timeliness and whether it is effective for all types of projects, regardless of scope and complexity.
City Issues of Concern
Program Intended to Assist in Upfront Planning for Complex Projects is Being Underutilized
In 2014, OMB initiated a program called Capital Project Scope Development (CPSD), intended for complex projects, to support the clear identification of project scopes, cost, and other key factors before capital dollars are committed. Using Master Agreements with selected consultants (architect firms), sponsor agencies can request CPSD-funded services. If requested and approved, sponsor agencies negotiate the scope of services, timetable and fees, with the selected consultant. The selected consultant is responsible for generating a CPSD study for that particular project which outlines summary of requirements, site development assets and constraints, space requirements, alternative schemes, order of magnitude cost estimates, and project schedules. Sponsor agencies are responsible for managing the CPSD process for their respective projects.
The Capital Process Reform Task Force, established in 2022, made a series of recommendations intended to improve the City’s capital project delivery. One of the recommendations was to increase the number of projects that utilize the CPSD Fund, from 10 projects to 20 projects per year. As of FY2025, the yearly 20-project goal has not been met.
In FY2025, there were four Master Agreements valued at $60 million with task orders issued for only 11 CPSD projects, nine short of the goal. The total value of these task orders was $9.6 million, of which $3.6 million had been spent as September 10, 2025.
At the exit conference, DDC argued that allowing agencies to use capital funds rather than having to utilize their expense budget for CPSDs would increase agencies’ willingness to utilize the program more often. This should be discussed with OMB and with the incoming administration.
Auditors encourage the City to more fully utilize the CPSD program to better identify issues early on, to help mitigate the risk of cost overruns and delays in complex projects.
City Needs to Update Capital Project Dashboard
Pursuant to Local Law 37 of 2020, an interagency taskforce was organized to create a public online capital project database. The database that was created is the City’s Capital Project Dashboard and, pursuant to the Law, the information should be updated tri-annually.
On November 1, 2023, the NYC Mayor and NYC Comptroller announced the launch of the Capital Project Dashboard, intended to provide the public with information on the City’s capital spending. At the time that the dashboard was launched, the Comptroller stated that he had been long advocating for a comprehensive capital projects tracker “to provide public transparency and support managerial improvements” that would help get the City’s infrastructure projects built on-time and on-budget.
However, the dashboard has not provided the transparency that it was intended to deliver. In April 2024, the Office of the New York State Comptroller (NYS Comptroller) issued a report titled A Review of NYC Capital Project Delivery, which found that the City’s Capital Project Dashboard was not updated in a timely manner and lacked details on initial project budgets and explanations for schedule delays. At the time of the issuance of that report, the Capital Project Dashboard had been last updated in September 2023. As of the writing of this report, the dashboard has not been updated since May 2025 (over six months). According to the Mayor’s Office of Operations, the budget data in the dashboard should be updated three times a year in January, May, and September.
In addition, the audit team was unable to trace and match information from the sampled DDC projects to the Capital Project Dashboard due to the untimely updates in the system. During a meeting held in July 2025, DDC explained that the information contained in the dashboard would not match the information contained in their Benchmark system due to the dashboard being updated three times per year versus Benchmark, which is updated daily.
The NYC Capital Projects Dashboard also does not include all information on some City-funded capital projects, such as those managed by the School Construction Authority, NYCHA, and MTA. The Mayor’s Office of Operations has separate links on their website connecting to other agencies’ trackers, such as the NYC Parks Capital Projects Dashboard, NYC Capital Planning Explorer, NYCHA Capital Projects Tracker, and School Construction Authority (SCA) Capital Plan Reports and Data.[41]
The City’s failure to update the dashboard or include all the necessary information has limited its ability to meet the purposes for which it was established, namely to enhance transparency and provide the most up to date information on project delays and cost overruns.
Recommendations
To address the abovementioned findings, the auditors propose that DDC should:
- Create a dedicated project cost management team to track and report on cost overruns in the aggregate, while planning upgrades to Benchmark to enable comprehensive project cost management.
DDC Response: DDC agreed with this recommendation.
- Report in the MMR the full extent of cost and time overruns, from the first baseline, and establish causation categories to better track and report on the specific causes or time and cost changes, as they occur. This should be done on each individual project and in the aggregate for all projects under DDC’s management.
DDC Response: DDC agreed with this recommendation.
- Improve the construction schedule prepared at project initiation to more accurately reflect the constraints of designing and constructing a public works project in NYC. If it is not possible to project a completion date at project initiation, then DDC should consider not providing a construction completion date until the end of the design phase.
DDC Response: DDC agreed with this recommendation.
- Work with City Hall to compel the private utility companies to provide better documentation and engineering of their systems (“pre-engineering”) during the design phase. Support a permanent or long-term extension of the Joint Bidding Law, which allows City work and utility work to be bid within the same contract.
DDC Response: DDC agreed with this recommendation.
- Launch Virtual Design and Construction (VDC) practice, including updates to BIM standards.
DDC Response: DDC agreed with this recommendation.
- Establish record-keeping requirements for project documentation in Benchmark to ensure consistency and facilitate effective project management.
DDC Response: DDC agreed with this recommendation. - Continue to implement FEP and report the impact of FEP on projects, and compare to non-FEP project performance to help ensure that risks at the planning stage are mitigated.
DDC Response: DDC agreed with this recommendation.
Additionally, the auditors propose that City agencies:
- Make use of the funding ear-marked to support pre-construction planning and design by increasing the number of CPSDs used. Consider increasing recommendation of projects for the CPSD study.
DDC Response: DDC agreed with this recommendation.
- Discuss the use of capital funds versus expense funding with OMB and the incoming administration.
DDC Response: DDC disagreed with this recommendation. DDC stated that it “disagrees with this recommendation because it fails to take into consideration the basis of the use of capital funds and expense funds, which is under the jurisdiction of the Office of the Comptroller, and may also impact the markets’ reception to the sale of bonds by the City of New York. While DDC would prefer to use capital funds rather than expense funding for these costs, meeting with OMB cannot result in the change as these costs are not capitally eligible under New York City Comptroller’s Directive #10.”
Auditor Comment: Although Directive 10 (“Charges to the Capital Projects Fund”) sets forth the accounting policies for determining when capital funds may be used, it is not to be viewed as an all-inclusive statement containing all requirements for capital eligibility. As per the Directive, final determinations of capital eligibility for specific projects should be made by appropriate City officials and, when necessary, the City’s outside Bond Counsel. Thus, the audit recommends that DDC discuss with OMB and the incoming administration the feasibility of using capital funds for the CPSD program.
The auditors also propose that the Mayor’s Office of Operations:
- Ensure compliance with Local Law 37 by providing timely updates of the Capital Project Dashboard and ensure that all information needed to meet the stated purpose of the dashboard is included.
DDC Response: DDC agreed with this recommendation.
Mayor’s Office of Operations Response: The Mayor’s Office did not respond to this recommendation.
Recommendations Follow-up
Follow-up will be conducted periodically to determine the implementation status of each recommendation contained in this report. Agency reported status updates are included in the Audit Recommendations Tracker available here: https://comptroller.nyc.gov/services/for-the-public/audit/audit-recommendations-tracker/
Scope and Methodology
We conducted this performance audit in accordance with Generally Accepted Government Auditing Standards (GAGAS). GAGAS requires that we plan and perform the audit to obtain sufficient, appropriate evidence to provide a reasonable basis for our findings and conclusions based on our audit objectives. We believe that the evidence obtained provides a reasonable basis for our findings and conclusions within the context of our audit objective(s). This audit was conducted in accordance with the audit responsibilities of the City Comptroller as set forth in Chapter 5, §93, of the New York City Charter.
The scope of this audit was capital projects with Substantial Completion dates after FY2018, with the status of projects extended to April 2025.
Auditors researched relevant websites and identified and reviewed external reports and prior audits by the New York City Comptroller’s Office to assemble information about DDC and projects that DDC handles on behalf of other City agencies.
To obtain an understanding of DDC’s processes, policies and procedures, internal controls, and risk associated with administration of construction projects, the auditors conducted walkthrough meetings with Project Managers, Program Directors, Associate and Deputy Commissioners, DDC’s General Counsel, and other appropriate personnel familiar with DDC’s policies and procedures and projects covered in this audit. Auditors documented their understanding through memos and flowcharts and obtained DDC’s confirmations.
Auditors obtained and reviewed relevant governing documents used by DDC in administration of the contracts. Also, where applicable, auditors used the following documents as the criteria:
-
-
- DDC Construction Project Manual (CPM Manual)
- DDC Design Consultant Guide
- DDC Public Buildings Division Standard Operating Procedures (SOPs)
- DDC Infrastructure Division Standard Operating Procedures (SOPs)
- DDC Project Controls Guide
- DDC Benchmark Manual
- NYC Standard Construction Contract
-
To obtain an understanding of DDC’s reporting of its construction management services and process improvement plans, auditors reviewed:
-
-
- DDC’s website
- DDC’s reporting in the Mayor’s Management Report
- DDC’s 2019 Strategic Plan and updates
-
To obtain an understanding of the records associated with the projects administered by DDC, auditors:
-
-
- Obtained a list of capital projects with Substantial Completion dates between FY2018 and FY2023
- Examined project information on DDC Anywhere Website to which DDC provided auditors access
- Examined financial and payment information through the Checkbook NYC Website (publicly available system administered by the NYC Office of the Comptroller)
- Examined contract and vendor information through the NYC PASSPort Website (publicly available system administered by the Mayor’s Office of Contract Services)
-
Auditors obtained a list of projects that were administered by DDC during the scope period and evaluated DDC project data to obtain an understanding of project distribution by client agency, project amounts, overall delays, and delays in design and construction phases.[42] Auditors conducted data analysis of projects categorized as FEP projects.
To assess DDC’s management of high-risk capital projects, auditors selected a sample of three projects from major client agencies—DSNY, DEP, and DOT—based on factors such as project size, delay severity, and significance, ensuring coverage of diverse infrastructure types and agency-specific challenges, to review and perform an in-depth analysis of how effectively DDC mitigated delays and cost overruns.
Auditors assessed the following three sampled projects involving the client agencies—DSNY, DEP, and DOT—in detail:
-
-
- Staten Island Garage 1 & 3 Construction and Rehabilitation Project (S136-367, Phase II); Client agency – DSNY
- Installation of 36” Water Main and other Infrastructure along 9th Avenue (MED-609B, 9th Avenue Extension); Client agency – DEP
- Owl’s Head Connector Section of the Brooklyn Waterfront Gateway (HWK1048G); Client agency – DOT
-
Auditors obtained project records from DDC related to the sampled projects, including, but not limited to:
-
-
- Executed Contracts
- Project Specifications
- Project Drawings
- Change Order Logs
- Project Schedules
- Time Extension(s) documentation
- Delay Analysis Logs
- Relevant correspondence between DDC and Project Sponsor Agencies
-
Auditors reviewed information and documentation in Benchmark and requested additional project management documents from DDC as needed. They also evaluated whether project information was consistent in Benchmark.
Auditors met with the DDC project teams involved in the selected projects and also with representatives from the sponsor agencies.
Auditors also conducted physical observations of a sampled DSNY Garage in Staten Island project, which was in the construction phase, and met with the Construction Manager’s staff.
Auditors followed up with DDC for clarification or additional information when required.
Although the results of the sampling tests were not statistically projected to their respective populations, these results, together with the results of other audit procedures and tests, provide a reasonable basis for the assessment of DDC’s mitigation of delays and cost overruns of capital construction projects.
Endnotes
[1] Projects with total costs of at least $750 million.
[2] Prior to the establishment of DDC, City agencies were responsible for managing their own capital projects, which were not necessarily within their core responsibilities.
[3] Step streets are placed on hills that are too steep for roads. The steps provide pedestrians direct access in hilly areas.
[4] In its response to the Draft Report, DDC disagreed with the number of phases represented. For brevity, certain phases (e.g., planning and initiation) were combined in the audit report.
[5] In its response to the Draft Report, DDC argues that CPSDs are categorized by the agency as separate project investigations and are not considered part of the planning phase. Regardless of its categorization, CPSDs take place during a project’s initiation and planning phase and are represented as such in the report.
[6] DDC complied with a request from DSNY to compress the design schedule to one year instead of the standard two years.
[7] The lowest responsible and responsive bidder is a bidder who has the capability in all respects to perform in full the contract requirements and has the business integrity and reliability that will assure good faith performance and whose proposal complies with the solicitation requirement within the best overall value.
[8] Project start is when management of a project is officially transferred from the sponsor agency to DDC.
[9] The schedule revision history is maintained in Benchmark; however, the historical budget amounts are not maintained due to the absence of a history module in Benchmark. The budget information is transferred to Benchmark via an interface with FMS.
[10] A Gantt chart is a project management tool that uses a horizontal bar chart to visualize a project plan. It shows the start and end dates of project components, tasks, and resources. The chart helps project professionals monitor progress and understand the project schedule.
[11] The critical path method identifies the longest sequence of dependent tasks within a project. If those tasks are completed on time, the project can be completed at the earliest date possible. It also identifies the tasks that can be completed in parallel to critical tasks with buffer time around them. By prioritizing tasks that have no buffer time and completing other tasks around them, project managers can efficiently keep projects progressing to an on-time completion.
[12] https://www.nyc.gov/assets/home/downloads/pdf/press-releases/2023/CP_ReformTaskForce.pdf. Capital Process Reform Report.pdf.
[13] Listing provided in April of 2025 includes projects with Substantial Completion between FYs 2018-2034. Analysis of the April 2025 information is included in this report.
[14] The original Certificate to Proceed includes a contingency, which is generally 10% of construction cost. The budget at Substantial Completion includes the cost of DDC management of the project which is not reflected in the original Certificate to Proceed. The cost of DDC’s management of the project increases with project delays.
[15] Constructability analysis assesses whether a project can be completed and how to minimize the number of unexpected issues during construction that can lead to delays or increased expenses. Logistical constraints, material availability, site conditions, and the efficacy of construction methods all have to be taken into consideration.
[16] U drawings are drawings prepared by utilities detailing the location of underground infrastructure.
[17] Mechanical, Engineering, and Plumbing (MEP) drawings are contract drawing (blueprints) that detail Mechanical Electrical and Plumbing trades work on the project.
[18] Building Informational Modeling (BIM) is a digital collection of software applications designed to virtually construct the building on the computer. It is a 3D design visualization that facilitates the identification of conflicts (e.g., construction elements occupying the same physical space) early in the process.
[19] Review of NYC Capital Project Delivery (Report 1-2025), issued April 2024.
[20] Project Controls provides data analytics to help DDC adopt best practices in schedule, cost, and risk management. Project Controls provides project level support to individual projects (smaller projects) as well as programmatic and advisory support.
[21] In its response to the Draft Report, DDC argues that the target date established at initiation should not be used to measure overall timeliness because these dates are for planning purposes only. The audit used the target dates established at project initiation to measure the variance between the scheduled time when projects were initially approved with the time actually needed to complete projects.
[22] The data fields include project identifiers, including project ID, description, contract types, and sponsoring agency. Scheduling dates for each project phase, the planned amount, current phase, Benchmark status (active, canceled, completed, or on hold), and whether a project is an FEP project were also provided in the data.
[23] The overall delay is calculated as (Actual/Project Construction Completion date – Original Construction Completion Date) – (Actual Project Start – Original project start). This reflects the difference between the actual and baseline durations of the entire project.
[24] Phase delay is calculated as the difference between completion delay and start delay. For example, Design Phase Delay = (design completion delay) – (design start delay). This reflects the difference between the actual and baseline durations of the design phase.
[25] For the purposes of this audit, mid-range delays are those lasting anywhere from 90 to 720 days (approximately 2 years) while long-duration delays are those lasting more than 720 days.
[26] The information used for reporting is manually prepared by project management teams and then refined by the Project Controls unit for its intended purposes (i.e., Internal or External Reporting). For example, suspension of a design due to funding issues would not be counted as a delay in the MMR. Construction delays caused by private utilities also would not be considered delays in the MMR.
[27] In the MMR, DDC reports trends in completion rates. Table 1 shows delay data, which is the inverse of completion rates, calculated as 100% minus the reported completion rates.
[28] In its response to the Draft Report, DDC stated that a project listed as SANDRESM-1 was part of project SANDRESM1, despite it being issued a separate CP. However, the CP for SANDSRESM1, dated May 6, 2021, does not reference the CP for SANDRESM-1, dated January 10, 2020. Additionally, Benchmark listed these as two distinct projects. DDC does not provide evidence in its response to indicate that the $1.3 billion budget for SANDRESM1 includes the $106.9 million budget for SANDRESM-1. In the absence of sufficient evidence to the contrary, these are treated as separate projects in this report.
[29] Acronym definitions: DEP—Department of Environmental Protection; DSNY—Department of Sanitation; DOT—Department of Transportation; DSS—Department of Social Services; DPR—Department of Parks and Recreation; NYPD—New York Police Department; DOC—Department of Correction; MOR—Mayor’s Office of Resiliency.
[30] Auditors note that many of these projects are still ongoing, so the increase in cost when they are completed could be greater.
[31] In its response to the Draft Report, DDC argues that the RIKERSPMC project is not related to constructing borough-based jail facilities. However, the CP for this project (CP71292, dated November 29, 2021) clearly indicates that the funding is for project management “for the construction of new borough-based jail facilities.”
[32] This represents 9.1% of $9,562,240,121 ($870,163,851) plus $9,562,240,121 = $10,432,403,972, or $10.4 billion
[33] Performance against original budget was not reported in the preliminary FY2025 MMR issued in January 2025.
[34] The median cost variance is the middle value of a set of calculated cost variances, sorted by value.
[35] Fieldwork testing for this audit had effectively concluded by the time the MMR was issued.
[36] Libraries represent an aggregate of three separate entities—Brooklyn Public Libraries ($286,463,000); New York Public Libraries ($440,486,970); and Queens Public Libraries ($413,038,148).
[37] As of December 3, 2025, Benchmark shows the project as still ongoing.
[38] BIM is a digital collection of software applications designed to virtually construct the building on the computer. It is a 3D design visualization that facilitates the identification of conflicts (e.g., construction elements occupying the same physical space) early in the process.
[39] LOD describes the completeness of BIM elements. It is accumulative and should progress from LOD 100 through LOD 400. LOD 100 includes the building footprint used for conceptual design and phasing. LOD 200 adds components such as walls and foundation for analysis of overall systems. LOD 300 generic components have been replaced with fully defined assemblies (gyspum wall board, Masonry – Brick, etc.). LOD 400 includes elements that are accurate in terms of size, shape, location, quantity, and orientation with complete fabrication assembly and detailing information. At LOD 400, clash detection sequencing and cost can be determined.
[40] Due to COVID shutdowns, and the resulting dramatic reduction in traffic, the $54 million budget for Traffic agents had a significant underrun, which combined with underruns in other unit price items provided funding for the project expansion.
[41] https://www.nyc.gov/site/operations/performance/capital-projects-dashboard.page
[42] Delay durations represent net delay durations. Delay represents the difference between the actual project duration and the planned duration.