Audit Report on the Five Borough Presidents’ Offices’ Compliance with the New York City Charter Requirements for Community Board Member Appointments
Audit Impact
Summary of Findings
This audit was conducted to assess progress in implementing City Charter amendments adopted in 2018 aimed at making Community Boards more reflective of the communities they serve.
This is the first audit conducted by the Comptroller’s Office (or other governmental agency, so far as we are aware) of demographic representation on New York City’s Community Boards, and therefore there is no previous audit that can form the basis of an assessment of change or improvement over time.
Prior to the 2018 New York City Charter Revision Commission’s ballot proposals, demographic information was not systematically collected on Community Board members. As part of their proposal, with the goal “to help make community boards more reflective of the communities they represent and more effective in that representation,” the Commission proposed a ballot item to require Borough Presidents to seek out people of diverse backgrounds to apply for Community Board membership, to post applications including the option to provide demographic information, and to provide annual reports with information on board composition. The City Charter amendments were adopted by voters at the general election held on November 6, 2018, and went into effect January 1, 2019.
This audit compares voluntarily disclosed demographic data subsequently collected by the Borough Presidents as part of their 2023 Community Board Membership Applications to American Community Survey (ACS) data, to provide an analysis of how well or poorly the members of each Community Board represent the demographic composition of the communities they serve, across various categories.
The current Borough Presidents generally only took office in 2022, making it difficult to assess whether their efforts have been successful at improving representation over time. While the efforts of Borough Presidents to conduct outreach and make Community Board appointees more reflective of the communities they serve may have improved diversity, it cannot be determined from data assessed during this audit.
The audit found that each of the five Borough Presidents’ Offices has made meaningful efforts to seek out people of diverse backgrounds to apply to serve on Community Boards and posted Community Board Membership Applications on their websites, which generally included the option to provide demographic information such as race/ethnicity, gender, and age. Additionally, the Bronx, Brooklyn, Manhattan, and Queens Borough Presidents’ Offices made efforts to consider whether the aggregate of Community Board appointments fairly represents all segments of the community.
Nonetheless, the data suggests that further efforts are needed for the Borough Presidents’ Offices to meet their stated goals of ensuring that Community Boards reflect the diversity of the communities that they serve. Across each of the five boroughs, Hispanic/Latino residents, Asian residents, LGBTQIA residents , younger residents, residents with less formal education, and residents with disabilities were underrepresented in the aggregate and/or on certain Community Boards.[1] The audit found that, in general, NYCHA residents are fairly represented boroughwide in the Bronx, Brooklyn, Manhattan, and Queens; no NYCHA residents serve on Community Boards in Staten Island.
The audit also found that none of the five Borough Presidents’ Offices submitted annual Community Boards Demographic Reports (Demographic Reports) to the Mayor and City Council Speaker and posted them on their websites in a timely manner. When submitted, these reports did not contain all required information.
In some cases, the Borough Presidents’ Offices appointed members who were not eligible to serve and reappointed members who did not attend the majority of general board meetings in the prior year. In addition, in some Community Boards, the Borough Presidents did not assure that appointees were evenly spread across the geography of the district.
Intended Benefits
This audit assessed progress made to date implementing City Charter amendments aimed at helping to make Community Boards more reflective of the communities they serve and more effective in their representation. To make improvements in the future, this audit identifies the need for collaboration among the Borough Presidents’ Offices to identify strategies that have proved successful to confront common challenges, as well as potential Citywide support to reach candidates from segments of the community that have proved difficult to recruit.
Introduction
Background
The Borough Presidents are elected officials who are responsible for representation and oversight of the City’s five boroughs. They are elected to four-year terms by the voters of their respective boroughs. Among their duties as prescribed by the City Charter, Borough Presidents are responsible for appointing members to Community Boards, which are local representative bodies authorized by the New York City Charter to advocate for the residents and needs of their districts.
Community Boards are intended to ensure that local residents’ opinions are taken into consideration when the City allocates its resources and services. Among other responsibilities, Community Boards:
- Evaluate the quality and quantity of services provided by City agencies;
- Assess and annually report to the Mayor current and future district needs and recommendations for programs, projects, or activities to meet those needs;
- Participate in the budget process by consulting with City agencies, conducting public hearings on districts’ needs, preparing capital and expense budget priorities for the next fiscal year, and submitting these priorities to the Mayor;
- Participate in the land use review process and assess the impact of matters such as zoning changes and selecting sites for capital projects, which allows the boards to shape and manage the growth and development of the district; and
- Inform residents, hold public hearings, and submit comments on the plans to open, close, expand, or reduce the size of City facilities.[2]
There are 59 Community Boards in New York City (12 in the Bronx, 18 in Brooklyn, 12 in Manhattan, 14 in Queens, and three in Staten Island). Each board consists of up to 50 unsalaried members serving staggered two-year terms, at least half of whom are appointed based on City Council Members’ nominations. The City Charter states that the only people who can be appointed to or remain a member of a Community Board are those who reside in the district, or those who have business, professional, or other significant interests within the district. People who are interested in serving or remaining on a Community Board are required to complete a membership application which includes the applicant’s residence, business, professional, or other significant interest in the community district. Borough President’s Office staff are responsible for screening applications and recommending applicants to the Borough President.
For applicants who are applying to be reappointed, Borough President’s Office staff consider their prior participation and, specifically, their attendance at general board meetings based on attendance records and/or Community Board Chairpersons’ and District Managers’ input. For applicants with poor attendance records, staff discuss their prior participation, continued interest and commitment, and ability to contribute going forward.
In making Community Board member appointments, the City Charter states that the Borough Presidents must “assure adequate representation from the different geographic sections and neighborhoods within the community district” and “consider whether the aggregate of appointments fairly represents all segments of the community.”
The City Charter Revision Commission’s Investigation of Community Boards
The 2018 New York City Charter Revision Commission (the Commission) reviewed the City Charter, solicited public input, issued a report detailing its findings and recommendations, and prepared ballot questions to amend the City Charter.
As part of this mandate, the Commission investigated Community Boards and received extensive testimony from the public, Community Board members, elected officials, academics, good government groups, and experts. The public expressed an interest in making Community Boards more representative, as the Commission “heard that some community boards do not always live up to their potential to transmit and amplify the voices of all members of the community.”
According to testimony, some Community Boards had consistent turnover which resulted in boards that changed with their communities and had a healthy balance of new and experienced members. However, other Community Boards were not reflective of their communities due to the repeated reappointment of the same Community Board members for long periods—decades, in some cases.
The Commission stated, “This disparity becomes particularly pronounced as the demographics of communities change over time, leading to boards that are perceived as being out of step with the needs and desires of their communities.”
Additionally, the Commission heard that the Community Board recruitment and application process varied across the five boroughs and information about those processes and board composition was not always easily accessible or readily available.
City Charter Amendments
The Commission subsequently recommended amendments to the City Charter “to help make community boards more reflective of the communities they represent and more effective in that representation.” The proposed amendments included imposing term limits of generally four consecutive two-year terms to increase turnover and potentially increase diversity through new appointments.
The amendments also required Borough Presidents to seek out people of diverse backgrounds to apply for Community Board membership, which would enlarge the pool of potential applicants. Additionally, Borough Presidents would be required to post applications including the option to provide demographic information and annual reports with information on board composition, which will provide helpful and relevant information to Borough Presidents and improve transparency and public confidence.
The City Charter amendments were adopted by voters at the general election held on November 6, 2018, and went into effect January 1, 2019.
The Commission also proposed City Charter amendments which were adopted by voters to establish a Civic Engagement Commission (CEC). The purpose of the CEC is to enhance civic participation, through its own initiatives and in partnership with public and private entities, related to participation in Community Boards, among other things. The CEC is authorized to partner with City agencies to develop strategies to centralize public information about civic engagement opportunities and make such information accessible to all residents. This includes outreach strategies to “groups or categories of residents that have been historically underrepresented in […] city government.”
Term Limits Enacted
Regarding Community Board member term limits, the City Charter amendments provided for staggered and non-retroactive implementation to limit turnover and the loss of experienced members and institutional knowledge.
For Community Board member appointments or reappointments made on or after April 1, 2019, members may serve four consecutive two-year terms. For appointments or reappointments made on April 1, 2020, members may serve five consecutive, two-year terms. Terms served prior to those dates do not count toward the limit. Community Board members appointed or reappointed in 2019 will reach their term limit in 2027, and members appointed or reappointed in 2020 will reach their limit in 2030.
Annual Reporting Requirements
The City Charter amendments require the Borough Presidents to submit to the Mayor and City Council Speaker, and to post on their websites, an annual report by July 1 which includes each Community Board member’s name, appointment and reappointment dates, length of service, nominating party, and leadership positions. The report must also include demographic information about Community Board members in aggregate form; information about recruitment and selection processes; and information on the number of vacancies, applicants, and individuals interviewed.
Each of the current Borough Presidents took office in 2021 or 2022, after the Charter amendments were adopted by voters.[3] In their respective Demographic Reports, the five Borough Presidents affirmed their commitment to ensuring that Community Boards reflect the diversity of the communities that they serve.
Objectives
The objectives of this audit were to determine whether the five Borough Presidents’ Offices—the Bronx Borough President’s Office (BXBPO), Brooklyn Borough President’s Office (BBPO), Manhattan Borough President’s Office (MBPO), Queens Borough President’s Office (QBPO), and Staten Island Borough President’s Office (SIBPO)—complied with the City Charter requirements and relevant policies and procedures for Community Board member appointments and determine the extent to which Community Boards are fully representative (both geographically and demographically) of the communities they serve.
Discussion of Audit Results
The matters covered in this report were discussed with the five Borough Presidents’ Offices during and at the conclusion of this audit. On July 26, 2024, we submitted a Draft Report to the five Borough Presidents’ Offices for written comments. We received written responses from the BXBPO, BBPO, and MBPO on August 9, 2024, and from the QBPO on August 12, 2024. The SIBPO declined to respond.
In their responses, each of the four Borough Presidents acknowledged the importance of Community Boards’ role in local government and ensuring that board members are reflective of the communities they represent. The Borough Presidents stated that disparities in Community Board representation were due to historic and systemic issues which occurred over decades of prior appointments. Each office cited their data-driven approach to identifying disparities, implementation of online applications, targeted outreach efforts, and progress in making boards more reflective of their communities. They further stated that changes must be made gradually to balance the need for institutional knowledge and integrating new members, and that terms limits—which will take effect in 2027—will help to further diversify boards.
The Borough Presidents stated that while demographic diversity is considered when appointing Community Board members, it is not the only consideration and does not outweigh an applicant’s experience, expertise, and history of community engagement. Further, the Borough Presidents stated that they are legally restricted from appointing Community Board members based on their actual or perceived membership in a protected class, such as race/ethnicity, gender, or age, by City, State, or Federal law.
In addition, some Borough Presidents stated that their control over appointments is limited since half of Community Board member appointments must come from City Council member nominations and it is difficult to recruit some groups, such as younger residents.
The four Borough Presidents also stated that the report’s methodology is flawed because many Community Board members self-identify as one or more races/ethnicities. In some cases, large percentages of Community Board members chose not to voluntarily disclose their demographic information.
Regarding eligibility, the Borough Presidents stated that they appointed only eligible members and provided documentation in support of this.
The four Borough Presidents’ Offices written responses have been fully considered and, where relevant, changes and comments have been added to the report.
The full texts of the four Borough Presidents’ Offices responses are included as addenda to this report.
Detailed Findings
For the 2023 Community Board Membership Application period, each of the five Borough Presidents’ Offices made efforts to seek out people of diverse backgrounds to apply for Community Board membership, as required by the City Charter. Those efforts included posting applications on social media platforms, promoting Community Board Membership Applications during interviews, meetings, and events, and providing applications and social media kits to City Council members, Community Boards, and community-based organizations and asking them to share with their networks.
Some Borough Presidents’ Offices also reported that they conducted targeted outreach to seek out Hispanic/Latino residents, Asian residents, younger residents, residents with disabilities, and residents with less formal education.
The five Borough Presidents’ Offices made Community Board Membership Applications available on their respective websites as required by the City Charter, and applicants were able to complete and submit applications online. Furthermore, those applications generally included the option to provide demographic information such as race/ethnicity, gender, and age.
The QBPO considered, as required by the City Charter, whether the aggregate of Community Board member appointments were representative of the communities they serve. The QBPO accomplished this by comparing Community Board member demographic profiles to ACS or Department of City Planning (DCP) community district profiles.
The BBPO and MBPO also compared Community Board member demographic profiles to ACS and DCP profiles to assess whether appointments were representative. However, the BBPO and MBPO relied on incomplete demographic data. The BBPO’s analysis did not include available demographic data, such as race/ethnicity and gender, for approximately 20% of Community Board members, and MBPO’s analysis did not include such information for approximately 9% of members. The MBPO reported that the office also considered Community Board District Managers’ input regarding diversity needs such as participation from public housing residents, people with disabilities, and people with marginalized identities.
The BXBPO stated that the office reviewed demographic data for each Community Board and appointed members based on their qualifications and experience while considering characteristics to ensure diversity. However, the BXBPO did not compare each Community Board’s composition to Community District demographic profiles to determine whether boards were representative. The SIBPO did not report considering whether Community Board member appointments were representative of the Community District.
Despite the Borough Presidents’ Offices’ efforts to seek out people with diverse backgrounds to apply for Community Board membership, collect applicants’ demographic information, and consider Community Board and district demographic profiles when appointing members, the data suggests that further efforts are needed for the offices to meet their stated goals of ensuring that Community Boards reflect the diversity of the communities that they serve.
Based on the audit team’s comparison of the 2023 Community Board member demographic data voluntarily disclosed on membership applications to ACS data and NYC Equitable Development data, certain communities were underrepresented in the aggregate and/or at the district level.[4] This means that such groups lack equitable representation on Community Boards and the opportunity to vote on matters that come before boards.
Across each of the five boroughs, Hispanic/Latino residents, Asian residents, LGBTQIA residents, younger residents, residents with less formal education, and residents with disabilities were underrepresented in the aggregate and/or on certain Community Boards. This likely stems from larger, systemic challenges with recruiting Community Board members in those demographic groups and the need for assistance and a coordinated Citywide effort to attract diverse applicants.
The audit also found indications that the ratio of reappointments to the appointment of new applicants played a role in limiting diversity in some cases. This is because term limits that were also mandated as part of the slate of amendments adopted to support fully representative Community Boards will not go into full effect for several more years.
Community Board members appointed or reappointed in 2019 will not reach their term limits until 2027, and members appointed or reappointed in 2020 will not reach their limits until 2030. Since there may be significant turnover due to approaching term limits, there is an opportunity for the five Borough Presidents’ Offices to coordinate, and the City to assist in, raising awareness of the role of Community Boards and underrepresented demographic groups and develop Citywide outreach strategies to attract potential applicants from such groups.
For Staten Island Community Boards, diversity may also be limited because the SIBPO did not fill 38 of the 150 (25.3%) Community Board member positions. The SIBPO did not fill 20 vacancies for Community Board 2, 15 vacancies for Community Board 3, and three vacancies for Community Board 1. During Calendar Years 2022 and 2023, the SIBPO received six and nine applications for Community Boards 2 and 3 from individuals who were not appointed, respectively, which included applications from younger residents and residents who identified as Asian Alone and female.
While disparities exist at the district level, in general, public housing residents are fairly represented boroughwide on Community Boards in the Bronx, Brooklyn, Manhattan, and Queens. Staten Island is the notable exception, with no residents serving on Community Boards.
Regarding the City Charter-mandated annual reporting on Community Boards, none of the five Borough Presidents’ Offices submitted reports to the Mayor and City Council Speaker or posted the Demographic Report in a timely manner, and did not report all required information when the reports were submitted. In particular, the five Borough Presidents’ Offices did not report Community Board members’ appointment and reappointment dates and length of service, and did not fully describe the actions the offices took to seek out candidates from diverse backgrounds . Incomplete reporting reduces the transparency of recruitment processes and board composition that should be readily accessible to the public, the Mayor, and the City Council.
The audit also found that for most Community Boards in Queens and Staten Island, the Borough Presidents did not assure that appointees fairly represented neighborhoods throughout the Community District. Further, while the BXBPO, BBPO, and MBPO generally assured adequate geographic representation on Community Boards, representation for a small number of boards could be improved. Community Boards comprise wide geographic areas, and the interests and concerns of one neighborhood may not necessarily align with another.
Based on a review of Community Board Membership Application data, the five Borough Presidents’ Offices generally appointed individuals who have a residence, professional, or other significant interests in the district to which they applied to serve. However, in some cases, the BXBPO, BBPO, MBPO, and QBPO appointed members who were not eligible to serve. If applicants who do not meet eligibility requirements are appointed to serve, opportunities for those who should serve are reduced.
Additionally, in some cases, the Borough Presidents’ Offices reappointed members who missed the majority of general board meetings. Reappointing members with poor attendance records reduces community representation. Members who do not attend board meetings are not able to effectively advocate for the needs of their districts, participate in general board meetings, committee meetings, or public hearings on matters affecting the district. This also increases the risk that Community Boards will not meet quorum at general board meetings and committee meetings, preventing boards from conducting business and voting on matters before the boards.[5]
Detailed summaries of categories and issues follow for each of the five Borough Presidents’ Offices. Statistical findings are detailed in the Appendix.
Race/Ethnicity
Overall, the audit found significant disparities between the racial/ethnic makeup of Community Boards and the communities these boards are charged with representing, in particular the underrepresentation of Hispanic/Latino and Asian residents.
Based on the audit team’s comparison of the 2023 Community Board member demographic data voluntarily disclosed on membership applications to ACS data, Hispanic/Latino residents were underrepresented in the aggregate in all five boroughs. At the district level, Hispanic/Latino residents were underrepresented by 10% or more on 43 of the 59 (72.9%) Community Boards. These disparities are most significant in the Bronx.
Additionally, Asian residents were underrepresented in the aggregate in Brooklyn, Queens, and Staten Island and significantly underrepresented on 9 of the 35 (25.7%) Community Boards in those boroughs.
Analyses of recent Community Board applicants found similar disparities .
This data suggests larger systemic recruiting challenges for Hispanic/Latino residents and Asian residents and that further efforts are needed to achieve representative Community Boards. To that end, the audit highlights the below-listed best practices and recommends that each of the five Borough Presidents’ Offices implement them or continue to follow them.
- Seek assistance from the CEC and Mayor’s Office of Immigrant Affairs (MOIA) in developing outreach strategies for Hispanic/Latino residents and Asian residents.
- Make the Community Board Membership Application available in both English and Spanish (BXBPO) as well as other languages widely spoken in the City.
- Make efforts to get coverage in Spanish, Chinese, and English language media outlets to publicize the Community Board Membership Application (MBPO).
- Promote the Community Board Membership Application at events hosted by Borough Presidents and interviews with Borough Presidents (BXBPO, BBPO , MBPO, QBPO, and SIBPO).
- Share Community Board Membership Applications with Community Boards, elected officials, and community-based organizations, provide them with promotional materials, and ask them to post and distribute applications (BXBPO, BBPO , MBPO, QBPO, and SIBPO).
- When promoting the Community Board Membership Application, raise awareness of underrepresented demographic groups and encourage them to apply.
A breakdown of the racial/ethnic makeup of each borough’s Community Board members follows. For a more comprehensive analysis, please see Appendices 1–5, Chart I and Table I.
The Bronx
Bronx residents who identify as Hispanic/Latino are underrepresented in the aggregate as shown in Appendix 1, Chart I and Table I. Bronx residents who identified as Hispanic/Latino Alone accounted for 56.4% of the population. However, only 20.6% of Community Board members and 21.2% of applicants identified in the same way. [6], [7]
At the district level, residents who identify as Hispanic/Latino Alone were underrepresented by 10% or more on each of the 12 Bronx Community Boards.
The Bronx Borough President stated in the Strategic Policy Statement in September 2022 that “56.4 percent of Bronxites identified as Hispanic or Latino, so clearly more must be done to recruit board members from that community.” The Borough President also stated that “the Office of the Borough President will expand its communications and marketing, including through an increased presence in Spanish language media and social media.”
Since then, the BXBPO made the 2023 Community Board Membership Application available in both English and Spanish. In the 2023 Demographic Report, the BXBPO stated that “the office works diligently to make the application available as widely as possible, sending it out to community members through various channels, posting it on our website in English and Spanish, and making physical copies available in the office.”
In response to this audit, BXBPO officials stated that the Borough President took office in January 2022 and inherited Community Board members who were appointed by prior administrations. Since then, the office has prioritized addressing board underrepresentation. Additionally, BXBPO officials stated that the COVID-19 pandemic affected recruitment and that they can only appoint from the pool of applications that they receive. Further, the office is conducting a targeted outreach and publicity campaign to reach underrepresented groups.
In addition, the BXBPO stated that 17% of Community Board members did not disclose their race/ethnicity which could make a difference in the outcome . This rate is significantly higher than the other boroughs. BXBPO officials stated that they expected to get a better response rate with the implementation of an online application process .
Brooklyn
Brooklyn residents who identify as either Hispanic/Latino Alone or Asian Alone are underrepresented in the aggregate, as shown in Appendix 2, Chart I and Table I. Brooklyn residents who identify as Hispanic/Latino Alone account for 18.8% of the population. However, only 6.8% of Community Board members identified in the same way.[8] [9] Additionally, Brooklyn residents who identify as Asian Alone account for 12.1% of the population, but only 5.7% of Community Board members identified in the same way.[10]
At the district level, residents who identify as Hispanic/Latino Alone were underrepresented by 10% or more on 13 of the 18 (72.2%) Brooklyn Community Boards.[11] Residents who identify as Asian Alone were significantly underrepresented on four (22.2%) boards.[12]
Of Community Board applicants, just 5.3% identified as Hispanic/Latino Alone. Similarly, only 5.4% of applicants identified as Asian Alone.
In response to this audit, BBPO officials acknowledged that certain demographic groups were underrepresented and stated that “for a variety of historical and systemic reasons, community boards have not been representative.” Additionally, BBPO officials committed to making improvements over time, stating, “[The Borough President] is actively engaged in reaching underrepresented populations through a targeted outreach and publicity campaign, building on the success of the 2022–23 application period” and that changing Community Board membership is a gradual process.
The BBPO reported that its targeted outreach plan for racial and ethnic groups includes outreach at libraries and networking with the organizations that support these populations. In addition, the BBPO used LinkNYC kiosks throughout Brooklyn and deployed a street team to post flyers and distribute posters.
Manhattan
Manhattan residents who identify as Hispanic/Latino Alone are underrepresented in the aggregate, as shown in Appendix 3, Chart I and Table I. Manhattan residents who identified as Hispanic/Latino Alone accounted for 26.4% of the population. However, only 11.1% of Community Board members. and 7.9% of board applicants identified in the same way. [13], [14]
At the district level, residents who identify as Hispanic/Latino Alone are underrepresented by 10% or more on 4 of the 12 (33.3%) Manhattan Community Boards.[15]
The MBPO expressed concerns with these percentages on the basis that some Community Board members did not voluntarily disclose their race/ethnicity and that Community Board members who identified as two or more races/ethnicities included members who identified in part as Latina/o/x/Hispanic.
Nonetheless, in the 2022 and 2023 Demographic Report, the MBPO acknowledged that “there is still much work to be done to increase broad representation.” Additionally, the report stated that the MBPO believes that through expanded outreach, thoughtful consideration of applicants, and future appointments, Manhattan Community Boards “can become a more powerful tool in uplifting overlooked and underserved communities.”
Queens
Queens residents who identify as either Hispanic/Latino Alone or Asian Alone are underrepresented in the aggregate, as shown in Appendix 4, Chart I and Table I. Queens residents who identified as Hispanic/Latino Alone accounted for 28.1% of the population. However, only 9.2% of Community Board members identified in the same way.[16], [17] Additionally, Queens residents who identified as Asian Alone accounted for 25.6% of the population, but only 16.8% of Community Board members identified in the same way.[18]
On the other hand, White residents were generally overrepresented. Queens residents who identified as White Alone accounted for 23.7% of the population, while 34.5% of Community Board members reported that they were White.[19]
At the district level, residents who identify as Hispanic/Latino Alone were underrepresented by 10% or more on 11 of the 14 (78.6%) Queens Community Boards, and residents who identify as Asian Alone were significantly underrepresented on five (35.7%) boards.[20], [21]
While Queens residents who identify as Hispanic/Latino Alone account for 28.1% of the population, only 8.4% of applicants identified in the same way. Similarly, Queens residents who identify as Asian Alone account for 25.6% of the population but only 14.5% of applicants identified the same way.
The QBPO stated that the office agrees that Community Boards should more closely reflect the demographics of the communities they represent and has spent three years working to ameliorate this issue. The office implemented policies to solicit and appoint members from underrepresented demographic groups with the goal of gradually lessening disparities. The QBPO stated that “demographic disparities emerged and entrenched over decades of appointments made by prior administrations and will take multiple years to fully ameliorate.”
In addition, the QBPO stated that the Charter requires that at least one half of Community Board member appointments come from City Council member nominations. Each year, the QBPO recommends that Council Members nominate applicants from underrepresented groups.
The QBPO also noted that the office voluntarily enacted a policy to prioritize appointing members “from groups that have been historically underrepresented on community boards, with the goal of gradually lessening demographic disparities.” The QBPO also raised legal concerns about declining to reappoint Community Board members who are actively engaged and contributing to the board purely for demographic reasons. As noted above, this is part of the reason that the 2018 Charter Revision Commission proposed term limits for Community Board members.
Staten Island
Staten Island residents who identify as either Hispanic/Latino Alone or Asian Alone are underrepresented in the aggregate, as shown in Appendix 5, Chart I and Table I. Staten Island residents who identified as Hispanic/Latino Alone accounted for 18.7% of the population. However, only 1.8% of Community Board members identified in the same way.[22], [23] Additionally, Staten Island residents who identified as Asian Alone accounted for 11.4% of the population, but only 4.5% of Community Board members identified in the same way.[24]
On the other hand, White residents were overrepresented. Staten Island residents who identified as White Alone accounted for 57.5% of the population, while 73.2% of Community Board members reported that they were White.[25]
At the district level, residents who identified as Hispanic/Latino Alone and Asian Alone were underrepresented on all three Staten Island Community Boards.
While Staten Island residents who identify as Hispanic/Latino Alone account for 18.7% of the population, only 4.5% of applicants identified in the same way. Similarly, Staten Island residents who identify as Asian Alone account for 11.4% of the population but only 6% of applicants identified the same way.
In the 2023 Demographic Report, the SIBPO stated that it is “the Borough President’s goal to ensure that its local community boards are representative of diverse perspectives and opinions” and that it “look[s] forward to continuing to appoint various civic minded members in the future.” SIBPO officials acknowledged the underrepresentation of Hispanic/Latino residents. The SIBPO stated that it maintains a good relationship with local Hispanic churches and has been encouraging church members to apply. However, SIBPO officials did not address underrepresentation of Asian residents or indicate any specific outreach efforts to Asian residents.
In addition, SIBPO officials stated that the number of Community Board members is small and that being off by one or two members can result in significant under- or overrepresentation percentage. However, as detailed in Appendix 5, Table I, Hispanic/Latino residents and Asian residents were significantly underrepresented in the aggregate—by 16.9% and 6.9%, respectively. One or two members would not in fact skew percentages so dramatically, as the SIBPO suggests.
Gender/Gender Identity
The ACS, which provides community-level data, and the Borough Presidents’ Offices collect and report gender data differently. ACS captures only female or male. While ACS includes a question that intends to capture current sex, with the options of female and male, there are no questions about gender, sexual orientation, or sex at birth.[26] The Borough Presidents’ 2023 Community Board Membership Applications provided additional gender identity options.[27]
Given this discrepancy, the auditors could only conduct comparative analysis at the Community Board-level of people who answered female or male in the Borough Presidents’ questionnaires to those categories in the ACS. For those who identified as gender non-binary/gender non-conforming (and below for LGBTQIA status) on Community Board applications, the auditors offer the broader comparison of the New York State Department of Health’s Behavioral Risk Factor Surveillance System (BRFSS) for New York City for 2019-2020.[28]
The audit found that women and men were generally fairly represented in the aggregate on Brooklyn and Manhattan Community Boards. However, gender disparities between Community Boards and the neighborhoods they represent exist in the other boroughs.
At the district level, there are disparities across each of the five boroughs with little uniformity in representation. Some Community Boards exhibit imbalances between men and women, with both men and women underrepresented from board to board.
Manhattan Community Boards were most representative of their neighborhoods with respect to gender—residents were generally fairly represented in the aggregate and only 2 of the 12 Community Boards had significant disparities in representation (Community Boards 5 and 6). Conversely, disparities were most dramatic in Staten Island. Women were significantly underrepresented in the aggregate and on each of the three Community Boards.
Based on Community Board Membership Application data, between 0.4 % and 1.3 % of Community Board members in the Bronx, Brooklyn, Manhattan, and Queens identified as gender non-conforming or a gender other than female or male. No Staten Island Community Board members identified in this way. According to the NYS Department of Health’s BRFSS survey, 0.6% of residents of New York City identify as transgender.
None of the five Borough Presidents’ Offices conducted targeted outreach for underrepresented gender groups.
The audit highlights the below-listed best practices and recommends each of the five Borough Presidents’ Offices implement them or continue to follow them.
- Ensure that data used to consider whether groups are fairly represented, inform outreach, and publicly report boroughwide and Community Board demographic representation is complete, i.e., that it includes all demographic data voluntarily disclosed on Community Board Membership Applications (QBPO).
- Compare Community Board member demographic data voluntarily disclosed on membership applications to ACS data prior to making new appointments and reappointing existing members to identify underrepresented groups and inform appointments and future outreach efforts with respect to race/ethnicity, gender, age, educational attainment, public housing, and disability status (BBPO, MBPO, QBPO).
- Prioritize appointments of underrepresented groups and ensure that boards are representative of the communities they serve.
- Share the results of demographic analysis with City Council members and recommend that members nominate applicants from underrepresented groups (QBPO).
- Meet with Community Board Chairs and District Managers at the outset of the Community Board member appointment process to discuss board composition and diversity (MBPO).
A breakdown of the gender makeup of each borough’s Community Boards follows. For a more comprehensive analysis, please see Appendices 1–5, Chart II.
The Bronx
It appears that men may be underrepresented while women are fairly represented in the aggregate. Bronx residents who identified as male accounted for 47.4% of the population. However, only 35% of Community Board members identified as male as shown in Appendix I, Chart II.[29] Bronx residents who identified as female accounted for 52.6% of the population, and 49.3% of Community Board members identified as female as shown in Appendix I, Chart II.
At the district level, it appears that both female and male residents are underrepresented by 10% or more on some Bronx Community Boards. For example, male residents account for 46.9% of the population in Community Board 4, but only 31.3% of Community Board members identified as male. Conversely, female residents account for 51.3% of the population in Community Board 10, but only 37% of members.
Two of the 540 (0.4%) Bronx Community Board members identified as gender non-conforming or a gender other than female or male. According to the NYS Department of Health’s BRFSS survey, 0.6% of residents of New York City identify as transgender.
After the auditors discussed the findings with the BXBPO, officials expressed concern that the data is flawed because 15.4% of the Community Board members did not disclose their gender.
Brooklyn
Female and male residents are fairly represented boroughwide. Brooklyn residents who identify as female account for 52.4% of the population and male residents account for 47.6% of the population, whereas 48.3% and 44.6% of Community Board members identified as female and male, respectively, as shown in Appendix 2, Chart II.[30]
However, at the district level, both female and male residents are underrepresented by 10% or more on 9 of the 18 (50%) Brooklyn Community Boards: female residents on 5 of the 18 boards ( 6, 11, 12, 14, and 15), and male residents on 4 of 18 boards ( 2, 9, 13, and 16). For example, female residents account for 49.1% of the population in Community Board 12, but only 20.4% of Community Board members identified as female. Conversely, male residents account for 44.3% of the population in Community Board 16, but only 26% of members.
Ten of the 891 (1.1%) Brooklyn Community Board members identified as gender non-conforming or a gender other than female or male. According to the NYS Department of Health’s BRFSS survey, 0.6% of residents of New York City identify as transgender.
Manhattan
Female and male residents are generally fairly represented boroughwide. Manhattan residents who identified as female accounted for 52.4% of the population and male residents accounted for 47.6% of the population, whereas 48.6% and 47.5% of Community Board members identified as female and male, respectively, as shown in Appendix 3, Chart II.[31]
At the district level, female residents are underrepresented by 10% or more on 2 of the 12 (16.7%) Manhattan Community Boards (5 and 6).
Eight of the 630 (1.3%) Manhattan Community Board members identified as gender non-conforming or transgender. According to the NYS Department of Health’s BRFSS survey, 0.6% of residents of New York City identify as transgender.
Queens
Female residents are underrepresented boroughwide. Queens residents who identified as female accounted for 51.1% of the population and male accounted for 48.9% of the population, whereas 44.5% and 50.8% of Community Board members identified as female and male, respectively, as shown in Appendix 4, Chart II.[32]
At the district level, both female and male residents are underrepresented by 10% or more on 7 of the 14 (50%) Queens Community Boards: female residents on 5 of the 14 boards (5, 7-10) and male residents on two boards (4 and 12). For example, female residents account for 52.1% of the population in Community Board 7, but only 28% of Community Board members identified as female. Conversely, male residents account for 50.9% of the population in Community Board 4, but only 35.6% of members.
Five of the 695 (0.7%) Queens Community Board members identified as gender non-binary or gender non-conforming. According to the NYS Department of Health’s BRFSS survey, 0.6% of residents of New York City identify as transgender.
QBPO officials acknowledged disparities on certain boards and stated that the office has taken steps to address them. QBPO officials stated that the office prioritizes appointments from underrepresented groups and reported “more than half (51.3%) of [ the Borough President’s] new appointees across his three community board application cycles have been women.” However, based on the auditors’ review of 2022 and 2023 appointees, the QBPO did not appoint a higher percentage of female residents in the aggregate or on the seven Queens Community Boards cited for significant underrepresentation.
Staten Island
Female residents are significantly underrepresented boroughwide. Staten Island residents who identified as female accounted for 50.8% of the population and male accounted for 49.2% of the population, whereas 28.6% and 70.5% of Community Board members identified as female and male, respectively, as shown in Appendix 5, Chart II.[33]
At the district level, female residents were underrepresented on all three Community Boards. For example, female residents account for 50.7% of the population in Community Board 3, but only 20% of the 2023 Community Board members identified as female and 14.3% of applicants identified as female.
None of the 112 Staten Island Community Board members identified as gender non-conforming or transgender. According to the NYS Department of Health’s BRFSS survey, 0.6% of residents of New York City identify as transgender.
After the auditors discussed the findings with the SIBPO, officials expressed strong interest in appointing more females to the Community Boards.
LGBTQIA
For 2023 Community Board Membership Applications, the Bronx, Manhattan, Queens, and Staten Island Borough Presidents’ Offices allowed applicants to voluntarily disclose other background information about themselves, including LGBTQIA status.[34] The Brooklyn Borough President’s Office started to collect this information on the 2024 Community Board Membership Application .
However, as noted above under Gender/Gender Identity, the ACS does not capture and report such data. Therefore, the auditors could not conduct comparative analysis at the Community Board level to determine whether LGBTQIA residents are fairly represented. Instead, the auditors offer the broader comparison of the New York State Department of Health’s BRFSS for New York City for 2019–2020.[35]
Four out of the five Borough Presidents’ Offices did not conduct targeted outreach for LGBTQIA residents. SIBPO officials reported that the office conducted outreach to the LGBTQIA community which resulted in the appointment of three Community Board members.
The Bronx
Based on 2023 Community Board Membership Application data, 22 of the 301 (7.3%) members who were appointed or reappointed identified as LGBTQIA. According to the NYS Department of Health’s BRFSS survey, 9.2% of residents of New York City identify as lesbian, gay, bisexual, other sexual orientation (LGBO).
Brooklyn
The Brooklyn Borough President’s Office did not collect LGBTQIA status on its 2023 Community Board Application. It started to collect this information on the 2024 Community Board Membership Application .
Manhattan
Based on 2022 and 2023 Community Board Membership Application data, 49 of the 630 (7.8%) members who were appointed or reappointed identified as LGBTQIA. According to the NYS Department of Health’s BRFSS survey, 9.2% of residents of New York City identify as LGBO.
Queens
Based on 2022 and 2023 Community Board Membership Application data, 35 of the 695 (5%) members who were appointed or reappointed identified as LGBTQIA. According to the NYS Department of Health’s BRFSS survey, 9.2% of residents of New York City identify as LGBO.
Staten Island
Based on 2022 and 2023 Community Board Membership Application data, 3 of the 112 (2.7%) members who were appointed or reappointed identified as LGBTQIA. According to the NYS Department of Health’s BRFSS survey, 9.2% of residents of New York City identify as LGBO.
Age
Overall, the audit found significant disparities in age representation, with 20–29-year-old residents underrepresented boroughwide and on all but one of the Community Boards in Brooklyn, Manhattan, Queens, and Staten Island. The auditors could not determine the age of Bronx Community Board members because the BXBPO Community Board Membership Application did not give applicants the option to disclose their age.
There was also underrepresentation of 30–39-year-old residents on certain Community Boards in Brooklyn (7 of the 18 boards), Queens (8 of the 14 boards), and Staten Island (two of the three boards).
The disparities were most dramatic in Staten Island, with residents between the ages of 20 and 59 underrepresented boroughwide, while residents aged 60 and above were overrepresented.
All five Borough Presidents’ Offices cited challenges with recruiting younger residents, such as relatively low numbers of applications, concerns with time commitments and other competing priorities, and the fact that they are more likely to move frequently, which potentially impacts eligibility.
The data and feedback suggest larger systemic recruiting challenges for younger residents. To that end, the audit highlights the below-listed best practices and recommends that each of the five Borough Presidents’ Offices implement them or continue to follow them.
- Seek assistance from the CEC, City University of New York (CUNY), and Department of Youth and Community Development (DYCD) in developing outreach strategies for younger residents.
- Use social media to promote the Community Board Membership Application (BXBPO, BBPO, MBPO, and QBPO).
- Use targeted advertising to reach underrepresented age groups (BBPO ).
- Conduct in-person presentations at high schools, colleges, and educational and youth organizations (BXBPO, BBPO, and SIBPO).
- Share Community Board Membership Applications with high schools, colleges, libraries, and educational and youth organizations, provide them with promotional materials, and ask them to post and distribute applications (BXBPO, BBPO, and MBPO).
- When promoting and publicizing the Community Board Membership Application, raise awareness of underrepresented demographic groups and encourage them to apply.
A breakdown of the age composition of each borough’s Community Boards members follows. For a more comprehensive analysis, please see Appendices 1–5, Chart III.
The Bronx
As previously stated, the City Charter requires Borough Presidents to make applications available on their websites which include the option to voluntarily disclose demographic information including age. The BXBPO’s 2022 Community Board Membership Application stated that demographic information “is requested to help ensure that community board composition adequately reflects the demographics of the area served. You are not required to answer these questions, but your response will help us ensure diverse and inclusive community boards.”
However, the BXBPO’s 2022 Community Board Membership Application did not give applicants the option to voluntarily disclose their ages or, in the alternative, their dates of birth or age range in brackets consistent with ACS. Instead, the BXBPO allowed applicants to disclose whether they were: 16 years old; 17 years old; 18–24 years old; 25–44 years old; 45–64 years old; or 65 years old or more. Therefore, the auditors could not determine whether Community Board members are representative of their districts with respect to age.[36]
The BXBPO has since revised its application but still does not give applicants the option to voluntarily disclose their ages. The BXBPO 2023 Community Board Membership Application gave applicants the option to voluntarily disclose whether they were 16–17 years old; 18–19 years old; 20–29 years old; 30–39 years old; 40–49 years old; 50–59 years old; 60–69 years old; or 70 years old or more.
Based on an analysis of data for Community Board members who were appointed or reappointed in 2023, the BXBPO appointed a lower percentage of residents between the ages of 20 to 29 years old as compared to the boroughwide percentage, as shown in Appendix 1, Chart III.[37]
Brooklyn
Brooklyn residents between the ages of 20 and 29 are underrepresented boroughwide, while residents 30 and older are generally overrepresented, as shown in Appendix 2, Chart III. Brooklyn residents between the ages of 20 and 29 account for 13.9% of the population. However, only 7.1% of the Community Board members fall within this age group.[38]
At the district level, residents between the ages of 20 and 29 are underrepresented on 17 of the 18 (94.4%) Brooklyn Community Boards—every board except for 18. Residents between the ages of 30 and 39 are also underrepresented on 7 of 18 (38.9%) boards—1, 4, 10, 11, 13, 15, and 18.
In both the 2022 and 2023 Demographic Reports, the BBPO acknowledged that Community Board members historically tend to be older than the districts they represent. In the 2022 Demographic Report, the BBPO stated that adding younger members was a challenge because the BBPO received only 17 applications from people 24 and younger, and most applicants were between 45 and 64 years old.
In the 2023 Demographic Report, the BBPO reported it used social media to promote the Community Board member application and implemented a publicity campaign which targeted youth ages 16–18 and young adults. This campaign included:
- Contacting 90 youth-focused organizations and networking with colleges;
- In-person and virtual presentations to high schools, colleges, and youth-oriented cultural and educational organizations; and
- Panel discussions with sororities and service organizations.
Based on Brooklyn Community Board Membership Application data, the BBPO did increase the number and the percentage of applicants who were 40 years old or younger. However, as Appendix 2, Chart III shows, the BBPO did not appoint enough residents between the ages of 20 and 29 to equitably represent this age group.
This is due in part to the practice of generally reappointing existing Community Board members unless they move out of the community district or miss a significant number of general board meetings. In 2022, the average age of Community Board members who were reappointed was 60 years old; in 2023 the average age of reappointed members was 58.
Manhattan
Manhattan residents between the ages of 20 and 29 are underrepresented boroughwide, while residents 30 and older are overrepresented, as shown in Appendix 3, Chart III.[39] Manhattan residents between the ages of 20 and 29 account for 16.1% of the population. However, only 8.3% of the Community Board members fall within this age group.[40]
At the district level, residents between the ages of 20 and 29 are underrepresented on all 12 of the Manhattan Community Boards.
The MBPO conducted targeted outreach to younger residents which included promoting the Community Board Membership Application on social media. Additionally, the MBPO emailed high school principals a link to the Community Board Membership Application and a flyer and asked principals to distribute them to students aged 16 and older.
In response to the audit, MBPO officials stated that the City Charter does not require proportional representation and that the office is prohibited from making appointments based on protected class or perceived protected class. Additionally, MBPO officials stated that despite their efforts, it is difficult to recruit younger people to serve on the Community Boards because of the time commitment required to attend Community Board meetings, which are held in-person during the evening. Further, officials stated that younger residents are more likely to move, which may impact their eligibility to serve on a Community Board. The difficulty in recruiting younger members in Manhattan was common to all five boroughs.
Queens
Queens residents between the ages of 20 to 29 are underrepresented boroughwide, while residents 40 and older are generally overrepresented, as shown in Appendix 4, Chart III.[41] Queens residents between the ages of 20 and 29 account for 12.4% of the population. However, only 4.6% of Community Board members fall within this age group.[42]
At the district level, residents between the ages of 20 and 29 are underrepresented on all 14 Queens Community Boards. Residents between the ages of 30 and 39 are also underrepresented on 8 of the 14 (57.1%) boards—1, 3, 5, 7, 10, 11,13, and 14.
In the 2023 Demographic Report, the QBPO stated that the office “doubled down on its efforts to reach a younger and more diverse applicant pool” and that outreach efforts included posting on various social media platforms. However, as in the other boroughs, the QBPO experienced difficulty attracting young people to serve on the board. The office is trying to engage with them and now has a youth council.
As with other boroughs, the practice of generally reappointing existing Community Board members unless they move out of the district or miss a large number of general board meetings can be an impediment to changing the overall composition of boards. For 2023, the average age of Community Board members who were reappointed was 59 years old. The QBPO officials also stated that it seems unfair to decline to reappoint Community Board members because of their age, which is a protected class.
Staten Island
Staten Island residents between the ages of 20 and 59 are underrepresented boroughwide, while Community Board members 60 and older are overrepresented, as shown in Appendix 5, Chart III. Staten Island residents between the ages of 20 and 59 account for 51.7% of the population. However, only 32.1% of the Community Board members fall within this age group.[43]
At the district level, residents between the ages of 20 and 59 were underrepresented on two of the three Community Boards, while residents aged 60 and above were overrepresented (Community Boards 2 and 3). Further, there were no residents between the ages of 20-29 on Community Board 3. In addition, residents between the ages of 20–29, and 40–59 were underrepresented on the remaining board (Community Board 1). This is due in part to SIBPO’s practice of generally reappointing existing Community Board members unless they move out of the district or miss numerous general board meetings. For 2023, the average age of Community Board members who were reappointed was 62 years old.
The SIBPO stated that the office brings awareness to joining the Community Boards each time the Borough President or staff attend events at high schools or colleges. Additionally, the SIBPO stated that although some younger members may express interest in serving on the Community Boards, they generally do not follow through once they become aware of the commitment required to serve.
In response to the audit, the SIBPO reiterated that recruiting younger residents—especially those between the ages of 16 and 22—is difficult due to this age group’s other priorities and commitments. SIBPO officials also explained that senior members tend to have more time to attend Community Board related meetings; therefore, they have been the majority on the boards.
Education
City residents with either some high school education or a high school diploma or equivalency are underrepresented on Community Boards boroughwide, while residents with either a bachelor’s degree or a master’s/doctoral degree are generally overrepresented. At the district level, this demographic is underrepresented or unrepresented on all Community Boards in Brooklyn, Manhattan, Queens, and Staten Island, and all three sampled boards in the Bronx.
Analyses of recent Community Board applicants found similar disparities . The BXBPO suggested that one possible challenge for recruiting such residents may be having to hold multiple jobs which could prevent them from attending required meetings. Additionally, the BBPO stated that there may be a misconception that residents need to have specialized skills to serve on Community Boards.
The data and feedback suggest larger systemic recruiting challenges for residents with less formal education. To that end, the audit highlights the below-listed best practices and recommends that each of the five Borough Presidents’ Offices implement them or continue to follow them.
- Seek assistance from the CEC in developing outreach strategies for residents with less formal education.
- Meet with unions and trade groups representing sectors such as retail, construction, and health and human services (BBPO and MBPO).
- When promoting the Community Board Membership Application, raise awareness of underrepresented demographic groups and encourage them to apply.
A breakdown of education levels of each borough’s Community Boards members follows. For a more comprehensive analysis, please see Appendices 1–5, Chart IV.
The Bronx
Bronx residents with some high school education or a high school diploma or equivalency account for 51% of Bronx residents. Based on a comparison of 2023 member demographic data from the three sampled Community Boards to ACS district data, Bronx residents with either some high school education or a high school diploma or equivalency are underrepresented on each of the three sampled boards, while residents with either a bachelor’s degree or a master’s/doctoral degree are overrepresented.[44]
For example, Community Board 12 residents with some high school education or a high school diploma or equivalency account for 53.3% of the population, but only 6.7% of Community Board members have the same level of education. Residents with a high school diploma or equivalency are underrepresented and residents with some high school education are not represented at all, while those with a bachelor’s degree or higher education level are overrepresented, as shown in Appendix 1, Chart IV.
Based on 2023 Bronx Community Board Membership Application data for the three sampled boards, the BXBPO received only seven applications from residents with some high school education or a high school diploma or equivalency living in the three Community Boards.
After the auditors discussed the findings with the BXBPO, officials stated that they will take the findings into consideration for future outreach efforts. Additionally, BXBPO officials stated that they can only appoint from the pool of applications received. Further, BXBPO officials stated that there may be reasons why residents with less formal education do not apply to serve on Community Boards. For example, officials stated that such residents may have multiple jobs and therefore do not have time to attend the required monthly General Board and Committee meetings.
Brooklyn
Brooklyn residents with either some high school education or a high school diploma or equivalency are underrepresented in the aggregate, while those with either a bachelor’s degree or a master’s/doctoral degree are generally overrepresented , as shown in Appendix 2, Chart IV. Brooklyn residents with some high school education or a high school diploma or equivalency account for 30.7% of Brooklyn residents, but only 5.6% of Community Board members have the same level of education.[45]
At the district level, residents with some high school education or a high school diploma or equivalency are underrepresented on all 18 boards. In particular, Community Boards 2, 6, and 8 do not have any board members with the same level of education.
In the 2022 and 2023 Demographic Reports , the BBPO acknowledged that Brooklyn residents with less formal education were underrepresented, but did not report any plans to increase representation through targeted outreach or other means. Based on Brooklyn Community Board Membership Application data for 2022 and 2023, only 3% and 7% of applicants had some high school education or a high school diploma or equivalency.
In response to the audit, BBPO officials stated that there is a misconception that Community Board members need to have specialized skills to serve on a board. Additionally, BBPO officials stated that the office was meeting with trade unions representing such sectors as retail, construction, and health and human services, to attract applicants with diverse professional backgrounds.
Manhattan
Manhattan residents with either some high school education or a high school diploma or equivalency are underrepresented in the aggregate, while those with either a master’s/doctoral degree or higher are overrepresented, as shown in Appendix 3, Chart IV. Manhattan residents with some high school education or a high school diploma or equivalency account for 22.8% of Manhattan residents. However, only 3.5% of Community Board members had the same level of education.[46]
At the district level, residents with some high school education or a high school diploma or equivalency are underrepresented on all 12 boards.
Based on Manhattan Community Board Membership Application data for 2023, only 1.5% and 1.2% of applicants had some high school education, or a high school diploma or equivalency.
After the auditors discussed the findings, MBPO officials stated they are constantly conducting outreach in settlement housing, public housing developments, and community-based organizations. The MBPO agrees that there are too many members that have higher education levels but stated that Community Boards are sometimes interested in members with specialized backgrounds, such as criminal justice reform, and often that means appointing a person with higher educational achievement. The MBPO officials also stated that they conducted outreach to unions and trade groups to try to recruit people with diverse educational backgrounds.
Queens
Queens residents with either some high school education or a high school diploma or equivalency are underrepresented in the aggregate, while those with either a bachelor’s degree or a master’s/doctoral degree are overrepresented, as shown in Appendix 4, Chart IV.
Queens residents with some high school education or a high school diploma or equivalency account for 32.7% of Queens residents. However, only 6.6% of Community Board members had the same level of education.[47] At the district level, residents with some high school education or a high school diploma or other equivalency are underrepresented on all 14 Community Boards.
Based on Queens Community Board Membership Application data for 2023, only 1% and 6% of applicants had some high school education, or a high school diploma or equivalency, respectively.
In response to the audit, the QBPO stated they do not consider educational attainment when selecting candidates for interviews, appointments, and reappointments. However, when it comes to appointments, the QBPO officials stated they looked at whether an applicant had a union or trade background. The QBPO officials stated they are not looking at parity between different demographic categories, they are looking more at the skill set or perspective a candidate is bringing to the board.
Staten Island
Staten Island residents with some high school education or a high school diploma or equivalency are underrepresented in the aggregate, while those who had a bachelor’s degree or a master’s/doctoral degree are overrepresented, as shown in Appendix 5, Chart IV.
Staten Island residents with some high school education or a high school diploma or equivalency account for 37% of Staten Island residents. However, only 6.3% of Community Board members had the same level of education.[48]
At the district level, residents with some high school education or a high school diploma or equivalency are underrepresented on all three Community Boards.
Based on Staten Island Community Board Membership Application data for 2023, only 9% of applicants had some high school education or high school diploma or equivalency. SIBPO officials acknowledged that most candidates that apply to the board have a bachelor’s degree or higher.
Public Housing
The audit found that, in general, New York City Housing Authority (NYCHA) residents are fairly represented boroughwide on Community Boards in the Bronx, Brooklyn, Manhattan, and Queens. Staten Island is the notable exception, with no residents serving on Community Boards.
However, disparities exist at the district level. Of the 33 Community Boards which have NYCHA developments located in their districts and where NYCHA residents account for at least 2% of the district population, NYCHA residents were fairly represented on 19 (57.6%) boards, underrepresented on 6 (18.2%) boards, and not represented on 8 (24.2%) boards.[49]
Analyses of 2023 Community Board Membership Application data found that only 102 NYCHA residents applied to serve on Community Boards Citywide. The Bronx received the most applications, 36, while Staten Island received only two.
The data suggests larger, systemic recruiting challenges for NYCHA residents. To that end, the audit highlights the below-listed best practices and recommends that each of the five Borough Presidents’ Offices implement them or continue to follow them.
- Conduct information sessions at NYCHA developments, targeting districts which are not represented and districts with many NYCHA residents (MBPO).
- Attend NYCHA Resident Association meetings and promote the Community Board Membership Application process (MBPO).
- Meet with NYCHA Resident Association Presidents and Councils, conduct presentations, provide them with promotional materials, and ask them to promote Community Board Membership Applications (BBPO).
- Appeal to NYCHA residents to apply to serve on Community Boards during interviews and in op-ed pieces (BBPO) .
- When promoting the Community Board Membership Application, raise awareness of underrepresented demographic groups and encourage them to apply.
A breakdown of public housing residency of each borough’s Community Boards members follows. For a more comprehensive analysis, please see Appendices 1–5, Chart V.
The Bronx
Bronx residents who live in NYCHA developments are fairly represented in the aggregate. Bronx residents who live in NYCHA developments account for 6.2% of the population, while 5.6% of Bronx Community Board members live in public housing.
Of the 12 Bronx Community Boards, 10 boards have NYCHA developments located in their districts and NYCHA residents account for at least 2% of each district’s population.[50] NYCHA residents are fairly represented on 7 of those 10 (70%) Community Boards—all except for boards 2, 6, and 11. Residents are underrepresented on Community Boards 6 and 11, and are not represented on Board 2, as shown in Appendix 1, Chart V .
The 2023 Demographic Report stated that the Bronx Borough President “took office in January 2021 committed to appointing a diverse and representative board in every community district. This goes beyond mere demographic diversity but also includes housing diversity (renters, public housing residents, homeowners, etc.).” However, the BXBPO needs to improve representation on Community Boards 2, 6, and 11.
Brooklyn
Brooklyn residents who live in NYCHA developments are fairly represented in the aggregate. Brooklyn residents who live in NYCHA developments account for 4.4% of the population. Similarly, 4.3% of Brooklyn Community Board members live in public housing.
Of the 18 Brooklyn Community Boards, 11 boards have NYCHA developments located in their districts and NYCHA residents account for at least 2% of each district’s population.[51] NYCHA residents are fairly represented on 7 of those 11 (63.6%) boards, all except for Community Boards 2, 3, 15, and 18.[52] Community Boards 2, 15, and 18 lack any members who live in NYCHA developments, as shown in Appendix 2, Chart V.
In the 2023 Demographic Report, the BBPO stated that its “outreach campaign focused on underrepresented voices, including NYCHA residents.” In support of this, the BBPO provided the auditors with documentation of :
- A series of emails sent to NYCHA Resident Association Presidents asking them to circulate a flyer promoting the Community Board application to NYCHA residents;
- A meeting with the Brooklyn East District Council of Resident Association Presidents which included a presentation on Community Boards; and
- Emails sent to Council Members and a community group asking for their assistance to promote the Community Board application to NYCHA residents and providing them with a flyer and social media toolkit to aid in outreach.
Additionally, the BBPO stated that the office’s print, radio, and television interviews and op-ed pieces included appeals for NYCHA residents to apply to Community Boards.
Despite those efforts, based on a review of the 2022 and 2023 application data for Brooklyn Community Boards 2, 3, 15, and 18 , the total number of applications submitted by NYCHA residents only increased from three in 2022, to four in 2023. For 2023, the BBPO received just one application for Community Board 3 and did not receive any applications from NYCHA residents living in Community Boards 15 and 18 . The BBPO received three applications from NYCHA residents living in Community Board 2 and interviewed two applicants but selected none.
BBPO officials stated that its outreach plan would in future include partnering with organizations that host events in NYCHA developments and scheduling presentations at Tenant Association meetings.
Manhattan
Manhattan residents who live in NYCHA developments are slightly underrepresented in the aggregate. Manhattan residents who live in NYCHA developments account for 6% of the population, while 4% of Manhattan Community Board members live in public housing.
Of the 12 Manhattan Community Boards, eight have NYCHA developments located in their districts and NYCHA residents account for at least 2% of each district’s population.[53] NYCHA residents are underrepresented on three of those eight Community Boards (7, 10, and 11) and are not represented at all on two boards (5 and 12), as shown in Appendix 3, Chart V.
MBPO officials stated that they are aware that NYCHA residents are underrepresented on Community Boards and have taken steps to address this. Since taking office, MBPO staff conducted information sessions at select NYCHA campuses. The MBPO targeted districts which had no NYCHA residents serving on Community Boards and districts with high numbers of NYCHA residents. MBPO staff also attended NYCHA resident meetings throughout the borough to promote the Community Board application process.
Based on Manhattan Community Board Membership Application data for 2022 and 2023, the total number of applications submitted by NYCHA residents increased from 23 in 2022, to 26 in 2023. From that pool of applicants, nine NYCHA residents were appointed in 2022 and six NYCHA residents were appointed in 2023.
Queens
Queens residents who live in NYCHA developments are fairly represented in the aggregate. Queens residents who live in NYCHA developments account for 1.4% of the population, while 1.7% of Queens Community Board members live in public housing.
Of the 14 Queens Community Boards, three have NYCHA developments located in their districts and NYCHA residents account for at least 2% of each district’s population.[54] NYCHA residents are fairly represented on two of the three Community Boards (1 and 14), as shown in Appendix 4, Chart V. NYCHA residents are not represented on Community Board 8.
QBPO officials stated that the office has a liaison for housing issues and shares announcements with NYCHA Resident Associations. However, the auditors’ review of the 2023 application data found that the QBPO received only 13 applications from NYCHA residents, which suggests that the QBPO’s outreach could be improved. Furthermore, the QBPO received only one application for Community Board 8 and the applicant was not selected.
Staten Island
Staten Island residents who live in NYCHA developments are not represented at all. Of the three Staten Island Community Boards, one has NYCHA developments located in the district and NYCHA residents account for at least 2% of the population.[55] However, NYCHA residents are not represented on this board (Community Board 1), as shown in Appendix 5, Chart V.
Based on a review of 2023 application data for Staten Island Community Board 1, the SIBPO received only two applications and did not interview the two applicants for possible appointment.
After the auditors discussed the findings with the SIBPO, officials stated that although it has been reaching out to NYCHA residents about Community Board membership, the SIBPO has been unsuccessful in its attempts at recruiting those residents.
Disability Status
The audit found that New Yorkers with disabilities are underrepresented to some degree in all five boroughs.[56] Disparities between the population of people with disabilities and Community Board members with disabilities vary by borough, ranging from -1.4% in Manhattan to -8.4% in Staten Island.[57]
At the district level, people with disabilities were underrepresented or not represented on 30 of the 47 (63.8%) Community Boards in Brooklyn, Manhattan, Queens, and Staten Island and all three sampled boards in the Bronx. Most notably, people with disabilities were underrepresented on one Staten Island Community Board and not represented on the remaining two boards.
The audit highlights the below-listed best practices and recommends each of the five Borough Presidents’ Offices implement them or continue to follow them.
- Seek assistance from the CEC and the Mayor’s Office for People with Disabilities in developing outreach strategies for residents with disabilities.
- Engage with disability rights organizations and advocacy groups (BBPO and MBPO).
A breakdown of the disability status of each borough’s Community Boards members follows. For a more comprehensive analysis, please see Appendices 1–5, Chart VI.
The Bronx
Bronx residents with disabilities account for 15.3% of the population. Bronx residents who identify as people with disabilities are underrepresented on each of the three sampled Community Boards (4, 11, and 12), as shown in Appendix 1, Chart VI.
The 2023 Demographic Report stated that “the Borough President will make appointments to the community boards based on the qualifications, experience, and profession of the applicants while taking into account characteristics to ensure diversity on the board” which included disability status. However, based on Bronx Community Board Membership Application data for 2023, the BXBPO received only five applications from disabled residents living in the three sampled boards.
After the auditors discussed the findings with the BXBPO, officials stated that when the Borough President took office in January 2022, the Disability Council was reinstated during the first year. The BXBPO relies on the Council to assist with outreach.
Brooklyn
Brooklyn residents who identify as people with disabilities are underrepresented. Brooklyn residents with disabilities account for 10.9% of the population. However, only 6% of Brooklyn Community Board members identify as a person with a disability.
At the district level, Brooklyn residents with disabilities are underrepresented on 11 of the 18 Brooklyn Community Boards, as shown in Appendix 2, Chart VI.[58]The BBPO maintained that people with disabilities are represented in the aggregate and stated, “All boards have at least one person who identified as having a disability.” In addition, BBPO officials stated that there may be more people with disabilities serving on the Community Boards who did not voluntarily disclose their disability status on the Community Board Membership Application. Because of this, the BBPO did not conduct targeted outreach to increase representation on certain Community Boards as it should have.
After the auditors discussed the findings with the BBPO, it stated that its outreach plan would include connecting with advocacy and social support organizations.
Manhattan
Manhattan residents who identify as people with disabilities are slightly underrepresented. Manhattan residents with disabilities account for 10% of the population, while 8.6% of Manhattan Community Board members identify as a person with a disability.
At the district level, Manhattan residents with disabilities are underrepresented on 7 of the 12 Manhattan Community Boards, as shown in Appendix 3, Chart VI.[59]
MBPO officials stated that they are aware that people who identify as having a disability have been historically underrepresented and that they engage with disability rights organizations to promote Community Board recruitment.
After the auditors discussed the findings with the MBPO, officials expressed concerns that the data may not accurately represent the members who identify as a person with a disability since there are applicants who choose not to disclose that information on the application. Additionally, MBPO officials stated that Community Board members may be a parent or caretaker of a person with a disability which may not be reflected in the data.
Queens
Queens residents who identify as people with disabilities are underrepresented. Queens residents with disabilities account for 10.3% of the population. However, only 7.3% Queens Community Board members identify as a person with a disability.
At the district level, Queens residents with disabilities are underrepresented on 9 of the 14 Community Boards, as shown in Appendix 4, Chart VI.[60]
The QBPO stated that it does not focus on the precise number of people who have a disability when compared to a given community. Instead, it values what in an applicant’s background would be important to have their voice on the board.
Staten Island
Staten Island residents who identify as people with disabilities are underrepresented on all three boards. Staten Island residents with disabilities account for 10.2% of the population. However, only 1.8% of Staten Island Community Board members identify as a person with a disability.
At the district level, Staten Island residents were underrepresented on one board (2) and not represented on two boards (1 and 3), as shown in Appendix 5, Chart VI.
Of the 67 applicants who applied to serve on Staten Island Community Boards in 2023, 63 (94%) voluntarily disclosed their disability status. Of those 63 applicants, only one identified as a person with a disability and was not appointed to the Community Board.
After the auditors discussed the findings with the SIBPO, officials stated that Community Board members may have not disclosed or have a different understanding of what disability means to them.
Annual Reporting Requirements
None of the five Borough Presidents’ Offices submitted and/or posted their 2023 Demographic Report by July 1 as required by the City Charter, and none of their prepared reports fully contained all required information when submitted.
The Bronx
The BXBPO did not timely post its 2023 Demographic Report and did not include all required information. Specifically:
- The BXBPO did not report Community Board members’ first date of appointment, dates of reappointment, and length of service. The BXBPO reported only the initial year that a Community Board member was appointed.
- The BXBPO generally reported demographic information for each Community Board in aggregate form, except for languages spoken.
- The BXBPO described actions the office took to reach high school and college students, and Hispanic/Latino residents. However, the BXBPO did not describe the methods used to seek out candidates from diverse backgrounds based on other demographic characteristics such as gender, disability status, or sexual orientation.
Brooklyn
The BBPO did not timely post its 2023 Demographic Report and did not include all required information. Specifically:
- The BBPO did not report Community Board members’ appointment dates, reappointment dates, length of service, and nominating party. The BBPO reported only the first year a Community Board member was appointed for those members appointed from 2010 to present. The BBPO did not report this information for Community Board members appointed prior to 2010. Additionally, the BBPO reported only the City Council district number and did not include the nominating City Council Member’s name.
- The BBPO did not report aggregate demographic information for each Community Board—including race, ethnicity, gender, age, disability status, sexual orientation, language, and geographic residence. Instead, Community Board members’ demographic information was reported in the aggregate for all 18 boards.
- The BBPO described actions the office took to reach Brooklyn residents ages 16 to 18, young adults, NYCHA residents, and immigrants to broaden diversity across socio-economic and geographic populations. However, the office did not describe the methods used to seek out candidates from diverse backgrounds based on other demographic characteristics such as race, ethnicity, gender, disability status, or sexual orientation.
After the auditors discussed the findings, the BBPO acknowledged that the Charter “requires the report to be issued by July 1” and stated that the BBPO “strives to adhere to the requirement.”
Manhattan
The MBPO did not prepare and post a Demographic Report in 2022, but instead issued a combined report that covered 2022 and 2023. The report was also not submitted to the Mayor and City Council or posted on the MBPO website by July 1 as required. MBPO officials stated that the office recently redesigned the Borough President’s website and did not post the Demographic Report until November 2023.
The Demographic Report also did not include all required information. Specifically:
- Community Board members’ initial appointment dates, reappointment dates, and lengths of service were not reported. The MBPO reported only the initial year a Community Board member was appointed, and only included this information for 477 of the 591 Community Board members listed on the report.
- The MBPO did not specify its recruitment plan and outreach methods with regards to gender, disability status, and sexual orientation.
Regarding appointment dates, MBPO officials stated that they did not report the initial appointment date or year for certain members because they were not confident in the records maintained by past administrations. However, the Charter requires that applications include past service on a Community Board, including prior appointment dates and number and length of prior terms served.
Queens
The QBPO did not timely post its 2023 Demographic Report and did not include all required information. Specifically:
- The QBPO did not report Community Board members’ nominating Council Member or other nominating party. The QBPO reported Yes or No for the nominated Council Member and did not include the nominating City Council Member’s name.
- The QBPO provided only a brief description of actions the office took to reach a younger and more diverse applicant pool, without describing the methods used to seek out candidates from diverse backgrounds based on other demographic characteristics such as race, ethnicity, gender, educational attainment, housing, disability status, or sexual orientation.
After the auditors discussed the findings with the QBPO, officials acknowledged the report’s findings and stated that the office will ensure that the 2024 Demographic Report is published by July 1 and includes nominating council members’ names and more information on recruitment.
Staten Island
The SIBPO did not timely post its 2023 Demographic Report or include all required information. Specifically:
- The SIBPO did not report appointment and reappointment dates. The SIBPO reported only the initial year a Community Board member was appointed.
- The SIBPO did not always accurately report the length of service for each Community Board member.
- The SIBPO did not provide a description of particular methods used to seek out candidates from diverse backgrounds based on demographic characteristics such as race, ethnicity, gender, educational attainment, housing, disability status, or sexual orientation.
In addition, although applicants can complete and submit Community Board Membership Applications online, the SIBPO does not maintain a centralized, electronic database of applications received including applicants’ prior appointment and demographic information. Instead, SIBPO officials stated that staff print applications and manually compile information included in the Demographic Report. This is inefficient and may lead to errors in public reporting of Community Board members’ demographic data and the number of applications received.
Geographic Representation
In making Community Board member appointments, the City Charter states that the Borough Presidents must “assure adequate representation from the different geographic sections and neighborhoods within the community district” and “consider whether the aggregate of appointments fairly represents all segments of the community.”
The QBPO and SIBPO did not assure adequate geographic representation on Community Boards. Further, while the BXBPO, BBPO, and MBPO generally assured adequate geographic representation on Community Boards, representation for four boards could be improved.
Further information on the geographic representation of each borough’s Community Boards members follows.
The Bronx
The BXBPO assured adequate geographic representation on 11 of the 12 Bronx Community Boards—all except for Community Board 9. This board includes three neighborhoods—Parkchester, Castle Hill-Unionport, and Soundview-Clason Point. As shown in Appendix 1, Exhibit I, Castle Hill-Unionport and Soundview-Clason Point are underrepresented.
Brooklyn
The BBPO assured adequate geographic representation on 16 of the 18 Brooklyn Community Boards. Geographic representation was not assured on two of the boards—Community Boards 10 and 13 . For example, Community Board 10 includes two neighborhoods—Bay Ridge and Dyker Heights. As shown in Appendix 2, Exhibit I, Dyker Heights is underrepresented.
After the auditors discussed the findings with BBPO, officials acknowledged issues with geographic representation and stated that they did not have the staff capacity to map applicants’ addresses which would allow them to identify gaps in geographic representation. The BBPO has since hired dedicated staff for this purpose and is currently mapping applicants’ addresses to reduce clusters and disperse membership when making new appointments.
Additionally, the BBPO stated that its outreach plan for underrepresented geographic areas would include posting flyers in community spaces and connecting with community organizations such as houses of worship, volunteer groups, and social services . The BBPO also stated that the office has been reaching out to District Managers and civic organizations in underrepresented areas to try to attract new applicants.
Manhattan
The MBPO assured adequate geographic representation for 11 of the 12 Manhattan Community Boards—all except for Community Board 9. This board consists of the following neighborhoods: Hamilton Heights, Manhattanville, Morningside Heights, and Sugar Hill. As shown in Appendix 3, Exhibit I, there were higher concentrations of members from Hamilton Heights, Manhattanville, and Sugar Hill, and less representation from the Morningside Heights neighborhood.
MBPO officials stated the MBPO primarily relied on Community Board Chairs’ and District Managers’ input and mapped board members’ addresses for only certain Community Boards.
After the auditors discussed the findings with the MBPO, officials stated that they are aware of the issues with geographic representation. During the appointment process, MBPO officials meet with Community Board leadership multiple times to discuss various factors to be considered when making appointments including geographical representation.
Regarding Community Board 9, MBPO officials said that Morningside Heights is largely comprised of the Columbia University campus, and they have a difficult time recruiting applicants from this neighborhood because the population is mostly students who may be transient and lack the time to attend Community Board meetings.
Queens
The QBPO did not assure adequate geographic representation on 13 of the 14 Queens Community Boards—all boards except for Community Board 14. For example, Queens Community Board 3 includes three neighborhoods—East Elmhurst, Jackson Heights, and North Corona. As shown in Appendix 4, Exhibit I, north Jackson Heights (outlined in red) and North Corona (outlined in red) are underrepresented.
The QBPO did not map existing Community Board members’ addresses or use other tools which would assure adequate geographic representation.
After the auditors discussed the findings with the QBPO, officials stated the office uses “council districts as a metric to ensure adequate geographic diversity and adequate representation on each board” and that they “additionally solicit feedback from council members […] in order to refine geographic representation.”
The QBPO officials also stated that they may not have received applications from residents in certain geographic areas. However, the auditors mapped applicants’ addresses and found that people from underrepresented geographic areas applied but were not appointed to boards.
Staten Island
The SIBPO did not assure adequate geographic representation on all three Staten Island Community Boards. For example, Staten Island Community Board 2 includes 15 neighborhoods—New Springville, Willowbrook, Bulls Head, Travis, Grasmere, Arrochar, South Beach, Dongan Hills, Todt Hill, Emerson Hill, Lighthouse Hill, Manor Heights, New Dorp, Midland Beach, and Freshkills Park North. As shown in Appendix 5, Exhibit I, New Springville, Willowbrook, Bulls Head, and Travis (outlined in red) are underrepresented.
In the 2023 Demographic Report, the SIBPO stated that it “seeks to ensure each community board’s areas are proportionately represented in each Staten Island board.” However, the SIBPO did not map existing Community Board members’ addresses or use other tools which would assure adequate geographic representation. Vacancies are typically filled with community members who are from the same area as members who previously held the position.
After the auditors discussed the findings with the SIBPO, officials referenced the City’s Corporation Counsel ruling #108588 and stated that it is not required to ensure the percentage of Community Board members from each community district is proportionate to the percentage of the population residing within that area. However, this Corporation Counsel ruling also affirms the City Charter requirement for “adequate representation from the different geographic sections and neighborhoods.”
SIBPO officials also stated that they will not refuse anyone’s interest in joining the Community Boards simply because the geographic representation requirement has been met in specific areas. However, this practice further skews the geographic representation of all Community Boards.
Appointment of Board Members Who Were Not Eligible to Serve
Based on a review of Community Board Membership Applications, the five Borough Presidents’ Offices generally appointed individuals who have a residence, professional, or other significant interests in the district to which they applied to serve. However, in some cases, the BXBPO, BBPO, MBPO, and QBPO appointed members who were not eligible to serve. The percentage of total ineligible members varied by borough, ranging from 4.3% in the Bronx to 1.4% in Manhattan.
Further information on the eligibility of each borough’s Community Boards members follows.
The Bronx
Of the 540 Bronx Community Board members who were appointed or reappointed in 2022 or 2023, 23 (4.3%) members may not reside or have a professional or other significant interest in the district.
The BXBPO stated that two Community Board members were no longer serving on boards. For the remaining 21, the BXBPO generally provided new addresses for members’ residential, professional, or other significant interest or provided a new basis for members’ eligibility to serve. However, this information was not included in members’ Community Board Membership Applications or other BXBPO documents containing members’ addresses and basis for eligibility. This indicates that the BXBPO did not vet applicants as it should have.
After the auditors discussed the findings with the BXBPO, officials stated that the office works hard to ensure that members are eligible to serve on Community Boards. The BXBPO requires applicants to upload “proof of address” such as a driver’s license, passport, student ID, or utility bill. Additionally, the BXBPO is working to implement a system edit to flag when an applicant’s address is not located within the Community Board to which they applied.
Brooklyn
Of the 891 Brooklyn Community Board members appointed or reappointed in 2022 or 2023 , 34 (3.8%) members do not reside in and/or appear to lack a significant interest in the district.
After the auditors discussed the findings with BBPO, officials stated that 2023 was the first year the office used mapping software and that it is currently developing a procedure to map applicants’ and appointees’ addresses. Additionally, BBPO officials subsequently provided information to show that seven of the above-mentioned members had a residential, professional, or other significant interest in their district.[61] However, this information was not included on the Community Board Membership Application and was provided by the BBPO in response to the audit findings, indicating that the BBPO did not vet applicants as it should have.
The BBPO stated that the 2024 Community Board Membership Application had been amended to include required fields for addresses affiliated with applicants’ significant interest. The 2024 application will automatically sort addresses for home, work, and significant interest to ensure that the applicant is assigned to the appropriate community district.
Manhattan
Of the 630 Manhattan Community Board members appointed or reappointed in 2022 or 2023, nine (1.4%) members may not be eligible to serve in the district to which they were appointed. These members stated that they had a professional or significant interest in the district but provided a location outside of it.
As previously stated, the MBPO did not map board members’ addresses for all Community Boards or otherwise verify applicants’ eligibility to serve prior to appointment.
After the auditors discussed the findings with the MBPO, officials said they are familiar with members’ interest in their district and that Community Boards are interested in ensuring only eligible members are serving.
Queens
Of the 695 Queens Community Board members appointed or reappointed in 2022 or 2023, 12 (1.7%) members do not reside in and/or appear to lack a significant interest in the district.
After the auditors discussed the findings with the QBPO, officials stated that although they do not map applicants’ addresses, they do review applicants’ addresses and stated interests. Additionally, QBPO officials provided information which they stated demonstrated that each of the 12 above-mentioned members had a residential, professional, or other significant interest in their district.
For 9 of the 12 members, the QBPO provided information to show that members were eligible to serve. However, this information was not included on the Community Board Membership Application and was provided in response to the audit findings, indicating that the QBPO did not vet applicants as it should have.
For the remaining three members, the QBPO either did not provide sufficient information to demonstrate eligibility (one member) or provided information that demonstrated members were ineligible (two members).
Staten Island
All of the 43 Staten Island Community Board members who were newly appointed in 2022 or 2023 were eligible to serve.
The SIBPO did not require existing Community Board members who sought reappointment to complete new Community Board Membership Applications since 2014. Since the SIBPO did not obtain current information about reappointed members’ residence, professional, or other significant interests in the district, the auditors could not determine whether the 69 board members who were reappointed in 2022 or 2023 were eligible to serve.
Reappointment of Some Board Members Who Did Not Attend a Majority of General Board Meetings
In some cases, the five Borough Presidents’ Offices reappointed members who missed the majority of general board meetings in the prior year. The SIBPO had the highest percentage, with 12.9% reappointed; Queens had the lowest, with only 2.8%.
Further information on the reappointments of each borough’s Community Boards members follows.
The Bronx
Of the 157 Bronx Community Board members who were reappointed in 2023, 18 (11.5%) members did not attend more than half of the general board meetings held in the prior year.
BXBPO officials stated that during the COVID-19 pandemic, there were extenuating circumstances such as family issues or work responsibilities that impacted attendance. For members who had poor attendance during 2021 and 2022, BXBPO officials contacted members to discuss attendance issues before making a recommendation on reappointment.
Brooklyn
Of the 292 members who were reappointed in 2023 , 26 (8.9%) members did not attend more than half of the general board meetings held in the prior year. Of these, the Borough President did not interview 14 members (53.8%) .
This happened because either BBPO supervisory personnel did not ensure that staff interviewed Community Board members who missed 50% or more of general board meetings or, because of discrepancies in attendance records, the BBPO was not aware they missed meetings. For example, the meeting minutes posted on one Community Board’s website had a member marked as “absent,” but the attendance records had the member marked as “present.”
BBPO officials stated, “At various times throughout the year, the BBPO informs community board members that poor attendance can lead to appointments being revoked. Members whose attendance falls below 50% are not automatically reappointed. They are required to interview and are placed in the pool with new applicants.” BBPO officials stated that there is more leniency for situations that could possibly fall under reasonable accommodation, disability, and human rights laws. The BBPO should consult with legal counsel and the Law Department regarding its attendance policy and the applicability of discrimination laws and reasonable accommodations.
BBPO officials also stated that some Community Board members had health, family, job, or technology issues which impacted their attendance in 2022 , but these have since been resolved. Additionally, for those Community Board members who were nominated by Council Members, the Borough President provided Council Members with attendance records and notified them that attendance was a prerequisite. Attendance notwithstanding, the Borough President deferred to Council Members’ recommendations for reappointment.
Manhattan
Of the 173 Manhattan Community Board members who were reappointed in 2023, 15 (8.7%) members did not attend more than half of the general board meetings held in the prior year.
MBPO officials stated that the office relies on Community Boards to self-govern and contacts them when there is a problem with a member’s attendance. In addition, MBPO staff attend board meetings, and they would be aware of members who do not regularly attend meetings. MBPO officials also stated that they meet with Community Boards and review attendance records and have removed members with poor attendance.
Queens
Of the 250 Queens Community Board members who were reappointed in 2023, seven (2.8%) members missed more than half of the general board meetings held in the prior year.
QBPO officials stated that the 14 Community Boards each collect attendance records differently, and based on their experience, some boards’ records are more accurate than others. Therefore, the QBPO is hesitant to base reappointment decisions solely on Community Boards’ attendance records. QBPO officials also stated that there may be reasons for poor attendance which are not reflected in attendance records.
In addition, QBPO officials stated that the City Charter does not require Borough Presidents to decline member reappointments based on attendance, that it is at the Borough President’s discretion. The officials acknowledged that although attendance is an important factor when considering reappointments, they also consider information provided by members and whether a member’s reappointment would benefit community representation and operations.
Staten Island
Of the 31 Staten Island Community Board members who were reappointed in 2023, four (12.9%) members missed more than half of the general board meetings held in the prior year.
SIBPO officials stated that there were only one or two instances where the Community Boards were unable to meet quorum at the general board meetings.
Recommendations
To address the above-mentioned findings, the auditors propose that the five Borough Presidents’ Offices implement the recommendations below. In some instances, no response was received. Responses that have been received are noted below.
- Coordinate, pool resources, and seek assistance from the CEC, MOIA, Office of Technology and Innovation, CUNY, DYCD, and NYCHA to raise awareness of the role of Community Boards and underrepresented demographic groups and develop Citywide outreach strategies for such groups , including for LGBTQIA individuals.
QBPO Response: QBPO officials stated, “As previously mentioned, our office welcomes constructive advice and partnership to better reach applicants from underrepresented backgrounds, so we accept this recommendation.”
- Implement the best practices detailed throughout the report aimed at ensuring that Community Boards reflect the diversity of the communities that they serve.
QBPO Response: QBPO officials stated, “We accept this recommendation because many of the best practices cited in this report are policies that our office first developed and implemented years ago [. …] We will consider and implement any the [sic]other practices if we believe they could help deepen the diversity of our applicant pool.”
- Fill Community Board vacancies.
QBPO Response: QBPO officials stated, “Our office had already implemented this recommended policy prior to this audit; our office consistently fills vacancies on community boards.”
- Publicly report a comparison of Community Board member composition to community district composition with respect to race/ethnicity, gender, age, educational attainment, public housing, and disability status.
MBPO Response: MBPO officials stated that this recommendation would “create a new standard not required by the Charter. It would also overlook individuals who chose to not self-identify themselves.”
QBPO Response: QBPO officials stated, “There is no requirement in the Charter to publish such a comparison […] so we accept it only insofar that publicizing such comparative data might help increase the diversity of our applicant pool in some instances.”
- Ensure that the Demographic Report is issued by July 1 each year, and contains all information required by the City Charter.
QBPO Response: QBPO officials stated, “We accept this recommendation, and it already has been implemented. Our annual report was published on July 1 of this year and included all information required by the Charter.”
- Map applicants’ and appointees’ addresses prior to appointment or reappointment to verify eligibility to serve, ensure adequate geographic representation, and inform outreach
MBPO Response: MBPO officials stated, “[R]equiring mapping for CB applicants would create an undue burden on an already onerous process that does not actually serve to verify the required connection to the district.”
QBPO Response: QBPO officials stated, “[O]ur office accepts this recommendation [. …] With respect to eligibility, we already verify all applicants’ eligibility to serve by confirming via Department of City Planning data that the address provided in an application falls within the relevant community board district.
With respect to mapping applicants’ and appointees’ addresses to ensure adequate geographic representation, we agree that this could be another useful way to visualize this data and satisfy our Charter requirement [. …] But we disagree that your approach is the only way to consider geographic diversity and have concerns that relying solely on this method—which fails to account for the relative population density of neighborhoods—could actually exacerbate other demographic disparities by prioritizing neighborhood representation at the expense of other demographic categories.”
- Require existing Community Board members who are seeking reappointment to complete membership applications.
QBPO Response: QBPO officials stated, “Our office had already implemented this recommended policy prior to this audit; our office requires existing community board members who are seeking reappointment to complete a reappointment application.”
- Develop a policy for Community Boards to consistently record attendance for general board meetings, collect and review attendance records to identify members who do not attend more than half of the meetings in the preceding year, and interview them to obtain a reasonable justification of absenteeism and to assess their interest in continued membership.
MBPO Response: MBPO officials stated, “[R]equiring the MBPO place record keeping requirements on the Community Boards is not legally permissible as the CBs remain independent agencies that the MBPO does not have control over.”
QBPO Response: QBPO officials stated, “Our office had already implemented this recommended policy prior to this audit; we collect attendance from community boards at least twice a year, review those records, notify members whose attendance is at or under 50 percent, request a reasonable justification for absenteeism, and consider any response when making reappointment decisions.”
- Monitor attendance for those Community Board members who did not attend more than half of the general board meetings in the preceding calendar year and were subsequently reappointed and consider removing members if their attendance does not improve.
MBPO Response: MBPO officials stated that this recommendation is “beyond the scope of authority of BPs as defined in the Charter.”
QBPO Response: QBPO officials stated, “Our office had already implemented this recommended policy prior to this audit, as mentioned in the response to the previous recommendation. This year, ten such members were removed due to poor attendance.”
Recommendations Follow-up
Follow-up will be conducted periodically to determine the implementation status of each recommendation contained in this report. Agency reported status updates are included in the Audit Recommendations Tracker available here: https://comptroller.nyc.gov/services/for-the-public/audit/audit-recommendations-tracker/
Scope and Methodology
We conducted this performance audit in accordance with Generally Accepted Government Auditing Standards (GAGAS). GAGAS requires that we plan and perform the audit to obtain sufficient, appropriate evidence to provide a reasonable basis for our findings and conclusions based on our audit objectives. We believe that the evidence obtained provides a reasonable basis for our findings and conclusions within the context of our audit objective(s). This audit was conducted in accordance with the audit responsibilities of the City Comptroller as set forth in Chapter 5, §93, of the New York City Charter.
The scope of this audit was January 1, 2022 through October 31, 2023 .
To gain an understanding of the community outreach and the Community Board members selection and appointment processes, the auditors conducted interviews with Borough President’s Office staff and conducted walkthroughs of computer systems used to collect and maintain Community Board Membership applications and administer the screening and selection processes.
To obtain an understanding of the regulations, policies, and procedures governing the Community Board members appointment process, the auditors reviewed City Charter Sections 82 and 2800, Community Boards Demographic Reports, and internal memoranda.
The auditors obtained Community Board Membership Applications and data from AirTable, application data from Excel spreadsheets, and/or obtained hardcopies of applications from Borough Presidents’ Office files.
To assess the integrity of the computer-processed application data extracted from AirTable, the auditors tested the data for duplicate application records. In addition, the auditors assessed the completeness of the data by comparing the information from the source application forms to the key data fields.
For each of the 59 Community Boards, the auditors compared 2023 board demographic information voluntary disclosed by applicants on their Community Board Membership Application to ACS and New York City Equitable Development data. Specifically, the auditors compared aggregate demographic information for each board regarding race/ethnicity, gender, age, public housing, educational attainment, and disability status to the district-level demographic information.
The auditors reviewed the 2023 Demographic Reports and transmittal letters to determine whether the Borough Presidents’ Offices submitted and posted reports by July 1 as required. Additionally, the auditors reviewed reports to determine whether the Borough Presidents’ Offices reported each Community Board member’s name, first date of appointment, dates of reappointment, if any, length of service, nominating party, and leadership positions; demographic information about Community Board members in aggregate form; recruitment and selection processes; and information on the number of vacancies, applicants, and individuals interviewed.
To determine whether the Borough President assured adequate representation of residents who live in NYCHA developments, the auditors utilized ArcGIS to map residential addresses for the 2023 Community Board members . The auditors also mapped 2022 and 2023 Community Board applicants’ residential addresses to identify and quantify the number of applicants who are NYCHA residents .
To determine whether the Borough President assured adequate geographic representation and appointed only members who lived, worked, or had another significant interest in the district, the auditors used ArcGIS to map addresses for the 2023 Community Board based on the eligibility stated in their application, i.e., the address associated with their residence, profession, business or other significant interest. For each of the 59 Community Boards, the auditors reviewed the distribution of members across the geographic areas and neighborhoods within the district as identified by the NYC Department of City Planning. The auditors considered land use and zoning when evaluating geographic representation. Additionally, the auditors visually determined whether Community Board members’ addresses were within the geographic borders of a Community District.
For all Community Board members who were reappointed in 2023, the auditors reviewed attendance records for the prior calendar year which included attendance records provided by Community Boards to the Borough Presidents as well as meeting minutes posted on Community Board websites. The auditors compared the meeting minutes attendance to Community Board attendance records, calculated the number and percentage of absences, and totaled the number of Community Board reappointments that attended less than half of general board meetings. In addition, for the Community Board members who missed 50% or more of general board meetings, the auditors reviewed Borough Presidents’ Offices records to determine whether they were interviewed prior to reappointment.
The results of the above test, while not projectable to their respective populations, provide a reasonable basis for auditors to evaluate whether the five Borough Presidents’ Offices complied with the City Charter requirements and relevant policies and procedures for Community Board member appointments and determine the extent to which Community Boards are fully representative (both geographically and demographically) of the communities they serve.
Appendix 1
Bronx Community Board Member Demographics
Chart I: 2023 Bronx Community Board Members’ Race/Ethnicity Compared to ACS Boroughwide Data
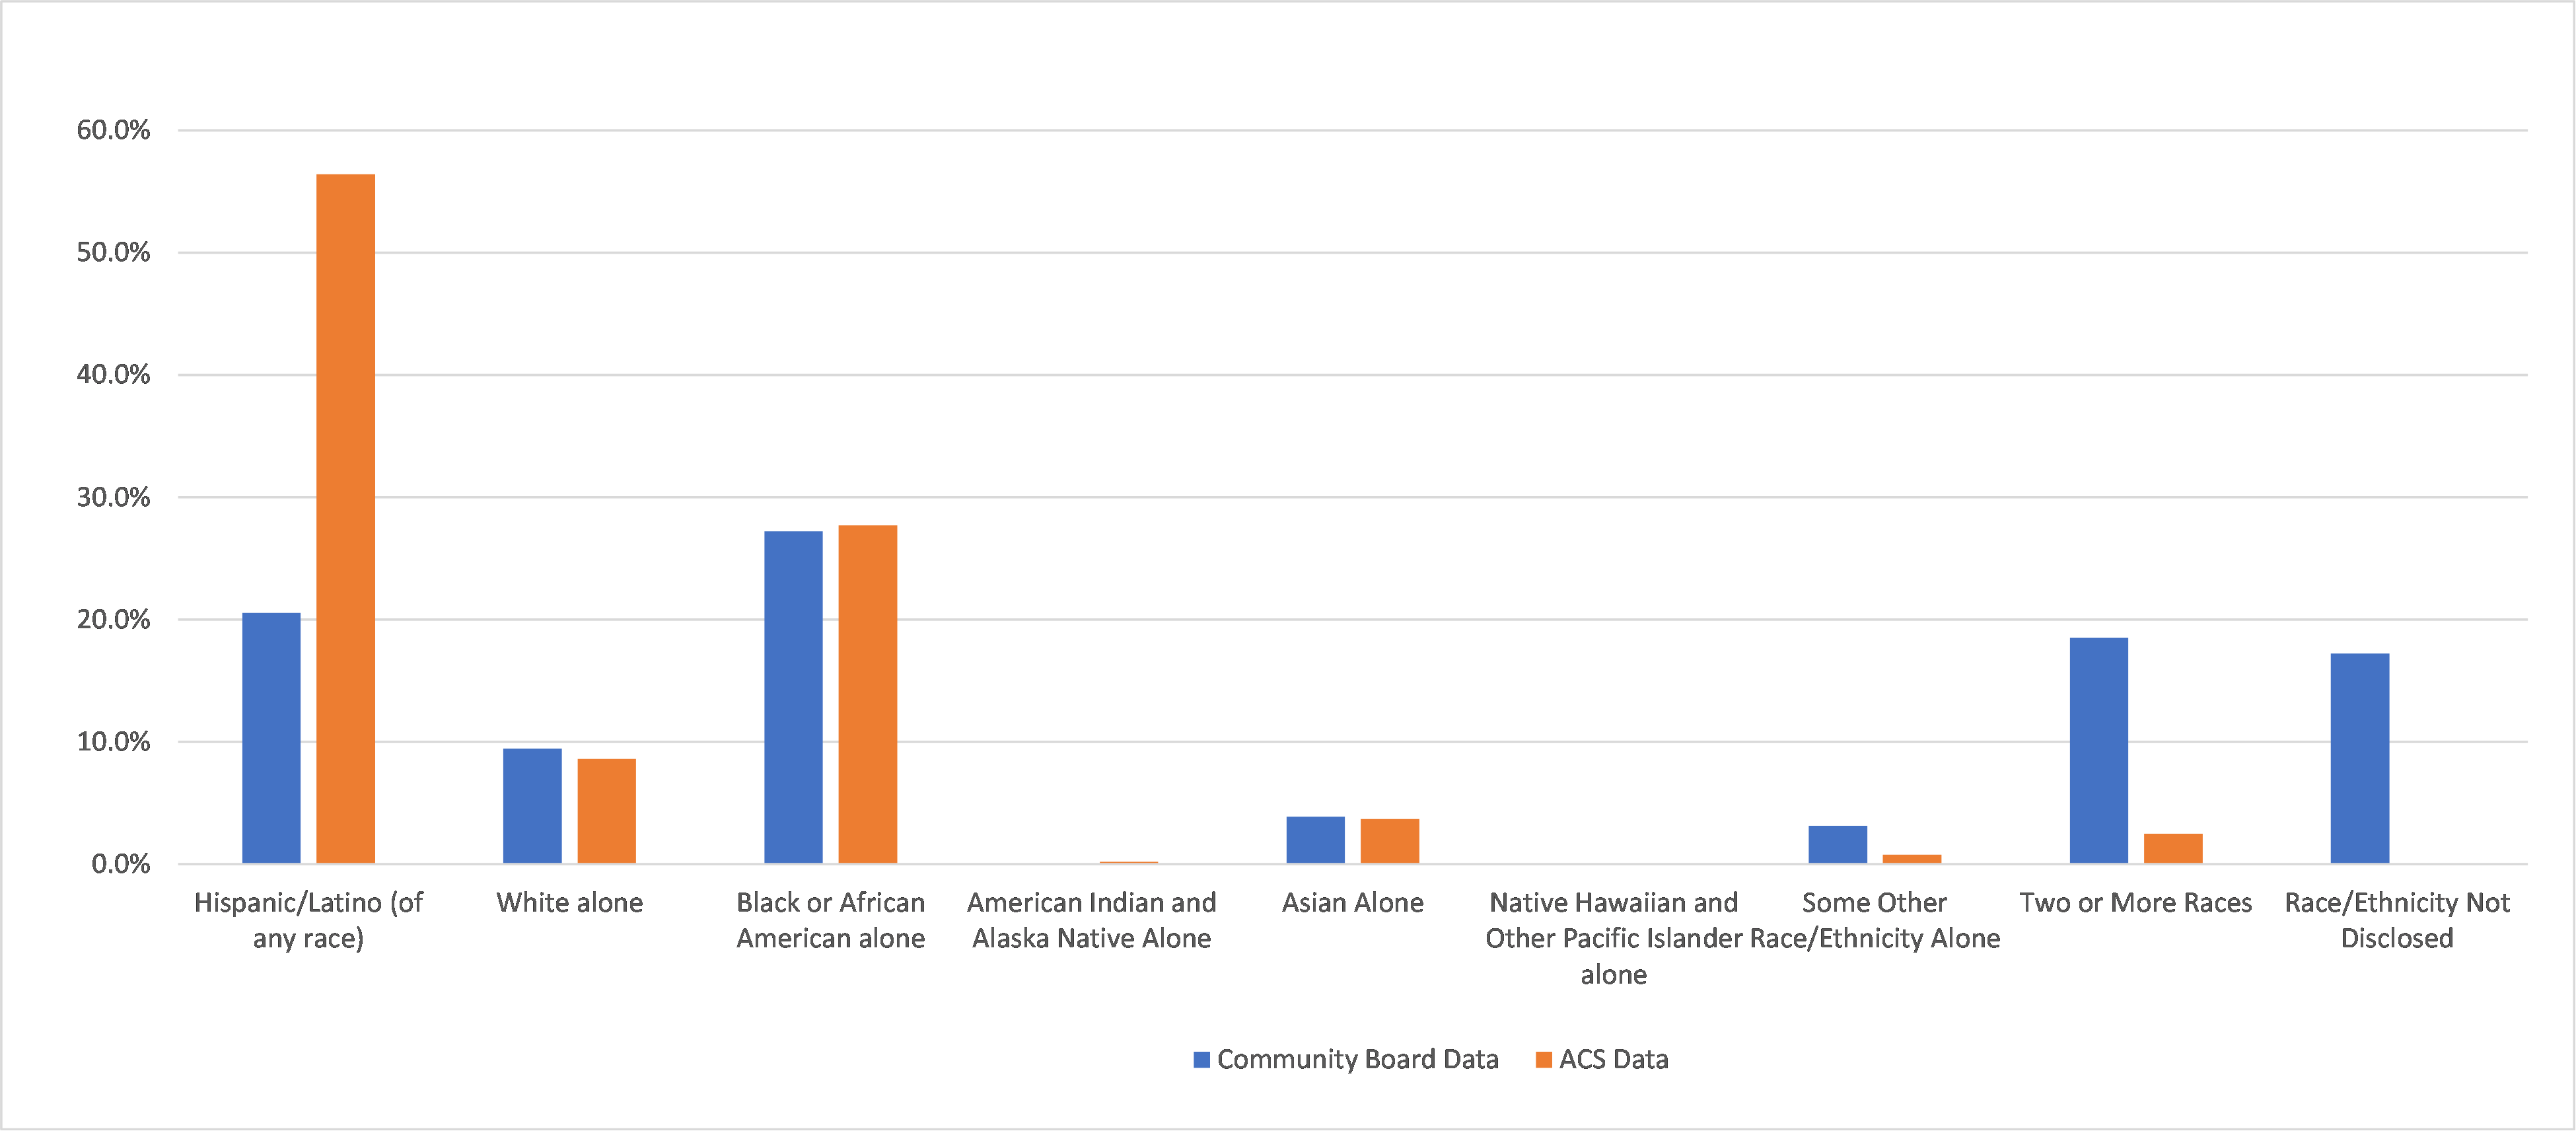
Table I: 2023 Bronx Community Board Members’ Race/Ethnicity Compared to ACS Boroughwide Data
| Census/ACS Race/Ethnicity Categories | BXBPO Race/Ethnicity Categories Included for Comparative Analysis | BXBPO Boro-Wide (%) | ACS Boro-Wide (%) | Difference (%) |
|---|---|---|---|---|
| Hispanic/Latino (of any race) | Latina/o/x/Hispanic | 20.6% | 56.4% | (35.8%) |
| Black or African American Alone | African American/Black | 27.2% | 27.7% | (0.5%) |
| American Indian and Alaska Native Alone | Native American/American Indian | 0.0% | 0.2% | (0.2%) |
| Asian Alone | East Asian/Southeast Asian/Pacific Islander, South Asian, or Both of the above | 3.9% | 3.7% | (0.2%) |
| White Alone | White/European | 9.4% | 8.6% | 0.8% |
| Some Other Race/Ethnicity Alone | Caribbean/West Indian, Southwest Asian (Middle Eastern)/North African, and Sub-Saharan African, Other | 3.2% | 0.8% | 2.4% |
| Two or More Races | 18.5% | 2.6% | 15.9% | |
| Native Hawaiian and Other Pacific Islander Alone | BXBPO did not discretely collect | 0.0% | ||
| Race/Ethnicity Not Disclosed | 17.2 | 17.2% | ||
| Totals | 100% | 100% |
Chart II: 2023 Bronx Community Board Members’ Genders Compared to ACS Boroughwide Data
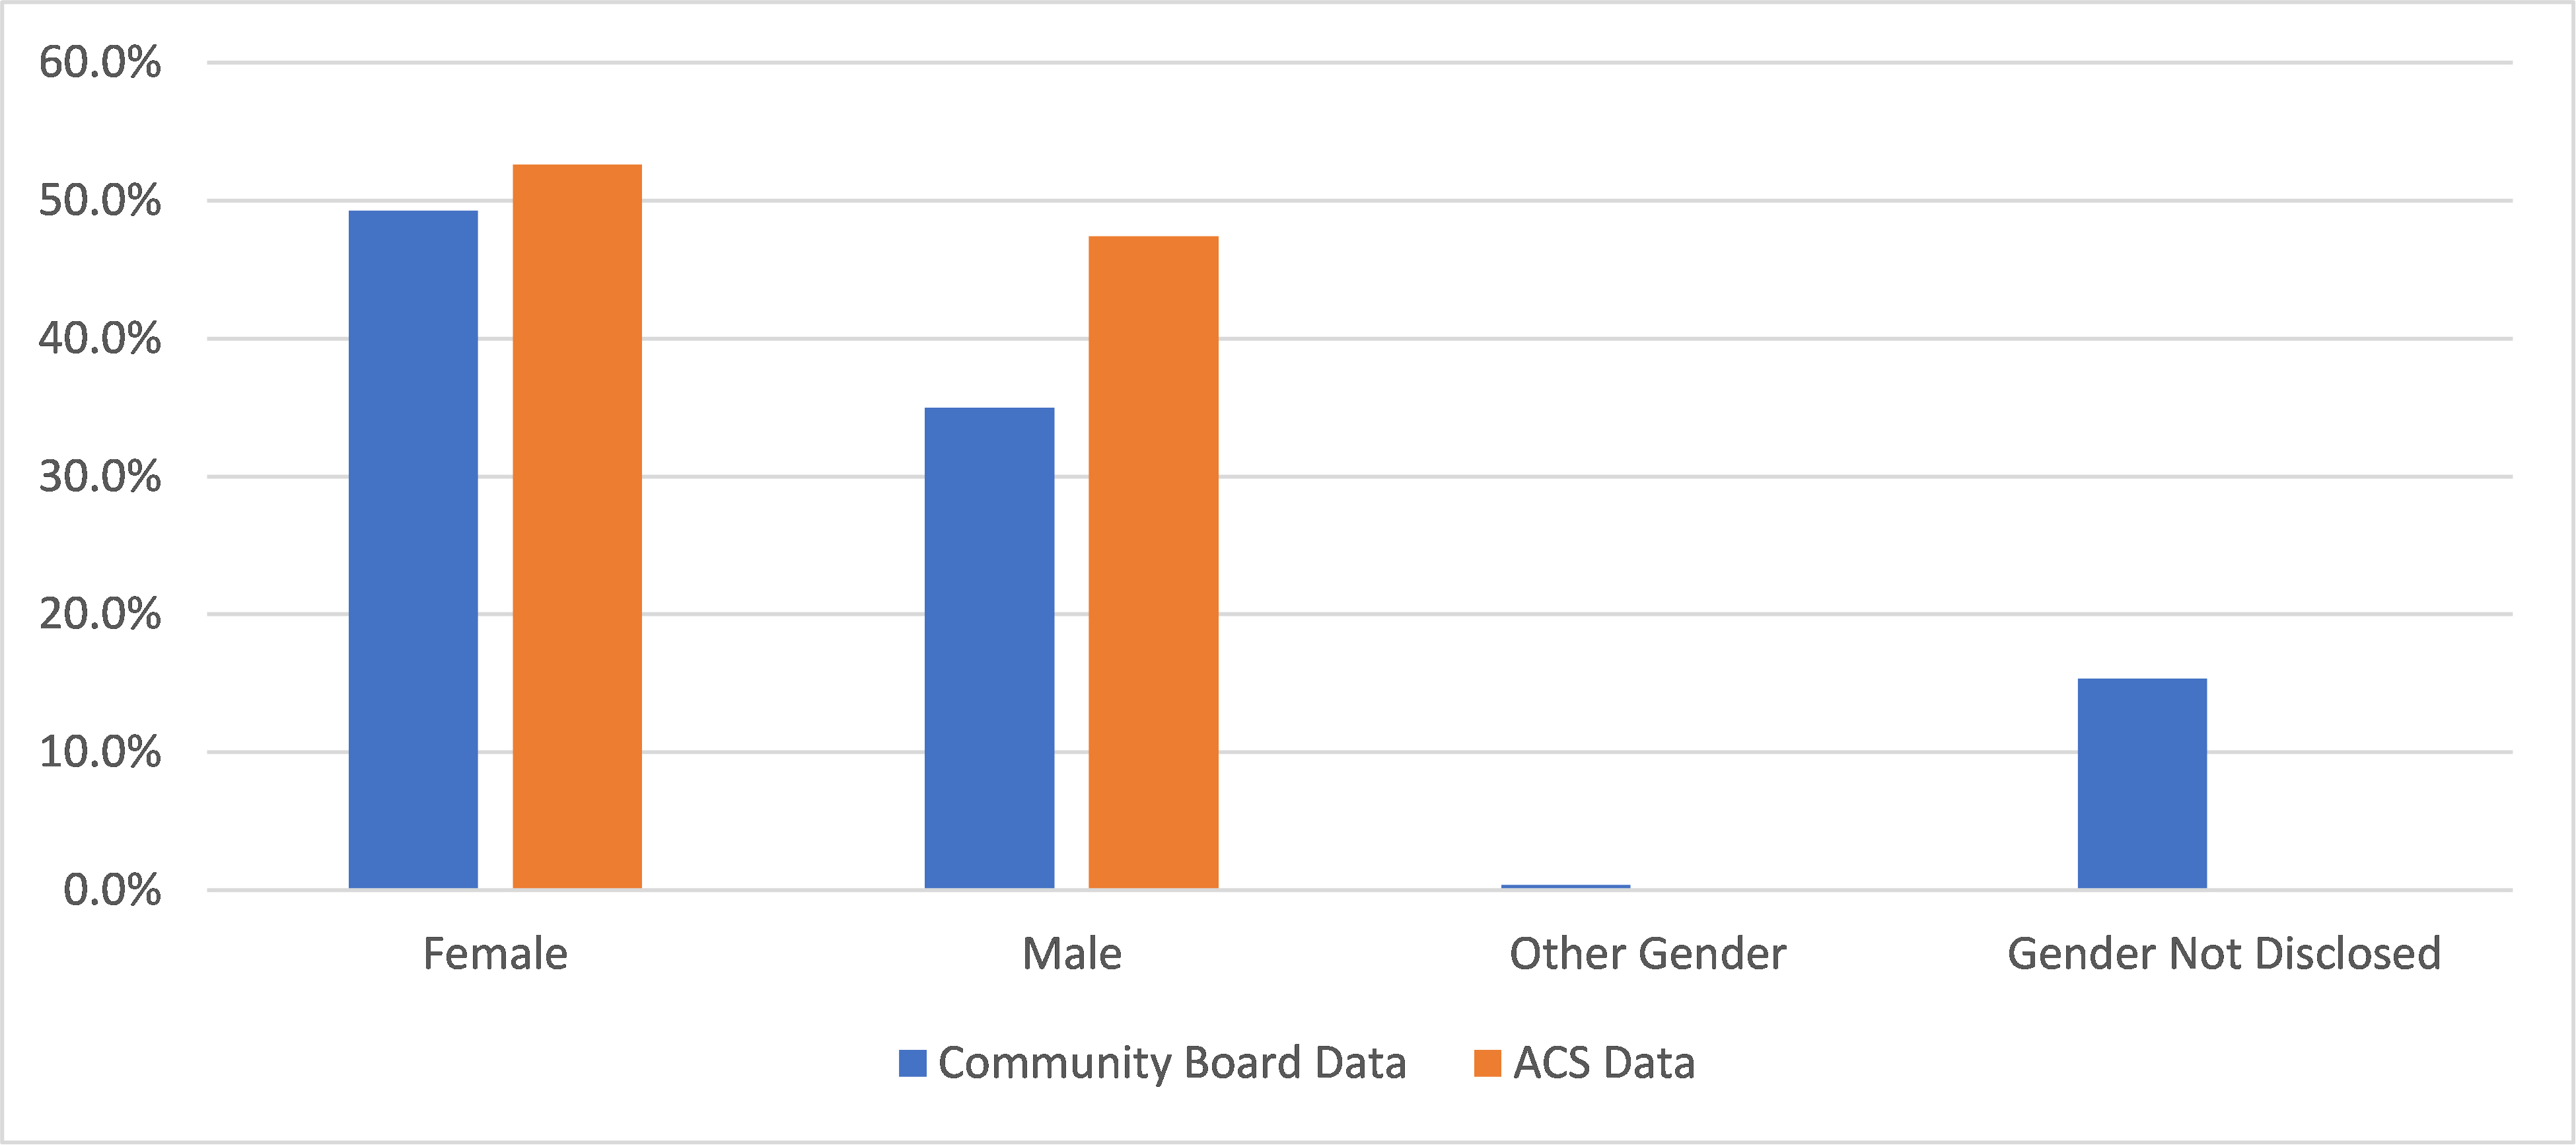
Chart III: 2023 Bronx Community Board Members’ Ages Compared to ACS Boroughwide Data
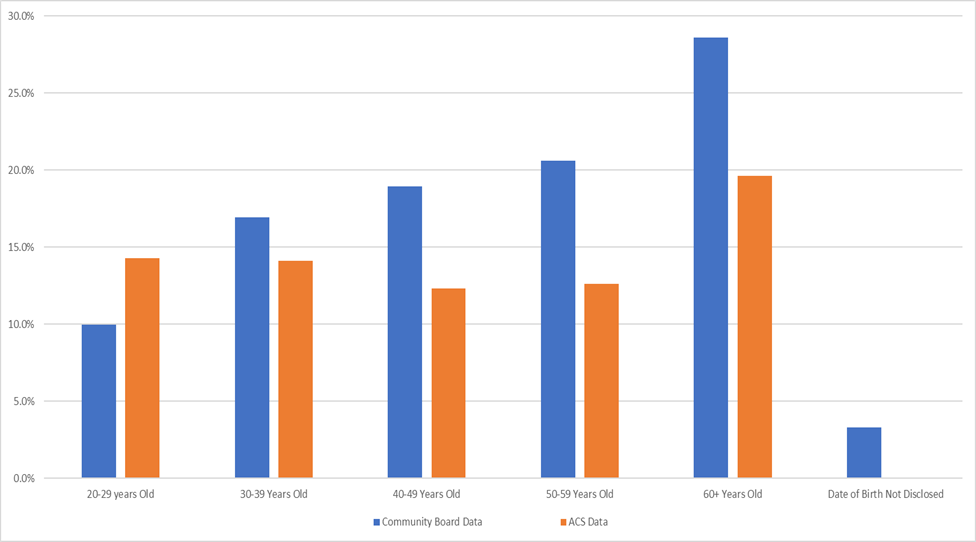
Chart IV: 2023 Bronx Community Board 12 Members’ Education Levels Compared to District Data
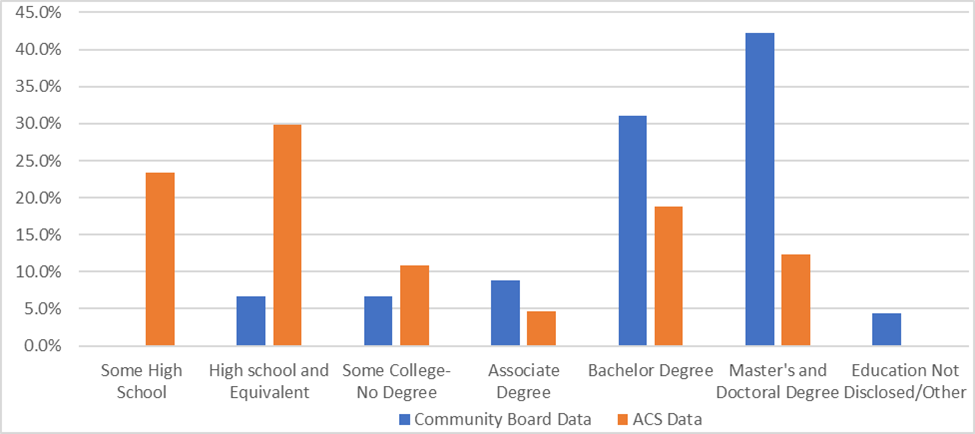
Chart V: 2023 Bronx Community Board Members Residing in Public Housing Compared to District Data for Sampled Boards
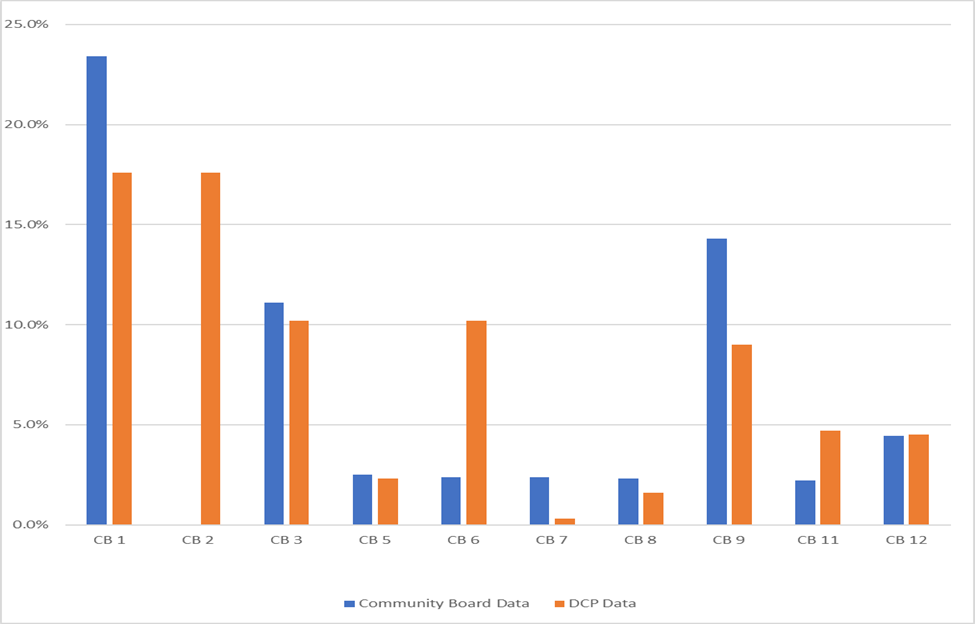
Chart VI: 2023 Disability Status of Bronx Community Board Members Compared to District Data for Sampled Boards
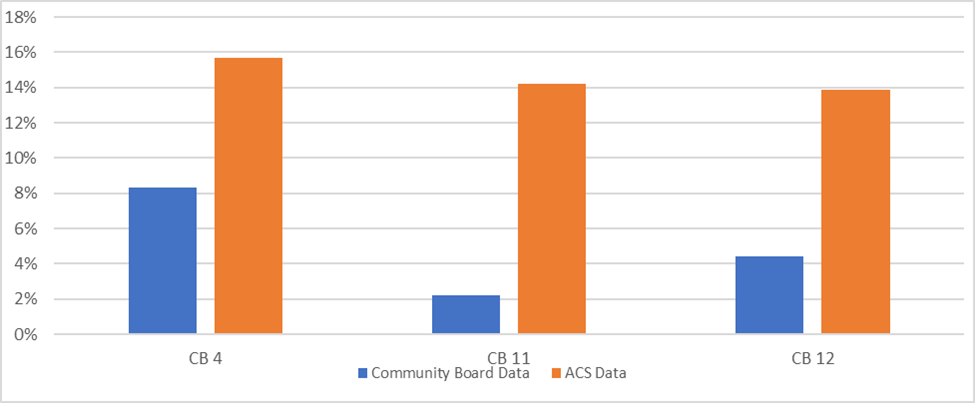
Exhibit I: Geographic Representation of Bronx Community Board 9
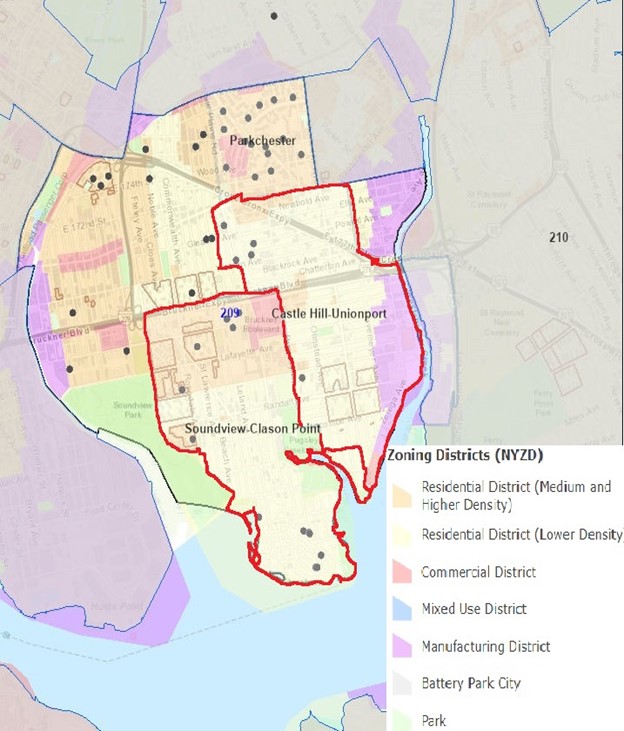
Appendix 2
Brooklyn Community Board Member Demographics
Chart I: 2023 Brooklyn Community Board Members’ Race/Ethnicity Compared to ACS Boroughwide Data
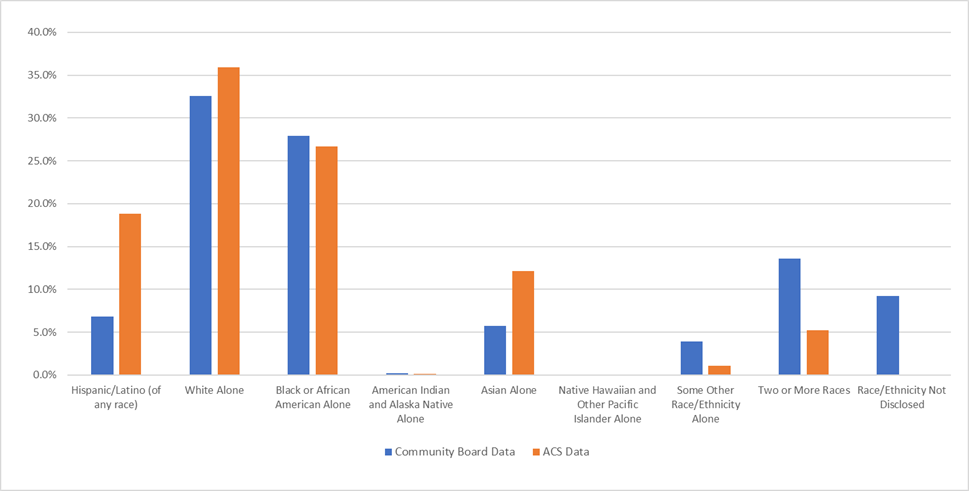
Table I: 2023 Brooklyn Community Board Members’ Race/Ethnicity Data Compared to ACS Boroughwide Data
| Census/ACS Race/Ethnicity Categories | BBPO Race/Ethnicity Categories Included for Comparative Analysis | BBPO Boro-Wide (%) | ACS Boro-Wide (%) | Difference (%) |
|---|---|---|---|---|
| Hispanic/Latino (of any race) | Latina/o/e/Hispanic | 6.8% | 18.8% | (12.0%) |
| Asian Alone | East Asian/Southeast Asian/Pacific Islander, South Asian, or Both of the Above | 5.7% | 12.1% | (6.4%) |
| White Alone | White, Caucasian and White, or European and White | 32.5% | 35.9% | (3.4%) |
| American Indian and Alaska Native Alone | Native American/American Indian | 0.2% | 0.1% | 0.1% |
| Black or African American Alone | African American/Black and Caribbean and African American/Black | 27.9% | 26.7% | 1.3% |
| Some Other Race/Ethnicity Alone | Caribbean, European, Southwest Asian (Middle Eastern)/North African, Sub-Saharan African, Other | 3.9% | 1.1% | 2.8% |
| Two or More Races | 13.6% | 5.2% | 8.4% | |
| Native Hawaiian and Other Pacific Islander Alone | BBPO did not discretely collect | 0.0% | ||
| Race/Ethnicity Not Disclosed | 9.2% | |||
| Grand Total | 100% | 100% |
Chart II: 2023 Brooklyn Community Board Members’ Gender Compared to ACS Boroughwide Data
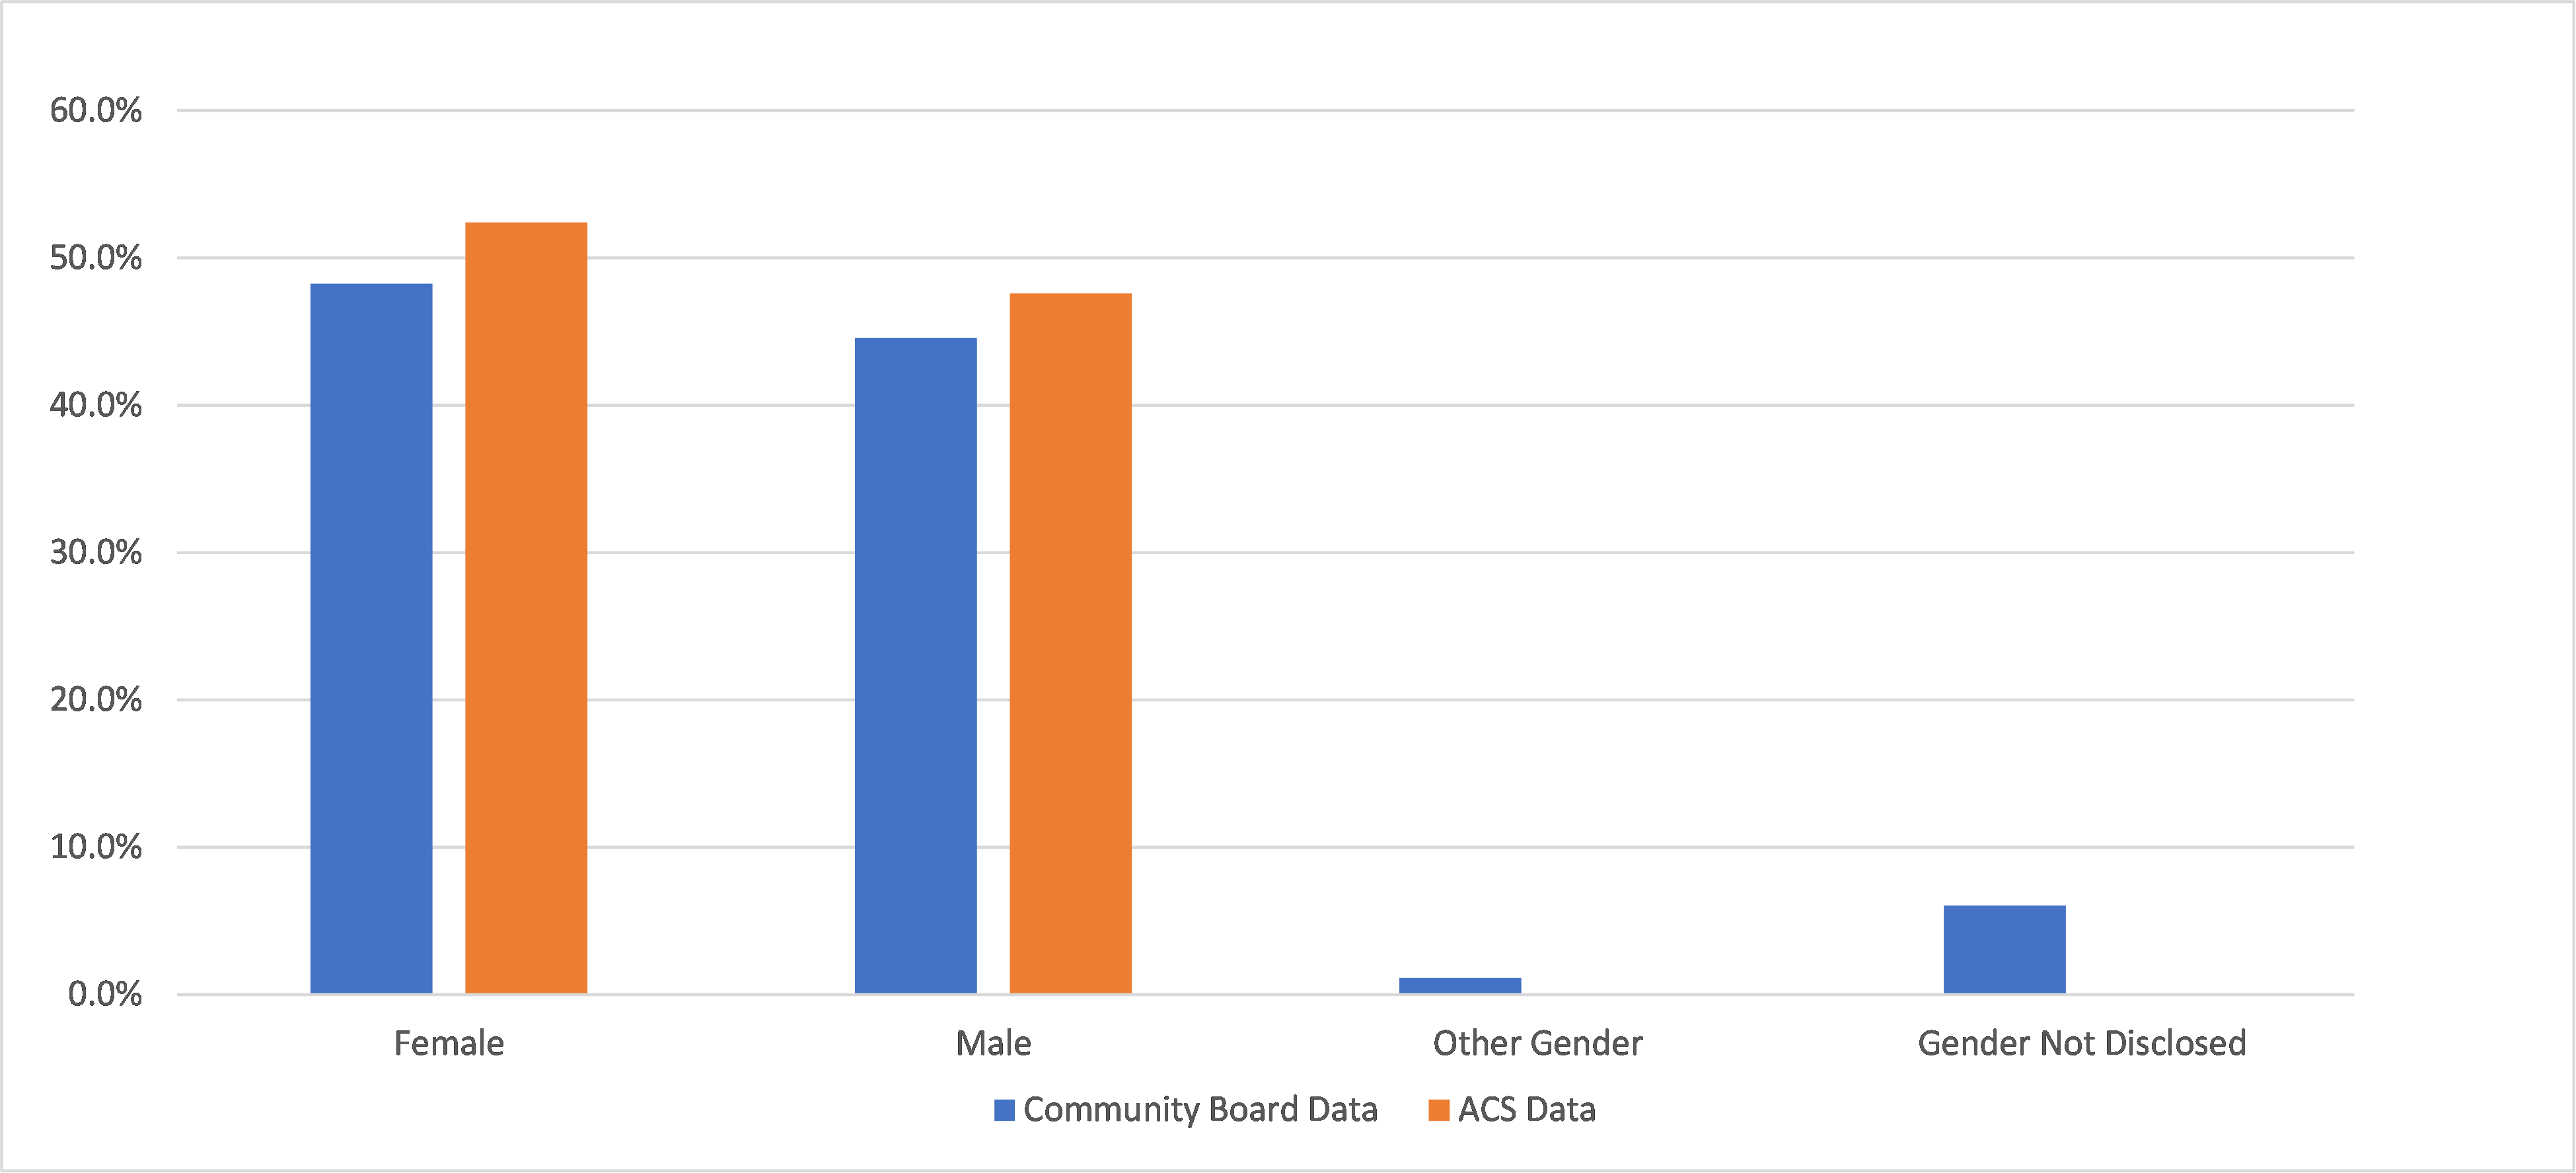
Chart III: 2023 Brooklyn Community Board Members’ Ages Compared to ACS Boroughwide Data
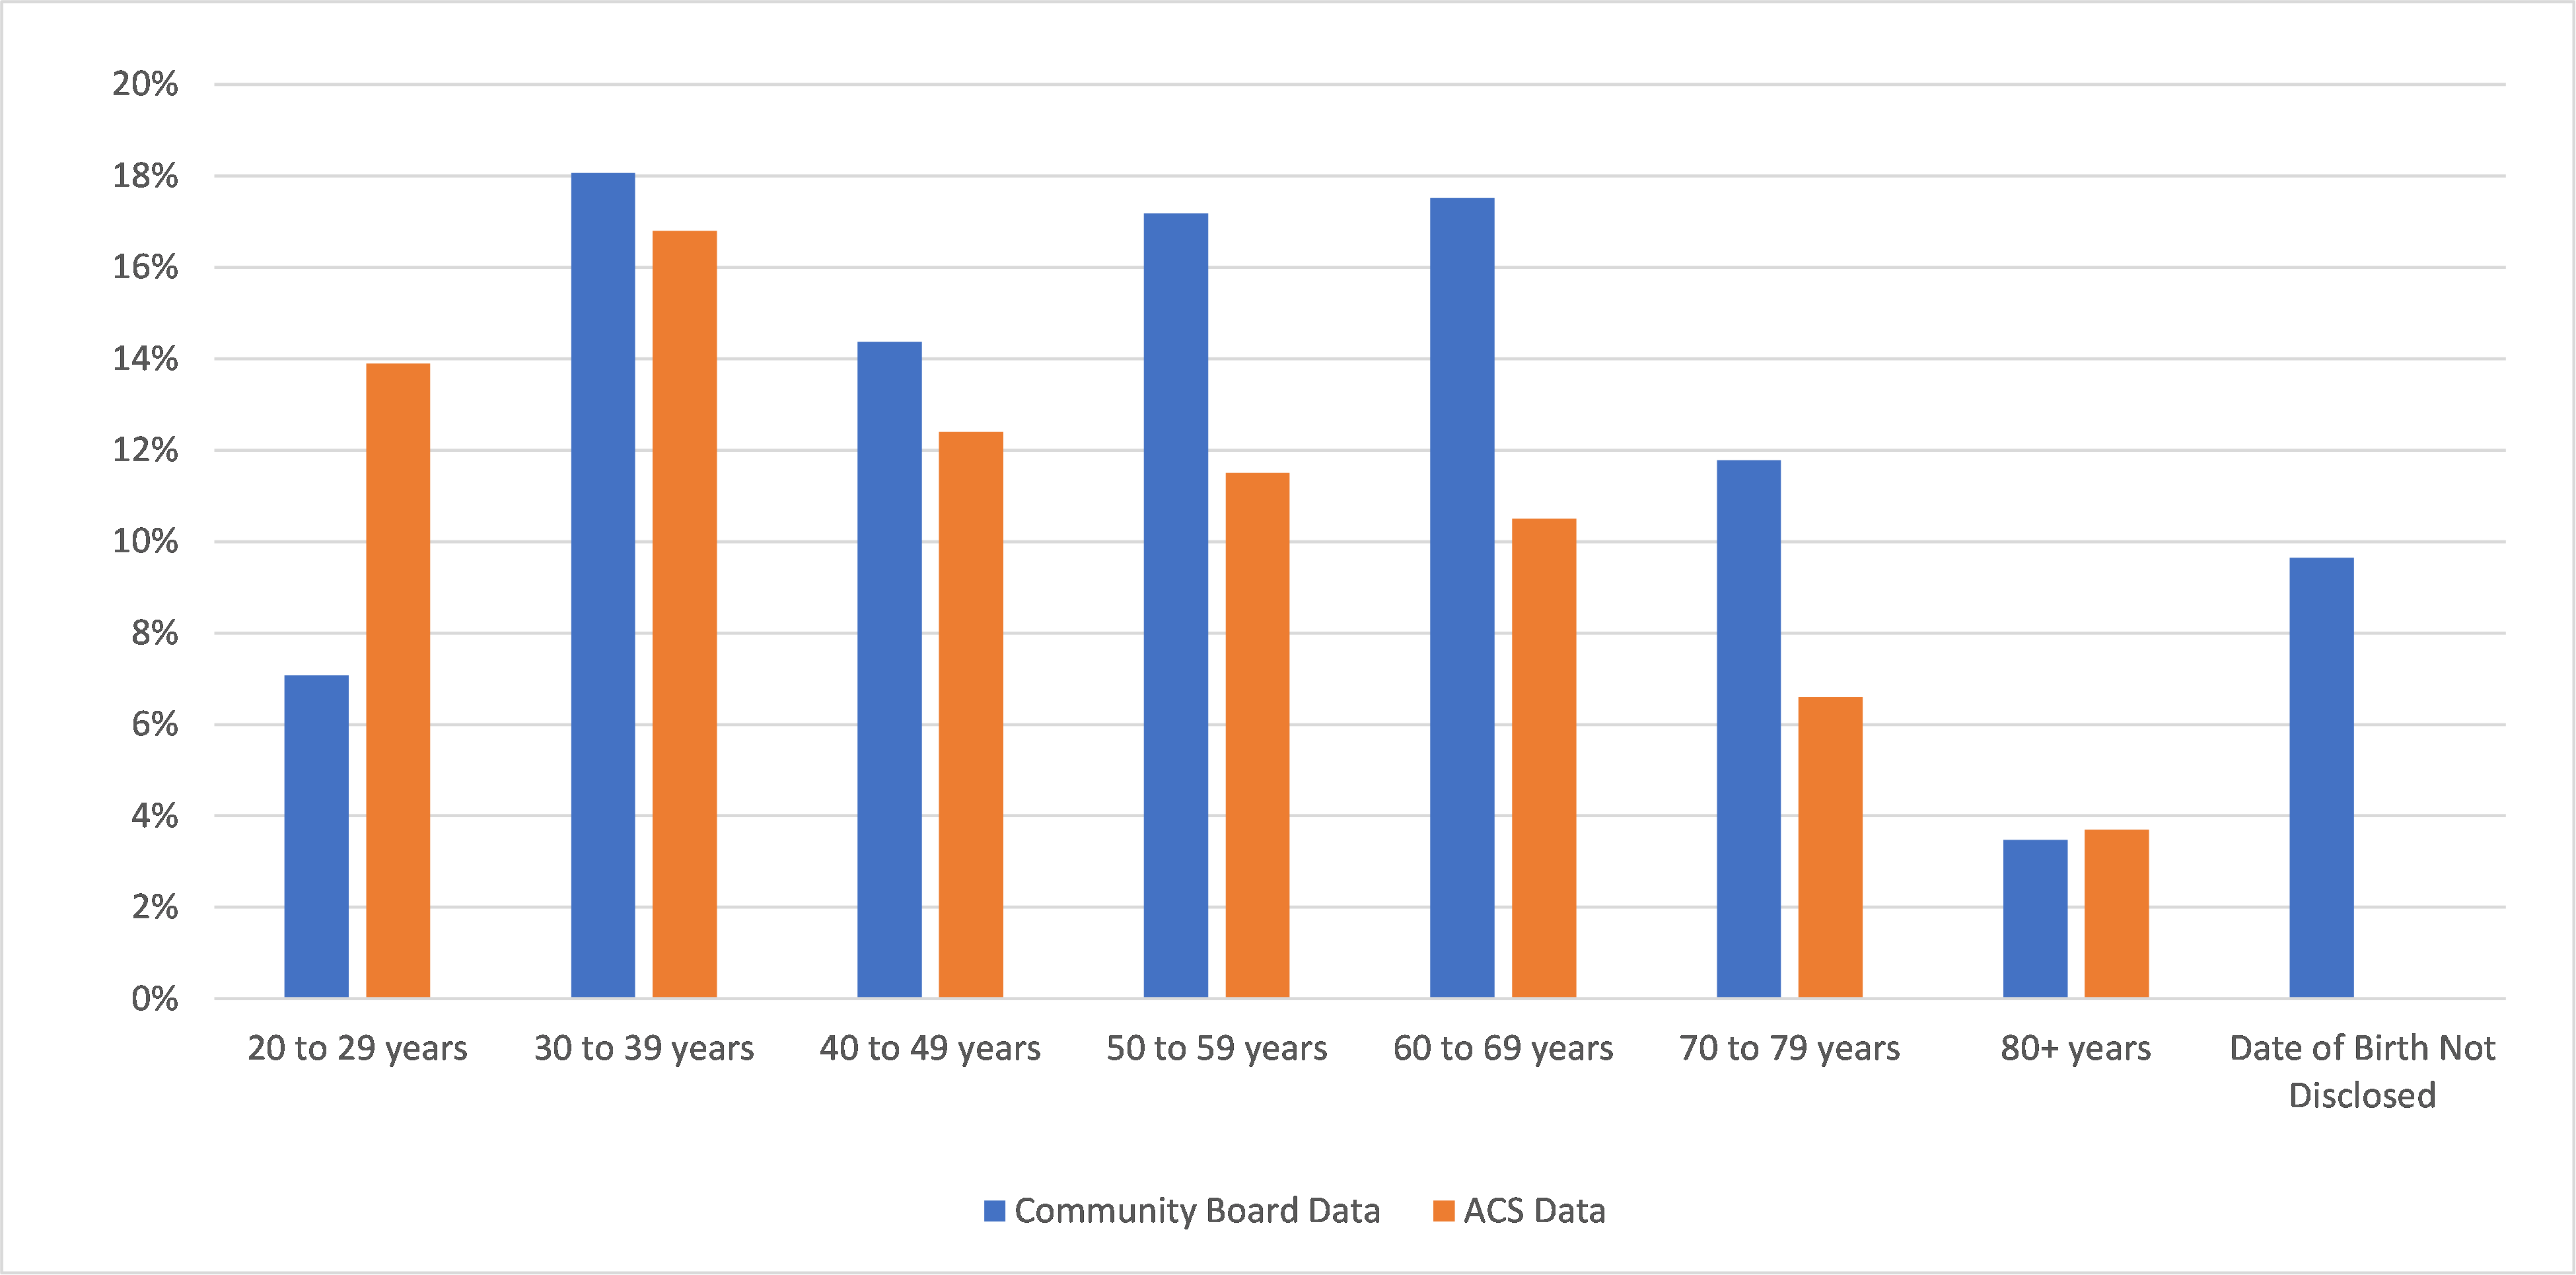
Chart IV: 2023 Brooklyn Community Board Members’ Education Levels Compared to ACS Boroughwide Data
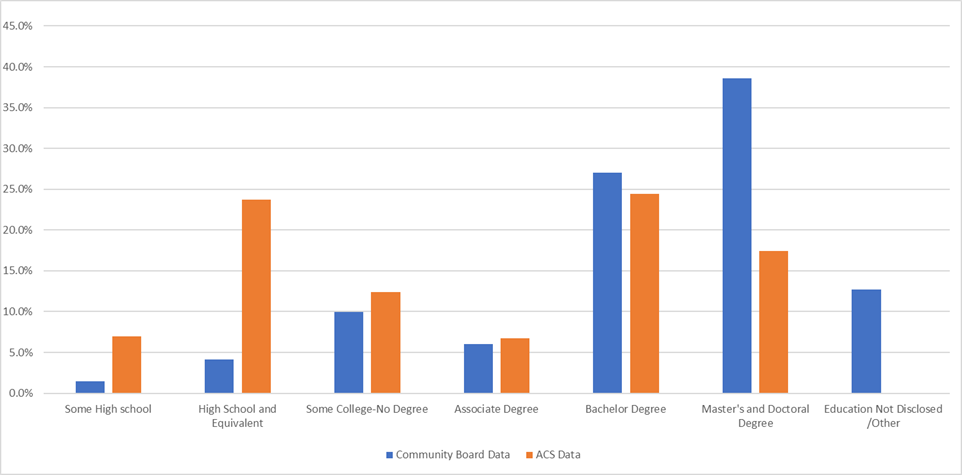
Chart V: 2023 Brooklyn Community Board Members Residing in Public Housing Compared to District Data
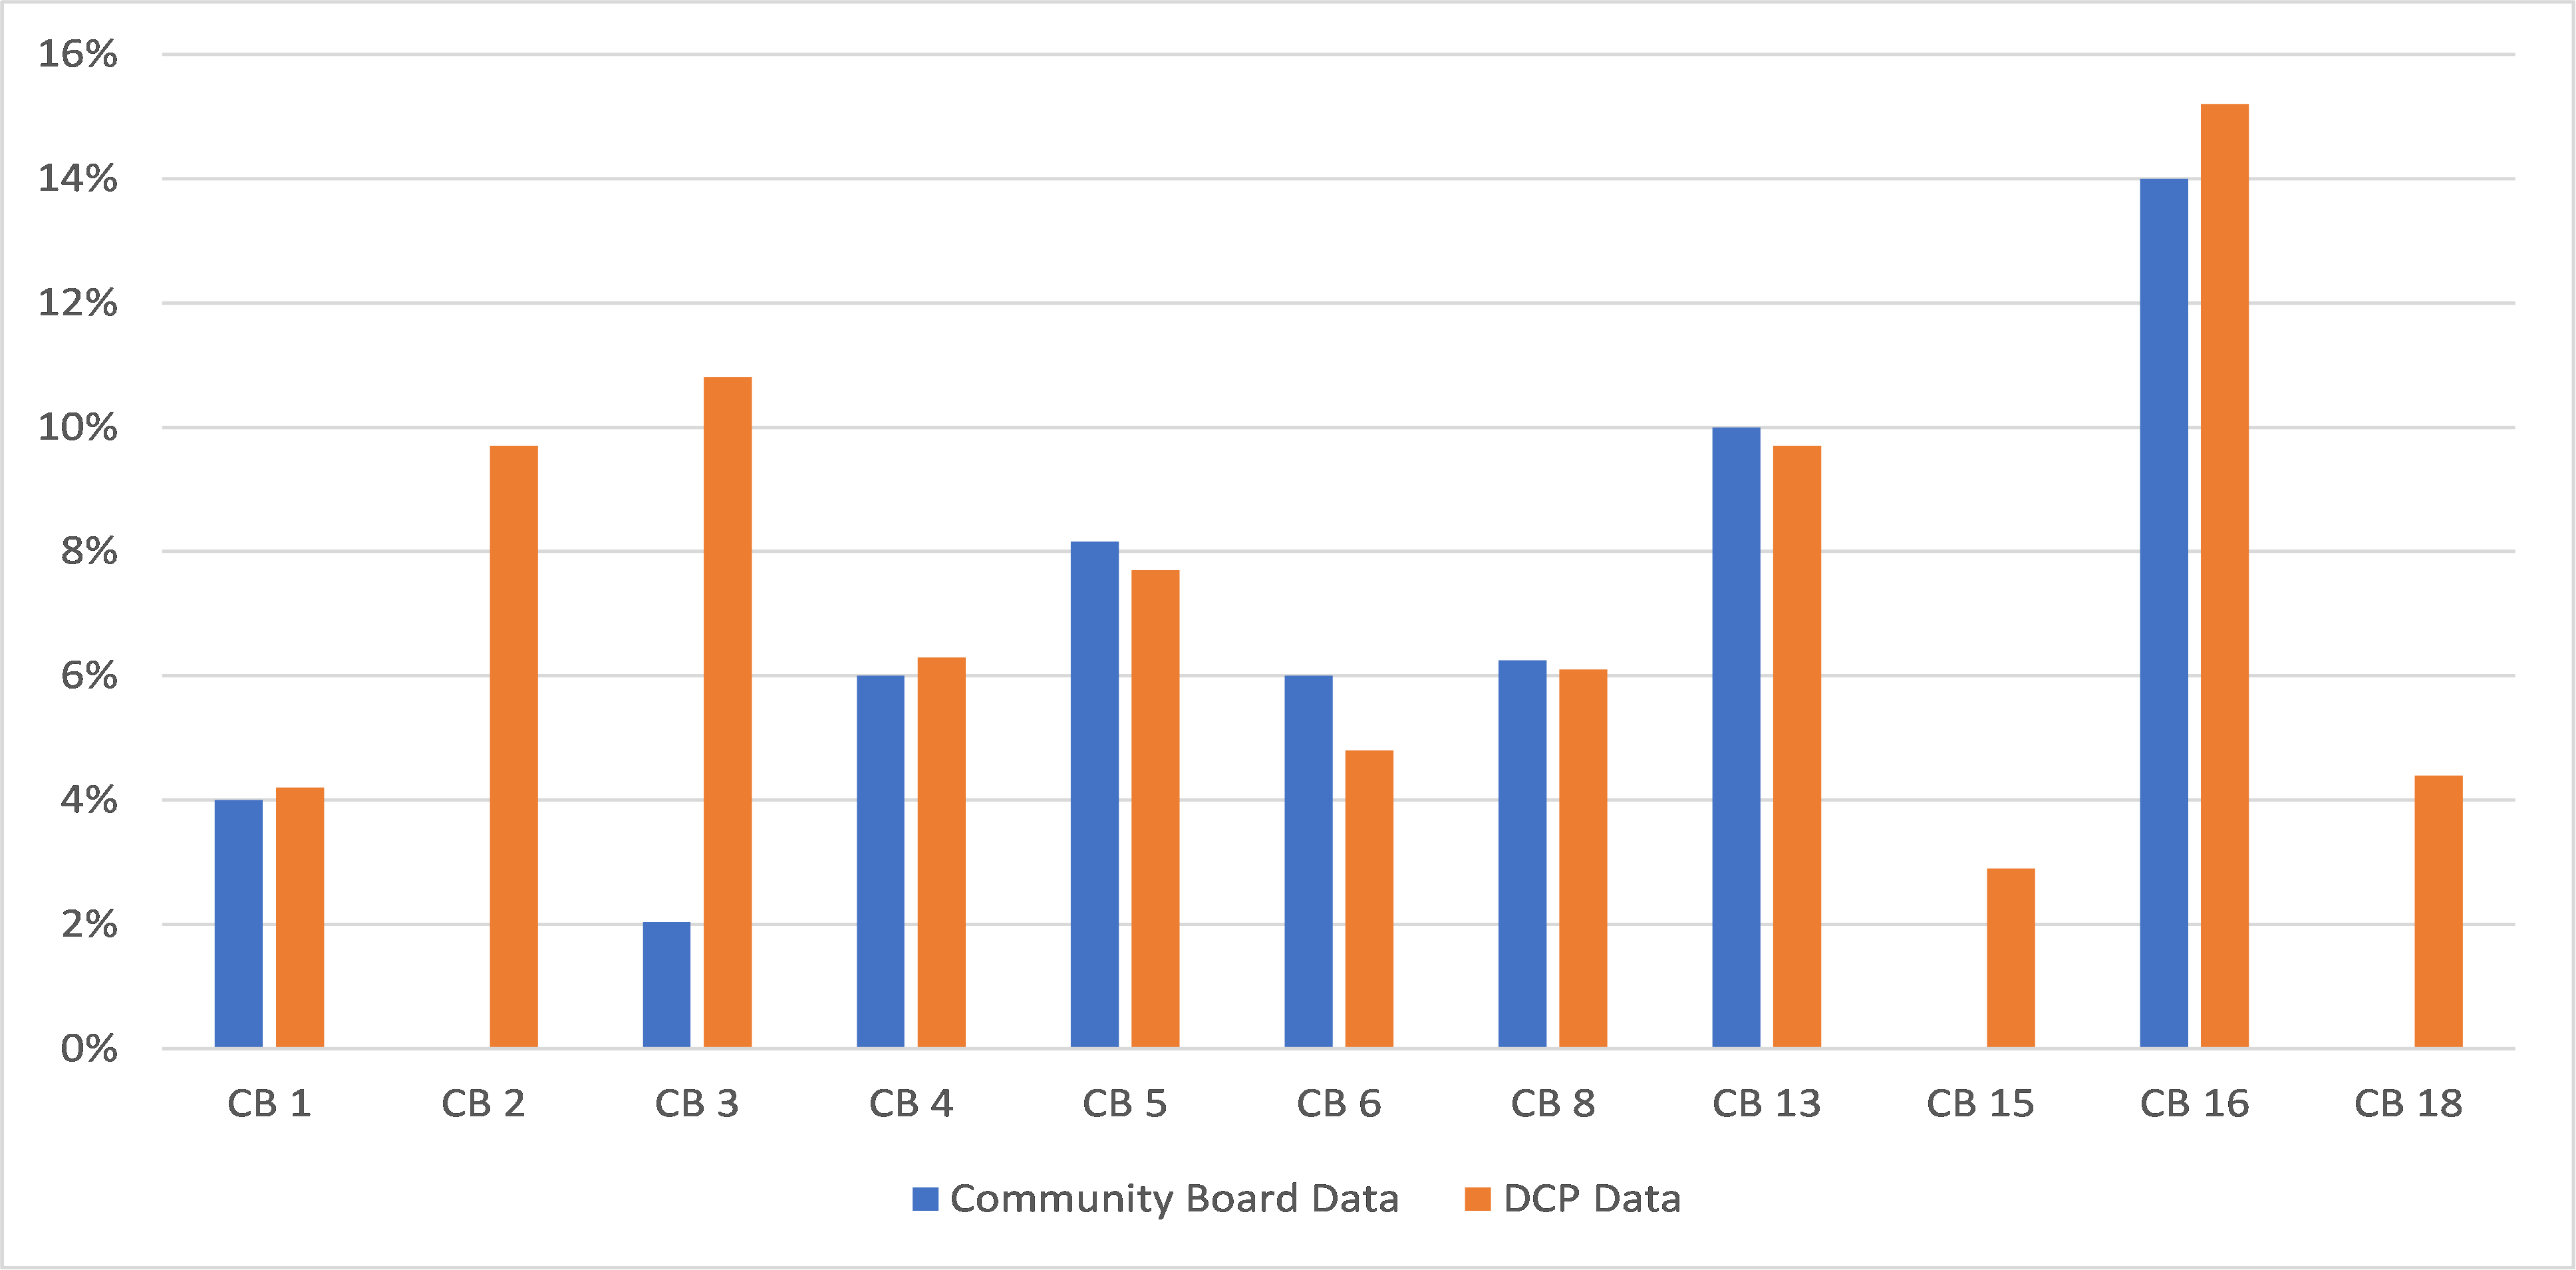
Chart VI: 2023 Disability Status of Brooklyn Community Board Members Compared to ACS District Data
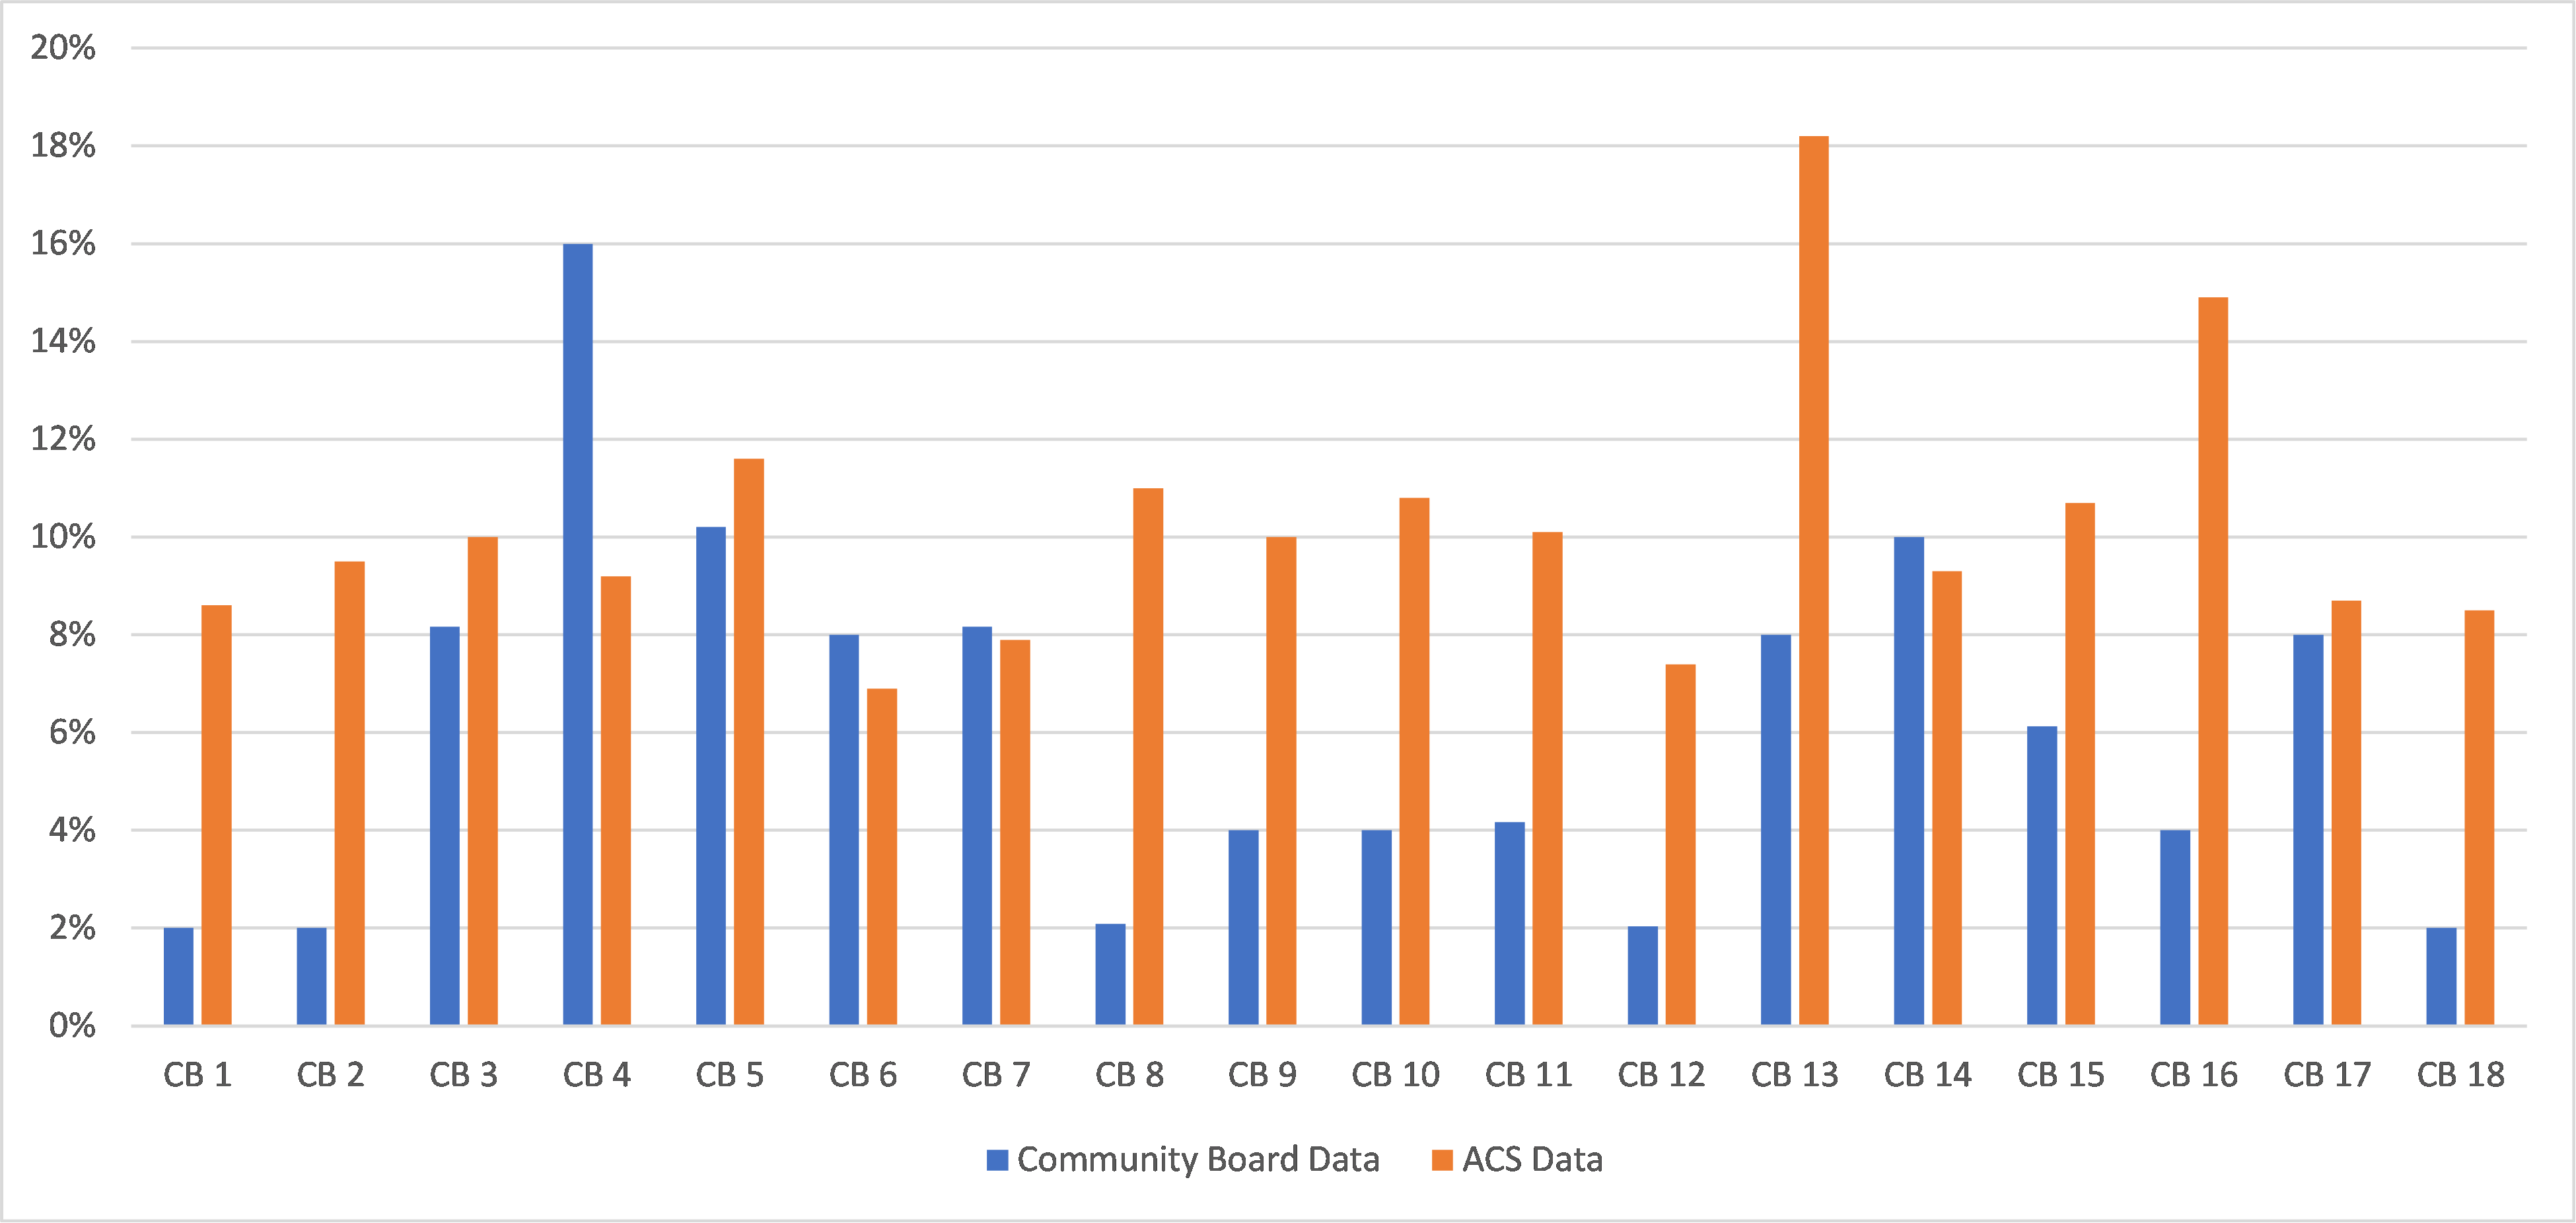
Exhibit I: Geographic Representation of Brooklyn Community Board 10
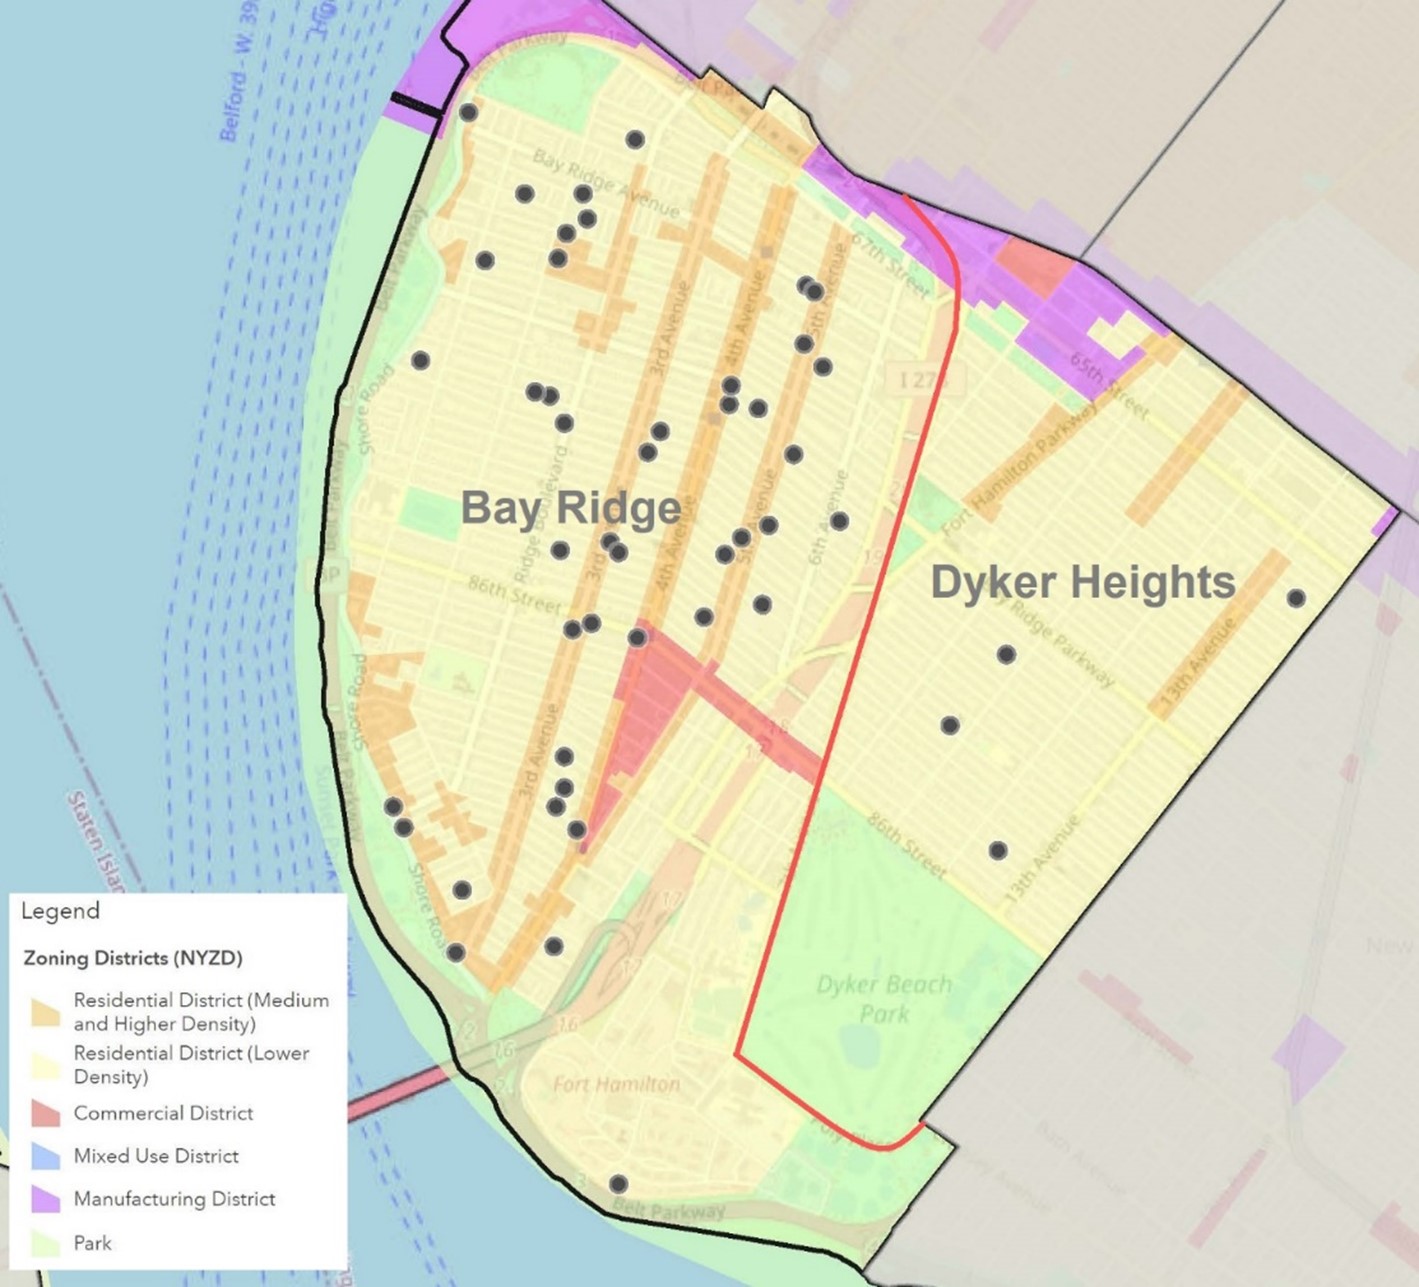
Appendix 3
Manhattan Community Board Member Demographics
Chart I: 2023 Manhattan Community Board Members’ Race/Ethnicity Compared to ACS Boroughwide Data
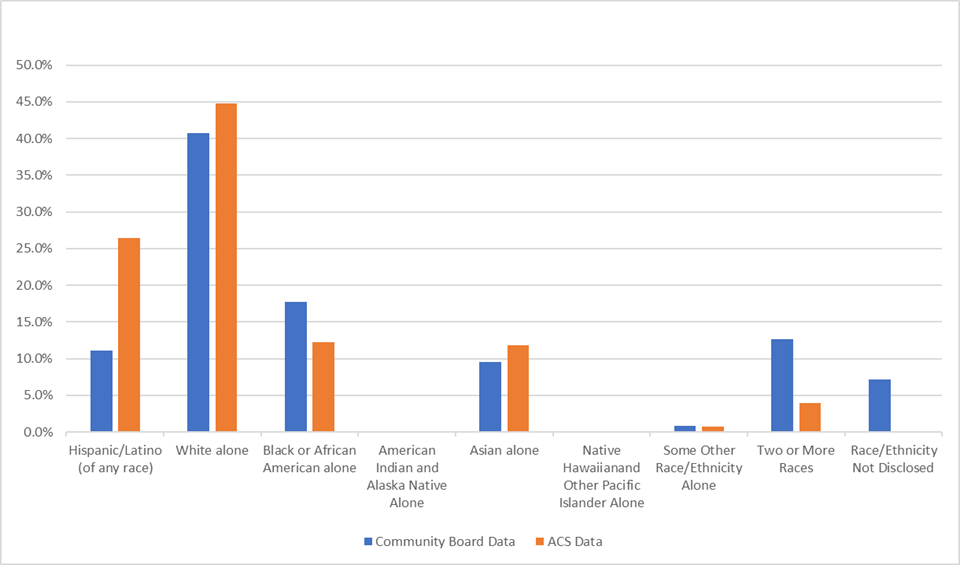
Table I: 2023 Manhattan Community Board Members’ Race/Ethnicity Data Compared to ACS Boroughwide Data
| Census/ACS Race/Ethnicity Categories | MBPO Race/Ethnicity Categories Included for Comparative Analysis | MBPO Boro-Wide (%) | ACS Boro-Wide (%) | Difference (%) |
|---|---|---|---|---|
| Hispanic/Latino (of any race) | Latina/o/x/Hispanic | 11.1% | 26.4% | (15.3%) |
| White Alone | White/European | 40.7% | 44.8% | (4.1%) |
| Asian Alone | East Asian/Southeast Asian/Pacific Islander, South Asian, or Both of the above | 9.5% | 11.8% | (2.3%) |
| American Indian and Alaska Native Alone | Native American/American Indian | 0.2% | 0.1% | 0.1% |
| Some Other Race/Ethnicity Alone | Caribbean, European, Sub-Saharan African | 0.8% | 0.7% | 0.1% |
| Black or African American alone | African American/Black, African American/ Black/Caribbean | 17.8% | 12.2% | 5.6% |
| Two or More Races | 12.7% | 3.9% | 8.8% | |
| Native Hawaiian and Other Pacific Islander Alone | MBPO did not discretely collect | 0.0% | ||
| Race/Ethnicity Not Disclosed | 7.1% | |||
| Grand Total | 100% | 100% |
Chart II: 2023 Manhattan Community Board Members’ Gender Compared to ACS Boroughwide Data
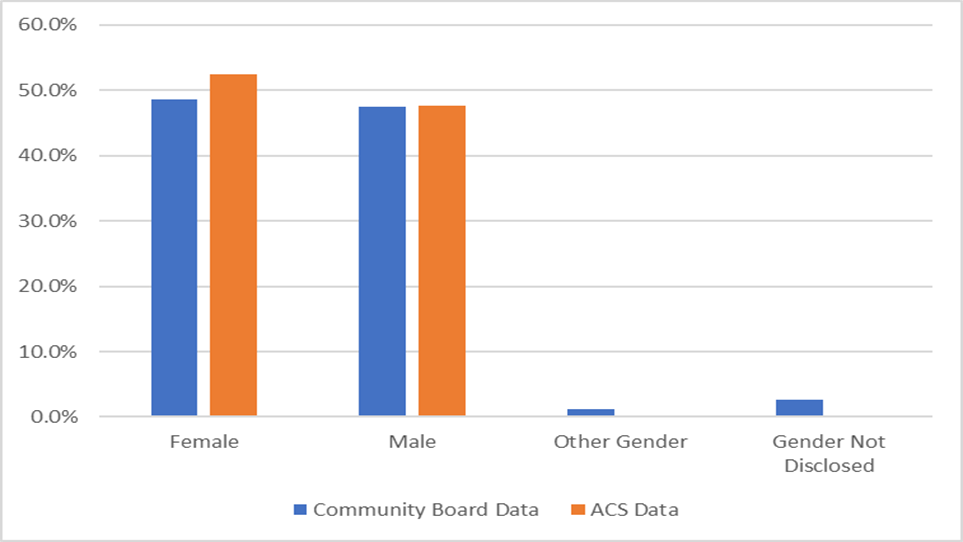
Chart III: 2023 Manhattan Community Board Members’ Ages Compared to ACS Boroughwide Data
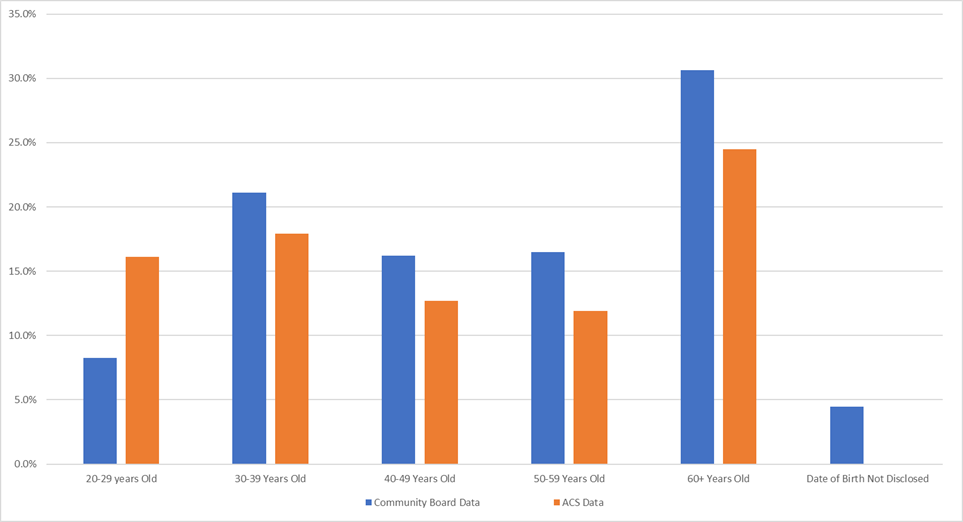
Chart IV: 2023 Manhattan Community Board Members’ Education Levels Compared to ACS Boroughwide Data
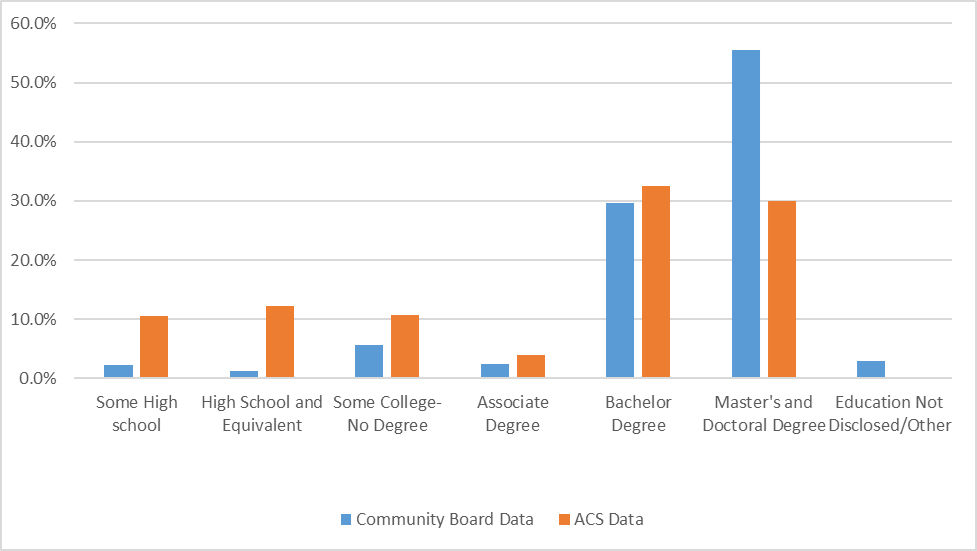
Chart V: 2023 Manhattan Community Board Members Residing in Public Housing Compared to District Data
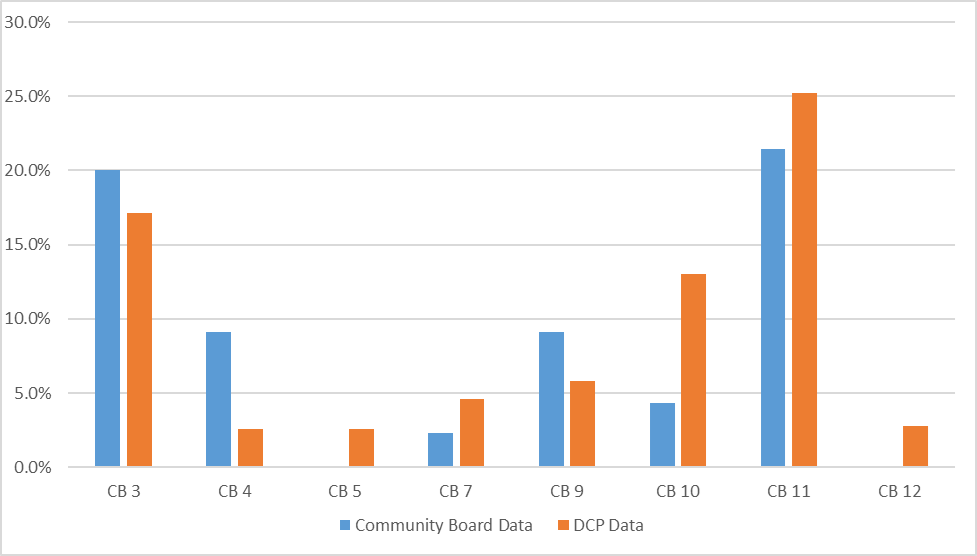
Chart VI: 2023 Disability Status of Manhattan Community Board Members Compared to ACS District Data
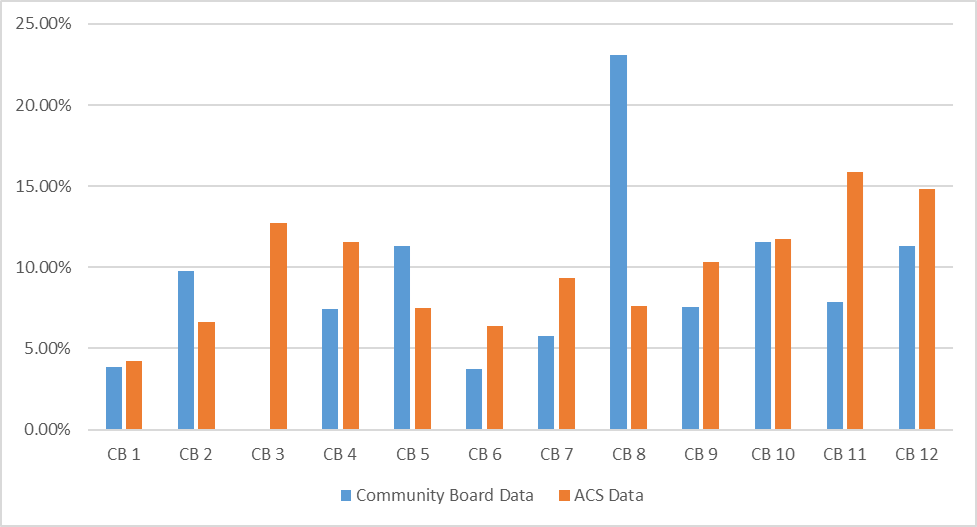
Exhibit I: Geographic Representation of Manhattan Community Board 9
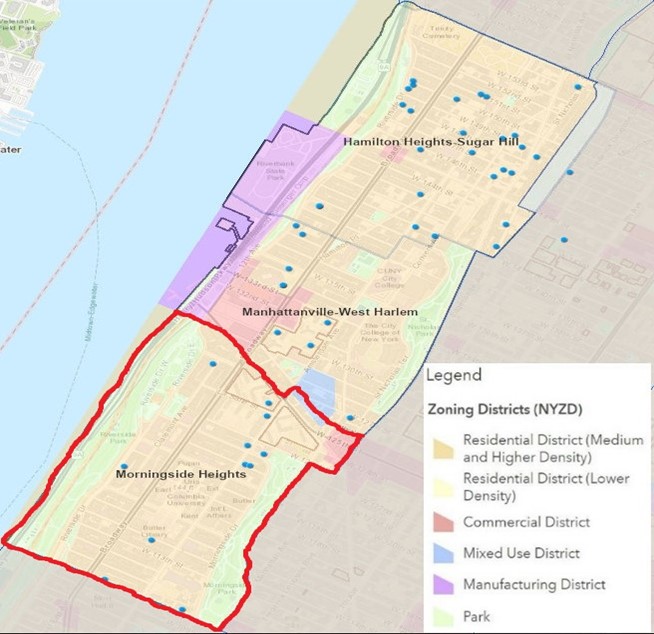
Appendix 4
Queens Community Board Member Demographics
Chart I: 2023 Queens Community Board Members’ Race/Ethnicity Compared to ACS Boroughwide Data
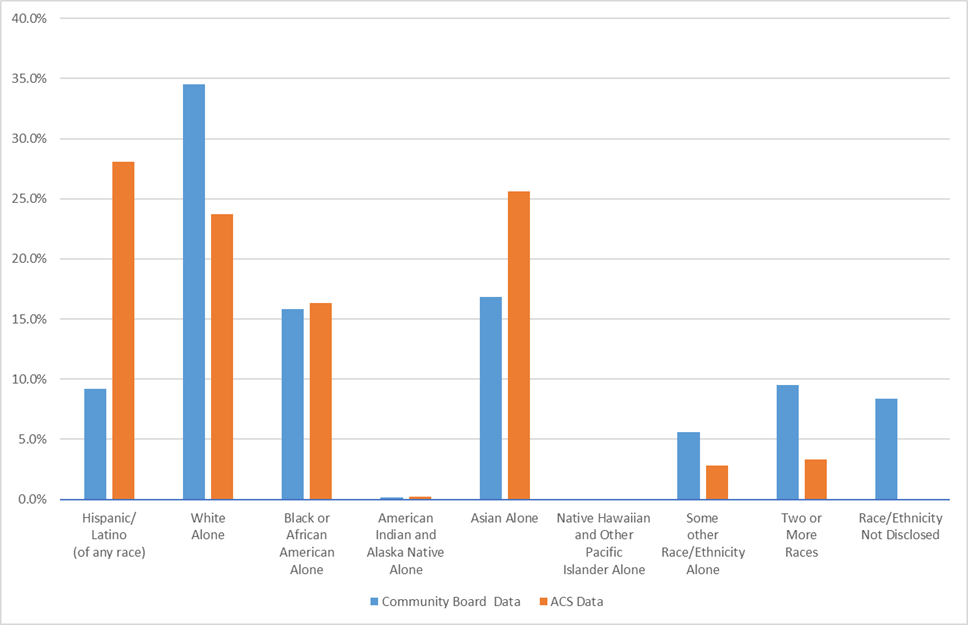
Table I: 2023 Queens Community Board Members’ Race/Ethnicity Data Compared to ACS Boroughwide Data
| Census/ACS Race/Ethnicity Categories | QBPO Race/Ethnicity Categories Included for Comparative Analysis | QBPO Boro-Wide (%) | ACS Boro-Wide (%) | Difference (%) |
|---|---|---|---|---|
| Hispanic/Latino (of any race) | Latina/o/x/Hispanic | 9.2% | 28.1% | (18.9%) |
| Asian Alone | East Asian/Southeast Asian/Pacific Islander, South Asian, or Both of the Above | 16.8% | 25.6% | (8.8%) |
| Black or African American Alone | African American/Black | 15.8% | 16.3% | (0.5%) |
| American Indian and Alaska Native Alone | Native American/American Indian | 0.1% | 0.2% | (0.1%) |
| Some Other Race/Ethnicity Alone | Caribbean/West Indian, Southwest Asian (Middle Eastern)/North African, Sub-Saharan African, Other | 5.6% | 2.8% | 2.8% |
| Two or More Races | 9.5% | 3.3% | 6.2% | |
| White Alone | White/European | 34.5% | 23.7% | 10.8% |
| Native Hawaiian and Other Pacific Islander Alone | QBPO did not discretely collect | 0.0% | ||
| Race/Ethnicity Not Disclosed | 8.3% | |||
| Grand Total | 100% | 100% |
Chart II: 2023 Queens Community Board Members’ Gender Compared to ACS Boroughwide Data
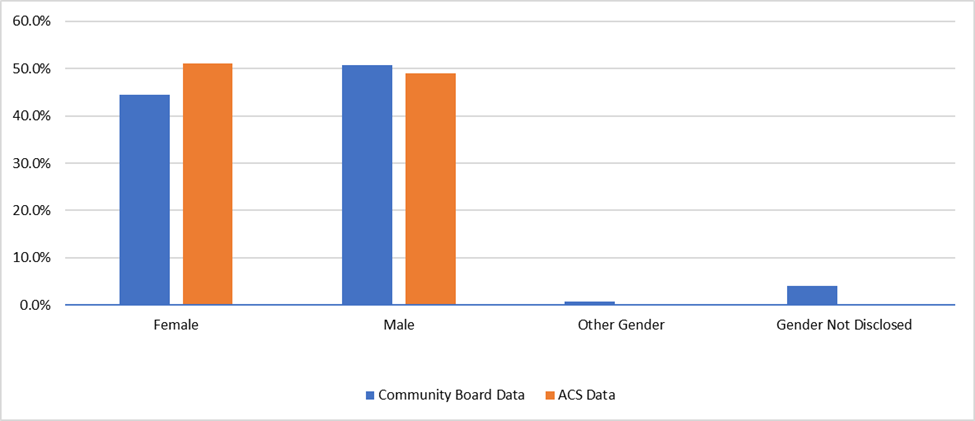
Chart III: 2023 Queens Community Board Members’ Ages Compared to ACS Boroughwide Data
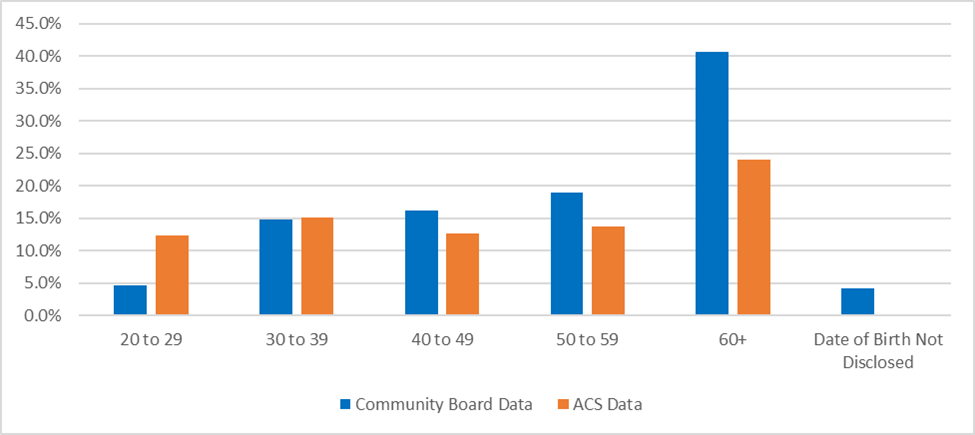
Chart IV: 2023 Queens Community Board Members’ Education Levels Compared to ACS Boroughwide Data
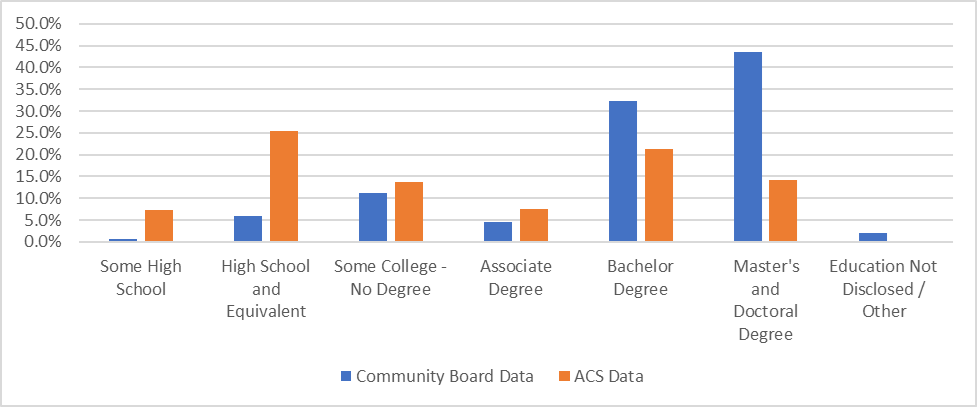
Chart V: 2023 Queens Community Board Members Residing in Public Housing Compared to District Data
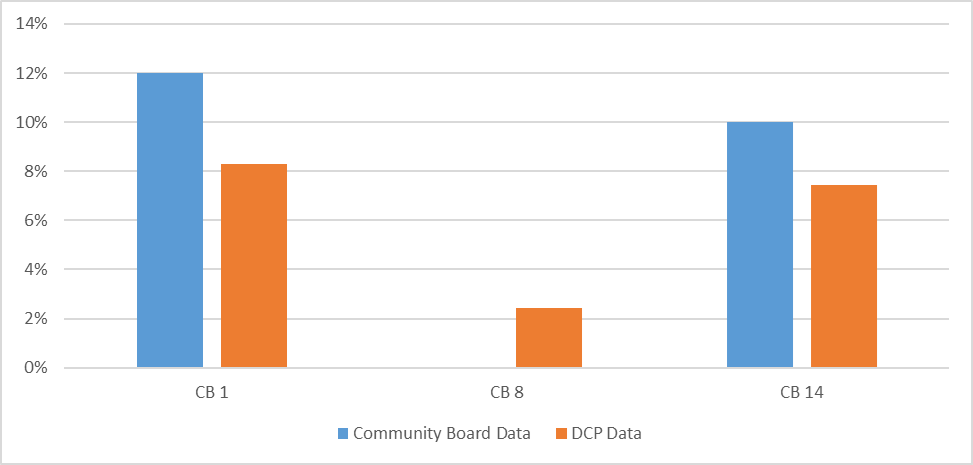
Chart VI: 2023 Disability Status of Queens Community Board Members Compared to ACS District Data
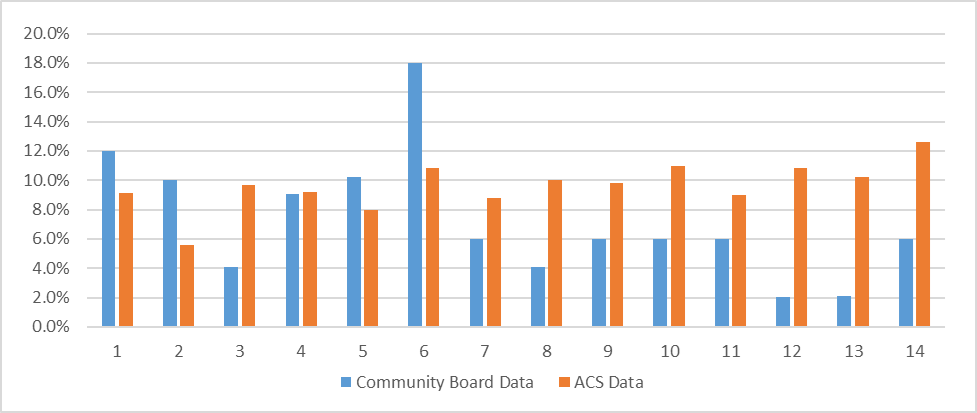
Exhibit I: Geographic Representation of Queens Community Board 3
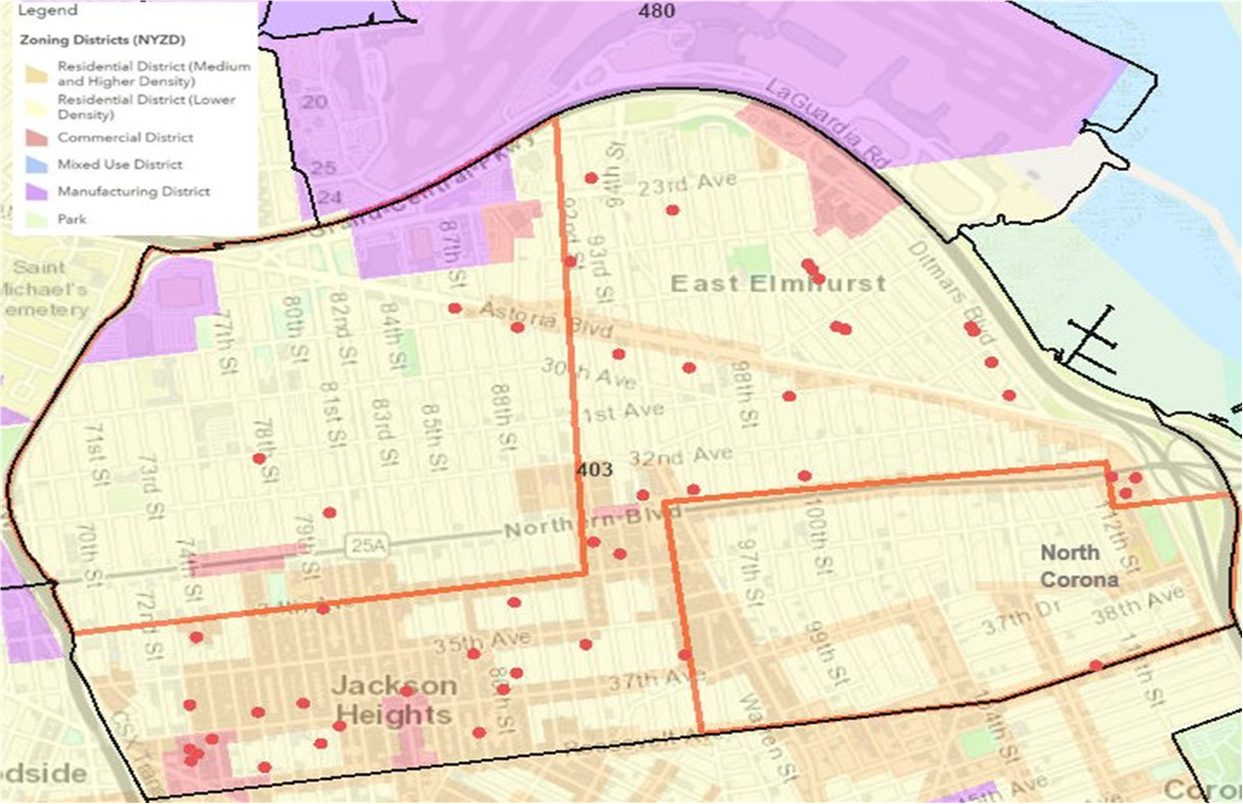
Appendix 5
Staten Island Community Board Member Demographics
Chart I: 2023 Staten Island Community Board Members’ Race/Ethnicity Compared to ACS Boroughwide Data
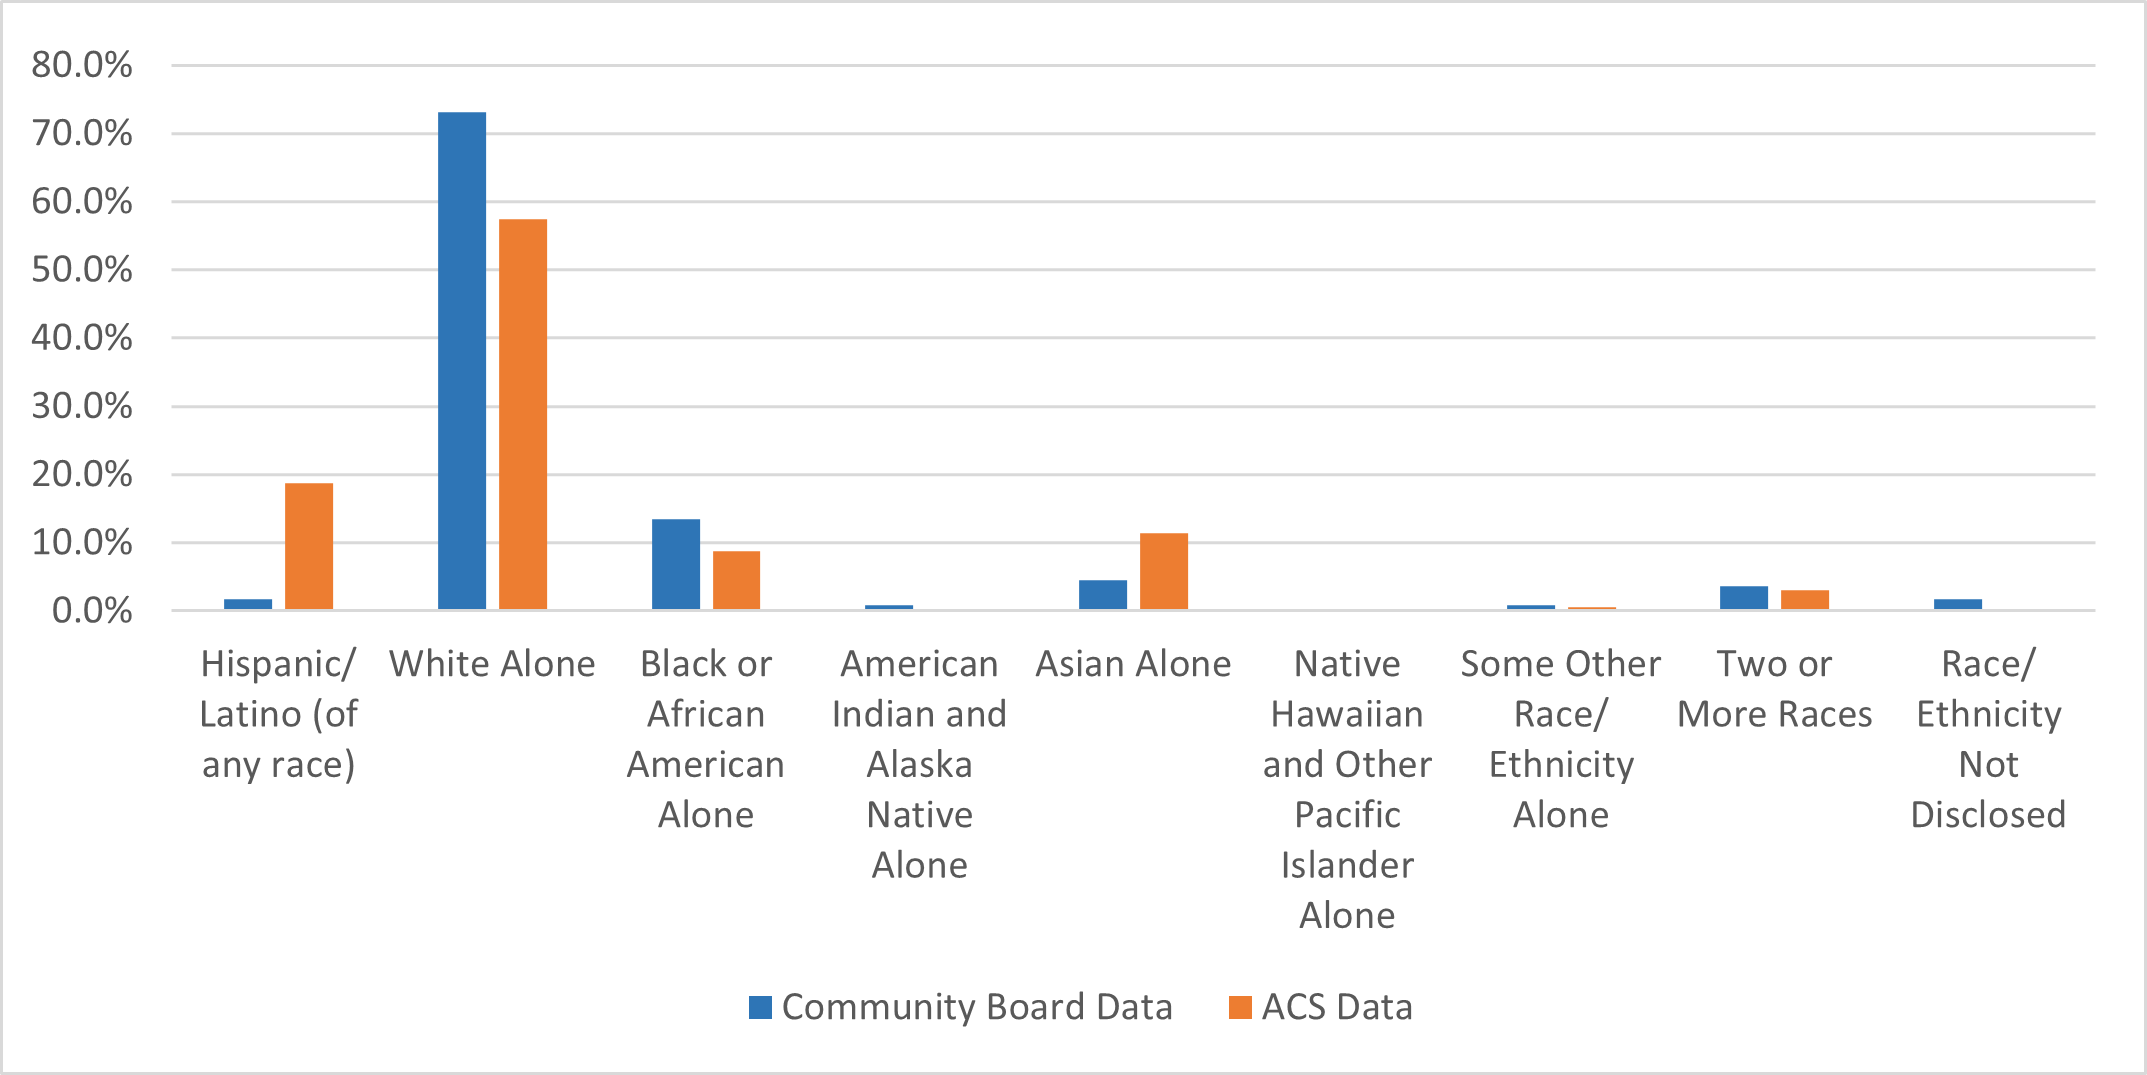
Table I: 2023 Staten Island Community Board Members’ Race/Ethnicity Compared to ACS Boroughwide Data
| Census/ACS Race/Ethnicity Categories | SIBPO Race/Ethnicity Categories Included for Comparative Analysis | SIBPO Boro-Wide (%) | ACS Boro-Wide (%) | Difference (%) |
|---|---|---|---|---|
| Hispanic/Latino (of any race) | Latina/o/x/Hispanic | 1.8% | 18.7% | (16.9%) |
| Asian Alone | Asian American, East Asian/Southeast Asian/Pacific Islander, South Asian | 4.5% | 11.4% | (6.9%) |
| Some Other Race Alone | Caribbean/West Indian, Middle Eastern/North African, Sub-Saharan African | 0.9% | 0.5% | 0.4% |
| Two or More Races | 3.6% | 3.0% | 0.6% | |
| American Indian and Alaska Native Alone | Native American/American Indian | 0.9% | 0.2% | 0.7% |
| Black or African American Alone | African American/Black | 13.4% | 8.8% | 4.6% |
| White Alone | White/European | 73.2% | 57.5% | 15.7% |
| Native Hawaiian and Other Pacific Islander Alone | SIBPO did not discretely collect | 0.0% | ||
| Race/Ethnicity Not Disclosed | 1.8% | |||
| Grand Total | 100% | 100% |
Chart II: 2023 Staten Island Community Board Members’ Gender Compared to ACS Boroughwide Data
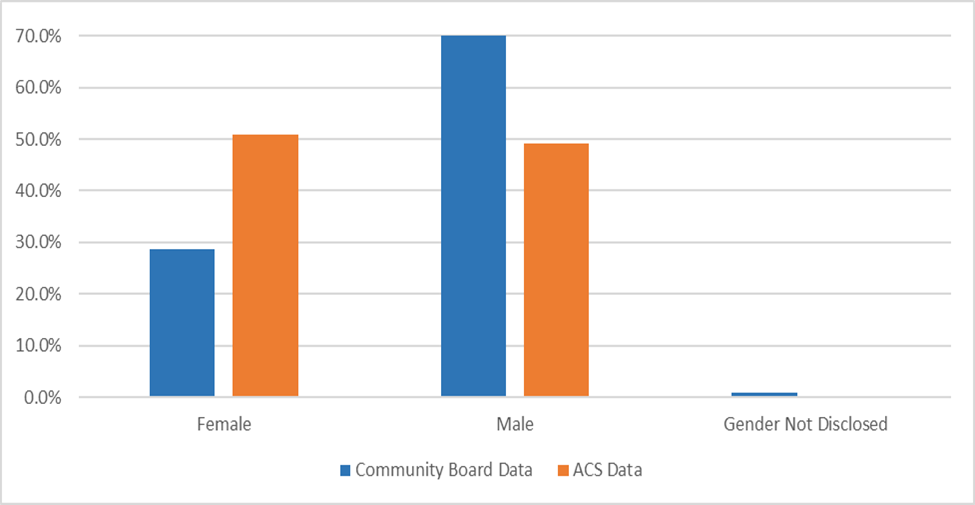
Chart III: 2023 Staten Island Community Board Members’ Ages Compared to ACS Boroughwide Data
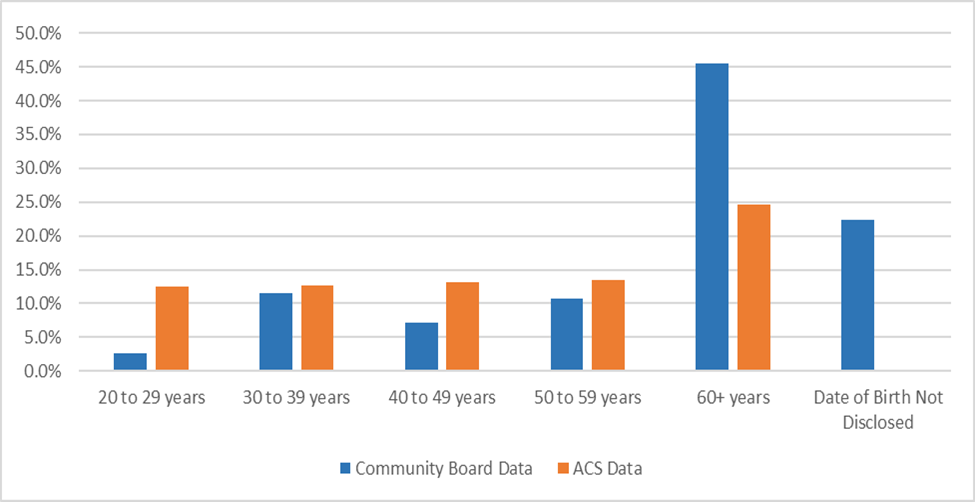
Chart IV: 2023 Staten Island Community Board Members’ Education Levels Compared to ACS Boroughwide Data
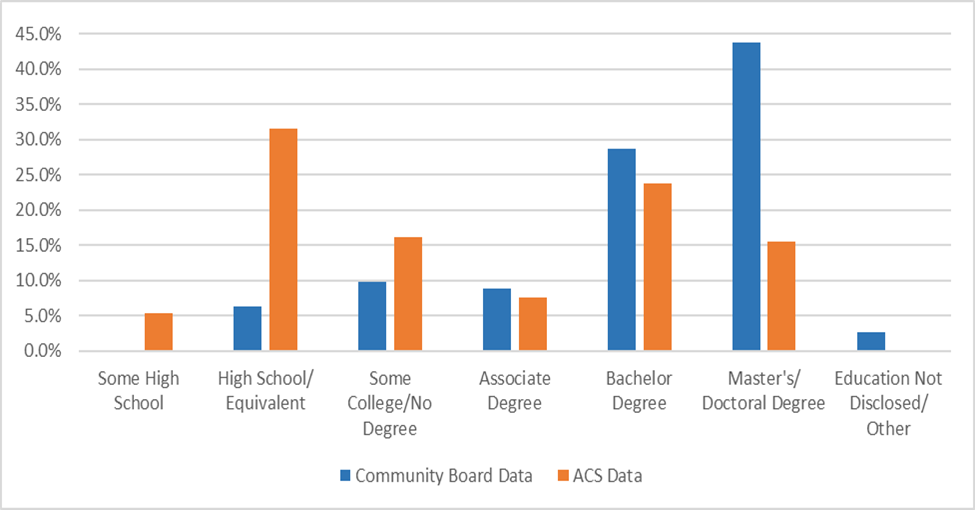
Chart V: 2023 Staten Island Community Board Members Residing in Public Housing Compared to District Data
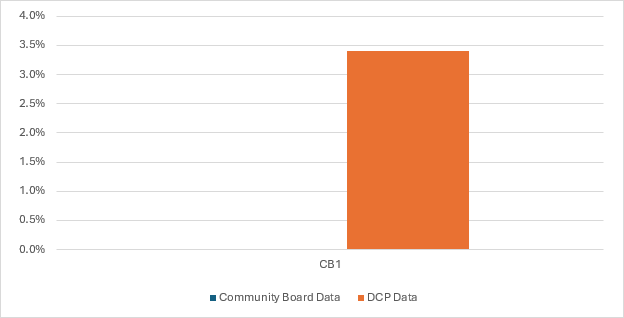
Chart VI: 2023 Disability Status of Staten Island Community Board Members Compared to ACS District Data
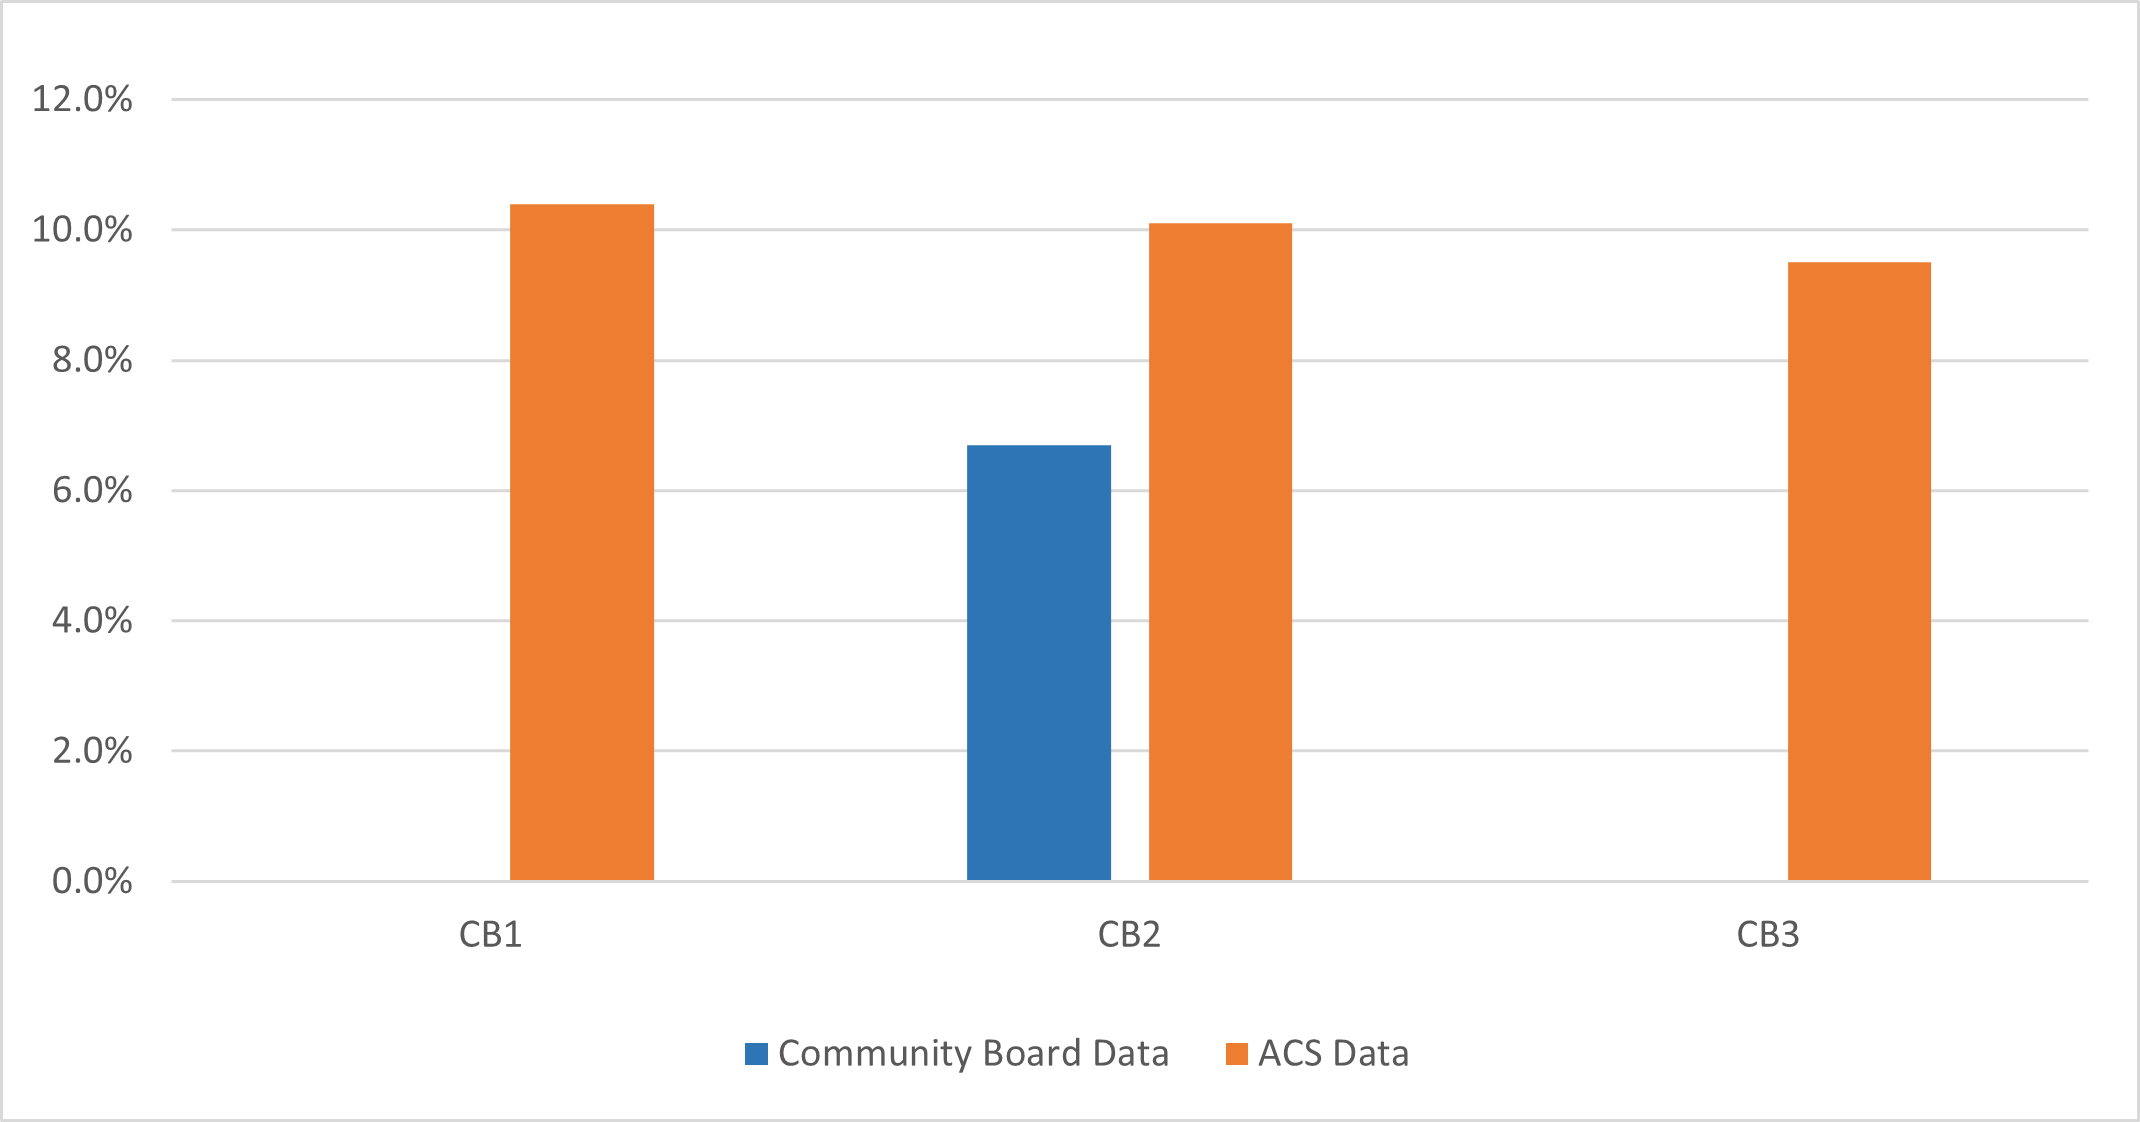
Exhibit I: Geographic Representation of Staten Island Community Board 2
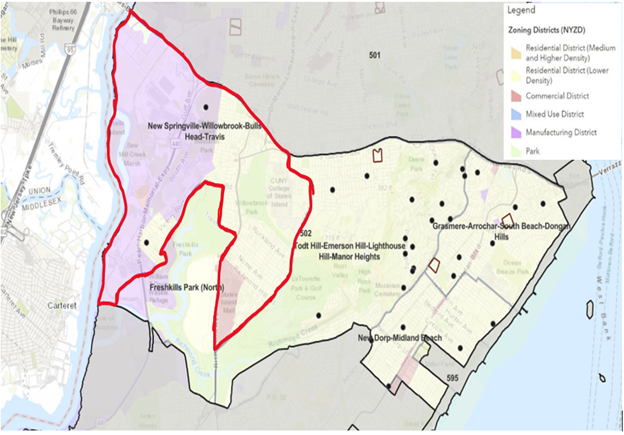
Addendum
Footnotes
[1] LGBTQIA is an acronym for lesbian, gay, bisexual, transgender, queer or questioning, intersex, and asexual or allied.
[2] As part of the Fair Share process, the Community Boards can comment on facilities that are controlled and supervised by City agencies. These facilities include facilities perceived as burdensome such as homeless shelters, and substance abuse, correctional, and waste management facilities, as well as beneficial facilities such as parks and playgrounds, libraries, and daycare and senior centers.
[3] The Queens Borough President took office in 2021, and the Bronx, Brooklyn, Manhattan, and Staten Island Borough Presidents took office in 2022.
[4] The auditors compared the 2023 Community Board members’ boroughwide data to the 2021 1-year ACS boroughwide demographic data. In addition, the auditors compared the 2023 Community Board members’ district-level data to the 2021 5-year ACS district-level demographic data. This was the most recent ACS data available at the time of the 2023 Community Board appointment process.
[5] According to New York City Charter; Chapter 70; City Government in The Community, Section 2801; Actions of community boards, “A majority of the appointed members of any community board shall constitute a quorum of such board.… [the] determination or decision of the majority of the members present entitled to vote during the presence of a quorum, shall be held to be the act, determination or decision of such board.”
[6] The ACS collects information for Hispanic/Latino (of any race), whereas the Bronx Community Board Membership Application for 2023 collects information as Latina/o/x/Hispanic.
[7] Of the 540 Bronx Community Board members, the BXBPO provided race/ethnicity data for 447 (82.8%) members.
[8] The ACS collects the race/ethnicity information for Hispanic/Latino (of any race), whereas the Brooklyn Community Board Membership Application for 2023 collects information as Latina/o/e/Hispanic.
[9] Of the 891 Brooklyn Community Board members, 809 (90.8%) voluntarily disclosed their race/ethnicity on applications.
[10] The ACS collects race/ethnicity information for Asian Alone. For purposes of this analysis, the audit team considered Community Board members who identified as East Asian/Southeast Asian/Pacific Islander, South Asian, or both, as Asian Alone.
[11] Hispanic/Latino residents are underrepresented by 10% or more on 13 of the 18 Brooklyn Community Boards, all except for Community Boards 7, 9, 15, 17, and 18. In particular, Community Boards 2, 10, and 14 do not have any members who identify as Hispanic/Latino Alone.
[12] Asian residents are underrepresented by 10% or more on 4 of the 18 boards (10, 11, 12, and 15).
[13] The ACS collects information for Hispanic/Latino (of any race), whereas the Manhattan Community Board Membership Application for 2023 collects information as Latina/o/x/Hispanic.
[14] Of the 630 Manhattan Community Board members, 585 (92.9%) voluntarily disclosed their race/ethnicity on applications.
[15] Hispanic/Latino residents are underrepresented by 10% or more on 4 of the 12 boards (9, 10, 11, and 12).
[16] The ACS collects information for Hispanic/Latino (of any race), whereas the Queens Community Board Membership Application for 2023 collects information as Latina/o/x/Hispanic.
[17] Of the 695 Queens Community Board members, 637 (91.7%) voluntarily disclosed their race/ethnicity on applications.
[18] The ACS collects information for Asian Alone. For purposes of this analysis, the audit team considered Community Board members who identified as East Asian/South East Asian /Pacific Islander and South Asian, or both of the above to be considered Asian Alone.
[19] The ACS collects information for White Alone, whereas the Queens Community Board Membership Application for 2023 collects information as White/European.
[20] Hispanic/Latino residents are underrepresented by 10% or more on 11 of the 14 Queens Community Boards, all except for Community Boards 6, 10, and 11.
[21] Asian residents are underrepresented by 10% or more on five of the 14 Queens Community Boards (4, 6, 10, 11, and 13).
[22] The ACS collects the race/ethnicity information for Hispanic/Latino (of any race), whereas the Staten Island Community Board Membership Application for 2023 collects the information as Latina/o/x/Hispanic.
[23] Of the 112 Staten Island Community Board members, 110 (98.2%) voluntarily disclosed their race/ethnicity on applications.
[24] The ACS collects the race/ethnicity information for Asian Alone. For purposes of this analysis, the audit team considered Community Board members who identified as Asian American, East Asian/South East Asian/Pacific Islander, and South Asian, or a combination of the above as Asian Alone.
[25] The ACS collects the race/ethnicity information for White Alone, whereas the Staten Island Community Board Membership Application for 2023 collects the information as White/European.
[26] Beginning in July 2021, the U.S. Census Bureau included questions regarding sexual orientation and gender identity (SOGI) on its Household Pulse Survey; however, this data is not yet available at the community level. In May 2024, the Census Bureau published a Federal Register notice asking for public comment on a proposed test of sexual orientation and gender identity questions on the American Community Survey (ACS).
https://www.census.gov/library/visualizations/interactive/sexual-orientation-and-gender-identity.html https://www.census.gov/newsroom/press-releases/2024/test-sogi-questions.html
https://www.census.gov/newsroom/press-releases/2024/test-sogi-questions.html#:~:text=MAY%201%2C%202024%20%E2%80%94%20The%20U.S
[27] On their respective 2023 Community Board Membership Applications, the five Borough Presidents’ Offices provided applicants with different gender selection options. The Bronx and Brooklyn Borough Presidents’ Offices allowed applicants to voluntarily disclose their gender by selecting female, male, gender non-conforming, or other. The Manhattan and Staten Island Borough Presidents’ Offices allowed applicants to select female, male, gender non-conforming, or transgender, and the Queens Borough President’s Office allowed applicants to select female, male, gender non-binary, or gender non-conforming.
[28] https://www.health.ny.gov/statistics/brfss/reports/docs/2022-16_brfss_sogi.pdf
[29] Of the 540 Bronx Community Board members, the BXBPO provided gender data for 457 (84.6%) members.
[30] Of the 891 Brooklyn Community Board members, 837 (93.9%) voluntarily disclosed their gender on applications.
[31] Of the 630 Manhattan Community Board members, 613 (97.3%) voluntarily disclosed their gender on applications.
[32] Of the 695 Queens Community Board members, 669 (96.3%) voluntarily disclosed their gender on applications.
[33] Of the 112 Staten Island Community Board members, 111 (99.1%) voluntarily disclosed their gender on applications.
[34] The terminology used on 2023 Community Board Membership Applications varied among the Borough Presidents’ Offices. The Bronx, Manhattan, Queens, and Staten Island Borough Presidents’ Offices allowed applicants to voluntarily disclose other background information about themselves and allowed applicants to select options including LGBTQIA+ and LGBTQ+.
[35] https://www.health.ny.gov/statistics/brfss/reports/docs/2022-16_brfss_sogi.pdf
[36] As previously stated, Community Board members serve staggered two-year terms. Community Board members serving in 2023 were appointed in 2022 and 2023.
[37] Of the 145 Bronx Community Board members who were appointed or reappointed in 2023, the BXBPO provided age data for 143 (98.6%) members.
[38] Of the 891 Brooklyn Community Board members, 805 (90.3%) disclosed their date of birth on applications.
[39] The demographic data analysis on age was based on the information collected by the MBPO on a voluntary basis. The application for 2022 did not include the date of birth for the members. Age was collected in the ranges of 20 to 29, 30 to 39, 40 to 49, 50 to 59, and 60+. Not all Community Board members chose to disclose their demographic information.
[40] Of the 630 Manhattan Community Board members, 602 (95.6%) voluntarily disclosed their age on applications.
[41] The demographic data analysis on age was based on the information collected by the QBPO on a voluntary basis. The application for 2022 did not include the date of birth for the members. Age was collected in the ranges of 20 to 29, 30 to 39, 40 to 49, 50 to 59, and 60+. Not all Community Board members chose to disclose their demographic information.
[42] Of the 695 Queens Community Board members, 666 (95.8%) voluntarily disclosed their age on applications.
[43] Of the 112 Staten Island Community Board members, 87 (77.7%) disclosed their date of birth on applications or their age range on the demographic forms.
[44] Of the 138 Bronx Community Board members from three sampled Community Boards (4, 11, and 12), 132 (95.7%) voluntarily disclosed their level of education on applications.
[45] Of the 891 Brooklyn Community Board members, 778 (87.3%) voluntarily disclosed their level of education on applications.
[46] Of the 630 Manhattan Community Board members, 612 (97.1%) voluntarily disclosed their level of education on applications.
[47] Of the 695 Queens Community Board members, 681 (98%) voluntarily disclosed their level of education on applications.
[48] Of the 112 Staten Island Community Board members, 111 (99.1%) voluntarily disclosed their level of education on applications.
[49] The auditors cited those Community Boards which had underrepresentation of at least one NYCHA resident.
[50] For the 10 Community Boards which have NYCHA developments located in their districts and where NYCHA residents account for at least 2% of the district population, the audit team mapped all members’ residential addresses to determine whether they were NYCHA residents. Community Boards 4 and 10 have NYCHA developments located in their districts, but NYCHA residents account for less than 2% of the population within those districts. Therefore, the audit team excluded Community Boards 4 and 10 from the district-level demographic analysis.
[51] For the 11 Community Boards which have NYCHA developments located in their districts and NYCHA residents account for at least 2% of the district population, the audit team mapped all members’ residential addresses to determine whether they were NYCHA residents. Community Boards 9 and 17 have NYCHA developments located in their districts, but NYCHA residents account for only 0.3% and 0.2%, respectively, of the population within those districts. Therefore, the audit team excluded Community Boards 9 and 17 from the district-level demographic analysis.
[52] The audit team cited those Community Boards which had underrepresentation of at least one NYCHA resident.
[53] For the eight Community Boards which have NYCHA developments located in their districts and NYCHA residents account for at least 2% of the district population, the audit team mapped all members’ residential addresses to determine whether they were NYCHA residents. Community Boards 6 and 8 have NYCHA developments located in their districts, but NYCHA residents account for only 0.5% and 1%, respectively, of the population within those districts. Therefore, the audit team excluded Community Boards 6 and 8 from the district-level demographic analysis.
[54] For the three Community Boards which have NYCHA developments located in their districts and where NYCHA residents account for at least 2% of the district population, the audit team mapped all members’ residential addresses to determine whether they were NYCHA residents. Community Boards 7 and 12 have NYCHA developments located in their districts, but NYCHA residents account for only 0.6% and 1.5%, respectively, of the population within those districts. Therefore, the audit team excluded Community Boards 7 and 12 from the district-level demographic analysis.
[55] For one Community Board which has NYCHA developments located in its district and where NYCHA residents account for at least 2% of the district population, the audit team mapped all members’ residential addresses to determine whether they were NYCHA residents. Community Board 2 has NYCHA developments located in its district, but NYCHA residents account for only 1.9% of the population within that district. Therefore, the audit team excluded Community Board 2 from the district-level demographic analysis.
[56] For each borough’s Community Board Membership Application, applicants are allowed to voluntarily disclose any background information. Responses include but are not limited to “Person with a disability.”
[57] The auditors were not provided with boroughwide data on Bronx Community Board members’ disability status. The review was limited to three sampled Bronx Community Boards.
[58] The audit team cited those Community Boards which had underrepresentation of at least one person with a disability: Community Boards 1, 2, 8 through 13, 15, 16, and 18.
[59] The audit team cited those Community Boards which had underrepresentation of at least one person with a disability: Community Boards 3, 4, 6, 7, 9, 11, and 12.
[60] The auditors cited those Community Boards which had underrepresentation of at least one person with a disability: Community Boards 3 and 7–14.
[61] For 3 of the 14 Community Board members who stated that they lived in the district, the BBPO stated that they also worked, owned a business, or had another significant interest in the district and provided the auditors with their associated addresses. Based on the auditors’ review, those addresses were located within the districts for which the members applied to serve. Similarly, for 4 of the 20 Community Board members who stated that they had a professional or other significant interest in the district, the BBPO provided the auditors with the names and/or addresses of organizations which were based in the district for which members applied to serve.