Comments on New York City’s Fiscal Year 2019 Adopted Budget
Executive Summary
The City’s Fiscal Year (FY) 2019 budget as adopted is $89.16 billion, down 0.5 percent from FY 2018’s $89.6 billion. Accounting for prepayments and reserves, however, adjusted spending is up $2.9 billion, or 3.2 percent, to $92.36 billion in FY 2019. Projected expenditure growth averages 1.7 percent annually in the remaining years of the Plan through FY 2022.
Two notable developments – one just prior to budget adoption, and one shortly after – have implications for the City’s budget going forward. First, the City and its public housing authority, NYCHA, entered into a consent decree with the U.S. Attorney for the Southern District of New York which requires the City to provide an additional $1 billion in capital funding over the next four years, and to maintain a projected $1.7 billion in other funding commitments during the same period.
Second, the City and District Council 37 (DC 37), representing some 100,000 City employees, reached a labor settlement; at the same time an agreement on additional healthcare savings, applying to all City employees, was approved by the Municipal Labor Committee (MLC). The cost of the DC 37 agreement, net of the budgeted labor reserve and healthcare savings, is projected to add $425 million in spending from FY 2018 through FY 2022. If extended to the remainder of the City’s workforce, the net cost would be $3.3 billion over the same period.
The FY 2019 Budget was balanced using $4.58 billion in surplus resources from FY 2018, an increase of nearly $400 million from the FY 2017 surplus. In addition, the City funded an additional deposit to the Retiree Health Benefit Trust of $100 million above the amount necessary to cover retiree healthcare costs in FY 2019. The City also increased the FY 2019 General Reserve by $125 million to $1.125 billion.
The Comptroller’s assessment of the budget and financial plan’s assumptions results in a small projected surplus in FY 2019 of $151 million, but wider gaps in subsequent years than those projected by the Administration, larger by $920 million in FY 2020, $949 million in FY 2021, and $1.1 billion in FY 2022. Our higher projected gaps can largely be attributed to the cost of extending the DC 37 labor settlement to the rest of the City workforce, and to other spending risks. These are partially offset by our somewhat more optimistic revenue forecast, which projects in particular higher real property tax receipts.
The projected gap for FY 2020 is $4.2 billion, in our estimate. The last several years have seen changes in the budget from Adoption that resulted in surpluses that were used to address the following year’s gap. Based on the Comptroller’s projections, the City would have enough funds available that, even without additional revenues or spending reductions, FY 2020 could be balanced through the use of budgeted reserves and built-up surpluses in the Retiree Health Benefit Trust. But an economic downturn could lower revenues below current projections for several years, and the City would have limited wherewithal to avoid the eventual need for painful spending cuts, revenue increases, or both. The Comptroller continues to believe that the City must do more to better prepare for future uncertainties. Future rounds of the Citywide Savings Plan must demand more effort from individual agency budgets, including rigorous evaluations of the returns on spending in areas such as homelessness, corrections, and education, in order to increase the level of reserves available in the event of a downturn.
Table 1. FY 2019 – FY 2022 Financial Plan
| ($ in millions) | FY 2019 | FY 2020 | FY 2021 | FY 2022 | Change FYs 2019 – 2022 Dollar Percent |
|
| Revenues | ||||||
| Taxes | ||||||
| General Property Tax | $27,974 | $29,477 | $30,891 | $31,880 | $3,906 | 14.0% |
| Other Taxes | 31,046 | 32,151 | 33,150 | 33,894 | 2,848 | 9.2% |
| Tax Audit Revenues | 1,056 | 721 | 721 | 721 | (335) | (31.7%) |
| Subtotal Taxes | $60,076 | $62,349 | $64,762 | $66,495 | $6,419 | 10.7% |
| Miscellaneous Revenues | 6,792 | 6,731 | 6,737 | 6,716 | (76) | (1.1%) |
| Less: Intra-City Revenues | (1,825) | (1,771) | (1,776) | (1,776) | 49 | (2.7%) |
| Disallowances Against Categorical Grants | (15) | (15) | (15) | (15) | 0 | 0.0% |
| Subtotal City-Funds | $65,028 | $67,294 | $69,708 | $71,420 | $6,392 | 9.8% |
| Other Categorical Grants | 880 | 872 | 867 | 861 | (19) | (2.2%) |
| Inter-Fund Revenues | 682 | 641 | 638 | 638 | (44) | (6.5%) |
| Federal Categorical Grants | 7,592 | 7,129 | 7,108 | 7,092 | (500) | (6.6%) |
| State Categorical Grants | 14,976 | 15,302 | 15,763 | 16,246 | 1,270 | 8.5% |
| Total Revenues | $89,158 | $91,238 | $94,084 | $96,257 | $7,099 | 8.0% |
| Expenditures | ||||||
| Personal Service | ||||||
| Salaries and Wages | $28,746 | $29,620 | $30,368 | $30,069 | $1,323 | 4.6% |
| Pensions | 9,852 | 9,903 | 10,162 | 10,367 | 515 | 5.2% |
| Fringe Benefits | 10,737 | 11,643 | 12,414 | 13,094 | 2,357 | 22.0% |
| Subtotal PS | $49,335 | $51,166 | $52,944 | $53,530 | $4,195 | 8.5% |
| Other Than Personal Service | ||||||
| Medical Assistance | $5,915 | $5,915 | $5,915 | $5,915 | $0 | 0.0% |
| Public Assistance | 1,605 | 1,617 | 1,617 | 1,617 | 12 | 0.7% |
| All Other | 30,342 | 28,848 | 29,167 | 29,446 | (896) | (3.0%) |
| Subtotal OTPS | $37,862 | $36,380 | $36,699 | $36,978 | ($884) | (2.3%) |
| Debt Service | ||||||
| Principal | $3,429 | $3,636 | $3,632 | $3,761 | $332 | 9.7% |
| Interest & Offsets | 3,558 | 3,837 | 4,224 | 4,799 | 1,242 | 34.9% |
| Subtotal Debt Service | $6,987 | $7,473 | $7,856 | $8,560 | $1,574 | 22.5% |
| FY 2018 BSA and Discretionary Transfers | ($4,576) | $0 | $0 | $0 | $4,576 | (100.0%) |
| Capital Stabilization Reserve | $250 | $250 | $250 | $250 | $0 | 0.0% |
| General Reserve | $1,125 | $1,000 | $1,000 | $1,000 | ($125) | (11.1%) |
| Subtotal | $90,983 | $96,269 | $98,749 | $100,318 | $9,336 | 10.3% |
| Less: Intra-City Expenses | (1,825) | (1,771) | (1,776) | (1,776) | 49 | (2.7%) |
| Total Expenditures | $89,158 | $94,498 | $96,973 | $98,542 | $9,385 | 10.5% |
| Gap To Be Closed | $0 | ($3,260) | ($2,889) | ($2,285) | ($2,286) | NA |
Note: Numbers may not add due to rounding.
Table 2. Plan-to-Plan Changes
June 2018 Plan vs. April 2018 Plan
| ($ in millions) | FY 2019 | FY 2020 | FY 2021 | FY 2022 |
| Revenues | ||||
| Taxes | ||||
| General Property Tax | $0 | $0 | $0 | $0 |
| Other Taxes | 0 | 0 | 0 | 0 |
| Tax Audit Revenues | 0 | 0 | 0 | 0 |
| Subtotal Taxes | $0 | $0 | $0 | $0 |
| Miscellaneous Revenues | 3 | (99) | 2 | 2 |
| Less: Intra-City Revenues | (1) | (1) | (2) | (2) |
| Disallowances Against Categorical Grants | 0 | 0 | 0 | 0 |
| Subtotal City-Funds | $2 | ($100) | $0 | $0 |
| Other Categorical Grants | 1 | 1 | 1 | 0 |
| Inter-Fund Revenues | 0 | 0 | 0 | 0 |
| Federal Categorical Grants | 85 | 2 | 2 | 3 |
| State Categorical Grants | 7 | 3 | 3 | 3 |
| Total Revenues | $95 | ($94) | $6 | $6 |
| Expenditures | ||||
| Personal Service | ||||
| Salaries and Wages | $29 | $9 | $9 | $9 |
| Pensions | 0 | 0 | 0 | 0 |
| Fringe Benefits | 4 | (4) | (4) | (4) |
| Subtotal PS | $33 | $5 | $5 | $5 |
| Other Than Personal Service | ||||
| Medical Assistance | $0 | $0 | $0 | $0 |
| Public Assistance | 0 | 0 | 0 | 0 |
| All Other | 837 | (16) | 82 | 82 |
| Subtotal OTPS | $837 | ($16) | $82 | $82 |
| Debt Service | ||||
| Principal | $373 | $45 | $115 | $103 |
| Interest & Offsets | (348) | (82) | (163) | (151) |
| Subtotal Debt Service | $25 | ($38) | ($48) | ($48) |
| FY 2018 BSA and Discretionary Transfers | ($924) | $0 | $0 | $0 |
| Capital Stabilization Reserve | $0 | $0 | $0 | $0 |
| General Reserve | $125 | $0 | $0 | $0 |
| Subtotal | $957 | $96 | ($49) | $39 |
| Less: Intra-City Expenses | (1) | (1) | (2) | (2) |
| Total Expenditures | $95 | ($50) | $37 | $37 |
| Gap To Be Closed | $0 | ($44) | ($31) | ($31) |
Note: Numbers may not add due to rounding.
Table 3. Plan-to-Plan Changes
June 2018 Plan vs. June 2017 Plan
| ($ in millions) | FY 2019 | FY 2020 | FY 2021 |
| Revenues | |||
| Taxes | |||
| General Property Tax | $235 | $374 | $667 |
| Other Taxes | 0 | (110) | (342) |
| Tax Audit Revenues | 335 | 0 | 0 |
| Subtotal Taxes | 570 | 264 | 325 |
| Miscellaneous Revenues | 144 | (132) | (113) |
| Less: Intra-City Revenues | (88) | (32) | (32) |
| Disallowances Against Categorical Grants | 0 | 0 | 0 |
| Subtotal City-Funds | $626 | $100 | $180 |
| Other Categorical Grants | 12 | 13 | 11 |
| Inter-Fund Revenues | 18 | 39 | 36 |
| Federal Categorical Grants | 578 | 214 | 207 |
| State Categorical Grants | 104 | (69) | 36 |
| Total Revenues | $1,338 | $297 | $470 |
| Expenditures | |||
| Personal Service | |||
| Salaries and Wages | $121 | $194 | $303 |
| Pensions | (19) | (40) | 157 |
| Fringe Benefits | (79) | (72) | (91) |
| Subtotal PS | $23 | $82 | $369 |
| Other Than Personal Service | |||
| Medical Assistance | $0 | $0 | $0 |
| Public Assistance | 0 | 0 | 0 |
| All Other | 2,619 | 1,088 | 1,167 |
| Subtotal OTPS | $2,619 | $1,088 | $1,167 |
| Debt Service | |||
| Principal | ($63) | $38 | $41 |
| Interest & Offsets | (175) | (426) | (516) |
| Subtotal Debt Service | ($238) | ($388) | ($475) |
| FY 2018 BSA and Discretionary Transfers | ($4,576) | $0 | $0 |
| Capital Stabilization Reserve | $0 | $0 | $0 |
| General Reserve | $125 | $0 | $0 |
| Subtotal | ($2,047) | $782 | $1,061 |
| Less: Intra-City Expenses | (88) | (32) | (32) |
| Total Expenditures | ($2,135) | $750 | $1,029 |
| Gap To Be Closed | $3,473 | ($453) | ($559) |
Note: Numbers may not add due to rounding.
Table 4. Risks and Offsets to the June 2018 Financial Plan
($ in millions, positive numbers decrease the gap and negative numbers increase the gap)
| FY 2019 | FY 2020 | FY 2021 | FY 2022 | |
| City Stated Gap | $0 | ($3,260) | ($2,889) | ($2,285) |
| Tax Revenues | ||||
| Property Tax | $76 | $303 | $785 | $883 |
| Personal Income Tax | 182 | (117) | (190) | (260) |
| Business Taxes | 169 | 20 | 44 | 53 |
| Sales Tax | 91 | 179 | 149 | 85 |
| Real Estate Transaction Taxes | (23) | (384) | (483) | (79) |
| Audit | 100 | 200 | 200 | 200 |
| Subtotal Tax Revenues | $595 | $201 | $505 | $882 |
| Non-Tax Revenues | ||||
| ECB Fines | $20 | $20 | $20 | $20 |
| Late Filing/No Permit Penalties | 4 | 4 | 4 | 4 |
| Motor Vehicle Fines | 5 | 3 | 3 | 3 |
| Subtotal Non-Tax Revenues | $29 | $27 | $27 | $27 |
| Total Revenues | $624 | $228 | $532 | $909 |
| Expenditures | ||||
| Overtime | ($153) | ($150) | ($150) | ($150) |
| Charter School Tuition | 0 | (119) | (281) | (478) |
| DOE Medicaid Reimbursement | (50) | (50) | (50) | (50) |
| Carter Cases | (60) | (60) | (60) | (60) |
| CEP School Food Program | 0 | 38 | 38 | 38 |
| Homeless Shelters | (33) | (42) | (42) | (42) |
| NYC Health + Hospitals | 0 | (165) | (165) | (165) |
| Collective Bargaining | (227) | (704) | (929) | (1,344) |
| VRDB Interest Savings | 50 | 50 | 50 | 50 |
| Pension Contributions | 0 | 54 | 108 | 162 |
| Subtotal Expenditures | ($473) | ($1,148) | ($1,481) | ($2,039) |
| Total (Risks)/Offsets | $151 | ($920) | ($949) | ($1,130) |
| Restated (Gap)/Surplus | $151 | ($4,180) | ($3,838) | ($3,415) |
FY 2019 Adopted Budget
Overview
The FY 2019 Adopted Budget totals $89.16 billion. Spending on education, social services, fringe benefits, public safety and judicial, pensions and general government accounts for about 83 percent of the budget. As Chart 1 shows, the budget for these areas totals $74 billion.
Chart 1. FY 2019 Budget by Service Areas and Centrally Budgeted Expenditures
($ in millions)
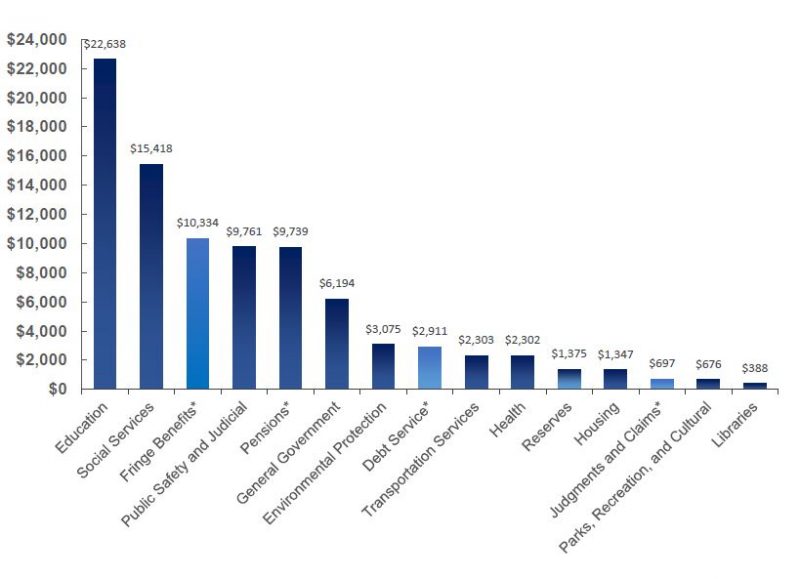
* Centrally Budgeted Expenditures
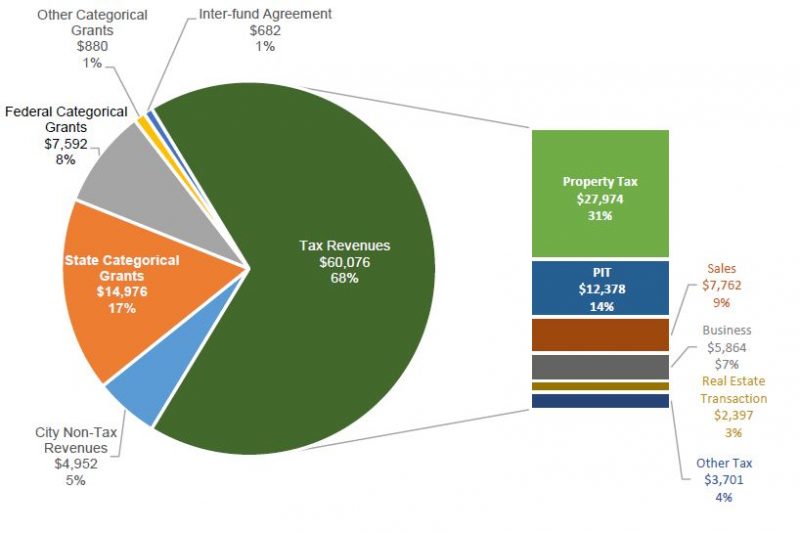
Approximately 73 percent of the budget is supported by estimated City-generated revenues of $65 billion. Tax revenues, which are projected to total $60.1 billion, account for the bulk of City-generated revenues, as shown in Chart 2. Real property, personal income, sales, business, and real estate transaction tax revenues account for almost 94 percent of total tax revenues. City generated non-tax revenues include revenues from licenses, permits and franchises; interest income; charges for services; water and sewer payments from the New York City Water Board; fines and forfeitures; and miscellaneous other non-tax revenues. Revenues from charges for services ($1.0 billion) and New York City Water Board payments ($1.4 billion) account for about half of City-generated non-tax revenues.[1]
Chart 2. Funding Sources, FY 2019 Budget
($ in millions)
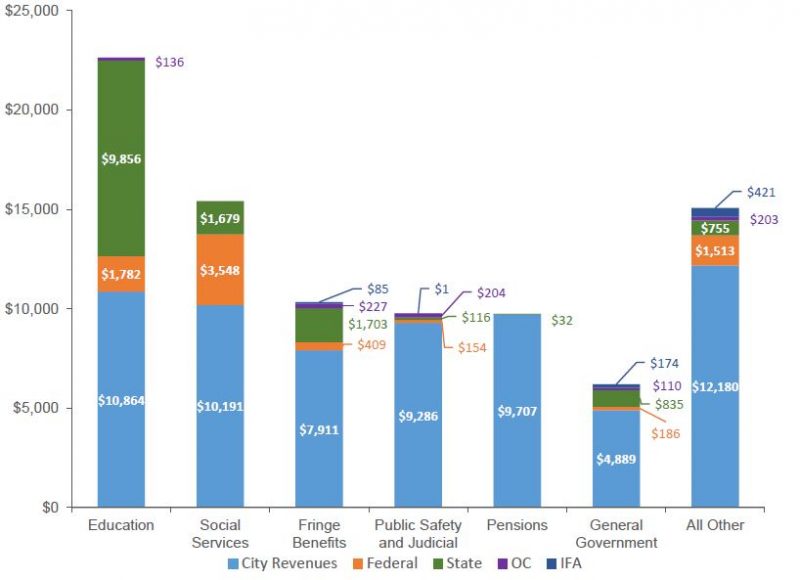
State categorical grants, which support many mandated programs, are estimated at $15.0 billion, accounting for more than 62 percent of non-City revenues. About two-thirds of State categorical grants are earmarked for education. Federal categorical grants account for another $7.6 billion of non-City revenues, of which $236 million are disaster recovery community development block grants (CDBG). More than 46 percent of Federal grants go towards social services and account for almost a quarter of total funding for social services. A significant portion of the budget for the City’s social services agencies rely on Federal funding, including 40 percent of the budget for the Administration for Children’s Services (ACS), 34 percent of the budget for the Department of Homeless Services (DHS), 19 percent of the budget for the Department for the Aging (DFTA), and 16 percent of the budget for the Department of Social Services/Human Resources Administration (HRA).
Other categorical grants and inter-fund agreement (IFA) revenues round out the remaining non-City generated revenues. Other categorical grants consist primarily of reimbursement to the Fire Department for emergency medical services; reimbursements for health benefits from Health Stabilization Fund; payments from Health +Hospitals (H + H) for fringe benefits, judgments and claims, and energy costs; interest exchange agreements, and private grants from foundations and other sources. IFA revenues are reimbursements from the Capital Fund for expense budget costs related to capital projects such as planning design and construction supervision. Chart 3 shows the funding allocation among the different service areas of the budget.
Chart 3. Funding Allocation by Service Areas and Centrally Budgeted Expenditures
($ in millions)
Changes from FY 2018
The FY 2019 Adopted Budget is $439 million less than the modified FY 2018 budget, as shown in Table 5. The decline in revenues is due to a projected $1.4 billion drop in non-City-funds revenues, offset in part by a projected increase of $958 million in City-funds revenues. The drop in non-City-funds revenues is driven primarily by a reduction of $1.37 billion in Federal categorical grants. More than half of the Federal grants reduction is due to the winding down of disaster recovery CDBG, which is projected to drop from $1.07 billion in FY 2018 to $236 million in FY 2019. Another approximately $400 million decrease is due to grants that are included in FY 2018 but not in the outyears, either because they are non-recurring or because they are typically included only in budget modifications subsequent to budget adoption.
The net increase in City-funds revenues result from an increase of $1.06 billion in tax revenues and a decrease of about $100 million in non-tax revenues. Property tax revenues are projected to increase by $1.57 billion to $27.97 billion in FY 2019. Offsetting a significant portion of this increase is the projected decline of $982 million in personal income tax (PIT) revenues. The projected drop of more than 7 percent is due to an elevated level of anticipated FY 2018 PIT revenues driven in large part by non-recurring factors, including the shifting of income into FY 2018 due to the limitation on state and local tax (SALT) deductibility under the Tax Cuts and Jobs Act and tax provisions. Adding to the one-time boost in FY 2018 PIT revenues is a restructuring of the school tax relief (STAR) PIT reimbursement. As a result, final FY 2018 PIT revenues are expected to grow by more than 20 percent from FY 2017.
Table 5. Change FY 2018 – FY 2019
| ($ in millions) | FY 2018 | FY 2019 | $ Change | % Change |
| Revenues | ||||
| Taxes | ||||
| General Property Tax | $26,403 | $27,974 | $1,571 | 6.0% |
| Other Taxes | 31,315 | 31,046 | (269) | (0.9%) |
| Tax Audit Revenues | 1,299 | 1,056 | (243) | (18.7%) |
| Subtotal Taxes | $59,017 | $60,076 | $1,059 | 1.8% |
| Miscellaneous Revenues | 7,206 | 6,792 | (414) | (5.7%) |
| Less: Intra-City Revenues | (2,238) | (1,825) | 413 | (18.5%) |
| Disallowances Against Categorical Grants | 85 | (15) | (100) | (117.6%) |
| Subtotal City-Funds | $64,070 | $65,028 | $958 | 1.5% |
| Other Categorical Grants | 1,072 | 880 | (192) | (17.9%) |
| Inter-Fund Revenues | 637 | 682 | 45 | 7.1% |
| Federal Categorical Grants | 8,964 | 7,592 | (1,372) | (15.3%) |
| State Categorical Grants | 14,854 | 14,976 | 122 | 0.8% |
| Total Revenues | $89,597 | $89,158 | ($439) | (0.5%) |
| Expenditures | ||||
| Personal Services | ||||
| Salaries and Wages | $27,151 | $28,746 | $1,595 | 5.9% |
| Pensions | 9,632 | 9,852 | 220 | 2.3% |
| Fringe Benefits | 10,008 | 10,737 | 729 | 7.3% |
| Retiree Health Benefits Trust | 100 | 0 | (100) | (100.0%) |
| Subtotal PS | $46,891 | $49,335 | $2,444 | 5.2% |
| Other Than Personal Service | ||||
| Medical Assistance | $5,915 | $5,915 | $0 | 0.0% |
| Public Assistance | 1,583 | 1,605 | 22 | 1.4% |
| All Other | 30,925 | 30,342 | (583) | (1.9%) |
| Subtotal OTPS | $38,423 | $37,862 | ($561) | (1.5%) |
| Debt Service | ||||
| Principal | $3,175 | $3,429 | $254 | 8.0% |
| Interest & Offsets | 2,930 | 3,558 | 628 | 21.4% |
| Subtotal Debt Service | $6,105 | $6,987 | $882 | 14.4% |
| FY 2017 BSA & Discretionary Transfer | ($4,180) | $0 | $4,180 | (100.0%) |
| FY 2018 BSA & Discretionary Transfer | $4,576 | ($4,576) | ($9,152) | (200.0%) |
| Capital Stabilization Reserve | $0 | $250 | $250 | NA |
| General Reserve | $20 | $1,125 | $1,105 | 5,525.0% |
| Subtotal | $91,835 | $90,983 | ($852) | (0.9%) |
| Less: Intra-City Expenses | (2,238) | (1,825) | 413 | (18.5%) |
| Total Expenditures | $89,597 | $89,158 | ($439) | (0.5%) |
Note: Numbers may not add due to rounding
The decrease in FY 2018 City-funds non-tax revenues results from the release of $100 million from the reserve for disallowances for categorical grants in FY 2018.[2] Because the reserve is against disallowances of prior-year claims already recognized as revenues, the released funds are treated as City-funds revenues in FY 2018. Since this revenue does not recur beyond FY 2018, non-tax City-funds revenues decline by the same amount in FY 2019.
Expenditures as presented in the FY 2019 Adopted Budget are reduced by the impact of FY 2018 prepayments. By the same token, the FY 2018 modified budget is inflated by the net impact of FY 2017 and FY 2018 prepayments and a $100 million deposit into the Retiree Health Benefits Trust (RHBT) above the amount required for FY 2018 pay-go retiree health benefits. After netting out the impact from prepayments and the RHBT deposit, FY 2019 expenditures before reserves total $92.36 billion, an increase of $2.88 billion or 3.2 percent from the adjusted FY 2018 expenditure, as shown in Table 6.[3]
Table 6. FY 2019 Expenditures vs. FY 2018 Expenditures Adjusted for Prepayments
| ($ in millions) | FY 2018 | FY 2019 | $ Change | % Change |
| Salaries and Wages | $26,745 | $28,377 | $1,632 | 6.1% |
| Debt Service | 6,105 | 6,987 | 882 | 14.4% |
| Health Insurance | 6,157 | 6,786 | 629 | 10.2% |
| Other Fringe Benefits | 3,752 | 3,848 | 96 | 2.6% |
| Subtotal | $42,759 | $45,997 | $3,238 | 7.6% |
| Pensions | $9,520 | $9,739 | $220 | 2.3% |
| Medicaid | 5,915 | 5,915 | 0 | 0.0% |
| Public Assistance | 1,583 | 1,605 | 23 | 1.4% |
| Judgments and Claims | 712 | 697 | (15) | (2.1%) |
| Contractual Services* | 17,383 | 16,514 | (869) | (5.0%) |
| Other OTPS | 11,610 | 11,891 | 281 | 2.4% |
| Subtotal | $46,722 | $46,362 | ($361) | (0.8%) |
| Expenditures Before Reserves | $89,481 | $92,359 | $2,878 | 3.2% |
| RHBT Deposit | $100 | $0 | ($100) | (100.0%) |
| Prior-Year Adjustment | ($400) | $0 | $400 | (100.0%) |
| General Reserve | $20 | $1,125 | $1,105 | 5,525.0% |
| Capital Stabilization Reserve | $0 | $250 | $250 | NA |
| Total | $89,201 | $93,734 | $4,533 | 5.1% |
*Excludes contractual services for debt service and Medicaid
Note: Numbers may not add due to rounding
Expenditure growth in FY 2019 is driven by spending on salaries and wages, debt service, health insurance, and other fringe benefits. The combined spending in these areas is projected to grow by $3.2 billion. All other spending areas, excluding reserves, RHBT deposit in excess of pay-go requirements, and prior-year adjustments, are projected to decline slightly by $361 million.
Changes from the Executive Budget
The FY 2019 Budget as adopted is a modest $95 million more than the Executive Budget presented in April. Revenue assumptions remain largely unchanged from the Executive Budget, with the increase driven primarily by the shifting of $79 million of unspent FY 2018 CDBG for New York City Housing Authority (NYCHA) repairs into FY 2019. In total, FY 2019 Federal grants in the Adopted Budget are $85 million more than the Executive Budget. Similarly, the only change in City-funds revenues is due to the rollover of $2 million in Water Board operations and maintenance (O & M) payments from FY 2018 to FY 2019. All other categories of City-funds non-tax and tax revenue forecasts remain unchanged from the Executive Budget.
In contrast, City-funds spending, net of prepayments, have been revised substantially since the Executive Budget. Overall, City-funds expenditures are $926 million higher than the Executive Budget. Excluding the $2 million corresponding increase in O & M from the rollover of Water Board payments, the remaining spending increases are funded entirely by a $924 million increase to the FY 2018 prepayments of FY 2019 expenditures, which were estimated at $3.65 billion in the Executive Budget.
City Council initiatives account for $388 million of the City-funds expenditure increase. Other significant increases include $106 million to fund Fair Fares, an initiative to provide half-price subway and bus rides to residents living below the federal poverty line. The initiative will begin in the second half of FY 2019. There is no funding beyond FY 2019 as the Administration has stated that there needs to be a dedicated source of funding for the initiative on an on-going basis.
The City has also increased the FY 2019 General Reserve by $125 million to $1.125 billion. This a slight decline from June 2017, when the General Reserve was increased by $200 million to $1.2 billion at budget adoption. The remaining increases include $283 million in agency expenditures and $24 million in debt service.
NYCHA
A consent decree between the U.S. Attorney for the Southern District of New York, the City, and the New York City Housing Authority (NYCHA) was signed on June 11th. Among other things, the consent decree requires the City to maintain certain existing funding commitments to NYCHA, as well as to provide $1 billion in capital funding over the next four years to remediate health and safety conditions, primarily lead-based paint, in NYCHA developments under the oversight of a federal monitor, and an additional $200 million annually starting in FY 2023 until the monitor determines that the conditions in the complaint have been addressed. The new and existing funding requirements would bring the total required City capital funding under the consent decree to as much as $3.99 billion.[4]
The existing funding commitments that the City is required to maintain, shown in Table 7, include $971.6 million in expense budget spending, $1.06 billion in foregone payments from NYCHA to the City, and $1.99 billion in capital commitments. About three-quarters of the expense budget spending consists of transfers for existing collective bargaining agreements. Another 15 percent – $146.1 million – represent homeless initiatives, including rental assistance payments for the formerly homeless (which only extends through the end of the Financial Plan period in FY 2022). Other initiatives, including reducing wait times for heating and other repairs, comprise the balance.
In addition to what is required under the consent decree, the City has also budgeted another $169.8 million in FY 2019, including $125.1 million in Federal CDBG funds and $30 million in City funds for NYCHA repairs, $5.7 million to address rat reduction, $3.9 million to address short-term heating problems, and $3.4 million in State grants for maintenance and operating costs on rented lighting towers at 55 NYCHA developments.
In FY 2015, the City elected to forgo future payments made by NYCHA for policing services in NYCHA developments of approximately $70 million. The City has also not required NYCHA to remit a $33 million annual payment in lieu of property taxes (PILOT). Both of these payments will continue to be forgone by the City under the terms of the consent decree.
Table 7. Existing City Funding for NYCHA Under Federal Consent Decree FY 2018-FY 2027
| ($ in millions) | FY 2018 | FY 2019 | FY 2020 | FY 2021 | FY 2022 | FY 2023 to FY 2027 | Total |
| Expense | |||||||
| Collective Bargaining | $64.8 | $71.6 | $72.9 | $73.3 | $73.3 | $366.5 | $722.4 |
| Homeless Initiatives | 3.7 | 28.1 | 38.2 | 38.2 | 38.2 | – | 146.4 |
| Reduce Repairs Wait Time | 3.9 | 10.0 | 10.0 | – | – | – | 23.9 |
| All Other | 55.0 | 14.1 | 3.3 | 3.2 | 3.3 | – | 78.9 |
| Total Expense | $127.4 | $123.8 | $124.4 | $114.7 | $114.8 | $366.5 | $971.6 |
| Forgone Revenue | |||||||
| NYPD Services | $72.5 | $72.5 | $72.5 | $72.5 | $72.5 | $362.3 | $724.5 |
| PILOT | 33.0 | 33.0 | 33.0 | 33.0 | 33.0 | 165.0 | 330.0 |
| Total Forgone Revenue | $105.5 | $105.5 | $105.5 | $105.5 | $105.5 | $527.5 | $1,055.0 |
| Capital | |||||||
| Mayor’s Roofing Initiative | $251.4 | $111.0 | $111.0 | $61.0 | $111.0 | $556.0 | $1,201.4 |
| Heating Systems | – | 156.9 | 43.1 | – | – | – | 200.0 |
| Elevators | 4.7 | 4.9 | 15.0 | 6.0 | 10.8 | 17.7 | 59.0 |
| All Other | 227.1 | 150.8 | 10.0 | 19.0 | 14.3 | 108.7 | 529.9 |
| Total Capital | $483.2 | $423.6 | $179.1 | $86.0 | $136.0 | $682.4 | $1,990.3 |
Source: Office of Management and Budget.
Note: Numbers may not add due to rounding.
Finally, the City had nearly $2 billion in capital commitments planned for fiscal years 2018 through 2027, including $1.2 billion for roof replacements at over 850 NYCHA buildings, $59 million for elevator repairs and replacement, and other projects, including renovation of 200 units for homeless families, security upgrades, facade work, and energy savings initiatives. Most recently, as a result of the widespread failure of heating systems during the winter, the Administration committed $200 million for boiler and heating systems repairs and replacements at 20 NYCHA developments.
Collective Bargaining
Since budget adoption in June, the City reached a tentative contract agreement with DC 37, covering approximately 100,000 employees. The agreement, which covers the 44-month period beginning September 26, 2017 and ending May 25, 2021, will provide wage increases of two percent on the first day of the contract period, 2.25 percent on the first day of the 13th month of the contract period, and three percent on the first day of the 26th month of the contract period.
In addition to the labor agreement, the City also reached a second health care savings agreement with the Municipal Labor Committee (MLC) which will provide health savings of $200 million in FY 2019, $300 million in FY 2020, and $600 million in FY 2021 and beyond. Savings will be achieved in part by an expected cap on health care premium increases by EmblemHealth for the next two years, with the balance to be determined by a labor-management committee, subject to binding arbitration.
The DC 37 agreement is estimated to cost $66 million in FY 2018, $171 million in FY 2019, $333 million in FY 2020, $413 million in FY 2021 and $464 million in FY 2022. Net of the one percent increase that is already funded in the Financial Plan and the newly negotiated health care savings, the additional funding required for the DC 37 agreement over the Plan period is $33 million, $48 million, $131 million, $95 million and $118 million in FY 2018 through 2022, respectively. Applying the same pattern to all City employees would result in net cost, after adjustments for the funding in the labor reserve and health care savings, of $142 million, $227 million, $704 million, $929 million and $1.3 billion in fiscal years 2018 through 2022, respectively.
The Outyears
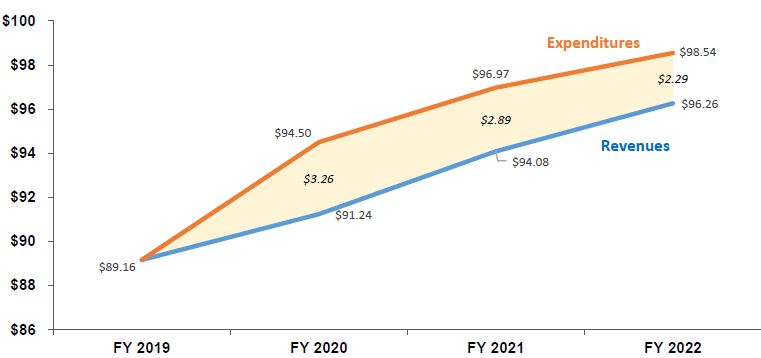
While the FY 2019 budget is balanced, the June 2018 Financial Plan projects budget gaps of $3.26 billion in FY 2020, $2.89 billion in FY 2021, and $2.29 billion in FY 2022, as shown in Chart 4. Over this period, revenues are projected to grow by 8 percent from $89.16 billion in FY 2019 to $96.26 billion in FY 2022 while expenditures are projected to grow by 10.5 percent to $98.54 billion.
Chart 4. June Financial Plan Revenues, Expenditures and Budget Gaps
($ in billions)
As shown in Table 8, revenues are projected to grow at an average annual rate of 2.6 percent in the outyears of the Plan. Tax revenues, which account for about two-thirds of overall revenues, account for more than 90 percent of the growth, with a projected annual average growth of 3.4 percent from FY 2019 to FY 2022. With the exception of State categorical grants, which are projected to grow at an annual average rate of 2.8 percent in the outyears, all other non-City revenues are projected to decline over the Plan period.
Table 8. FY 2018 – FY 2021 Revenue Growth
| ($ in millions) | FY 2019 | FY 2020 | FY 2021 | FY 2022 | Growth FYs 19-22 | Annual Growth |
| General Property Tax | $27,974 | $29,477 | $30,891 | $31,880 | 14.0% | 4.5% |
| Non-Property Tax | 32,102 | 32,872 | 33,871 | 34,615 | 7.8% | 2.5% |
| Subtotal Tax Revenues | $60,076 | $62,349 | $64,762 | $66,495 | 10.7% | 3.4% |
| Non-Tax Revenues | 4,952 | 4,945 | 4,946 | 4,925 | (0.5%) | (0.2%) |
| Subtotal City-Funds | $65,028 | $67,294 | $69,708 | $71,420 | 9.8% | 3.2% |
| Federal Categorical Grants | $7,592 | $7,129 | $7,108 | $7,092 | (6.6%) | (2.2%) |
| State Categorical Grants | 14,976 | 15,302 | 15,763 | 16,246 | 8.5% | 2.8% |
| Other Categorical Grants | 880 | 872 | 867 | 861 | (2.2%) | (0.7%) |
| IFA Revenues | 682 | 641 | 638 | 638 | (6.5%) | (2.2%) |
| Subtotal Non-City-Funds | $24,130 | $23,944 | $24,376 | $24,837 | 2.9% | 1.0% |
| Total | $89,158 | $91,238 | $94,084 | $96,257 | 8.0% | 2.6% |
As discussed earlier in this report, FY 2019 expenditures are reduced by the prepayments of debt service, retiree health benefits expenditures and advanced subsidies to H + H. Adjusted for prepayments and advanced subsidies, expenditures in the Financial Plan are projected to grow by 5.1 percent between FY 2019 and FY 2022.
Similar to FY 2019, expenditure growth in the outyears is driven by spending on salaries and wages, debt service, health insurance, and other fringe benefits. Together, these expenditures are projected to grow at an average annual rate of 3.7 percent, as shown in Table 9. All other expenditures, excluding reserves, are projected to remain relatively flat with a slight decrease of 0.7 percent over the Plan period. Overall, expenditures adjusted for prepayments are projected to grow at an average rate of 1.7 percent, less than the 2.6 percent projected revenue growth.
Table 9. FY 2019 – FY 2022 Expenditure Growth Adjusted for Prepayments
| ($ in millions) | FY 2019 | FY 2020 | FY 2021 | FY 2022 | Growth FYs 19-22 | Annual Growth |
| Salaries and Wages | $28,377 | $29,251 | $29,999 | $29,701 | 4.7% | 1.5% |
| Debt Service | 6,987 | 7,473 | 7,856 | 8,560 | 22.5% | 7.0% |
| Health Insurance | 6,786 | 7,350 | 8,011 | 8,600 | 26.7% | 8.2% |
| Other Fringe Benefits | 3,848 | 4,183 | 4,289 | 4,379 | 13.8% | 4.4% |
| Subtotal | $45,997 | $48,258 | $50,154 | $51,240 | 11.4% | 3.7% |
| Pensions | $9,739 | $9,791 | $10,049 | $10,255 | 5.3% | 1.7% |
| Medicaid | 5,915 | 5,915 | 5,915 | 5,915 | 0.0% | 0.0% |
| Public Assistance | 1,605 | 1,617 | 1,617 | 1,617 | 0.7% | 0.2% |
| Judgments and Claims | 697 | 712 | 727 | 742 | 6.5% | 2.1% |
| Contractual Services* | 16,514 | 15,610 | 15,744 | 15,857 | (4.0%) | (1.3%) |
| Other OTPS | 11,891 | 11,346 | 11,516 | 11,665 | (1.9%) | (0.6%) |
| Subtotal | $46,362 | $44,990 | $45,568 | $46,051 | (0.7%) | (0.2%) |
| Expenditures Before Reserves | $92,359 | $93,248 | $95,723 | $97,291 | 5.3% | 1.7% |
| General Reserve | $1,125 | $1,000 | $1,000 | $1,000 | (11.1%) | (3.9%) |
| Capital Stabilization Reserve | $250 | $250 | $250 | $250 | 0.0% | 0.0% |
| Total | $93,734 | $94,498 | $96,973 | $98,541 | 5.1% | 1.7% |
*Excludes contractual services for debt service and Medicaid
Risks and Offsets
The Comptroller’s Office’s analysis of the FY 2019 Adopted Budget and Financial Plan shows a modest surplus of $151 million in FY 2019 and larger gaps of $4.18 billion, $3.84 billion, and $3.42 billion in FY 2020 through FY 2022, respectively. The larger outyear gaps are driven primarily by the estimated net cost of the round of collective bargaining beginning in FY 2018 extended to the remaining City workforce. As discussed earlier, the City reached a tentative labor agreement with DC 37 after the release of the FY 2019 Adopted Budget and Financial Plan. The net cost reflects additional cost above the funding in the labor reserve for a one percent wage increase in each year of the Financial Plan, and savings from the recent health care savings agreement between the City and the MLC.
The modest FY 2019 budget surplus estimated by the Comptroller’s Office stems from the Office’s projection of higher revenues. The Comptroller’s Office projects that revenues will exceed the Plan’s projections by $624 million in FY 2019, $228 million in FY 2020, $532 million in FY 2021, and $909 million in FY 2022, driven primarily by a higher property tax revenue forecast. Non-tax revenues account for less than $30 million of the additional revenues in each year of the Plan, as shown in Table 10.
Table 10. Risks and Offsets to the June 2018 Financial Plan
($ in millions, positive numbers decrease the gap and negative numbers increase the gap)
| FY 2019 | FY 2020 | FY 2021 | FY 2022 | |
| City Stated Gap | $0 | ($3,260) | ($2,889) | ($2,285) |
| Tax Revenues | ||||
| Property Tax | $76 | $303 | $785 | $883 |
| Personal Income Tax | 182 | (117) | (190) | (260) |
| Business Taxes | 169 | 20 | 44 | 53 |
| Sales Tax | 91 | 179 | 149 | 85 |
| Real Estate Transaction Taxes | (23) | (384) | (483) | (79) |
| Audit | 100 | 200 | 200 | 200 |
| Subtotal Tax Revenues | $595 | $201 | $505 | $882 |
| Non-Tax Revenues | ||||
| ECB Fines | $20 | $20 | $20 | $20 |
| Late Filing/No Permit Penalties | 4 | 4 | 4 | 4 |
| Motor Vehicle Fines | 5 | 3 | 3 | 3 |
| Subtotal Non-Tax Revenues | $29 | $27 | $27 | $27 |
| Total Revenues | $624 | $228 | $532 | $909 |
| Expenditures | ||||
| Overtime | ($153) | ($150) | ($150) | ($150) |
| Charter School Tuition | 0 | (119) | (281) | (478) |
| DOE Medicaid Reimbursement | (50) | (50) | (50) | (50) |
| Carter Cases | (60) | (60) | (60) | (60) |
| CEP School Food Program | 0 | 38 | 38 | 38 |
| Homeless Shelters | (33) | (42) | (42) | (42) |
| NYC Health + Hospitals | 0 | (165) | (165) | (165) |
| Collective Bargaining | (227) | (704) | (929) | (1,344) |
| VRDB Interest Savings | 50 | 50 | 50 | 50 |
| Pension Contributions | 0 | 54 | 108 | 162 |
| Subtotal Expenditures | ($473) | ($1,148) | ($1,481) | ($2,039) |
| Total (Risks)/Offsets | $151 | ($920) | ($949) | ($1,130) |
| Restated (Gap)/Surplus | $151 | ($4,180) | ($3,838) | ($3,415) |
With the exception of real estate transaction tax revenues, the Comptroller’s Office’s forecast for all other FY 2019 tax revenues are above the Adopted Budget projection. After FY 2019, in addition to real estate transaction tax revenues, the Comptroller’s Office’s projection for PIT is also below the Plan’s. The lower PIT forecast reflects the Comptroller’s Office’s expectation of a slightly lower employment and wage rate growth. Over the Plan period, the Comptroller’s Office expects growth in property, business and sales tax revenues to exceed Plan projections. In contrast, PIT and real estate transaction tax revenue growth are projected to lag behind the City’s projection, as show in Table 11.
With regards to expenditures, after the cost of labor agreement, the largest risks are in overtime spending and H+H reimbursements for judgment and claims settlements. The City’s FY 2019 overtime budget of $1.36 billion is almost 14 percent lower than the current fiscal year’s overtime spending of $1.59 billion through May. Based on recent overtime spending trend and factoring in the City’s initiatives to curb overtime spending, the Comptroller’s Office estimates that overtime expenditures could be $153 million more than the City’s projections in FY 2019 and $150 million in each of the outyears of the Plan.
Table 11. Tax Revenue Forecast, Growth Rates
| FY 2019 | FY 2020 | FY 2021 | FY 2022 | Average Annual Growth | |
| Property | |||||
| Mayor | 6.0% | 5.4% | 4.8% | 3.2% | 4.8% |
| Comptroller | 6.2% | 6.2% | 6.4% | 3.4% | 5.5% |
| PIT | |||||
| Mayor | (7.4%) | 4.8% | 3.2% | 2.5% | 0.7% |
| Comptroller | (6.0%) | 2.3% | 2.7% | 2.0% | 0.2% |
| Business | |||||
| Mayor | 4.5% | 1.9% | 2.2% | (0.2%) | 2.1% |
| Comptroller | 7.5% | (0.6%) | 2.6% | (0.1%) | 2.3% |
| Sales | |||||
| Mayor | 4.7% | 5.2% | 4.0% | 3.4% | 4.3% |
| Comptroller | 6.0% | 6.3% | 3.5% | 2.6% | 4.6% |
| Real Estate Transaction | |||||
| Mayor | (3.2%) | (1.6%) | 3.3% | 3.0% | 0.4% |
| Comptroller | (4.1%) | (16.8%) | (1.1%) | 24.5% | (0.4%) |
| All Other | |||||
| Mayor | 7.7% | 1.2% | 1.7% | 2.3% | 3.2% |
| Comptroller | 7.7% | 1.2% | 1.7% | 2.3% | 3.2% |
| Total Tax with Audit | |||||
| Mayor | 1.8% | 3.8% | 3.9% | 2.7% | 3.0% |
| Comptroller | 2.8% | 3.1% | 4.3% | 3.2% | 3.4% |
H + H is required to reimburse the City for debt service, judgments and claims (J&C) settlements, and fringe benefits costs incurred on the system’s behalf. The Financial Plan reflects the City’s decision in FY 2016 to waive H + H’s reimbursement for debt service over the Plan period. The Plan continues to assume annual reimbursements of $140 million for J&C settlements and $25 million for fringe benefits costs. H + H will likely be able to make these payments to the City in the current fiscal year, given its improved financial outlook due mainly to the delay in cuts in Federal Supplemental Medicaid payments to hospitals. However, beyond FY 2019, unless the Federal government enacts further delays, these reimbursements to the City remain at risk.
The expenditure risks are somewhat tempered by anticipated savings from interest rates on variable rate debt bonds (VRDB) lower than those projected by OMB, and pension contributions from FY 2018 pension investment earnings above the actuarial interest rate assumption (AIRA). Preliminary estimates indicate that the City’s pension investments earned 8.7 percent in FY 2018, 1.7 percent above the AIRA. The excess earnings above the AIRA will be phased in over six years beginning in FY 2020, resulting in savings of $54 million in FY 2020, $108 million in FY 2021, and $162 million in FY 2022. In addition, there could be a potential boost to projected sales and business tax revenues as a result of the recent Supreme Court decision in South Dakota vs. Wayfair, which paved the way for States to begin to tax remote retailers in some circumstances.
The Budget Cushion
The Comptroller’s Office measures prior-year accumulated resources and reserves – referred to as the budget cushion – to evaluate the City’s ability to weather a fiscal downturn.[5] The FY 2018 prepayment and additional RHBT deposit, together with the $1.375 billion in the FY 2019 General Reserve and Capital Stabilization Reserve, increases the City’s budget cushion at the start of the FY 2019 to $10.3 billion – 11.2 percent of adjusted FY 2019 expenditures. This is the fifth consecutive year in which the City has added to the cushion. Despite the increase, the cushion as a percent of adjusted expenditures remains relatively unchanged from the 11.1 percent at the start of FY 2018. This is because expenditures have also increased with the cushion. This ratio falls outside the optimal range of 12 percent to 18 percent of adjusted expenditures recommended by the Comptroller’s Office, and is $782 million shy of the lower threshold and $6.3 billion short of the upper threshold.
The budget cushion is a broader measure than just cash reserves available in a given fiscal year. In FY 2019, for example, the budget reserves that could be drawn upon total $3.58 billion, which includes the $1.125 billion General Reserve, the $250 million Capital Stabilization Reserve, and payments of $2.203 billion for retiree health and welfare benefits, which could be covered by the existing balance in the Retiree Health Benefit Trust.[6] This is equal to about 5 percent of budgeted tax revenues. It is worth recalling that in FY 2009, City tax revenues fell 7.1 percent – the equivalent of a $4.2 billion drop in FY 2019 – and did not fully recover for two years, even with increases in the real property and sales taxes. While no such decline is projected at this time during the Financial Plan period, prudent risk management dictates having as robust a hedge as possible against the unexpected.
Endnotes
[1] Payments from the New York City Water Board are used for operation and maintenance of the water and sewer system.
[2] The reserve for disallowances against categorical grants is a set-aside for potential rejection of City claims against Federal and State aid.
[3] In addition to netting out the impact of prepayments and additional RHBT deposit, FY 2018 expenditures are also net of adjustments to prior-year payables.
[4] Assuming the City were to commit $200 million annually until the end of the ten-year period. The consent decree only requires the $200 million in annual commitments in FY 2023.
[5] Measuring New York City’s Budgetary Cushion: How Much is Needed to Weather the Next Fiscal Storm? August 2015. https://comptroller.nyc.gov/wp-content/uploads/documents/PARR_Report_Final.pdf
[6] The total amount due for retiree health and welfare benefits in FY 2019 is $2.503 billion, $300 million of which was prepaid from the FY 2018 surplus. The City may only use balances in the Retiree Health Benefit Trust for retiree health and welfare benefits, and therefore cannot expend more from the Trust in one year than the payments due in that year.