Comments on New York City’s Fiscal Year 2019 Executive Budget
Executive Summary
Both the national and local economies are expected to continue to grow in 2018 and for the remainder of the April 2018 Financial Plan period, fueled by a strong labor market and modest increases in wages. Recent Federal fiscal policy actions, including the Tax Cuts and Jobs Act of 2017 (TCJA), provided a boost to an already healthy economy. However, expansionary federal fiscal policy will create higher budget deficits and rising interest rates. As such, the Comptroller’s Office expects growth to peak in 2018 and taper off in the latter years of the Plan period. Although the Comptroller’s Office is not projecting a recession, the course of the economy over the next two to three years will depend in no small measure on the ability of the Federal Reserve to respond appropriately to economic dynamics.
The Mayor has proposed an $89.1 billion budget for FY 2019, which is balanced by using a budget surplus of $3.7 billion estimated for the current fiscal year. The surplus increased by $1.1 billion in the Plan largely on the strength of a $973 million increase in FY 2018 tax revenues, but remains below the FY 2017 surplus of $4 billion. The boost to FY 2018 tax revenues is related to several factors, including changes in federal tax law, the repatriation of overseas hedge fund earnings, and a booming stock market – nearly all of which are one-time or likely to be transitory.
Overall, FY 2018 City-funds revenues in the current Plan are $1.03 billion more than projected in February. With the exception of FY 2022, the increases do not extend into the outyears, with City-funds revenues remaining relatively unchanged in FY 2019 through FY 2021, showing modest increases of $87 million and $3 million in FY 2019 and FY 2020 and a small decline of $68 million in FY 2021.
In contrast, City-funds expenditures have been revised upwards by more than $1 billion in each of FY 2019 through FY 2022. FY 2019 remains balanced because of an increase in the planned prepayment of FY 2019 debt service, funded primarily by the largely one-time increase in FY 2018 tax revenues. Without any offsetting increase in revenues in the outyears, however, the gaps have increased by $1.03 billion in FY 2020, $1.39 billion in FY 2021 and $509 million in FY 2022. The outyear gaps are now projected to be $3.22 billon, $2.86 billion, and $2.25 billion in FY 2020 through FY 2022, respectively. While these are not unmanageable gaps under current projections, any sharp or sustained slowdown in revenue growth could make them more difficult to manage without imposing difficult choices.
The Comptroller’s Office’s analysis of the Financial Plan projects additional budget surpluses of $636 million in FY 2018 and $213 million in FY 2019, followed by larger gaps of $3.5 billion in FY 2020 and $3.0 billion in FY 2021, and a smaller gap of $2.20 billion in FY 2022. The Comptroller’s Office’s revenue forecast is consistently higher than the City’s, driven primarily by a higher tax revenue forecast, which is $706 million above the City’s in FY 2018, and ranging from $201 million to $882 million higher in FY 2019 through FY 2022. The Comptroller’s Office also estimates higher non-tax revenues of $29 million in FY 2019 and $27 million in each of the outyears of the Plan.
Tempering the budget relief from potential higher revenues is the Comptroller’s expenditure estimates, which, on net, are consistently higher than the Plan projections, resulting in net risks to expenditure estimates in every year of the Plan. The expenditure risks begin at $70 million in FY 2018 and grow each year, reaching $857 million by FY 2022. The growth in expenditure risks in the outyears is driven principally by the absence of funding for additional charter school tuition expenses. Despite a change in State legislation which allows charter school tuition to grow at the same rate as public school spending, the Financial Plan does not fund the cost of this growth.
In FY 2018 and FY 2019, the difference between the Comptroller’s Office’s revenue forecast and the City’s outweighs the expenditure risks, leading to the projection of net surpluses. In FY 2020 and FY 2021, the additional revenues forecasted by the Comptroller’s Office are insufficient to offset expenditure risks, resulting in higher projected gaps by the Comptroller’s Office. In the last fiscal year of the Plan, the additional revenues forecasted by the Comptroller’s Office are slightly higher than the expenditure risk, resulting in a modest reduction in the gap.
Despite the generally positive outlook, the Comptroller urges that any additional revenues in FY 2018 be treated as non-recurring and be set aside to bolster the surplus available to the City in future years. The Comptroller also continues to urge the City to undertake a rigorous review of agency budgets to find recurring savings in the form of efficiency and productivity enhancements. Additionally, the rapid growth of spending in several agencies, highlighted in the Comptroller’s Agency Watch List for the Departments of Correction and Education and for citywide homeless services, calls for careful evaluation to determine whether City funds are being used as effectively and efficiently as possible to achieve stated objectives. As it stands, the information necessary for such an evaluation is often incomplete and not publically available (if it is collected). The path to a sustainable fiscal future must begin with a careful examination of current spending. Any savings realized should be set aside to enhance the City’s budget cushion to allow the City to better weather a future slowdown, or downturn, without unnecessary drastic actions.
Table 1. FY 2018 – FY 2022 Financial Plan
($ in millions) |
FY 2018 | FY 2019 | FY 2020 | FY 2021 | FY 2022 | Change FYs 2018 –2022 Dollar Percent |
|
| Revenues | |||||||
| Taxes: | |||||||
| General Property Tax | $26,383 | $27,974 | $29,477 | $30,891 | $31,880 | $5,497 | 20.8% |
| Other Taxes | 30,585 | 31,046 | 32,151 | 33,150 | 33,894 | 3,309 | 10.8% |
| Tax Audit Revenues | 1,299 | 1,056 | 721 | 721 | 721 | (578) | (44.5%) |
| Subtotal: Taxes | $58,267 | $60,076 | $62,349 | $64,762 | $66,495 | $8,228 | 14.1% |
| Miscellaneous Revenues | 7,128 | 6,789 | 6,830 | 6,735 | 6,714 | (414) | (5.8%) |
| Less: Intra-City Revenues | (2,208) | (1,824) | (1,770) | (1,774) | (1,774) | 434 | (19.7%) |
| Disallowances Against Categorical Grants | 85 | (15) | (15) | (15) | (15) | (100) | (117.6%) |
| Subtotal: City-Funds | $63,272 | $65,026 | $67,394 | $69,708 | $71,420 | $8,148 | 12.9% |
| Other Categorical Grants | 1,088 | 879 | 871 | 866 | 861 | (227) | (20.9%) |
| Inter-Fund Revenues | 646 | 682 | 641 | 638 | 638 | (8) | (1.2%) |
| Federal Categorical Grants | 8,799 | 7,507 | 7,127 | 7,106 | 7,089 | (1,710) | (19.4%) |
| State Categorical Grants | 14,865 | 14,969 | 15,299 | 15,760 | 16,243 | 1,378 | 9.3% |
| Total Revenues | $88,670 | $89,063 | $91,332 | $94,078 | $96,251 | $7,581 | 8.5% |
| Expenditures | |||||||
| Personal Service | |||||||
| Salaries and Wages | $27,146 | $28,717 | $29,611 | $30,359 | $30,060 | $2,914 | 10.7% |
| Pensions | 9,632 | 9,852 | 9,903 | 10,162 | 10,367 | 735 | 7.6% |
| Fringe Benefits | 9,989 | 10,733 | 11,647 | 12,418 | 13,098 | 3,109 | 31.1% |
| Subtotal-PS | $46,767 | $49,302 | $51,161 | $52,939 | $53,525 | $6,758 | 14.5% |
| Other Than Personal Service | |||||||
| Medical Assistance | $5,915 | $5,915 | $5,915 | $5,915 | $5,915 | $0 | 0.0% |
| Public Assistance | 1,583 | 1,605 | 1,617 | 1,617 | 1,617 | 34 | 2.1% |
| All Other | 30,860 | 29,505 | 28,864 | 29,085 | 29,364 | (1,496) | (4.8%) |
| Subtotal-OTPS | $38,358 | $37,025 | $36,396 | $36,617 | $36,896 | ($1,462) | (3.8%) |
| Debt Service | |||||||
| Principal | $3,023 | $3,056 | $3,591 | $3,517 | $3,658 | $634 | 21.0% |
| Interest & Offsets | 3,207 | 3,906 | 3,920 | 4,386 | 4,951 | 1,743 | 54.4% |
| Subtotal Debt Service | $6,231 | $6,962 | $7,511 | $7,903 | $8,608 | $2,378 | 38.2% |
| FY 2017 BSA and Discretionary Transfers | ($4,180) | $0 | $0 | $0 | $0 | $4,180 | (100.0%) |
| FY 2018 BSA | $3,652 | ($3,652) | $0 | $0 | $0 | ($3,652) | (100.0%) |
| Capital Stabilization Reserve | $0 | $250 | $250 | $250 | $250 | $250 | NA |
| General Reserve | $50 | $1,000 | $1,000 | $1,000 | $1,000 | $950 | 1,900.0% |
| Subtotal | $90,878 | $90,887 | $96,318 | $98,709 | $100,279 | $9,402 | 10.3% |
| Less: Intra-City Expenses | (2,208) | (1,824) | (1,770) | (1,774) | (1,774) | 434 | (19.7%) |
| Total Expenditures | $88,670 | $89,063 | $94,548 | $96,935 | $98,505 | $9,836 | 11.1% |
| Gap To Be Closed | $0 | $0 | ($3,216) | ($2,857) | ($2,254) | ($2,254) | NA |
Note: Numbers may not add due to rounding.
Table 2. Plan-to-Plan Changes
April 2018 Plan vs. February 2018 Plan
| ($ in millions) | FY 2018 | FY 2019 | FY 2020 | FY 2021 | FY 2022 |
| Revenues | |||||
| Taxes: | |||||
| General Property Tax | $114 | $115 | $141 | $273 | $981 |
| Other Taxes | 859 | (38) | (15) | (93) | (109) |
| Tax Audit Revenues | 0 | 0 | 0 | 0 | 0 |
| Subtotal: Taxes | $973 | $77 | $126 | $180 | $872 |
| Miscellaneous Revenues | 133 | 77 | (102) | (229) | (79) |
| Less: Intra-City Revenues | (76) | (67) | (21) | (20) | (20) |
| Disallowances Against Categorical Grants | 0 | 0 | 0 | 0 | 0 |
| Subtotal: City-Funds | $1,030 | $87 | $3 | ($69) | $773 |
| Other Categorical Grants | (10) | 9 | 11 | 11 | 6 |
| Inter-Fund Revenues | (28) | 12 | 35 | 33 | 33 |
| Federal Categorical Grants | 149 | 288 | 154 | 151 | 150 |
| State Categorical Grants | 89 | 1 | (164) | (78) | (8) |
| Total Revenues | $1,230 | $397 | $39 | $48 | $954 |
| Expenditures | |||||
| Personal Service | |||||
| Salaries and Wages | ($127) | $146 | $217 | $322 | $383 |
| Pensions | 42 | 50 | 140 | 484 | 485 |
| Fringe Benefits | 17 | 55 | 90 | 100 | 99 |
| Subtotal-PS | ($68) | $251 | $447 | $906 | $967 |
| Other Than Personal Service | |||||
| Medical Assistance | $0 | $0 | $0 | $0 | $0 |
| Public Assistance | (11) | 0 | 0 | 0 | 0 |
| All Other | 748 | 1,408 | 797 | 775 | 723 |
| Subtotal-OTPS | $737 | $1,408 | $797 | $775 | $723 |
| Debt Service | |||||
| Principal | ($151) | ($373) | ($4) | ($73) | ($59) |
| Interest & Offsets | (30) | 245 | (148) | (151) | (147) |
| Subtotal Debt Service | ($181) | ($127) | ($153) | ($224) | ($207) |
| FY 2017 BSA and Discretionary Transfers | $0 | $0 | $0 | $0 | $0 |
| FY 2018 BSA | $1,068 | ($1,068) | $0 | $0 | $0 |
| Capital Stabilization Reserve | $0 | $0 | $0 | $0 | $0 |
| General Reserve | ($250) | $0 | $0 | $0 | $0 |
| Subtotal | $1,306 | $464 | $1,091 | $1,457 | $1,483 |
| Less: Intra-City Expenses | (76) | (67) | (21) | (20) | (20) |
| Total Expenditures | $1,230 | $397 | $1,070 | $1,437 | $1,463 |
| Gap To Be Closed | $0 | $0 | ($1,031) | ($1,389) | ($509) |
Note: Numbers may not add due to rounding.
Table 3. Plan-to-Plan Changes
April 2018 Plan vs. June 2017 Plan
| ($ in millions) | FY 2018 | FY 2019 | FY 2020 | FY 2021 |
| Revenues | ||||
| Taxes: | ||||
| General Property Tax | $369 | $235 | $374 | $667 |
| Other Taxes | 649 | 0 | (110) | (342) |
| Tax Audit Revenues | 449 | 335 | 0 | 0 |
| Subtotal: Taxes | $1,467 | $570 | $264 | $325 |
| Miscellaneous Revenues | 640 | 141 | (33) | (115) |
| Less: Intra-City Revenues | (393) | (87) | (31) | (30) |
| Disallowances Against Categorical Grants | 100 | 0 | 0 | 0 |
| Subtotal: City-Funds | $1,814 | $624 | $200 | $180 |
| Other Categorical Grants | 208 | 11 | 12 | 10 |
| Inter-Fund Revenues | (25) | 18 | 39 | 36 |
| Federal Categorical Grants | 988 | 493 | 212 | 205 |
| State Categorical Grants | 446 | 97 | (72) | 33 |
| Total Revenues | $3,431 | $1,243 | $391 | $464 |
| Expenditures | ||||
| Personal Service | ||||
| Salaries and Wages | ($104) | $92 | $185 | $294 |
| Pensions | 60 | (19) | (40) | 157 |
| Fringe Benefits | (122) | (83) | (68) | (87) |
| Subtotal-PS | ($166) | ($10) | $77 | $364 |
| Other Than Personal Service | ||||
| Medical Assistance | $0 | $0 | $0 | $0 |
| Public Assistance | (11) | 0 | 0 | 0 |
| All Other | 2,057 | 1,782 | 1,104 | 1,085 |
| Subtotal-OTPS | $2,046 | $1,782 | $1,104 | $1,085 |
| Debt Service | ||||
| Principal | ($151) | ($436) | ($7) | ($74) |
| Interest & Offsets | (147) | 173 | (344) | (354) |
| Subtotal Debt Service | ($297) | ($263) | ($350) | ($428) |
| FY 2017 BSA and Discretionary Transfers | ($11) | $0 | $0 | $0 |
| FY 2018 BSA | $3,652 | ($3,652) | $0 | $0 |
| Capital Stabilization Reserve | ($250) | $0 | $0 | $0 |
| General Reserve | ($1,150) | $0 | $0 | $0 |
| Subtotal | $3,824 | ($2,143) | $831 | $1,021 |
| Less: Intra-City Expenses | (393) | (87) | (31) | (30) |
| Total Expenditures | $3,431 | ($2,230) | $800 | $991 |
| Gap To Be Closed | $0 | $3,473 | ($409) | ($527) |
Note: Numbers may not add due to rounding.
Table 4. Risks and Offsets to the April 2018 Financial Plan
($ in millions, positive numbers decrease the gap and negative numbers increase the gap)
| FY 2018 | FY 2019 | FY 2020 | FY 2021 | FY 2022 | |
| City Stated Gap | $0 | $0 | ($3,216) | ($2,857) | ($2,254) |
| Tax Revenues | |||||
| Property Tax | $0 | $76 | $303 | $785 | $883 |
| Personal Income Tax | 730 | 182 | (117) | (190) | (260) |
| Business Taxes | 0 | 169 | 20 | 44 | 53 |
| Sales Tax | 0 | 91 | 179 | 149 | 85 |
| Real Estate Transaction Taxes | 26 | (23) | (384) | (483) | (79) |
| Audit | (50) | 100 | 200 | 200 | 200 |
| Subtotal Tax Revenues | $706 | $595 | $201 | $505 | $882 |
| Non-Tax Revenues | |||||
| ECB Fines | $0 | $20 | $20 | $20 | $20 |
| Late Filing/No Permit Penalties | 0 | 4 | 4 | 4 | 4 |
| Motor Vehicle Fines | 0 | 5 | 3 | 3 | 3 |
| Subtotal Non-Tax Revenues | $0 | $29 | $27 | $27 | $27 |
| Total Revenues | $706 | $624 | $228 | $532 | $909 |
| Expenditures | |||||
| Overtime | ($100) | ($153) | ($150) | ($150) | ($150) |
| Charter School Tuition | 0 | 0 | (119) | (281) | (478) |
| DOE Medicaid Reimbursement | (50) | (50) | (50) | (50) | (50) |
| Carter Cases | 0 | (60) | (60) | (60) | (60) |
| CEP School Food Revenue | 0 | 0 | 38 | 38 | 38 |
| Homeless Shelters | 0 | (33) | (42) | (42) | (42) |
| NYC Health + Hospitals | 0 | (165) | (165) | (165) | (165) |
| VRDB Interest Savings | 30 | 50 | 50 | 50 | 50 |
| General Reserve | 50 | 0 | 0 | 0 | 0 |
| Subtotal | ($70) | ($411) | ($498) | ($660) | ($857) |
| Total (Risks)/Offsets | $636 | $213 | ($270) | ($128) | $52 |
| Restated (Gap)/Surplus | $636 | $213 | ($3,486) | ($2,985) | ($2,202) |
The City’s Economy Outlook
A. COMPTROLLER’S ECONOMIC FORECAST FOR NYC, 2018-2022
Economic growth is expected to continue in both the U.S. and New York City in 2018, and for the remainder of the April 2018 Financial Plan period. We expect growth to be more robust in the current and next calendar years, before tapering off in the outyears. An already healthy national economy, as reflected in the labor market, has received a boost from three major federal fiscal policy actions: the Tax Cuts and Jobs Act of 2017 (TCJA), the Bipartisan Budget Act of 2018, and the Consolidated Appropriations Act of 2018. While these fiscal stimuli are expected to have a positive impact on real GDP in the short term, the projected $1.5 trillion decline in government revenues as a result of TCJA, combined with higher government expenditures, will lead to higher federal deficits, rising interest rates, and ultimately to slower GDP growth. Additional risks that would affect this economic forecast are a rise in inflation due to a multilateral trade war, geopolitical risks such as an escalation of tensions in the Middle East, or overly aggressive Federal Reserve interest rate increases.
Until recently in this cyclical expansion, New York City’s economy has been outperforming the nation. New York City is still the nation’s leading financial center and banks and financial institutions have been the major beneficiaries of corporate tax cuts, deregulation, and even the rise in interest rates. To the extent that these favorable factors are turned into wages, bonuses, or an increase in hiring, the City’s economy should prosper. Outside of the financial services sector, the City’s continuing strong job market along with modest growth in earnings are expected to fuel consumer spending and allow for moderate growth. The City’s other economic indicators are mixed, but point in the direction of moderate continued growth.
Table 5 shows the Comptroller’s and the Mayor’s forecast of selected economic indicators for 2018 to 2022.
Table 5. Selected Economic Indicators, Annual Averages
Comptroller’s and Mayor’s Forecasts
| 2018 | 2019 | 2020 | 2021 | 2022 | ||
| Selected U.S. Economic Indicators Annual Averages | ||||||
| Real GDP (2009 $, % Change) | Comptroller
Mayor |
2.6
2.7 |
2.2
2.9 |
1.9
2.3 |
1.5
1.9 |
0.8
1.7 |
| Payroll Jobs (Change In Millions) | Comptroller
Mayor |
2.3
2.4 |
2.1
2.7 |
1.7
2.0 |
1.4
1.2 |
0.6
0.8 |
| CPI Inflation Rate (Percent) | Comptroller
Mayor |
2.1
2.2 |
2.3
1.7 |
2.2
2.7 |
2.2
2.5 |
2.1
2.4 |
| Fed Funds Rate (Percent) | Comptroller
Mayor |
1.7
1.8 |
2.5
2.8 |
3.2
3.3 |
3.7
3.4 |
3.2
3.5 |
| Selected NYC Economic Indicators Annual Averages | ||||||
| Real GCP (2009 $, % Change) | Comptroller
Mayor |
2.9
2.8 |
2.7
1.7 |
2.4
1.3 |
1.9
0.7 |
1.3
0.4 |
| Payroll Jobs (Change In Thousands) | Comptroller
Mayor |
64
60 |
46
54 |
43
52 |
37
50 |
10
35 |
| CPI Inflation Rate (Percent) | Comptroller
Mayor |
2.1
1.9 |
2.5
2.0 |
2.4
2.7 |
2.4
2.5 |
2.3
2.4 |
| Wage-Rate Growth (Percent) | Comptroller
Mayor |
3.5
3.2 |
3.6
3.0 |
2.8
2.8 |
2.3
2.9 |
2.0
2.8 |
Note: Comptroller=forecast by the NYC Comptroller’s Office. GCP=Gross City Product. Mayor= forecast by the NYC Office of Management and Budget in the Executive Budget Fiscal Year 2019 Message of the Mayor. NA=not available.
B. FACTORS AFFECTING THE FORECAST
The National Economy
The state of the nation’s economy is solid as reflected in real GDP growth and the tight labor market. The U.S. economy’s upward trend continued in the first quarter of 2018, albeit at a slower pace. Real GDP grew at a seasonally adjusted annual rate (SAAR) of 2.3 percent in the first quarter of 2018, after growing 2.9 percent in the fourth quarter of 2017. A strong labor market, modest increase in wages, and the latest fiscal stimuli suggest that this economic growth will continue and likely peak in 2018. However, expansionary fiscal policy will create higher budget deficits and rising interest rates. As a result, we project that economic growth will begin to taper off in the later years of the Financial Plan period, but fall short of a recession.
Half of the GDP gain was from private investment, which grew 7.3 percent. Most of the gains in private investment were in nonresidential fixed investment, which was almost equally divided between structures and equipment.
The surprise in the latest GDP report was the weakness of consumer spending, which grew only 1.1 percent. Consumer spending growth was the lowest in almost five years. Consumer sector has been the driver of the expansion thus far, and we don’t see this as the beginning of a trend. Three indicators — continuing job growth, rising wages, and lower tax rates — show that this sector is poised to contribute more growth. When we consider that American household balance sheets are strong and debt burdens are manageable, consumer spending should rebound to keep the expansion going.
Net exports contributed positively to GDP growth in first-quarter 2018. Higher growth in exports than in imports are an indication of the improvement in the global economy, while import growth is partially due to a stronger dollar vis-à-vis our trading partners. The dollar has been strengthening recently as a result of higher interest rates in the U.S. than in other places around the globe. A strong dollar helps imports but not exports and thus can be a drag on the future GDP growth.
Government expenditures rose 1.2 percent. Defense spending growth led non-defense spending growth 1.8 percent to 1.6 percent. State and local government expenditures rose 0.8 percent in first-quarter 2018 after growing 2.9 percent in fourth-quarter 2017. The Bipartisan Budget Act of 2018, and the Consolidated Appropriations Act of 2018 are expected to increase discretionary government expenditure and thus raise economic growth.
Jobs in the U.S. grew at a seasonally adjusted annual rate of 1.7 percent in the first quarter of 2018, the highest increase in over a year, and the unemployment rate fell to 4.1 percent in the first quarter of 2018 (and to 3.9 percent in April), the lowest since 2000. A tight labor market led to a rise in wages. Wages, as measured by the average hourly earnings rose 2.4 percent in the first quarter of 2018.
The TCJA also lowered the corporate tax rate from 35 percent to 21 percent, making it the biggest one-time drop in business tax rates ever. This bodes well for corporate profits outlook. Private investment, specifically, real nonresidential investment, is expected to increase. Repatriation of corporate profits from abroad will provide a one-time bonus and a continuing flow as there will be no tax incentive to keep those earnings off-shore. In addition, investment in residential structures will be stronger, as evidenced by an increase in the number of building permits issued by local authorities.
Interest rates are expected to increase due to a rise in inflation caused by stronger economic growth, tight labor markets, and price increases as a result of higher wages.
So while the economy is expected to grow over the Plan period, it is expected to peak in 2018 and then begin to subside.
In general, our outlook for the US economy is slightly more pessimistic than that of the City. We expect growth to decelerate in 2021 and 2022, falling below the rates observed thus far in the recovery.
The New York City Economy
The City’s economy outperformed the nation for the second consecutive quarter in the first quarter of 2018 and it is expected to continue to do so for the remainder of 2018. The City’s relatively strong economic fundamentals and the fiscal stimulus, especially the corporate tax cuts that were signed into law in December of 2017, should fuel the City’s future economic growth.
The City’s economy, as measured by the gross city product (GCP), grew 2.7 percent in the first quarter of 2018, less than the 3.4 percent in the previous quarter, but higher than the 2.3 percent in the nation. Over the forecast horizon through 2022, the Comptroller’s Office is forecasting more robust growth than is being forecast by the Mayor. From 2018 to 2022, the Comptroller is forecasting GCP to grow 8.5 percent compared to the Mayor’s assumption of 4.2 percent, despite the fact that we are forecasting weakening growth rates in 2021 and 2022.
The private sector added 11,300 jobs, or 1.2 percent in the first quarter of 2018, about half of the 25,800 jobs created in the fourth quarter of 2017. U.S. private sector jobs grew 2.0 percent in the first quarter of 2018, faster than the 1.8 percent in the fourth quarter of 2017 (Chart 1). Through 2022, the Comptroller is forecasting 200,000 new total payroll jobs compared to the Mayor’s forecast of 251,000. This may seem as a contradiction to the forecasts of GCP, but recent statistics suggest that New York, and the entire northeastern United States, can’t fill all jobs that are available. This supply constraint can keep employment constrained even though the GCP continues to grow at healthy rates.
Chart 1. Jobs Growth (SAAR) in NYC and the Nation
First-Quarter 2018 over Fourth-Quarter 2017
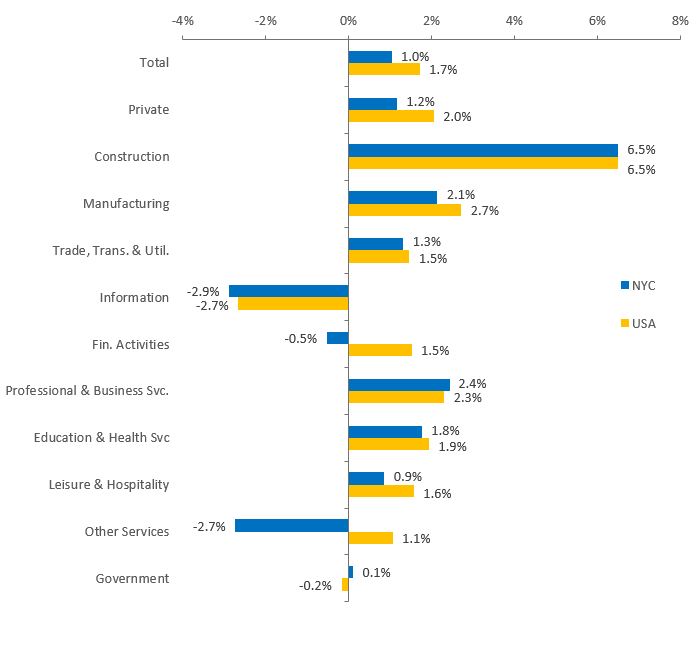
Source: U.S. Bureau of Labor Statistics and NYS Department of Labor.
NYC’s unemployment rate, adjusted for seasonality, fell to 4.3 percent in first-quarter 2018, the lowest rate on record. The unemployment rate can fall either as a result of a decline in the number of unemployed workers, an increase in the labor force, or a combination of both. The decrease in the City’s unemployment rate was due to a decrease in the number of unemployed, which declined by 6,700 in first-quarter 2018. The number of employed City residents increased by 6,000 in first-quarter 2018. As a result, the City’s employment-to-population ratio rose to 58.3 percent in first-quarter 2018, the highest ever. Despite the record percentage of New York City residents who are working, the percent of New Yorkers in the labor force still lags the nation by 2 percentage points, 62.9 percent to 60.9 percent.
Average hourly earnings (AHE) of all private NYC employees, a component of personal income, rose 2.3 percent on a year-over-year basis to $35.84 per hour in first-quarter 2018, less than the 3.3 percent increase in first-quarter 2017. U.S. average hourly earnings increased 2.4 percent in first-quarter 2018, also lower than the 2.8 percent increase in first-quarter 2017. This could partially be explained by the increase in the minimum wage, which grew either 14.3 percent or 18.2 percent (depending on the size of the employer) in 2017 from 2016.[1] The Comptroller’s wage growth forecast of 3.5 percent and 3.6 percent in 2018 and 2019, respectively, is higher than that of the Mayor at 3.2 percent and 3.0 percent. In the out years of the planning horizon the Comptroller’s forecast weakens considerably in line with our view that the economy weakens in those years as well.
The relatively strong labor market, the increase in earnings, and the continuation of U.S. expansion, in general, are expected to lift consumer spending in the City. In addition, private investment in the City is expected to get a lift from the new tax cuts. New York City is the nation’s leading financial center. As such, fiscal and monetary policies impacting the financial sector directly impact the City’s economy. The robust first-quarter 2018 banks’ earnings report bodes well for robust financial sector bonuses which will positively impact 2019 PIT.
The strong business environment and evidence that NYC is still a place where entrepreneurs can start and grow business is also reflected in venture capital investment. According to PwC Money Tree, venture capital (VC) investment in the New York metro area rose 61.2 percent on a year-over-year basis to $2.6 billion in the first quarter of 2018, its second highest first-quarter level on record.
Finally, the City’s latest leading economic indicators may be mixed, but they continue to signal growth.[2]
The FY 2019 Executive Budget
Overview: Changes to FY 2018 and 2019
FY 2018 Budget
The FY 2018 Budget in the April Plan totals $88.67 billion, an increase of $1.23 billion from the February Plan. The increase is primarily in the City-funds portion of the budget which has been increased by $1.03 billion to $63.27 billion. The non-City funds portion of the budget, which is funded by Federal, State and other categorical grants as well as funds from the capital budget, shows a net increase of $200 million.
As shown in Table 6, revisions to tax revenues account for $973 million of the increase in City-funds revenue, driven by an increase of $801 million in the estimate for personal income tax (PIT) revenues. As discussed in “Tax Revenues” beginning on page 26, the boost to the PIT revenue forecast stems from factors related to the Federal tax reform and the reform of the State PIT school tax relief (STAR) program.
Table 6. Changes to FY 2018 City-Funds Estimates from the Preliminary Budget
($ in millions)
| revenues | expenditures | ||
| Property Tax Revenues | $114 | Agency Expenses | $474 |
| Personal Income Tax Revenues | 801 | Miscellaneous Budget | 63 |
| Business Tax Revenues | (29) | Pensions | 42 |
| Sales Tax | 59 | General Reserve | (250) |
| Real Estate Transaction | 28 | State Budget Impact | (1) |
| All Other Tax | 1 | Citywide Savings Program | (366) |
| Subtotal | $973 | Subtotal | ($38) |
| Non-Tax Revenues | $55 | BSA | $1,068 |
| City Savings Program | $2 | ||
| Total | $1,030 | Total | $1,030 |
*Expenses exclude collective bargaining transfers.
The increase in City-funds expenditures is due entirely to an increase of $1.068 billion in the Budget Stabilization Account (BSA) as shown in Table 6. Net of the increase in the BSA, City-funds spending is $38 million less than estimated in the Preliminary Budget. Agency spending is increased by $474 million. More than $250 million of this increase is in the Department of Homeless Services (DHS), with additional funding for shelter operations accounting for $213 million of the increase. Additions to the Department of Education (DOE) budget account for another $118 million of the increase, due primarily to an additional $80 million to fund special education Carter cases, and a $20 million increase in student transportation costs. The remaining increase reflects budgetary adjustments across various agencies. Other increases in the City-funds budget include $63 million in the miscellaneous budget and $42 million in pension contributions. Offsetting these increases are a $250 million takedown in the General Reserve and a new round of the Citywide Savings Program containing spending reductions of $366 million, including $181 million in debt service savings.
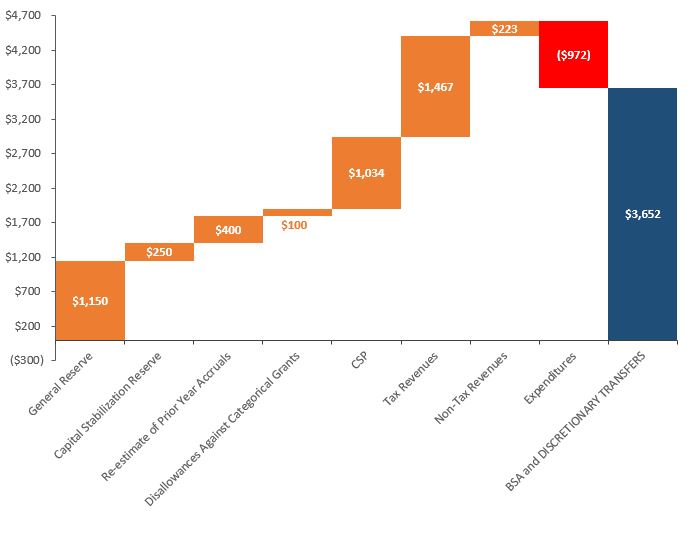
The increase in the BSA brings the total FY 2018 BSA to $3.65 billion. Since the Adopted Budget in June, the City has identified $4.62 billion of additional resources in the FY 2018 budget. About $970 million of the additional resources are used to fund additional spending. The remaining $3.65 billion are used to fund the BSA, which is earmarked to prepay FY 2019 debt service.
As Chart 2 shows, higher revenue forecasts and projected savings from the FY 2018 round of the Citywide Savings Program account for $2.72 billion of the additional resources. The takedown of reserves and adjustments to prior-year accruals account for the remaining $1.9 billion.
Chart 2. Funding the BSA and Discretionary Transfers
($ in millions)
FY 2019 Budget
The FY 2019 Budget in the April Financial Plan totals $89.06 billion, an increase of $397 million from the February Plan. The increase reflects primarily an additional $288 million in Federal categorical grants, discussed in greater detail in “Federal and State Aid” beginning on page 32. In contrast to the modified FY 2018 budget, the City-funds portion of the FY 2019 budget shows only a modest increase of $87 million.
As shown in Table 7, the increase in City-funds revenues is due primarily to an upward revision of $77 million in tax revenues. Property tax and PIT revenue estimates have been revised upward by $115 million and $194 million, respectively. Downward revisions of $115 million and $144 million, respectively, to business and sales tax revenues partially offset the increase in property tax and PIT revenues. The net reduction in sales tax revenues reflect the recognition of the State intercept of $150 million of the City’s sales tax revenues in FY 2019. [3]
Table 7. Changes to FY 2019 City-Funds Estimates from the Preliminary Budget
($ in millions)
| revenues | expenditures* | ||
| Property Tax Revenues | $115 | Agency Expenses | $791 |
| Personal Income Tax Revenues | 194 | Miscellaneous Budget | 155 |
| Business Tax Revenues | (115) | Pensions | 55 |
| Sales Tax | (144) | State Budget Impact | 531 |
| All Other Tax | 27 | Citywide Savings Program | (377) |
| Subtotal | $77 | Subtotal | $1,155 |
| Non-Tax Revenues | $1 | BSA | ($1,068) |
| City Savings Program | $9 | ||
| Total | $87 | Total | $87 |
*Expenditures exclude collective bargaining transfers.
As discussed in “FY 2018 Budget” on page 19, the FY 2018 BSA grew by $1.068 billion resulting in an attendant reduction in FY 2019 debt service. Net of the prepayment of debt service out of the FY 2018 BSA, FY 2019 City-funds expenditures are $1.155 billion above the Preliminary Budget estimates. The increase is driven by additional agency spending of $791 million and a State budget impact of $531 million. Similar to the changes in the FY 2018 budget, the largest increase in agency spending in FY 2019 is in the DHS. The additional spending for homeless shelter operations in FY 2018 is extended to the outyears, but at a lower amount of $160 million annually. The Administration for Children’s Services (ACS) also saw a significant increase of $140 million for FY 2019, driven by a $136 million increase in child care services spending.[4] Spending for child care services is also increased in the outyears but at a lesser amount of $122 million annually. The remaining agency spending increases are distributed across various agencies, with individual agency increases significantly below $100 million.
In addition to increased agency spending for new needs and budgetary adjustments, the enacted State budget resulted in additional City-funds spending in FY 2019 and the outyears through new spending requirements and reduced State support. As Table 8 below shows, the State budget impact will increase City-funds spending by $531 million in FY 2019 and more than $290 million in each of the outyears.
Table 8. State Budget Impact
| ($ in millions) | FY 2018 | FY 2019 | FY 2020 | FY 2021 | FY 2022 |
| MTA Subway Action Plan | $0 | $254 | $0 | $0 | $0 |
| Raise the Age Implementation | 0 | 108 | 131 | 132 | 129 |
| Private Bus Subsidy | (1) | (3) | (3) | (3) | (3) |
| Education Aid Shortfall Backfill | 0 | 136 | 136 | 136 | 136 |
| State Budget Impact on Building Aid | 0 | 4 | 0 | 0 | 0 |
| Close to Home | 0 | 30 | 30 | 30 | 30 |
| Total | ($1) | $531 | $295 | $296 | $292 |
Citywide Savings Program (CSP)
The April 2018 Financial Plan includes another round of the Citywide Savings Plan (CSP) that is expected to provide budget relief totaling $368 million in FY 2018, $386 million in FY 2019, $158 million in FY 2020, $228 million in FY 2021, and $218 million in FY 2022. With the exception of a procurement initiative in the Department of City Planning which is expected to save the agency $200,000 in FY 2020 and $130,000 in each of the remaining outyears of the Plan, all outyear savings are the result of recurring savings from FY 2018 and FY 2019 initiatives. Of the 138 new savings initiatives in the April Plan, 84 are scheduled to begin in FY 2018 with estimated savings of $368 million in FY 2018, $143 million in FY 2019, $103 million in FY 2020, $153 million in FY 2021, and $140 million in FY 2022.[5] Another 53 initiatives are scheduled to begin in FY 2019 with estimated savings of $243 million in FY 2019, $55 million in FY 2020, $75 million in FY 2021, and $78 million in FY 2022.
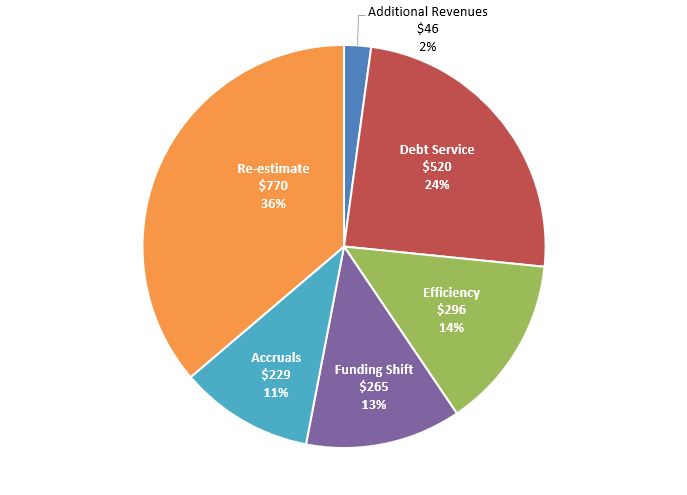
With the current round of CSP, estimated budget relief over the Plan period now totals $4.7 billion. The combined savings in FY 2018 and FY 2019 is $2.13 billon. As Chart 3 shows, debt service and re-estimates together account for 61 percent of the savings. Efficiency initiatives account for 14 percent of the total savings, an improvement from the last fiscal year’s CSP, where efficiency initiatives account for only 7 percent of total savings.[6]
Chart 3. Combined FY 2018 and FY 2019 Citywide Savings Program
($ in millions)
The Outyear Gaps
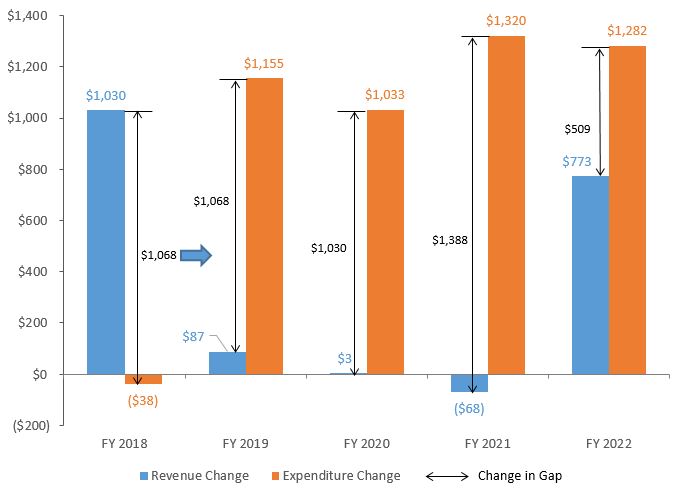
While FY 2018 and FY 2019 are balanced, the outyear gaps have increased by $1.03 billion in FY 2020, $1.39 billion in FY 2021, and $509 million in FY 2022. Outyear gaps are now projected to be $3.22 billion in FY 2020, $2.86 billion in FY 2021, and $2.25 billion in FY 2022. The increase in the gaps results from additional outyear expenditures which are not supported by additional recurring revenues. As Chart 4 shows, FY 2018 City-funds revenues are increased by $1.03 billion while expenditures are reduced by $38 million, resulting in additional resources of $1.06 billion. Beginning in FY 2019, City-funds expenditures have been increased by more than $1 billion in each year of the Plan. However, the revenue increase in FY 2018 does not extend into the outyears. FY 2019 is balanced because, as discussed above, the additional FY 2018 resources are earmarked to prepay FY 2019 expenses.
Chart 4. Change in the Outyear Gaps since February
($ in millions)
Risks and Offsets
As Table 9 shows, the Comptroller’s Office analysis of the April Plan shows net additional resources of $636 million and $213 million in FY 2018 and FY 2019, respectively, driven by the Comptroller’s Office’s tax revenue forecast, which is higher than the City’s projections in each year of the Plan. The Comptroller’s Office tax revenue forecast is discussed in greater detail in “Tax Revenues” beginning on page 26.
Risks to the City’s expenditure estimates offset some of the gains from the higher revenue forecast. Risks to the expenditure estimates stem primarily from assumptions of overtime spending and Health + Hospitals (H+H) support, and charter school tuition expenditures. Despite increases to the overtime budget in the current Plan, the Plan’s assumptions are still significantly below recent spending patterns. The Comptroller’s Office’s analysis indicates that overtime could be above Plan by $100 million in FY 2018, $153 million in FY 2019, and $150 million in each of the outyears of the Plan.
While H+H has yet to provide an update on its financial plan, recent improvements in its outlook will likely enable H+H to reimburse the City for fringe benefits expenses and medical malpractice settlements in FY 2018. However, given that H+H has missed these payments in prior years, the Comptroller’s Office continues to hold the assumption of outyear reimbursements at risk until there is a clear indication that H+H can consistently make these reimbursements.
Table 9. Risks and Offsets to the April 2018 Financial Plan
($ in millions, positive numbers decrease the gap and negative numbers increase the gap)
| FY 2018 | FY 2019 | FY 2020 | FY 2021 | FY 2022 | |
| City Stated Gap | $0 | $0 | ($3,216) | ($2,857) | ($2,254) |
| Tax Revenues | |||||
| Property Tax | $0 | $76 | $303 | $785 | $883 |
| Personal Income Tax | 730 | 182 | (117) | (190) | (260) |
| Business Taxes | 0 | 169 | 20 | 44 | 53 |
| Sales Tax | 0 | 91 | 179 | 149 | 85 |
| Real Estate Transaction Taxes | 26 | (23) | (384) | (483) | (79) |
| Audit | (50) | 100 | 200 | 200 | 200 |
| Subtotal Tax Revenues | $706 | $595 | $201 | $505 | $882 |
| Non-Tax Revenues | |||||
| ECB Fines | $0 | $20 | $20 | $20 | $20 |
| Late Filing/No Permit Penalties | 0 | 4 | 4 | 4 | 4 |
| Motor Vehicle Fines | 0 | 5 | 3 | 3 | 3 |
| Subtotal Non-Tax Revenues | $0 | $29 | $27 | $27 | $27 |
| Total Revenues | $706 | $624 | $228 | $532 | $909 |
| Expenditures | |||||
| Overtime | ($100) | ($153) | ($150) | ($150) | ($150) |
| Charter School Tuition | 0 | 0 | (119) | (281) | (478) |
| DOE Medicaid Reimbursement | (50) | (50) | (50) | (50) | (50) |
| Carter Cases | 0 | (60) | (60) | (60) | (60) |
| CEP School Food Revenue | 0 | 0 | 38 | 38 | 38 |
| Homeless Shelters | 0 | (33) | (42) | (42) | (42) |
| NYC Health + Hospitals | 0 | (165) | (165) | (165) | (165) |
| VRDB Interest Savings | 30 | 50 | 50 | 50 | 50 |
| General Reserve | 50 | 0 | 0 | 0 | 0 |
| Subtotal | ($70) | ($411) | ($498) | ($660) | ($857) |
| Total (Risks)/Offsets | $636 | $213 | ($270) | ($128) | $52 |
| Restated (Gap)/Surplus | $636 | $213 | ($3,486) | ($2,985) | ($2,202) |
In the latter years of the Plan, the Comptroller’s Office projects net risks of $270 million in FY 2020, $128 million in FY 2021, and a modest offset against spending of $52 million in FY 2022. The net risks for FY 2020 and FY 2021 reflect both smaller divergences between our PIT forecast and the Plan, and higher expenditure risks. The higher expenditure risks beginning in FY 2020 are due to the lack of funding for charter school tuition increases. Despite a change in State legislation which allows charter school tuition to grow at the same rate as public school spending, the Plan does not include funding for the cost of this growth. The lack of funding poses a risk to the City’s expenditure assumptions.
Overall, the Comptroller’s Office’s analysis of the Plan indicates that the City could end FY 2018 and FY 2019 with budget surpluses of $636 million and $213 million, respectively. In the outyears, the Comptroller’s Office analysis shows larger gaps of $3.49 billion and $2.99 billion in FY 2020 and FY 2021, respectively, and a slightly smaller gap of $2.20 billion in FY 2022.
Revenue Analysis
The April 2018 Financial Plan increases total projected revenues by $1.23 billion in FY 2018 to $88.67 billion. The bulk of this increase reflects higher estimated tax revenues from the personal income tax (PIT). The April Plan also raises total revenue projections for FY 2019 by $397 million to $89.06 billion. This revision includes increases to State and Federal grants and City-fund revenues. Total revenues are forecasted to increase by 9 percent over the Plan period, from $88.67 billion in FY 2018 to $96.25 billion in FY 2022. Estimated tax revenues average 68 percent of total revenues over the Plan period. Property tax revenues are forecasted to rise 21 percent from $26.38 billion in FY 2018 to $31.88 billion in FY 2022, while non property tax revenues are expected to increase by 8.6 percent during the same period, from $31.88 billion in FY 2018 to $34.62 billion in FY 2022.[7]
Miscellaneous (non-tax) revenue estimates, excluding private grants and intra-City revenues, increased slightly for FY 2018 and FY 2019 in the April Plan to $4.92 billion and $4.96 billion respectively. The forecast for the outyears declined by a combined $461 million. The downward revision is mainly driven by the removal of revenues from taxi medallion sales assumed in the previous Plan. The current forecast assumes miscellaneous revenue will remain stable averaging $4.97 billion annually.
The April Plan projects total Federal and State aid of $23.66 billion for FY 2018, an increase of $238 million over the February Plan. Similarly, the City has recognized net additional grants of $289 million, almost entirely in Federal aid, in FY 2019. The additional Federal support is predominantly in the areas of social services, education and, to a lesser degree, Homeland Security funding and Community Development Block Grants. Federal and State aid are projected to grow from $22.48 billion in FY 2019 to $23.33 billion in FY 2022 driven mainly by the City’s expectation of State education aid growth.
Tax Revenues
Changes to the City Forecast
The City increased its tax revenue projections by $973 million in FY 2018 and by a combined $1.26 billion in FY 2019 through FY 2022. The increase in FY 2018 largely reflects stronger than anticipated PIT collections in the current fiscal year due to one-time factors related to tax reform. As Table 10 shows, projected PIT revenues increased by $801 million in FY 2018. Estimated property tax revenues increased by $114 million reflecting a decrease in current year reserves, while smaller revisions to other non-property tax revenue projections mainly reflect year-to-date collections through March. In the outyears, revisions to the tax revenue forecast result in net increases ranging from $77 million in FY 2019 to $872 million in FY 2022. The upturn in tax revenue projections results for the most part from increases in PIT and property tax revenue forecasts. Outyear revisions to property tax revenue are mostly driven by a higher than anticipated property tax levy, while forecast increases in PIT revenues result from higher projections for non-withholding PIT collections. Partially offsetting these increases are downward revisions to business, sales, and real estate transaction tax revenues in FY 2019 – FY 2022.
Table 10. Revisions to the City’s Tax Revenue Assumptions
February 2018 vs. April 2018
| ($ in millions) | FY 2018 | FY 2019 | FY 2020 | FY 2021 | FY 2022 |
| February 2018 Financial Plan Total | $57,294 | $59,999 | $62,223 | $64,582 | $65,623 |
| Revisions: | |||||
| Property | 114 | 115 | 141 | 273 | 981 |
| Personal Income (PIT) | 801 | 194 | 213 | 120 | 16 |
| Business | (29) | (115) | (121) | (118) | (196) |
| Sales | 59 | (144) | (60) | (86) | 67 |
| Real Estate Transactions | 28 | 0 | (72) | (28) | (10) |
| All Other | 0 | 27 | 25 | 19 | 14 |
| Tax Audit | 0 | 0 | 0 | 0 | 0 |
| Revisions-Total | $973 | $77 | $126 | $180 | $872 |
| April 2018 Financial Plan – Total | $58,267 | $60,076 | $62,349 | $64,762 | $66,495 |
Comparison of Projected Tax Revenue Growth
The City and the Comptroller’s Office project tax revenue growth to accelerate in FY 2018 and then taper off for the remainder of the Plan period. As shown in Table 11, the Comptroller’s Office expects total tax revenue growth to accelerate to 7.9 percent in FY 2018, 1.3 percentage points above the City’s 6.6 percent growth projection. This is largely due to the Comptroller’s higher growth projection for PIT revenues in the current year compared to the City’s forecast. In the outyears, both the City and the Comptroller’s Office expect tax revenue growth to slow down to moderate rates as some of the tax revenue sources driving the FY 2018 growth are not expected to recur. The Comptroller’s tax revenue growth projection slows to 2.9 percent in FY 2019 and 3.1 percent in FY 2020 before picking up pace slightly in the latter years of the Plan period. The City and the Comptroller’s Office project overall tax revenue growth to average 3.4 percent annually over the Five Year Plan. A more detailed discussion of our projections and differences from the City’s forecast follows.
Table 11. Tax Revenue Forecast, Growth Rates
| FY 2018 | FY 2019 | FY 2020 | FY 2021 | FY 2022 | FYs 2018 – 22 Average Annual Growth | |
| Property | ||||||
| Mayor | 6.9% | 6.0% | 5.4% | 4.8% | 3.2% | 4.8% |
| Comptroller | 6.9% | 6.3% | 6.2% | 6.4% | 3.4% | 5.6% |
| PIT | ||||||
| Mayor | 12.7% | (2.2%) | 4.8% | 3.2% | 2.5% | 2.0% |
| Comptroller | 19.2% | (6.2%) | 2.3% | 2.7% | 2.0% | 0.1% |
| Business | ||||||
| Mayor | 1.0% | 6.6% | 1.9% | 2.2% | (0.2%) | 2.6% |
| Comptroller | 1.0% | 9.6% | (0.6%) | 2.6% | (0.1%) | 2.8% |
| Sales | ||||||
| Mayor | 5.4% | 4.9% | 5.2% | 4.0% | 3.4% | 4.4% |
| Comptroller | 5.4% | 6.1% | 6.3% | 3.5% | 2.6% | 4.6% |
| Real Estate Transactions | ||||||
| Mayor | (5.6%) | 0.2% | (1.6%) | 3.3% | 3.0% | 1.2% |
| Comptroller | (4.6%) | (1.8%) | (16.8%) | (1.1%) | 24.5% | 0.1% |
| All Other | ||||||
| Mayor | 7.2% | 0.5% | 1.2% | 1.7% | 2.3% | 1.4% |
| Comptroller | 7.2% | 0.5% | 1.2% | 1.7% | 2.3% | 1.4% |
| Total Tax with Audit | ||||||
| Mayor | 6.6% | 3.1% | 3.8% | 3.9% | 2.7% | 3.4% |
| Comptroller | 7.9% | 2.9% | 3.1% | 4.3% | 3.2% | 3.4% |
Summary of Revenue Risks and Offsets
As shown in Table 12, the Comptroller’s Office projections show net offsets of $706 million in FY 2018, $595 million in FY 2019, $201 million in FY 2020, $505 million in FY 2021 and $882 million in FY 2022. In the current fiscal year the offset is driven by the Comptroller’s significantly higher PIT revenue projection. In FY 2019, the Comptroller’s Office projects most major tax revenues as well as audit revenues to be higher than the City’s estimates, producing a net offset of $595 million. In the last three years of the Financial Plan, the Comptroller’s Office anticipates shortfalls in most non-property tax revenues. However, the Comptroller’s Office’s higher projection for property tax revenues and audit revenues in the outyears will more than offset projected shortfalls in non-property taxes, leading to a combined $1.59 billion in tax revenues above the April Plan projections in FY 2020 – FY 2022.
Table 12. Risks and Offsets to the City’s Tax Revenue Projections
| ($ in millions) | FY 2018 | FY 2019 | FY 2020 | FY 2021 | FY 2022 |
| Property | $0 | $76 | $303 | $785 | $883 |
| PIT | 730 | 182 | (117) | (190) | (260) |
| Business | 0 | 169 | 20 | 44 | 53 |
| Sales | 0 | 91 | 179 | 149 | 85 |
| Real Estate Transaction | 26 | (23) | (384) | (483) | (79) |
| Audit | (50) | 100 | 200 | 200 | 200 |
| Total | $706 | $595 | $201 | $505 | $882 |
Property Taxes
The Comptroller’s Office projects property tax offsets of $76 million in FY 2019 resulting from a reduction in total assessments between the tentative and final property tax rolls that are smaller than those anticipated by the City. Neither the Comptroller’s Office nor the City incorporate data from the final property tax roll for FY 2019, which will not be available until the end of May, in the forecast.
Although both the City and the Comptroller’s Office project slowing property tax growth, the Comptroller’s Office projects this growth will taper off more gradually, resulting in widening offsets in the outyears of $303 million in FY 2020, $785 million in FY 2021 and $883 million in FY 2022. These property tax offsets are smaller than in our February forecast, primarily as a result of the City increasing its own property tax revenue forecasts.
Personal Income Taxes
The Comptroller’s Office expects FY 2018 personal income tax revenues to grow by almost 20 percent. We concur with the City’s assessment that the boost to PIT revenues to date is driven in large part by non–recurring factors related to Federal tax reform – Public Law 115-97 the Tax Cuts and Jobs Act (TCJA). These include the shifting of income into FY 2018 due to the anticipation and enactment of the TCJA and the limitation of SALT deductibility, and two specific tax provisions: the Repatriation of Non-Qualified Deferred Compensation and the Transition Tax on Foreign Earnings.[8] Finally, a restructuring of the reimbursement of STAR caused withholding revenue to jump in FY 2018.
While these results are boosted by one-time tax related events, at the same time the underlying fundamentals of the City’s economy and Wall Street profitability are also strong. Assessing and distinguishing the impact of non-recurring and recurring factors on revenue is particularly challenging given the complexity of the provisions regarding the repatriation of foreign earnings and the scarcity of data available to assess these. The enactment of these complex provisions so late in the year meant that even tax filers and tax professionals had little time to determine their impact on tax year 2017 liability. Recognizing this, the New York State Department of Taxation and Finance circulated a notice on April 2018, indicating that it would weigh granting waivers for late payments.[9] This underscores the high degree of uncertainty that still surrounds this year’s filing season, which could have a large impact on PIT revenues in the remainder of the tax year. A detailed assessment of these factors and key differences with the City PIT forecast follows.
FY 2018: Based on collections data through the month of April, the Comptroller’s Office estimates that PIT revenue will exceed the City’s projections by $730 million. The City did not have full collections data for April and the month’s final tally was significantly higher ($650 million) than the City’s results indicate. All categories of non-withheld income, including offsets, were much higher than those indicated by the City in the Plan. The remaining months of the fiscal year are expected to build on this strength and upside, although there is considerable uncertainty regarding the second installment payment due June 15th.
FY 2019: As noted, the Comptroller’s Office concurs with the City’s assessment that FY 2018 are boosted by one-time nonrecurring revenues and our projection is that overall PIT will decline by 6 percent in FY 2019, driven by a 23 percent decline in non-withheld income. Even with this decline, non-withheld income is projected to be more than 8 percent higher than in FY 2017. Volatility and trading in the stock markets have picked up recently, suggesting that investors are seeking to realize gains accumulated with the run up in major indices over recent years.
Compared to the City, the Comptroller’s Office’s projected decline in PIT in FY 2019 is higher, but starts from a significantly higher base amount in 2018. Overall revenues therefore could be almost $182 million higher than the City estimates.
FY 2020 – FY 2022: Both the City’s and the Comptroller’s Office’s outyear forecast for PIT are predicated on continued but moderate economic growth with the economy approaching full employment. The Comptroller’s Office expects slightly lower growth in employment, 52,000 fewer jobs by FY 2022, and a marginally lower wage rate. As a result overall PIT revenue could be $260 million lower than the City projects in 2022.
In addition to the usual uncertainty regarding the long term forecast, out-year PIT results should be closely monitored to see if the limitation of SALT deductibility causes taxpayer flight. City PIT revenues could also be adversely impacted if employers opt into the State’s payroll tax, which would take effect starting in tax year 2019. A recent proposal by the Connecticut Department of Revenue Services to craft a tax credit for New York State payroll tax payments suggests that the possibility of opt-ins to the new payroll tax is being taken seriously.
Business Income Taxes
The TCJA also impacted the timing patterns of revenues from the City’s two business taxes, the general corporation tax (GCT) and unincorporated business tax (UBT). The projected decline in federal corporate business income tax rates and the incentive this provided to businesses to defer income into the current tax year was likely a factor explaining a projected FY 2018 decline of almost 6 percent. Conversely, UBT income, which is passed through to individuals, was likely boosted by the limitation imposed on SALT deductions by the TCJA.
Based on collections data through April, the Comptroller’s Office’s forecast for FY 2018 is similar to the City’s. In FY 2019 the difference is due to assumptions regarding the effects of income shifts due to the TCJA. The Comptroller’s Office assumes that the bounce back in GCT from FY 2018’s decline will be higher with growth of 13 percent compared to 9 percent assumed by the City. Similarly, for UBT the forecast growth of 4.2 percent following FY 2018 double digit growth is also marginally higher compared to the City’s forecast. Overall revenues from business taxes combined could therefore be $169 million higher than those shown by the City in FY 2019. In the outyears, the Comptroller’s Office and the City both expect growth in business taxes to moderate along with overall growth in the economy. The overall difference in the business tax forecast is minor in the outyears.
Sales Tax
Collections from the sales tax are projected to strengthen in FY 2018, supported by higher consumer confidence, low unemployment and steady wage and employment growth. The City and the Comptroller’s Office project sales tax revenue growth of 5.4 percent in FY 2018, the fastest growth since FY 2014. In FY 2019, the City forecasts growth in sales tax revenue to slow to 4.9 percent and reach $7.76 billion. This projection is net of the final $150 million in State intercept of sales tax revenues recognized in the April Plan. Over the Plan period, the City projects growth in sales tax revenue to average 4.4 percent annually, slightly below the Comptroller’s Office’s 4.6 percent growth forecast over the same period. The Comptroller’s Office forecasts sales tax revenues will grow by 6.1 percent in FY 2019 and 6.3 percent in FY 2020, producing offsets of $91 million and $179 million respectively. Although the Comptroller’s Office projects sales tax revenue growth to slow towards the end of the Plan, the Office anticipates that continued job and wage growth and strength in tourism will generate sales tax revenue in excess of the City’s forecast, producing offsets of $149 million in FY 2021 and $85 million in FY 2022.
The outyear forecast for Sales tax revenues could be impacted by a current case pending before the U.S. Supreme Court, South Dakota v. Wayfair, Inc., which could overturn the physical presence rule for taxing online sales. The outcome of that decision is unknown but New York City could potentially receive a windfall in sales revenue tax revenue from this decision.
Real Estate Transaction Taxes
The City projects a decline of 5.6 percent to $2.39 billion in the combined revenues from the real estate transaction taxes in FY 2018, following a decline of 15.8 percent in FY 2017. In FY 2018, the City projects revenues from the real property transfer tax (RPTT) and mortgage recording tax (MRT) to decline by 0.8 percent and 11.6 percent respectively. Higher interest rates are expected to lower refinancing as well as overall sales in this period. The City projects real estate transaction taxes to average 1.2 percent growth annually over the rest of the forecast period.
The Comptroller’s Office projects a more moderate decline of 4.6 percent in the combined revenues from the real estate transaction taxes in FY 2018, to $2.42 billion, resulting in an offset of $26 million. However, in subsequent years, the Comptroller’s Office projects risks of $23 million in FY 2019, $384 million in FY 2020, $483 million in FY 2021 and $79 million in FY 2022. The Comptroller’s Office projects real estate transaction taxes to average 0.1 percent growth annually over the forecast period. The Comptroller’s Office’s projections of offsets in FY 2018 and risks in outer years are based on the correction in the residential as well as commercial markets after record sales, as well as projected increases in interest rates, slowing growth in Gross City Product, New York City employment and financial markets.
Audit Revenues
The Comptroller’s Office estimates that current year audit revenues could be $50 million less than indicated by the City in FY 2018. Although audit collections so far seem to be on pace, the last quarter of the current fiscal year anticipates a fairly aggressive tally to reach a record high of almost $1.3 billion in revenues. In contrast in the outyears, the City’s forecast of audit revenues assumes a very sharp fall off from current levels of $1.3 billion to just over $700 million in FY 2022. This decline would be unprecedented. Audit revenues are more likely to remain in a range around $1 billion. We recognize offsets of $100 million in FY 2019 and $200 million annually in subsequent years.
Miscellaneous Revenues
In the April 2018 Financial Plan, the City raised its FY 2018 miscellaneous revenue projection by a net $57 million, to $4.92 billion.[10] The revision includes approximately $2 million in revenue initiatives included in the Citywide Savings Plan. The current year projection is $103 million lower than the total miscellaneous receipts collected in FY 2017. The decline in FY 2018 reflects lower non-recurring revenues such as asset sales and other one-time payments in the current fiscal year. For FY 2019, the Executive Budget forecasts miscellaneous revenue to grow only slightly to $4.97 billion, a net increase of $10 million from the February forecast.
The current miscellaneous revenue projection removes from the Financial Plan $929 million in revenues from the sale of taxi medallions previously anticipated over FY 2019 – FY 2022, which the Comptroller’s Office considered a risk to the City’s Financial Plan. The City last sold taxi medallions in FY 2014, when medallion prices were at their highest level. Since then, the proliferation of ride-sharing services has put downward pressure on medallion prices. According to data from the Taxi and Limousine Commission (TLC), average medallion prices fell below $200,000. The City’s previous Plan assumed an average price of $728,000 per medallion.
Table 13 Changes in FY 2019 Estimates
February 2018 vs. April 2018
| ($ in millions) | February | April | Change |
| Licenses, Franchises, Etc. | $679 | $689 | $10 |
| Interest Income | 179 | 190 | 11 |
| Charges for Services | 985 | 1,005 | 20 |
| Water and Sewer Charges | 1,393 | 1,450 | 57 |
| Rental Income | 254 | 254 | 0 |
| Fines and Forfeitures | 930 | 943 | 13 |
| Other Miscellaneous | 535 | 434 | (101) |
| Total | $4,955 | $4,965 | $10 |
*Water and sewer revenues collected by the Water Board from dedicated water and sewer charges represent reimbursements for operation and maintenance of the water delivery and sewer systems and therefore are not available for general operating purposes.
The FY 2019 miscellaneous revenue budget reflects revisions to nearly all categories of miscellaneous revenue. As Table 13 shows, the largest revisions were in the categories “other miscellaneous”, water and sewer charges, charges for services and fines and forfeitures. Revenue projection for “other miscellaneous” which comprises asset sales, cash recoveries, refunds of prior year expenditure and other non-recurring revenues decreased by a net $101 million. The revision reflects primarily the removal of $107 million in revenues from taxi medallion sales previously assumed in FY 2019. Projections for charges for services and fines and forfeitures increased by $20 million and $13 million respectively. These changes mostly reflect planned increases in passenger and commercial parking meter rates, additional fee revenue from the Affordable Housing Program and higher estimated parking violation fines. Projected revenues from licenses, franchises and permits increased by $10 million to account for higher expected revenues from construction permits and Wi-Fi franchise revenues. Finally, the Plan raised the forecast for interest income by $11 million in FY 2019 to reflect the City’s anticipation of a steady increase in the federal funds rate.
Although the April Plan increased projections for most of the miscellaneous revenue categories in the outyears of the Plan period, the removal from the Plan of revenues from taxi medallion sales results in net declines of $123 million in FY 2020, $249 million in FY 2021, and $99 million in FY 2022 compared to the February Plan. Overall, miscellaneous revenues are expected to remain steady averaging $4.97 billion annually in FY 2019 – FY 2022.
Based on recent collection trend, the Comptroller’s Office expects revenues from fines to be above the City’s forecast by $29 million in FY 2019, and $27 million annually in each of FY 2020 – FY 2022. The Comptroller’s Office believes revenues from Environmental Control Board (ECB) fines could generate an additional $20 million annually in each of FY’s 2019 through 2022. Motor vehicle fines could be higher by $5 million in FY 2019 and $3 million in each of FY’s 2020 – 2022, while penalties from the Department of Buildings (DOB) are likely to exceed the City’s current forecast by $4 million annually in FY 2019 through FY 2022.
Federal and State Aid
The FY 2019 Executive Budget assumes $22.48 billion in Federal and State assistance, reflecting an increase of $289 million since the February Plan. About 82 percent of this total is expected to support education and social services spending. On a year-over-year basis, the FY 2019 assumptions represent a decline of nearly $1.2 billion from projected Federal and State support in the current year, largely attributable to the rapid decline in Sandy-related reimbursement and more conservative estimates of certain Federal grants in FY 2019.
Changes since the February Plan is almost entirely reflected in Federal grants, rising by a net $288 million. Net of Sandy-related funding, the City anticipates $7.3 billion in Federal assistance for FY 2019. Excluding an inter-agency transfer of $150 million for the EarlyLearn program between DOE and ACS, education grants has increased by $56 million from expanded participation in the Federal school food program ($38 million) and revised special education support ($18 million). The Executive Budget also reflects additional funding of $113 million in social services mainly for DHS, including $88 million for family and adult shelters and $17 million for hotel security. Other major changes in the Federal aid projections include increases of $44 million in Homeland Security grants, $37 million in Sandy-related reimbursement and $37 million in Community Development Block Grants mainly for New York City Housing Authority repairs.
In FY 2019, the City anticipates State grants to total nearly $15 billion, including $11.1 billion for education. While the City managed to avoid deep cuts in charter schools, special education and child welfare services totaling $338 million, the Executive Budget still reflects a significant negative impact of $531 million from the enacted State budget. The impact largely stems from unfunded mandates that the State has imposed on the City, which include City payment of $254 million to the MTA for subway improvement and implementation costs of $108 million for the Raise the Age program for adolescent offenders. In addition, the State enacted school aid appropriations that fell short of the City’s expectation by $140 million and eliminated reimbursement for the City’s Close to Home youth residential placement program of $31 million. These reductions in aid have been offset by additional State grants recognized by the DOE for charter schools and preschool special education, as well as additional asset forfeitures, leaving State aid projections virtually unchanged since the February Plan.
However, the City still has not yet reflected a modified formula for tuition payments to charter schools that, without additional State reimbursement or a change in the formula, could pose risks of $119 million in FY 2020, $281 million in FY 2021 and $478 million in FY 2022. The City could also face additional State aid reductions under the extension and expansion of executive budgetary powers adopted last year that provides the State Division of Budget with broad authority to respond to Federal budget cuts. If federal Medicaid receipts to New York State are reduced by $850 million, or if all other federal receipts are reduced by $850 million, in state fiscal years 2018 – 19 through 2019-20, the Division of Budget could present a plan to the Legislature to uniformly reduce related local aid disbursements. If the Legislature fails to adopt an alternative plan within 90 days, the budget director’s proposal would become law.
Over the remainder of the Plan, Federal and State grants are projected to range between $22.43 billion in FY 2020 and $23.33 billion in FY 2022. These projections represent average annual growth of about 1.25 percent from the FY 2019 projections, driven primarily by the City’s expectation of State education aid increases of more than 3 percent annually. Assuming these assumptions hold, the level of Federal and State support for the City’s expense budget would decline from about 25 percent in FY 2019 to less than 24 percent by FY 2022.
Expenditures Analysis
Total-funds FY 2019 expenditures in the April Financial Plan are projected to remain relatively unchanged from FY 2018, growing by a modest $393 million, or less than half a percentage point. However, both the FY 2018 and FY 2019 expenditures include prepayments which lower debt service expenditures in these fiscal years. In addition, expenditures in FY 2018 are further reduced by the take-down of the general reserve and the re-estimates of prior-year accruals. After adjusting for prepayments, and excluding re-estimates of prior-year accruals and reserves, expenditures are projected to grow from $89.55 billion in FY 2018 to $91.47 billion in 2019, a growth of 2.1 percent, as shown in Table 14.
Expenditure growth over the Plan period is driven by spending on wages and salaries, debt service, health insurance, and other fringe benefits excluding pensions. The combined spending in these areas is projected to grow by 19.6 percent over the Plan period, averaging 4.6 percent annually. All other expenditures, net of the General Reserve, Capital Stabilization reserve, and prior-year re-estimates, are projected to decline slightly by 1.5 percent over the same period, with a projected annual average decline of 0.4 percent.
Table 14. FY 2018 – FY 2022 Expenditure Growth Adjusted for Prepayments and Prior-Year Actions
| ($ in millions) | FY 2018 | FY 2019 | FY 2020 | FY 2021 | FY 2022 | Growth FYs 18-22 | Annual Growth |
| Salaries and Wages | $26,739 | $28,345 | $29,239 | $29,987 | $29,688 | 11.0% | 2.7% |
| Debt Service | $6,231 | 6,963 | 7,511 | 7,903 | 8,608 | 38.1% | 8.4% |
| Health Insurance | $6,186 | 6,787 | 7,353 | 8,014 | 8,603 | 39.1% | 8.6% |
| Other Fringe Benefits | $3,708 | 3,847 | 4,187 | 4,292 | 4,383 | 18.2% | 4.3% |
| Subtotal | $42,864 | $45,941 | $48,289 | $50,196 | $51,282 | 19.6% | 4.6% |
| Pensions | $9,520 | $9,740 | $9,791 | $10,050 | $10,255 | 7.7% | 1.9% |
| Medicaid | $5,915 | $5,915 | $5,915 | $5,915 | $5,915 | 0.0% | 0.0% |
| Public Assistance | $1,583 | $1,605 | $1,617 | $1,617 | $1,617 | 2.1% | 0.5% |
| Judgments and Claims | $712 | $697 | $712 | $727 | $742 | 4.3% | 1.1% |
| Contractual Services | $17,288 | $16,059 | $15,553 | $15,690 | $15,804 | (8.6%) | (2.2%) |
| Other OTPS | $11,668 | $11,508 | $11,422 | $11,491 | $11,641 | (0.2%) | (0.1%) |
| Subtotal | $46,685 | $45,524 | $45,009 | $45,489 | $45,973 | (1.5%) | (0.4%) |
| Expenditures Before Reserves and Prior-Year Re-estimates | $89,548 | $91,465 | $93,298 | $95,685 | $97,255 | 8.6% | 2.1% |
| Prior-Year Accruals Re-estimate | ($400) | $0 | $0 | $0 | $0 | ||
| General Reserve | $50 | $1,000 | $1,000 | $1,000 | $1,000 | ||
| Capital Stabilization Reserve | $0 | $250 | $250 | $250 | $250 | ||
| Total | $89,198 | $92,715 | $94,548 | $96,935 | $98,505 | 10.4% | 2.5% |
Note: Numbers may not add due to rounding.
Headcount
The Executive 2019 Financial Plan projects total-funded full-time headcount of 303,862 for fiscal year-end 2018, an increase of 31 from the February Preliminary Plan. Planned headcount remains relatively stable for FY 2019 and FY 2020, with increases in FY 2021 and FY 2022 to 308,124 and 310,903, respectively, as shown in Table 15.
Table 15. Total Funded Full-Time Year-End Headcount Projections
April 2018 Financial Plan
| FY 2018 | FY 2019 | FY 2020 | FY 2021 | FY 2022 | |
| Pedagogical | |||||
| Dept. of Education | 119,613 | 120,720 | 120,968 | 122,410 | 125,095 |
| City University | 4,441 | 4,441 | 4,441 | 4,441 | 4,441 |
| Subtotal | 124,054 | 125,161 | 125,409 | 126,851 | 129,536 |
| Uniformed | |||||
| Police | 36,078 | 36,105 | 36,110 | 36,110 | 36,110 |
| Fire | 10,914 | 10,946 | 10,946 | 10,946 | 10,946 |
| Correction | 10,427 | 10,226 | 10,242 | 10,242 | 10,083 |
| Sanitation | 7,543 | 7,657 | 7,670 | 7,670 | 7,670 |
| Subtotal | 64,962 | 64,934 | 64,968 | 64,968 | 64,809 |
| Civilian | |||||
| Dept. Of Education | 12,271 | 12,358 | 12,444 | 13,111 | 13,387 |
| City University | 1,927 | 1,942 | 1,946 | 1,946 | 1,946 |
| Police | 15,858 | 15,407 | 15,607 | 15,606 | 15,606 |
| Fire | 6,228 | 6,291 | 6,316 | 6,315 | 6,315 |
| Correction | 2,195 | 2,273 | 2,273 | 2,273 | 2,273 |
| Sanitation | 2,268 | 2,302 | 2,302 | 2,302 | 2,302 |
| Admin. For Children’s Services | 7,157 | 7,016 | 7,450 | 7,664 | 7,664 |
| Social Services | 14,713 | 14,670 | 14,725 | 14,725 | 14,725 |
| Homeless Services | 2,613 | 2,577 | 2,577 | 2,577 | 2,577 |
| Health And Mental Hygiene | 5,726 | 5,466 | 5,520 | 5,520 | 5,520 |
| Finance | 2,230 | 2,198 | 2,263 | 2,263 | 2,263 |
| Transportation | 5,395 | 5,384 | 5,505 | 5,502 | 5,501 |
| Parks And Recreation | 4,401 | 4,292 | 4,335 | 4,332 | 4,332 |
| All Other Civilians | 31,864 | 32,177 | 32,104 | 32,169 | 32,147 |
| Subtotal | 114,846 | 114,353 | 115,367 | 116,305 | 116,558 |
| Total | 303,862 | 304,448 | 305,744 | 308,124 | 310,903 |
As shown in Table 16, FY 2018 year-end headcount shows a net increase of 31 as compared to the February 2018 Financial Plan, with more significant increases, of 1,042 in FY 2019, 2,220 in FY 2020, 2,470 in FY 2021 and 2,293 in FY 2022. The change in headcount in FY 2018 mainly reflects budgetary adjustments, while the increases in FY 2019 through FY 2022 are driven primarily by new staffing needs of ranging from 1,114 to 1,195.
Table 16. Full-time Headcount Plan-to-Plan Comparison
April 2018 Financial Plan vs. February 2018 Financial Plan
| FY 2018 | FY 2019 | FY 2020 | FY 2021 | FY 2022 | |
| Pedagogical | |||||
| Dept. of Education | 0 | 94 | 42 | 42 | 42 |
| City University | 0 | 0 | 0 | 0 | 0 |
| Subtotal | 0 | 94 | 42 | 42 | 42 |
| Uniformed | |||||
| Police | 160 | 164 | 169 | 169 | 169 |
| Fire | 0 | 0 | 0 | 0 | 0 |
| Correction | 0 | 259 | 259 | 259 | 100 |
| Sanitation | 0 | 23 | 23 | 23 | 23 |
| Subtotal | 160 | 446 | 451 | 451 | 292 |
| Civilian | |||||
| Dept. of Education | 12 | (37) | 31 | 31 | 31 |
| City University | 0 | 0 | 0 | 0 | 0 |
| Police | (207) | (408) | (220) | (221) | (221) |
| Fire | (2) | 67 | 92 | 92 | 92 |
| Correction | 0 | 71 | 71 | 71 | 71 |
| Sanitation | 0 | 0 | 0 | 0 | 0 |
| Admin. for Children’s Services | 0 | 44 | 479 | 693 | 693 |
| Social Services | 0 | (44) | 2 | 2 | 2 |
| Homeless Services | 0 | 0 | 0 | 0 | 0 |
| Health and Mental Hygiene | 5 | (27) | 40 | 40 | 40 |
| Finance | 0 | (44) | 9 | 9 | 9 |
| Transportation | 37 | 179 | 303 | 303 | 302 |
| Parks and Recreation | 0 | (29) | 25 | 25 | 25 |
| All Other Civilians | 26 | 730 | 895 | 932 | 915 |
| Subtotal | (129) | 502 | 1,727 | 1,977 | 1,959 |
| Total | 31 | 1,042 | 2,220 | 2,470 | 2,293 |
Table 17 compares actual headcount on March 31, 2018 to the planned FY 2018 year-end headcount. The current headcount plan shows an expected net increase of 8,407 full-time employees Citywide, from actual total headcount on June 30, 2017 of 295,455. As of March 31, 2017, three-quarters into the fiscal year, Citywide headcount has shown a net increase of only 2,532, a little over 30 percent of the planned increase. This pace of increase suggests that headcount may not meet its target for the current fiscal year.
Table 17. March 31, 2018 Headcount vs. Planned June 30, 2018 Headcount
| 6/30/2017 Actuals | 3/31/2018 Actuals | Change 6/30/2017 Actuals to 3/31/2018 Actuals | 6/30/2018 Executive 2019 Plan | Planned Change 6/30/2017 to 6/30/2018 | Percent of Planned Change Achieved | |
| Pedagogical | ||||||
| Dept. of Education | 118,671 | 119,654 | 983 | 119,613 | 942 | 104.35% |
| City University | 4,449 | 4,536 | 87 | 4,441 | (8) | (1,087.50%) |
| Subtotal | 123,120 | 124,190 | 1,070 | 124,054 | 934 | 114.56% |
| Uniformed | ||||||
| Police | 36,254 | 36,764 | 510 | 36,078 | (176) | (289.77%) |
| Fire | 11,090 | 11,067 | (23) | 10,914 | (176) | 13.07% |
| Correction | 10,862 | 10,873 | 11 | 10,427 | (435) | (2.53%) |
| Sanitation | 7,544 | 7,641 | 97 | 7,543 | (1) | (9,700.00%) |
| Subtotal | 65,750 | 66,345 | 595 | 64,962 | (788) | (75.51%) |
| Civilian | ||||||
| Dept. of Education | 12,528 | 12,735 | 207 | 12,271 | (257) | (80.54%) |
| City University | 1,904 | 1,860 | (44) | 1,927 | 23 | (191.30%) |
| Police | 14,802 | 14,999 | 197 | 15,858 | 1,056 | 18.66% |
| Fire | 6,289 | 6,074 | (215) | 6,228 | (61) | 352.46% |
| Correction | 1,729 | 1,772 | 43 | 2,195 | 466 | 9.23% |
| Sanitation | 2,137 | 2,115 | (22) | 2,268 | 131 | (16.79%) |
| Admin. for Children’s Services | 6,343 | 6,474 | 131 | 7,157 | 814 | 16.09% |
| Social Services | 13,244 | 12,929 | (315) | 14,713 | 1,469 | (21.44%) |
| Homeless Services | 2,341 | 2,369 | 28 | 2,613 | 272 | 10.29% |
| Health and Mental Hygiene | 5,176 | 5,443 | 267 | 5,726 | 550 | 48.55% |
| Finance | 1,931 | 1,910 | (21) | 2,230 | 299 | (7.02%) |
| Transportation | 4,773 | 4,852 | 79 | 5,395 | 622 | 12.70% |
| Parks and Recreation | 4,124 | 4,128 | 4 | 4,401 | 277 | 1.44% |
| All Other Civilians | 29,264 | 29,792 | 528 | 31,864 | 2,600 | 20.31% |
| Subtotal | 106,585 | 107,452 | 867 | 114,846 | 8,261 | 10.50% |
| Total | 295,455 | 297,987 | 2,532 | 303,862 | 8,407 | 30.12% |
Overtime (OT)
The FY 2019 Executive Budget includes $1.350 billion for overtime expenditures, almost 14 percent lower than the current FY 2018 overtime projection of $1.568 billion. While the Comptroller’s Office projects that overtime spending will be lower than FY 2018, the estimated decline is less than the City’s projection. The Comptroller’s Office estimates that FY 2019 overtime spending will total $1.503 billion, $153 million more than the City’s estimate, as shown in Table 18.
Table 18. Projected Overtime Spending, FY 2019
| ($ in millions) | City Planned Overtime FY 2019 | Comptroller’s Office Projected Overtime FY 2019 |
FY 2019 Risk |
| Uniformed | |||
| Police | $548 | $560 | ($12) |
| Fire | 212 | 212 | 0 |
| Correction | 150 | 190 | (40) |
| Sanitation | 111 | 111 | 0 |
| Total Uniformed | $1,021 | $1,073 | ($52) |
| Civilians | |||
| Police-Civilian | $82 | $100 | ($18) |
| Admin for Child Svcs | 17 | 30 | (13) |
| Environmental Protection | 21 | 40 | (19) |
| Transportation | 49 | 60 | (11) |
| All Other Agencies | 160 | 200 | (40) |
| Total Civilians | $329 | $430 | ($101) |
| Total City | $1,350 | $1,503 | ($153) |
Beginning in FY 2018, the City initiated cost-saving initiatives at several agencies to curb the continued growth in civilian overtime. These initiatives are expected to generate savings of at least $138 million over FY 2018-FY 2022. Civilian overtime cost has increased at an annual rate of 11.8 percent from $366 million in FY 2013 to $572 million in FY 2017. When compared to the adopted budget projections for these fiscal years, FY 2013 to FY 2017, actual civilian overtime averaged $466 million annually, 65 percent more than an average of $282 million at budget adoption. The Comptroller’s Office estimates that civilian overtime will cost the City about $430 million in FY 2019, $101 million higher than the City’s projection.
Annual spending for uniformed overtime averaged $1.099 billion for FY 2013 to FY 2017, an increase of 35 percent over the average budgeted amount at adoption. Over that period, uniformed overtime cost increased at an average annual rate of 6.9 percent, from $926 million in FY 2013 to $1.2 billion in FY 2017. Unlike civilian overtime cost, the cost for uniformed overtime appears to have stabilized over recent fiscal years. Uniformed agencies, mainly the Police Department (NYPD), the Fire Department (FDNY), and the Department of Corrections (DOC) have seen increases in headcount levels resulting in reductions of overtime hours being used to meet day to day operations. Both the Comptroller’s Office and the City project a drop in uniformed overtime for FY 2019. The Comptroller’s Office projects a drop to $1.07 billion compared to a drop to $1.02 billion projected by the City. As shown in Table 18, this represents a risk of $52 million to the City’s uniformed overtime spending projection.
Health Insurance
The FY 2019 Executive Budget projects health insurance spending for employees and retirees of $6.787 billion. As shown in Table 19, this is an increase of almost 10 percent or $601 million from the current estimate for FY 2018, adjusted for a prepayment of $400 million of retiree health benefits in FY 2017. Health insurance costs are then projected to increase at an average rate of 8.2 percent to $8.603 billion by FY 2022. Reflected in these projections are $1.3 billion in health insurance cost savings resulting from the Healthcare Reform Agreement negotiated between the City and the Municipal Labor Committee (MLC) in May of 2014.
The current projections reflect increases to the premium rates for active employees’ health insurance of 7.6 percent in FY 2018, 6.8 percent in FY 2019, 6.5 percent in FY 2020, 6.0 percent in FY 2021, and 5.5 percent in FY 2022. Medicare-eligible retirees’ health insurance premium rate increased by 2.4 percent in FY 2018, and are projected to increase by 5 percent annually in FY 2019 through FY 2022. These rates are higher than the increases in recent years which averaged 3.0 percent over FY 2015 to FY 2017 for active employees’ health insurance and 1.7 percent for Medicare-eligible retirees’ health insurance. The projected rates, however, are consistent with the projections of the Health Care Cost Trend Rate (HCCTR).[11] The City will realize budgetary savings should the rates be lower than projected.
Table 19. Pay-As-You-Go Health Expenditures
| ($ in millions) | FY 2018 | FY 2019 | FY 2020 | FY 2021 | FY 2022 |
| Department of Education | $2,331 | $2,491 | $2,736 | $3,060 | $3,329 |
| CUNY | 96 | 106 | 116 | 126 | 156 |
| All Other | 3,359 | 4,190 | 4,501 | 4,828 | 5,119 |
| Subtotal | $5,786 | $6,787 | $7,353 | $8,014 | $8,603 |
| FY 2017 Prepayment | 400 | 0 | 0 | 0 | 0 |
| Adjusted Pay-As-You-Go Health Insurance Costs |
$6,186 | $6,787 | $7,353 | $8,014 | $8,603 |
FY 2018 health insurance estimate is lower by $39 million than the February Plan, due mainly to lower headcount levels than previously projected. However, cost re-estimates and revisions to the estimates of planned headcount levels in the outyears result in net increases of $38 million in FY 2019, $64 million in FY 2020, and approximately $71 million in each of FY 2021 and FY 2022. The FY 2019 increase reflects a partial offset of about $14 million from an elimination of the need to fill 855 vacant positions across several City agencies.
Pensions
The FY 2019 Executive Budget projects pension contributions of $9.740 billion, an increase of 2 percent over the estimated FY 2018 contribution of $9.520 billion. Thereafter, pension contributions are projected to remain relatively stable over the Financial Plan period, increasing to $9.791 billion in FY 2020, $10.050 billion in FY 2021, and $10.255 billion in FY 2022.
As shown in Table 20, pension contributions increased by $42 million in FY 2018, $50 million in FY 2019, $140 million in FY 2020, and approximately $485 million in each of FY 2021 and FY 2022 when compared to the February Plan.[12] The net increases for FY 2019 to FY 2022 resulted mainly from funds reserved in the Financial Plan for potential costs that may result after the completion of the current actuarial audit of the five actuarial systems, as detailed further below in the discussion on actuarial audits and reports.
Table 20. FY 2018 – FY 2022 City Pension Contributions
| ($ in millions) | FY 2018 | FY 2019 | FY 2020 | FY 2021 | FY 2022 |
| Five Actuarial Systems | $9,538 | $9,765 | $9,680 | $9,600 | $9,816 |
| Reserve for Expected Adjustments* | 0 | (9) | 125 | 461 | 448 |
| Non-Actuarial Systems | 0 | 0 | 0 | 0 | 0 |
| Non-City Systems | 94 | 96 | 98 | 101 | 103 |
| Less: Intra City-Expense | (112) | (112) | (112) | (112) | (112) |
| Net Pension Expense April Plan | $9,520 | $9,740 | $9,791 | $10,050 | $10,255 |
| Net Pension Expense February Plan | $9,478 | $9,690 | $9,651 | $9,566 | $9,770 |
| Net Change | $42 | $50 | $140 | $484 | $485 |
*The reserve is being held to accommodate expected changes in headcount, valuation refinements, and salary adjustments.
**Totals may not add up due to rounding.
Pursuant to Chapter 96 of the New York City Charter, the Comptroller’s Office has engaged Bolton, Inc. to conduct two consecutive biennial independent actuarial audits. Bolton has recently completed their first audit and issued the following reports:[13]
The Independent Actuary’s Statement which certifies that the City’s pension systems are being funded appropriately and accurately, on sound actuarial principles, and in accordance with applicable statutes.
The Audit Report on Employer Pension Contribution Calculations for FY 2016 which verifies the accuracy of the pension systems’ assets, liabilities and employer pension contribution calculations.
The Administrative Review Report which validates the quality and completeness of the actuarial data used in valuations by reviewing the actuarial data gathering, transmission, and maintenance processes.
The Experience Study Report which reviews actual experience through June 30, 2015 and comments on the actuarial assumptions used by the Office of the Actuary (OA) to calculate contributions to the city pension funds.
Overall, the independent actuarial auditor concluded that the City funded the five actuarial pension systems appropriately for FY 2016 and that assumptions used to calculate pension contributions are reasonable. Bolton did, however, advise the City to review (1) the funding of the tax-deferred annuity (TDA) fixed fund for certain members of the Teachers Retirement System (TRS) and Board of Education Retirement System (BERS) and (2) the lag methodology utilized by the Office of the Actuary (OA) to determine annual employer contributions for the five actuarial systems.
- The TDA (403)(b) plan for employees belonging to TRS and BERS.Employees belonging to TRS and BERS may contribute to a tax-deferred annuity plan with an investment option of a fixed rate fund with a guaranteed interest rate of either 7 percent or 8.25 percent, depending on the member’s union affiliations. About 15 percent of the TRS TDA fixed fund balance and 67 percent of the BERS TDA fixed fund balance earn 8.25 percent. Since this rate is higher than the actuarial interest rate assumption (AIRA) of 7 percent, the employer contributions for these pension systems reflect an actuarial loss that was previously amortized to account for the difference. The City will now recognize the full cost annually and the current pension projections include $50 million each year for this cost.[14]
- One-Year Lag methodology (OYLM) used to determine employer contributions.Returns above or below the AIRA for a given fiscal year are phased-in over a six-year period beginning one year after the end of the given fiscal year. Under the OYLM, pension contributions for a given fiscal year are determined based on the fiscal year-end actuarial valuation date as of the second preceding year. For example, FY 2018 Employers’ pension contributions were calculated based on the June 30, 2016 actuarial valuation date. While using a lag method is very common in public sector valuations, Bolton has proposed that the Office of the Actuary consider technical refinements to the method currently being used. In the April Plan, the City has reserved $100 million beginning in FY 2019 for additional cost that may result from any changes or refinements to the lag methodology.
Bolton also highlighted certain trends that may result in recommendations to modify the underlying assumptions after the completion of the second audit. These areas include retiree mortality, overtime, and salary increase assumptions. The April Plan adds a reserve of $300 million in each of FY 2021 and FY 2022 for any additional costs that may arise from changes to the underlying assumptions.
Additional changes to the pension projections resulted from an update to the actuarial valuations of the systems and headcount changes. The updated valuations increase projected costs by $42 million in FY 2018, $44 million in FY 2020, more than $83 million in each of FY 2021 and FY 2022, and reduce costs by $45 million in FY 2019.
Pension contributions are based on the assumption that pension investments will earn the actuarial interest rate assumption (AIRA) of 7 percent. Each percentage point in investment return above or below the AIRA as of June 30, FY 2018 will, respectively, lower or increase pension contributions by approximately $23 million in FY 2020, $46 million in FY 2021, and $69 million in FY 2022.
Public Assistance
Through April, the City’s public assistance caseload has averaged 365,905 recipients per month, representing a decline of about one percent, or 3,880 recipients from the monthly average over the same period in FY 2017. The number of public assistance recipients continues to be range-bound between 360,000 and 368,000 over the past twelve months, well below the historic peak of 1,160,593 in March 1995. While there have been no major caseload movements in FY 2018, public assistance grants spending has increased steadily in recent months. Compared with the monthly average of $117 million in FY 2017, the FY 2018 monthly average spending has thus far jumped by more than five percent to about $123 million. The City indicates that rent arrears payments are among the main factors contributing to the rise in spending.
The City maintains its public assistance caseload projection at a monthly average of 367,000 over the current Plan period. Net baseline grants expenditures are projected at about $1.51 billion to $1.55 billion in each year of the Plan. While actual caseloads are currently below projections in FY 2018, baseline grants spending appears to be in line with the City’s expectation.
Department of Education
The April Modification shows a net increase of $621 million in the Department of Education’s (DOE) FY 2018 budget, which now totals $24.97 billion and represents an increase of 6.4 percent or $1.51 billion above actual FY 2017 spending of $23.46 billion. The budget increase in the current year is largely attributable to transfers from the miscellaneous budget that total about $500 million. The transfers include $447 million in scheduled lump-sum collective bargaining payment mainly for teachers, $29 million in health savings adjustment and $21 million in salary schedule adjustments for school safety agents. In addition, the DOE budget recognizes new needs of $80 million for special education Carter cases spending and $20 million for transportation costs.[15]
The FY 2019 Executive Budget projects DOE funding at $25.52 billion, an increase of $554 million or 2.2 percent from the FY 2018 budget. As mentioned above, the FY 2018 budget has risen significantly because of collective bargaining payments from the prior teachers’ contract. Compared to previous estimates, the Executive Budget shows a net decline of $62 million mainly as a result of the partial reversal of a prior transfer between the ACS and the DOE due to timing of the EarlyLearn program. Excluding the EarlyLearn transfer of $298 million, the DOE budget has actually increased by $236 million over the Preliminary Budget. In addition, the City has opted to backfill the shortfall in its education aid projection for FY 2019. Compared to previous education aid assumptions, the enacted State budget provided about $140 million less than the City anticipated. The DOE portion of this impact is $136 million, with the remainder taken against Building Aid assumption in the debt service budget.
The Executive Budget reflects new needs of $191 million that mainly stems from an increase in Fair Student Funding (FSF) allocations to schools. The City has provided an additional $125 million in FSF allocation that will raise the minimum funding threshold to 90 percent and the system funding average to almost 93 percent in FY 2019, compared with 87 percent and 91 percent, respectively, in FY 2018. Other major new needs in the Executive Budget include $31 million for Universal Literacy enhancements, $12 million for students in shelters and $9 million for new schools maintenance and operations. In addition, the DOE budget also reflects a $57 million increase in charter school supplemental tuition revenue from the State.
These funding increases are partly offset by additional CSP savings reflected in the DOE budget for FY 2019. Including the portion of citywide initiatives credited to DOE, the additional savings total about $164 million, reducing the DOE budget by a net $42 million since a significant portion of the new initiatives involve funding shifts that include $84 million from the recognition of Federal and State prior year payments for special education services claims and $38 million from expanded participation in the Federal Community Eligibility Provision (CEP) school food program. The remainder of the new savings include reductions in OTPS allocation of $20 million and administrative vacancies of $9 million.
Over the remainder of the Plan, funding for the Department is anticipated to rise to $26.47 billion in FY 2020 and $27.27 billion in FY 2021 before reaching $27.97 billion in FY 2022, reflecting an average increase of $817 million annually. State aid would comprise about $1.18 billion or 48 percent of the projected DOE budget growth of $2.45 billion between FY 2019 and FY 2022, while City funds would provide a similar $1.17 billion boost in the outyears. The remainder of the increase is comprised of $101 million in Federal funds.
The Department will likely continue to face risks from its assumptions of Federal Medicaid reimbursement in the April Plan. The DOE anticipates $97 million annually in Medicaid reimbursement for special education related services costs. While collections has steadily improved over the past three years, the current revenue targets still appear well out of reach, likely resulting in risks of at least $50 million in each year of the current plan. The DOE budget also has not reflected the potential costs from increased charter school tuition rates approved by the State in the outyears. Unless the State provides additional reimbursement in future legislative sessions or change the formula, the City indicates that DOE could face risks of $119 million in FY 2020, $281 million in FY 2021 and $478 million in FY 2022. Further, the DOE could face risks of at least $60 million annually from under-budgeting the costs of special education Carter cases beginning in FY 2019. While the City has increased funding in this area for FY 2018, no additional funding has been provided in the remaining years of the Plan. Finally, the DOE will likely generate revenue of $38 million annually that can potentially continue to be reflected as CSP savings in the outyears of the Plan, from expanded participation in the Federal CEP school food program. The current CSP program has thus far only reflected these savings in FY 2018 and FY 2019.
Homeless Services
Spending on adult and family shelter in the Department of Homeless Services is the primary driver of the City’s homelessness expenses. However, funding for homeless assistance is also, and increasingly, drawn from the budgets of other agencies, including the Department of Social Services, the Department of Youth and Community Development, the Department of Health and Mental Hygiene and the Department of Veterans Services. The table below details funding for seven major categories of homeless services across these agencies.
Table 21. Citywide Homeless Services Expenditures
| ($ in millions) | FY 2014 | FY 2018 | FY 2019 | FY 2020 | FY 2021 | FY 2022 |
| Adult Shelter Operations | $326 | $685 | $645 | $636 | $636 | $636 |
| Family Shelter Operations | 505 | 1,134 | 1,126 | 1,141 | 1,141 | 1,141 |
| Rental Assistance | 23 | 268 | 369 | 413 | 406 | 397 |
| Prevention, Diversion, Anti-Eviction & Aftercare | 82 | 287 | 346 | 340 | 339 | 339 |
| Domestic Violence, Youth & Emergency Shelters | 88 | 420 | 153 | 153 | 153 | 153 |
| Homeless Administration & Support | 151 | 134 | 266 | 278 | 284 | 283 |
| Total Citywide Homeless Spending | $1,175 | $2,928 | $2,905 | $2,961 | $2,959 | $2,949 |
The FY 2019 Executive Budget calls for $303 million in additional citywide homeless spending since the Preliminary Budget. The FY 2019 Executive Budget represents a 147 percent increase in citywide homeless spending since FY 2014. However, the Executive Budget only calls for incremental changes in the outyears and aspires to hold spending in FY 2022 to just 151 percent more than in FY 2014.
The City’s homeless spending increases are driven by a mix of controllable policies and uncontrollable societal forces that have elevated the City’s shelter population to remarkable levels. As of April 24, 2018, there were 59,546 individuals living in City shelter spaces, a total that is 15 percent larger than the FY 2014 average of 51,770 individuals. The April 24th shelter census represents a decrease of more than 1,500 individuals from an all-time high of more than 61,000 individuals in shelter which was recorded in early February.
The City has increased its current FY 2018 spending for adult and family shelter operations since adoption by $254 million or 59 percent and $227 million or 25 percent, respectively, and increases FY 2019 spending by $110 million for adult shelter operations and $141 million for family shelter operations. These shelter operations thresholds are anticipated to remain roughly flat in the out-years. Other notable changes since the Preliminary Budget are a $26 million reduction in shelter security spending by DHS for FY 2019 – FY 2022 and a $26 million increase to rental assistance expenditures in FY 2019 – FY 2022 which result from recent savings in reimbursements from the New York State Office of Children and Family Services that are now being channeled towards rental assistance spending.
Although the Executive Budget raises planned allocations for adult shelter operations in FY 2019 and beyond, budgeted expenditures in forthcoming fiscal years still lag behind currently budgeted spending for FY 2018. In FY 2019, the City projects an adult shelter operations decrease of more than $40 million from current FY 2018 levels despite unyielding growth in the single adult shelter population, which has risen by 11.7 percent since the start of FY 2018. Based on an estimated average annual cost of approximately $34,000 per single adult in shelter, the average adult shelter census would have to be lowered by approximately 1,185 single adults in order to achieve this $40 million reduction in FY 2019. Considering the steady upward trajectory of the single adult shelter census in recent years and barring any major shifts in homelessness policy that could reduce the single adult shelter census, the Executive FY 2019 Budget for adult shelter operations appears to be insufficient. If the City is able to keep its adult shelter census flat in FY 2019, it is anticipated that an additional $33 million in City funds will be necessary to meet the needs of the adult shelter population.
Debt Service
As shown in Table 22, debt service, net of prepayments, in the April 2018 Financial Plan totals $6.30 billion in FY 2018, $7.03 billion in FY 2019, $7.59 billion in FY 2020, $7.99 billion in FY 2021 and $8.68 billion in FY 2022. These amounts represent decreases from the February 2018 Financial Plan of $181 million in FY 2018, $126 million in FY 2019, $153 million in FY 2020, $224 million in FY 2021, and $207 million in FY 2022. Between FY 2018 and FY 2022, total debt service is expected to increase by $2.38 billion, or by 37.7 percent. These projections do not include debt service of the New York Water Finance Authority (NYW), which is backed by water and sewer user fees, and that of the Transitional Finance Authority Building Aid Revenue Bond (TFA BARB) debt, which is supported by New York State building aid.
Table 22. April 2018 Financial Plan Debt Service Estimates
| ($ in millions) | FY 2018 | FY 2019 | FY 2020 | FY 2021 | FY 2022 | Change FYs 2018 – 22 |
Percentage Change |
| GOa | $3,857 | $4,012 | $4,346 | $4,506 | $4,852 | $995 | 25.8% |
| TFAb | 2,135 | 2,802 | 3,015 | 3,247 | 3,607 | 1,472 | 68.9% |
| Lease-Purchase Debt | 239 | 148 | 150 | 150 | 149 | (90) | (37.6%) |
| TSASC, Inc. | 73 | 72 | 82 | 82 | 76 | 3 | 4.1% |
| Total | $6,304 | $7,034 | $7,593 | $7,985 | $8,684 | $2,380 | 37.7% |
Source: April 2018 Financial Plan.
Note: Debt service is adjusted for prepayments.
a Includes long-term GO debt service. b Amounts do not include TFA BARBs.
As shown on Table 23, the reduction in FY 2018 debt service is due primarily to downward revisions in General Obligations (GO) and Transitional Finance Authority Future Tax Secured (TFA) debt service. Letter of credit savings and excess building aid retention savings account for most of the reduction in GO and TFA debt service, respectively. In FY 2019 through FY 2022, GO debt service shows a net increase ranging from $23 million to $48 million, due primarily to accelerated and increased GO borrowing of $1.1 billion. Some of the increase in FY 2019 debt service is offset by a transfer of $89 million of Hudson Yards Infrastructure Corporation (HYIC) Tax Equivalency Payments (TEP) from the debt service budget to the miscellaneous budget because the TEPs are not debt service payments.[16]
Table 23. Changes from the February 2018 Financial Plan-Debt Service Estimates
| ($ in millions) | FY 2018 | FY 2019 | FY 2020 | FY 2021 | FY 2022 | |
| GO Baseline | ($89) | $23 | $48 | $25 | $27 | |
| TFA Baseline | (89) | (63) | (115) | (163) | (148) | |
| Lease-Purchase Debt –Other | (3) | 3 | 3 | 3 | 3 | |
| HYIC TEP Transfer to Misc. Budget | 0 | (89) | (89) | (89) | (89) | |
| Total | ($181) | ($126) | ($153) | ($224) | ($207) | |
Source: April 2018 Financial Plan and NYC Comptroller.
In recent years, interest rates on the City’s variable-rate debt have been lower than initially projected. The Comptroller’s Office estimates additional variable-rate savings of $30 million in FY 2018 and an estimated $50 million in each of FY 2019 – FY 2022.
Debt Affordability
The affordability of debt service is a measure which varies with each municipality, but a threshold of 15 percent of local tax revenues has been a benchmark of affordability as it puts debt service in the context of its own local resources. In FY 2017, the City’s debt service was 11.1 percent of local tax revenues. The April 2018 Plan projects debt service will comprise 10.8 percent of local tax revenues in FY 2018, 11.7 percent in FY 2019, 12.1 percent in FY 2020, 12.3 percent in FY 2021, and 13.0 percent in FY 2022, as shown in Chart 5.
Chart 5. NYC Debt Service as a Percent of Tax Revenues
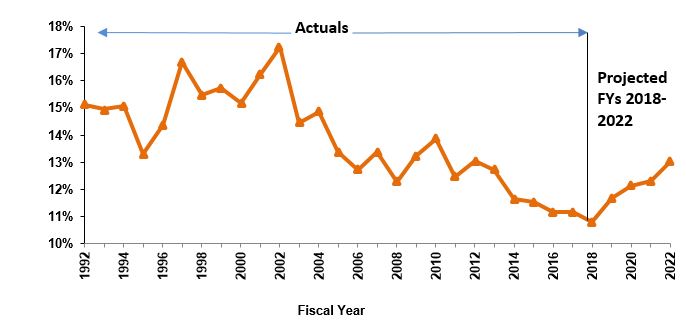
Source: Office of the NYC Comptroller, Comprehensive Annual Financial Reports, FY 1992 – FY 2017, and NYC Office of Management and Budget, April 2018 Financial Plan.
The upward trend in the debt service to tax revenue ratio reflects the disparity between debt service and tax revenue growths over the Plan period. Debt service is projected to grow at an average annual rate of 8.4 percent from FY 2018 to FY 2022 while tax revenue during this period is projected to grow 3.4 percent annually.
Capital Budget and Financing Program
The April 2018 Capital Plan authorizes commitments totaling $82.0 billion over FY 2018 – FY 2022, $74.49 billion of which are City-funded. After adjusting for the reserve for unattained commitments, all-funds planned commitments drop to $74.92 billion, as shown in Table 24 below. The City-funds commitments after adjusting for the reserve for unattained commitments drop to $67.41 billion.
Table 24. April 2018 Capital Commitment Plan
All-Funds FY 2018 – FY 2022
| ($ in millions) | April 2018 Plan |
Change from February 2018 | Percent of April Plan Total |
| Education & CUNY | $14,761 | $215 | 18.0% |
| Environmental Protection | 14,292 | 533 | 17.4% |
| Dept. of Transportation & NYC Transit | 14,618 | 600 | 17.8% |
| Housing and Economic Development | 12,181 | 458 | 14.9% |
| Administration of Justice | 5,332 | (1) | 6.5% |
| Technology and Citywide Equipment | 4,341 | 112 | 5.3% |
| Parks Department | 4,596 | 521 | 5.6% |
| NYC Health + Hospitals | 2,817 | (233) | 3.4% |
| Other City Operations and Facilities | 9,062 | 178 | 11.1% |
| Total | $82,000 | $2,384 | 100.0% |
| Reserve for Unattained Commitments | ($7,082) | ($1,576) | N/A |
| Adjusted Total | $74,918 | $808 | N/A |
Source: Office of Management and Budget, FY 2019 Executive Capital Commitment Plan, also known as April 2018 Capital Commitment Plan.
The April 2018 Capital Commitment Plan shows an increase from the February 2018 Capital Plan of $2.38 billion in all-funds authorized commitments over FY 2018 – FY 2022. City-funds commitments over this period are $2.55 billion more than in February.[17] Non-City commitments dropped by $163 million over the period.
Estimated commitments for capital projects in DOE and the City University of New York (CUNY) account for $14.76 billion or 18.0 percent of planned all-funds commitments, with DOE accounting for $14.16 billion of the commitments. Other major capital commitments of the Plan are for capital projects in the Department of Environmental Protection (DEP) which comprise 17.4 percent of the planned all-funds commitments, Department of Transportation (DOT) and New York City Transit projects, which account for 17.8 percent, and Housing and Economic Development projects, which account for 14.9 percent of the Plan.[18] As with prior plans, these four major program areas constitute a majority of the Commitment Plan, accounting for $55.85 billion, or 68.1 percent of the Plan.
As shown on Table 25 below, major changes from the February 2018 Plan include:
- An increase of $521 million in the Parks Department, including an increased allocation of $77 million for state of good repair projects and $50 million for the Hudson River Park Trust.
- An increase of $339 million for Economic Development projects, $299 million of which is for the purchase of ferries and landing infrastructure improvements.
- An increase of $313 million for Highways related projects in DOT, $104 million of which is for increased sidewalk and pedestrian ramp reconstruction.
- An increase of $250 million for water main projects in DEP, primarily for watershed related infrastructure projects and water main extensions citywide.
- An increase of $204 million in the Dept. of Education, $73 million of which are Borough President additions.
- An increase of $164 million for New York City Transit for the Subway Action Plan (SAP).
- An increase of $129 million related to Water Pollution Control projects, $98 million of which is for combined sewer overflow abatement projects.
- A decrease of $233 million to the H + H capital plan; due primarily to a delay in a portion of the new Coney Island Hospital Campus (Sandy related) project to FY 2023.
Compared to the previous Plan, FY 2018 and 2019 commitments in the April Commitment Plan are reduced by $4.83 billion and $1.59 billion, respectively, while outyear commitments are increased by $1.75 billion in FY 2020, $3.87 billion in FY 2021, and $3.19 billion in FY 2022. The redistribution of commitments into the outyears is an attempt to provide a more realistic forecast of future commitments. As a result, the April 2018 Plan is less front-loaded than the February Plan, with 44 percent of estimated commitments contained in FY 2018 and FY 2019, compared to 53 percent in February.
Table 25. April 2018 Capital Commitment Plan
Change from Februay Plan by Project Type
| ($ in millions) | FY 2018 | FY 2019 | FY 2020 | FY 2021 | FY 2022 | Cumulative Change FYs 2018 – 2022 Dollars Percent |
|
| Dept. for the Aging | ($5) | ($1) | $2 | $0 | $3 | ($0) | 0.0% |
| Waterway Bridges | ($99) | $35 | $65 | $1 | $1 | $4 | 0.3% |
| Correction | ($1,364) | $310 | $939 | $46 | $70 | $0 | 0.0% |
| Courts | ($60) | ($166) | $44 | $106 | $74 | ($1) | (0.1%) |
| Admin. for Children Services | ($227) | $96 | $101 | $17 | $18 | $6 | 1.1% |
| D.O.I.T.T | ($50) | $32 | $0 | $9 | $9 | $0 | 0.0% |
| Education | ($23) | $227 | $0 | $0 | $0 | $204 | 1.5% |
| Economic Development | ($450) | ($254) | $154 | $525 | $363 | $339 | 8.3% |
| DEP Equipment | ($8) | ($6) | $19 | ($52) | $96 | $48 | 10.0% |
| Fire Dept. | ($94) | ($37) | $38 | $57 | $37 | $0 | 0.0% |
| Ferries | ($9) | ($22) | ($48) | $73 | $27 | $21 | 5.3% |
| Housing Authority | ($0) | $159 | ($19) | ($39) | $0 | $100 | 7.3% |
| Highway Bridges | ($11) | ($317) | ($29) | $199 | $162 | $4 | 0.1% |
| Housing Preservation & Dev. | ($41) | ($39) | ($50) | $75 | $75 | $20 | 0.3% |
| Homeless Services | ($16) | $41 | ($7) | ($21) | $3 | $0 | 0.0% |
| Health | ($40) | ($47) | $42 | $21 | $23 | ($1) | (0.2%) |
| City University of New York | ($91) | ($41) | $55 | $51 | $37 | $12 | 2.0% |
| NYC Health + Hospitals | ($89) | ($275) | $88 | $93 | ($49) | ($233) | (7.6%) |
| Human Resources Administration | ($38) | $27 | $29 | ($1) | $10 | $26 | 11.7% |
| Highways | ($64) | ($441) | $18 | $169 | $631 | $313 | 6.4% |
| NY Research Libraries | ($1) | $1 | $0 | $0 | $0 | ($0) | (0.2%) |
| Brooklyn Public Library | ($10) | ($90) | $79 | $24 | ($2) | $2 | 0.6% |
| New York Public Library | ($54) | $43 | $23 | $2 | ($13) | $2 | 0.4% |
| Queens Public Library | ($44) | ($35) | $11 | $37 | $31 | $0 | 0.1% |
| MTA Bus Company | $0 | $0 | $0 | $0 | $0 | $0 | 0.0% |
| Parks & Recreation | ($547) | ($4) | $115 | $819 | $139 | $521 | 12.8% |
| Police Dept. | ($107) | ($161) | ($83) | $332 | $18 | $0 | 0.0% |
| Citywide Equipment | ($591) | ($126) | $180 | $385 | $264 | $112 | 3.0% |
| Cultural Affairs | ($145) | ($80) | $13 | $100 | $113 | $2 | 0.2% |
| Public Buildings | ($190) | $48 | $66 | $134 | $30 | $88 | 5.6% |
| Real Property | ($25) | ($25) | ($25) | $75 | $0 | ($0) | 0.0% |
| Sanitation | ($67) | $81 | ($219) | $259 | $0 | $54 | 2.5% |
| Sewers | $36 | ($337) | $63 | ($0) | $346 | $108 | 3.3% |
| S.I. Rapid Transit | $0 | $0 | $0 | $0 | $0 | $0 | 0.0% |
| Transit Authority | $170 | $79 | ($85) | $0 | $0 | $164 | 25.6% |
| Transportation, Equipment | ($2) | ($14) | $12 | $12 | $5 | $13 | 8.5% |
| Traffic | ($7) | ($26) | $9 | $30 | $76 | $81 | 16.7% |
| Water Supply | ($216) | $206 | $5 | $2 | $0 | ($3) | (0.1%) |
| Water Mains, Sources, & Treatment | ($49) | ($239) | $64 | $205 | $268 | $250 | 8.2% |
| Water Pollution Control | ($202) | ($198) | $83 | $120 | $326 | $129 | 2.6% |
| Total | ($4,829) | ($1,594) | $1,750 | $3,866 | $3,190 | $2,384 | 3.0% |
Note: Numbers may not add due to rounding.
Financing Program
The April 2018 Financial Plan for FY 2018 – FY 2022 contains $52.23 billion of planned borrowing in FY 2018 – FY 2022 as shown below in Table 26. The borrowing is comprised of $21.49 billion of GO bonds, $20.53 billion of TFA borrowing, $8.58 billion of NYW borrowing, and $1.63 billion of TFA BARBs borrowing, which are supported by State building aid revenues.
Table 26. April 2018 Financial Plan – Financing Program
($ in millions)
| Estimated Borrowing and Funding Sources FYs 2018 – 2022 | Percent of Total | |
| GO Bonds | $21,490 | 41.2% |
| TFA – PIT Bonds | 20,530 | 39.3% |
| NYC Water Finance Authority | 8,578 | 16.4% |
| TFA – BARBs | 1,633 | 3.1% |
| Total | $52,231 | 100.0% |
Source: NYC Office of Management and Budget, April 2018 Financial Plan.
Total projected borrowing in the April Plan for FY 2018 through FY 2022 is $632 million less than the February 2018 Plan estimate for the same period. This is due to a reduction in planned NYW borrowing of $892 million offset by a net increase of $260 million in GO/TFA borrowing over the period.
More specifically, FY 2018 borrowing increased by $1.1 billion due to the acceleration of GO borrowing into FY 2018. In FY 2019, TFA borrowing was dropped by $1.2 billion as a result. In FY 2020 both GO and TFA decreased by $500 million each. In FY 2021 GO and TFA combined for a modest increase of $100 million, followed by an increase of $1.26 billion in FY 2022.
Appendix
Table A1. April 2018 Financial Plan Revenue Detail
($ in millions)
| FY 2018 | FY 2019 | FY 2020 | FY 2021 | FY 2022 | Change FYs 2018 – 2022 Dollars Percent |
Annual Percent Change | ||
| Taxes: | ||||||||
| Real Property | $26,383 | $27,974 | $29,477 | $30,891 | $31,880 | $5,497 | 20.8% | 4.8% |
| Personal Income Tax | $12,658 | $12,378 | $12,969 | $13,390 | $13,722 | $1,064 | 8.4% | 2.0% |
| General Corporation Tax | $3,298 | $3,593 | $3,606 | $3,640 | $3,604 | $306 | 9.3% | 2.2% |
| Unincorporated Business Tax | $2,205 | $2,271 | $2,372 | $2,468 | $2,490 | $285 | 12.9% | 3.1% |
| Sale and Use Tax | $7,399 | $7,762 | $8,167 | $8,491 | $8,779 | $1,380 | 18.7% | 4.4% |
| Real Property Transfer | $1,404 | $1,459 | $1,435 | $1,485 | $1,532 | $128 | 9.1% | 2.2% |
| Mortgage Recording Tax | $988 | $938 | $924 | $952 | $979 | ($9) | (0.9%) | (0.2%) |
| Commercial Rent | $848 | $867 | $893 | $916 | $949 | $101 | 11.9% | 2.9% |
| Utility | $382 | $387 | $396 | $410 | $421 | $39 | 10.2% | 2.5% |
| Hotel | $589 | $606 | $605 | $615 | $630 | $41 | 7.0% | 1.7% |
| Cigarette | $36 | $35 | $34 | $33 | $32 | ($4) | (11.1%) | (2.9%) |
| All Other | $778 | $750 | $750 | $750 | $756 | ($22) | (2.8%) | (0.7%) |
| Tax Audit Revenue | $1,299 | $1,056 | $721 | $721 | $721 | ($578) | (44.5%) | (13.7%) |
| Total Taxes | $58,266 | $60,076 | $62,349 | $64,762 | $66,495 | $8,229 | 14.1% | 3.4% |
| Miscellaneous Revenue: | ||||||||
| Licenses, Franchises, Etc. | $740 | $689 | $719 | $716 | $725 | ($15) | (2.0%) | (0.5%) |
| Interest Income | $110 | $190 | $252 | $282 | $284 | $174 | 158.2% | 26.8% |
| Charges for Services | $1,023 | $1,005 | $1,007 | $1,006 | $1,006 | ($17) | (1.7%) | (0.4%) |
| Water and Sewer Charges | $1,423 | $1,450 | $1,449 | $1,436 | $1,416 | ($7) | (0.5%) | (0.1%) |
| Rental Income | $263 | $254 | $251 | $250 | $250 | ($13) | (4.9%) | (1.3%) |
| Fines and Forfeitures | $975 | $943 | $938 | $928 | $917 | ($58) | (5.9%) | (1.5%) |
| Miscellaneous | $386 | $434 | $444 | $343 | $342 | ($44) | (11.4%) | (3.0%) |
| Intra-City Revenue | $2,208 | $1,824 | $1,770 | $1,774 | $1,774 | ($434) | (19.7%) | (5.3%) |
| Total Miscellaneous Revenue | $7,128 | $6,789 | $6,830 | $6,735 | $6,714 | ($414) | (5.8%) | (1.5%) |
| Reserve for Disallowance of Categorical Grants | $85 | ($15) | ($15) | ($15) | ($15) | ($100) | (117.6%) | NA |
| Less: Intra-City Revenue | ($2,208) | ($1,824) | ($1,770) | ($1,774) | ($1,774) | $434 | (19.7%) | (5.3%) |
| TOTAL CITY-FUNDS | $63,271 | $65,026 | $67,394 | $69,708 | $71,420 | $8,149 | 12.9% | 3.1% |
| Other Categorical Grants | $1,088 | $879 | $871 | $866 | $861 | ($227) | (20.9%) | (5.7%) |
| Inter-Fund Agreements | $646 | $682 | $641 | $638 | $638 | ($8) | (1.2%) | (0.3%) |
Table A1 (Con’t). April 2018 Financial Plan Revenue Detail
($ in millions)
| FY 2018 | FY 2019 | FY 2020 | FY 2021 | FY 2022 | Change FYs 2018 – 2022 Dollars Percent |
Annual Percent Change | ||
| Federal Categorical Grants: | ||||||||
| Community Development | $1,353 | $506 | $302 | $278 | $272 | ($1,081) | (79.9%) | (33.0%) |
| Welfare | $3,734 | $3,605 | $3,473 | $3,481 | $3,481 | ($253) | (6.8%) | (1.7%) |
| Education | $1,825 | $1,944 | $2,042 | $2,044 | $2,044 | $219 | 12.0% | 2.9% |
| Other | $1,887 | $1,452 | $1,310 | $1,303 | $1,292 | ($595) | (31.5%) | (9.0%) |
| Total Federal Grants | $8,799 | $7,507 | $7,127 | $7,106 | $7,089 | ($1,710) | (19.4%) | (5.3%) |
| State Categorical Grants | ||||||||
| Social Services | $1,815 | $1,781 | $1,796 | $1,803 | $1,795 | ($20) | (1.1%) | (0.3%) |
| Education | $10,759 | $11,108 | $11,419 | $11,851 | $12,291 | $1,532 | 14.2% | 3.4% |
| Higher Education | $297 | $297 | $297 | $297 | $297 | $0 | 0.0% | 0.0% |
| Department of Health and Mental Hygiene | $616 | $543 | $543 | $527 | $527 | ($89) | (14.4%) | (3.8%) |
| Other | $1,378 | $1,240 | $1,244 | $1,282 | $1,333 | ($45) | (3.3%) | (0.8%) |
| Total State Grants | $14,865 | $14,969 | $15,299 | $15,760 | $16,243 | $1,378 | 9.3% | 2.2% |
| TOTAL REVENUES | $88,669 | $89,063 | $91,332 | $94,078 | $96,251 | $7,582 | 8.6% | 2.1% |
Table A2. April 2018 Financial Plan Expenditure Detail
($ in millions)
| FY 2018 | FY 2019 | FY 2020 | FY 2021 | FY 2022 | Change FYs 2018 – 2022 Dollars Percent |
Annual Percent Change |
||
| Mayoralty | $133 | $133 | $129 | $127 | $127 | ($6) | (4.5%) | (1.2%) |
| Board of Elections | $143 | $122 | $98 | $96 | $96 | ($47) | (32.9%) | (9.5%) |
| Campaign Finance Board | $44 | $21 | $14 | $14 | $14 | ($30) | (67.9%) | (24.7%) |
| Office of the Actuary | $8 | $7 | $7 | $7 | $7 | ($0) | (5.2%) | (1.3%) |
| President, Borough of Manhattan | $5 | $5 | $5 | $5 | $5 | ($0) | (8.6%) | (2.2%) |
| President, Borough of Bronx | $6 | $6 | $5 | $5 | $5 | ($1) | (9.3%) | (2.4%) |
| President, Borough of Brooklyn | $7 | $7 | $6 | $6 | $6 | ($1) | (14.8%) | (3.9%) |
| President, Borough of Queens | $6 | $6 | $5 | $5 | $5 | ($1) | (15.1%) | (4.0%) |
| President, Borough of Staten Island | $5 | $5 | $4 | $4 | $4 | ($0) | (6.8%) | (1.7%) |
| Office of the Comptroller | $106 | $106 | $106 | $106 | $106 | $0 | 0.4% | 0.1% |
| Dept. of Emergency Management | $64 | $57 | $28 | $29 | $29 | ($35) | (55.3%) | (18.2%) |
| Office of Administrative Tax Appeals | $5 | $5 | $5 | $5 | $5 | $0 | 7.0% | 1.7% |
| Law Dept. | $222 | $231 | $240 | $239 | $239 | $17 | 7.8% | 1.9% |
| Dept. of City Planning | $41 | $52 | $42 | $42 | $40 | ($1) | (2.1%) | (0.5%) |
| Dept. of Investigation | $48 | $34 | $33 | $33 | $33 | ($15) | (31.6%) | (9.1%) |
| NY Public Library — Research | $28 | $28 | $28 | $28 | $28 | ($0) | (0.2%) | (0.0%) |
| New York Public Library | $138 | $137 | $137 | $137 | $137 | ($1) | (0.5%) | (0.1%) |
| Brooklyn Public Library | $103 | $102 | $102 | $102 | $102 | ($1) | (0.8%) | (0.2%) |
| Queens Borough Public Library | $106 | $105 | $105 | $105 | $105 | ($1) | (0.7%) | (0.2%) |
| Dept. of Education | $24,969 | $25,524 | $26,469 | $27,274 | $27,974 | $3,005 | 12.0% | 2.9% |
| City University | $1,156 | $1,160 | $1,168 | $1,184 | $1,199 | $44 | 3.8% | 0.9% |
| Civilian Complaint Review Board | $16 | $17 | $17 | $17 | $17 | $1 | 6.2% | 1.5% |
| Police Dept. | $5,524 | $5,324 | $5,265 | $5,230 | $5,230 | ($293) | (5.3%) | (1.4%) |
| Fire Dept. | $2,152 | $2,020 | $2,040 | $2,037 | $2,031 | ($121) | (5.6%) | (1.4%) |
| Dept. of Veterans’ Services | $4 | $5 | $5 | $5 | $5 | $0 | 10.2% | 2.4% |
| Admin. for Children Services | $3,075 | $2,894 | $2,651 | $2,673 | $2,666 | ($409) | (13.3%) | (3.5%) |
| Dept. of Social Services | $9,893 | $9,909 | $9,950 | $9,960 | $9,951 | $58 | 0.6% | 0.1% |
| Dept. of Homeless Services | $2,148 | $2,059 | $2,079 | $2,085 | $2,084 | ($64) | (3.0%) | (0.8%) |
| Dept. of Correction | $1,420 | $1,402 | $1,441 | $1,442 | $1,439 | $19 | 1.3% | 0.3% |
| Board of Correction | $3 | $3 | $3 | $3 | $3 | $0 | 11.9% | 2.9% |
| Citywide Pension Contribution | $9,520 | $9,739 | $9,791 | $10,049 | $10,255 | $735 | 7.7% | 1.9% |
| Miscellaneous | $9,118 | $11,714 | $12,305 | $13,265 | $13,174 | $4,056 | 44.5% | 9.6% |
| Debt Service | $4,096 | $4,161 | $4,495 | $4,656 | $5,000 | $904 | 22.1% | 5.1% |
| T.F.A. Debt Service | $2,135 | $2,802 | $3,015 | $3,247 | $3,607 | $1,472 | 68.9% | 14.0% |
| FY 2017 BSA and Discretionary Transfers | ($4,180) | $0 | $0 | $0 | $0 | $4,180 | (100.0%) | (100.0%) |
| FY 2018 BSA | $3,652 | ($3,652) | $0 | $0 | $0 | ($3,652) | (100.0%) | (100.0%) |
| Public Advocate | $4 | $4 | $4 | $4 | $4 | ($0) | (0.1%) | (0.0%) |
| City Council | $65 | $81 | $54 | $54 | $54 | ($11) | (16.7%) | (4.5%) |
| City Clerk | $5 | $5 | $6 | $6 | $6 | $0 | 3.6% | 0.9% |
| Dept. for the Aging | $373 | $345 | $351 | $352 | $352 | ($20) | (5.4%) | (1.4%) |
| Dept. of Cultural Affairs | $188 | $147 | $145 | $145 | $145 | ($44) | (23.2%) | (6.4%) |
| Financial Info. Serv. Agency | $106 | $113 | $115 | $112 | $112 | $6 | 6.0% | 1.5% |
| Office of Payroll Admin. | $17 | $17 | $17 | $17 | $17 | $0 | 2.5% | 0.6% |
| Independent Budget Office | $6 | $5 | $6 | $5 | $5 | ($0) | (5.8%) | (1.5%) |
| Equal Employment Practices | $1 | $1 | $1 | $1 | $1 | $0 | 7.2% | 1.8% |
Table A2 (Con’t). April 2018 Financial Plan Expenditure Detail
($ in millions)
| FY 2018 | FY 2019 | FY 2020 | FY 2021 | FY 2022 | Change FYs 2018 – 2022 Dollars Percent |
Annual Percent Change | |||
| Civil Service Commission | $1 | $1 | $1 | $1 | $1 | $0 | 10.4% | 2.5% | |
| Landmarks Preservation Commission | $6 | $7 | $7 | $7 | $7 | $0 | 6.3% | 1.5% | |
| Taxi & Limousine Commission | $49 | $52 | $60 | $60 | $52 | $2 | 4.3% | 1.0% | |
| Commission on Human Rights | $15 | $13 | $13 | $13 | $13 | ($1) | (9.9%) | (2.6%) | |
| Youth & Community Development | $673 | $552 | $539 | $542 | $542 | ($131) | (19.5%) | (5.3%) | |
| Conflicts of Interest Board | $3 | $3 | $3 | $3 | $3 | $0 | 0.0% | 0.0% | |
| Office of Collective Bargaining | $2 | $2 | $2 | $2 | $2 | ($0) | (5.5%) | (1.4%) | |
| Community Boards (All) | $18 | $18 | $18 | $18 | $18 | ($0) | (2.5%) | (0.6%) | |
| Dept. of Probation | $96 | $113 | $111 | $111 | $111 | $15 | 15.8% | 3.7% | |
| Dept. Small Business Services | $294 | $255 | $171 | $156 | $135 | ($159) | (53.9%) | (17.6%) | |
| Housing Preservation & Development | $1,350 | $922 | $831 | $815 | $825 | ($525) | (38.9%) | (11.6%) | |
| Dept. of Buildings | $168 | $203 | $190 | $179 | $179 | $11 | 6.8% | 1.7% | |
| Dept. of Health & Mental Hygiene | $1,718 | $1,611 | $1,643 | $1,644 | $1,644 | ($74) | (4.3%) | (1.1%) | |
| NYC Health + Hospitals | $844 | $828 | $930 | $831 | $831 | ($13) | (1.5%) | (0.4%) | |
| Office of Administrative Trials & Hearings | $46 | $50 | $51 | $51 | $51 | $5 | 9.9% | 2.4% | |
| Dept. of Environmental Protection | $1,480 | $1,385 | $1,294 | $1,277 | $1,256 | ($224) | (15.2%) | (4.0%) | |
| Dept. of Sanitation | $1,730 | $1,721 | $1,746 | $1,748 | $1,750 | $19 | 1.1% | 0.3% | |
| Business Integrity Commission | $9 | $9 | $9 | $9 | $9 | ($0) | (3.7%) | (0.9%) | |
| Dept. of Finance | $294 | $299 | $302 | $300 | $300 | $6 | 1.9% | 0.5% | |
| Dept. of Transportation | $994 | $1,039 | $995 | $986 | $987 | ($7) | (0.7%) | (0.2%) | |
| Dept. of Parks and Recreation | $519 | $454 | $454 | $452 | $453 | ($66) | (12.8%) | (3.4%) | |
| Dept. of Design & Construction | $501 | $160 | $162 | $149 | $149 | ($351) | (70.2%) | (26.1%) | |
| Dept. of Citywide Admin. Services | $484 | $452 | $440 | $439 | $438 | ($45) | (9.3%) | (2.4%) | |
| D.O.I.T.T. | $591 | $515 | $527 | $567 | $564 | ($27) | (4.6%) | (1.2%) | |
| Dept. of Record & Info. Services | $8 | $10 | $11 | $11 | $11 | $3 | 33.7% | 7.5% | |
| Dept. of Consumer Affairs | $40 | $41 | $40 | $40 | $40 | ($0) | (0.1%) | (0.0%) | |
| District Attorney – N.Y. | $124 | $104 | $104 | $104 | $104 | ($20) | (16.0%) | (4.3%) | |
| District Attorney – Bronx | $75 | $74 | $74 | $74 | $74 | ($0) | (0.3%) | (0.1%) | |
| District Attorney – Kings | $101 | $101 | $101 | $101 | $101 | $0 | 0.4% | 0.1% | |
| District Attorney –Queens | $66 | $64 | $64 | $64 | $64 | ($2) | (2.9%) | (0.7%) | |
| District Attorney – Richmond | $15 | $15 | $15 | $15 | $15 | ($1) | (4.1%) | (1.0%) | |
| Office of Prosec. & Special Narc. | $22 | $23 | $23 | $23 | $23 | $0 | 1.1% | 0.3% | |
| Public Administrator – N.Y. | $3 | $3 | $3 | $3 | $3 | $0 | 1.9% | 0.5% | |
| Public Administrator – Bronx | $1 | $1 | $1 | $1 | $1 | ($0) | (2.9%) | (0.7%) | |
| Public Administrator – Brooklyn | $1 | $1 | $1 | $1 | $1 | $0 | 0.5% | 0.1% | |
| Public Administrator – Queens | $1 | $1 | $1 | $1 | $1 | $0 | 1.9% | 0.5% | |
| Public Administrator – Richmond | $1 | $1 | $1 | $1 | $1 | $0 | 2.1% | 0.5% | |
| Prior Payable Adjustment | ($400) | $0 | $0 | $0 | $0 | $400 | (100.0%) | (100.0%) | |
| General Reserve | $50 | $1,000 | $1,000 | $1,000 | $1,000 | $950 | 1900.0% | 111.5% | |
| Citywide Savings Initiatives | $0 | $0 | ($43) | ($65) | ($74) | ($74) | NA | NA | |
| Energy Adjustment | $0 | $0 | $17 | $46 | $67 | $67 | NA | NA | |
| Lease Adjustment | $0 | $0 | $36 | $72 | $110 | $110 | NA | NA | |
| OTPS Inflation Adjustment | $0 | $0 | $111 | $167 | $222 | $222 | NA | NA | |
| TOTAL EXPENDITURES | $88,670 | $89,063 | $94,548 | $96,935 | $98,505 | $9,835 | 11.1% | 2.7% | |
Note: Numbers may not add due to rounding.
Endnotes
[1] https://labor.ny.gov/workerprotection/laborstandards/workprot/minwage.shtm
[2] https://comptroller.nyc.gov/reports/new-york-city-quarterly-economic-update/
[3] In FY 2016, the State began to intercept the City’s sale tax revenues to recoup savings associated with the Sales Tax Asset Receivable Corporation (STARC) bonds refinancing, from which the City generated $650 million in savings. The State intercepted $50 million in FY 2016, $200 million in FY 2017, and is expected to collect another $200 million in FY 2018 and $150 million in FY 2019. The City’s April Plan recognizes the remaining $150 million payment in FY 2019.
[4] In addition to the $140 million increase, the enacted State budget resulted in additional City-funds spending of $77 million in ACS for a total increase of $217 million in City-funds spending in the agency. The phase in of the implementation of the State raise the age law in ACS will require an additional $46.4 million City-funds support. The withdrawal of State funding for the Close to Home initiative results in another $30.5 million in City-funds spending in the agency.
[5] The City’s Citywide Savings Program list 145 initiatives added in the April Plan. However, seven of these initiatives are related to the elimination of vacant positions for which accrual savings had been recognized in prior savings plan. As such, there are no savings associated with the elimination of these position in the current Plan.
[6] The City’s categorization of efficiency initiatives include some initiatives that are categorized under funding shift, re-estimate, and new revenues in our categorization. Thus, under OMB’s accounting, efficiencies in FY 2018 and FY 2019 total more than $380 million.
[7] If not specifically indicated otherwise, throughout this section property tax revenues include the School Tax Relief (STAR) reimbursement.
[8] The Repatriation of Non-Qualified Deferred Compensation was enacted as part of the Emergency Economic Stabilization Act of 2008 and allowed certain taxpayers to defer income and taxes until December 31, 2017. Among the primary beneficiaries of this provision were employees and principals at hedge funds. The Transition Tax on Foreign Earnings was enacted as part of the TCJA and similarly requires taxpayers with foreign business income to pay taxes as of December 31, 2017.
[9] https://tax.ny.gov/pdf/notices/n18_4.pdf
[10] Miscellaneous revenue analysis excludes private grants and intra-City revenues.
[11] Source: Comprehensive Annual Financial Report of the Comptroller for the Fiscal Year Ended June 30, 2017.
[12] Includes the transfer of custodial pension contributions of $5 million in FY 2019 and $6 million in each of the outyears, from the pension budget to DOE.
[13] Bolton’s reports are available on the Comptroller’s website: http://comptroller.nyc.gov/reports/policy-n-other
[14] This amount was included in the reserve in the 2018 February Financial Plan for this cost.
[15] Carter cases represent payments that the Department makes to parents legally seeking reimbursement for placing their special needs children in non-public schools.
[16] Tax Equivalency Payments (TEP) are made by the City under the terms of the Support and Development Agreement for Hudson Yards Development that obligates the City to pay to HYIC, subject to annual appropriation, the amount of real property taxes collected by the City on new development (including substantial rehabilitation of existing buildings) in the development area.
[17] After netting out the reserve for unattained commitments, the increase in all-funds commitments drops to $808 million.
[18] DEP capital commitments are primarily funded through the issuance of NY Water Finance Authority debt.