Comments on New York City’s Fiscal Year 2020 Executive Budget
Executive Summary
The Mayor’s FY 2020 Executive Budget is $92.47 billion, an increase of $258 million from the February Preliminary Budget. City funds comprise $68.25 billion, up $340 million from the Preliminary Budget. Adjusted for prepayments and reserves, the FY 2020 budget is less than 1 percent larger than the FY 2019 modified budget.
After a relatively gloomy start to the year, the short-term economic outlook has brightened as risk factors have softened. Economic growth is expected to continue in both the U.S. and New York City in 2019 and for the remainder of the plan period, albeit at a slower pace than in 2018. In our forecast, New York City’s economy is expected to grow at a slightly faster pace than the nation as a whole. The biggest risk to continued economic growth currently is the continuing impasse in trade negotiations with China and the imposition of further tariffs.
Since the Mayor’s Preliminary FY 2020 Budget in February, the City has projected an additional $1.13 billion in resources in Fiscal Year 2019, including $618 million in revenues, $264 million in expense budget savings, and a further draw down of $250 million from the General Reserve. These resources were used to fund $785 million in new spending in FY 2019, and an addition of $347 million to the Budget Stabilization Account (BSA), bringing it to $3.52 billion. The FY 2019 surplus will be used to prepay a portion of FY 2020 debt service.
The Executive Budget for the first time included what the Mayor referred to as a Program to Eliminate the Gap, or PEG, which totaled $916 million over FY 2019 and FY 2020, which together with the two prior rounds of Citywide Savings Program brings total combined savings for the two years to $2.55 billion. The Executive PEG does not differ significantly from prior rounds of the Citywide Savings Program, with debt service, re-estimates, and funding shifts accounting for the bulk of the savings.
The PEG is insufficient to pay for new spending needs in FY 2019 and FY 2020, which includes $369 million to offset the impact of measures in the enacted State budget, and another $1.4 billion in other new needs. A substantial share of the headcount reductions associated with the hiring freeze and other savings actions are offset by new needs, resulting in net headcount reduction of 121 positions in FY 2020 compared to the February Plan.
As of the Executive Budget, the BSA remains nearly $1.1 billion below the final FY 2018 surplus. Additional tax revenues, which we project will come in $679 million above the City’s estimate, should help bring the BSA closer to last year’s figure. The Comptroller’s forecast for tax revenues over the plan period are consistently higher in every major tax source, most notably the real property tax, yielding additional revenues of nearly $1 billion in FY 2020, rising to just below $1.8 billion in FY 2023.
Higher revenues in our projection are partially offset by expenditure risks, notably for overtime, charter school tuition, and the absence of baseline funding for the Fair Fares program. Taken together, our tax forecast and analysis of expenditure risks yields modest additional surpluses in FY 2019 and 2020, and smaller gaps in fiscal years 2021 through 2023.
The City’s Ten-Year Capital Strategy, released with the Executive Budget, totals $116.9 billion, a 12.3 percent increase from the Preliminary Ten-Year Capital Strategy published in February. The increase included $8.0 billion for construction of borough-based jails to replace Rikers Island, for a total of $8.75 billion. Over half the total ($59.72 billion) is allocated to maintaining state of good repair in schools, other public buildings, roads and bridges, housing, parks, and other community facilities, with the balance divided between programmatic replacement ($29.67 billion) and program expansion ($27.5 billion). Borrowing to finance the capital program is expected to push debt service to 13.1 percent of tax revenues by FY2023, compared to 10.3 percent in FY 2018 (adjusted for debt service prepayments). This is still below the 15% threshold that is commonly used as a benchmark for affordability.
Table 1. FY 2019 – FY 2023 Financial Plan
| ($ in millions) | FY 2019 | FY 2020 | FY 2021 | FY 2022 | FY 2023 | Change FYs 2019 –2023 Dollar Percent |
|
| Revenues | |||||||
| Taxes: | |||||||
| General Property Tax | $27,976 | $29,711 | $31,089 | $32,328 | $33,286 | $5,310 | 19.0% |
| Other Taxes | 31,849 | 32,415 | 33,211 | 34,180 | 35,113 | 3,264 | 10.2% |
| Tax Audit Revenues | 1,058 | 999 | 721 | 721 | 721 | (337) | (31.9%) |
| Subtotal: Taxes | $60,883 | $63,125 | $65,021 | $67,229 | $69,120 | $8,237 | 13.5% |
| Miscellaneous Revenues | 8,065 | 6,955 | 6,911 | 6,884 | 6,879 | (1,186) | (14.7%) |
| Unrestricted Intergovernmental Aid | 201 | 0 | 0 | 0 | 0 | (201) | (100.0%) |
| Less: Intra-City Revenues | (2,220) | (1,819) | (1,817) | (1,815) | (1,814) | 406 | (18.3%) |
| Disallowances Against Categorical Grants | 91 | (15) | (15) | (15) | (15) | (106) | (116.5%) |
| Subtotal: City-Funds | $67,020 | $68,246 | $70,100 | $72,283 | $74,170 | $7,150 | 10.7% |
| Other Categorical Grants | 1,207 | 928 | 870 | 863 | 863 | (344) | (28.5%) |
| Inter-Fund Revenues | 657 | 735 | 672 | 672 | 672 | 15 | 2.3% |
| Federal Categorical Grants | 8,494 | 7,226 | 7,069 | 6,998 | 6,966 | (1,528) | (18.0%) |
| State Categorical Grants | 15,473 | 15,333 | 15,719 | 16,186 | 16,693 | 1,220 | 7.9% |
| Total Revenues | $92,851 | $92,468 | $94,430 | $97,002 | $99,364 | $6,513 | 7.0% |
| Expenditures | |||||||
| Personal Service | |||||||
| Salaries and Wages | $29,051 | $29,978 | $30,905 | $30,757 | $31,645 | $2,594 | 8.9% |
| Pensions | 9,936 | 9,951 | 10,118 | 10,564 | 10,620 | 684 | 6.9% |
| Fringe Benefits | 10,642 | 11,394 | 11,853 | 12,527 | 13,228 | 2,586 | 24.3% |
| Subtotal-PS | $49,629 | $51,323 | $52,876 | $53,848 | $55,493 | $5,864 | 11.8% |
| Other Than Personal Service | |||||||
| Medical Assistance | $5,915 | $5,915 | $5,915 | $5,915 | $5,915 | $0 | 0.0% |
| Public Assistance | 1,595 | 1,651 | 1,651 | 1,651 | 1,650 | 55 | 3.4% |
| All Other | 32,312 | 30,426 | 30,411 | 30,718 | 30,958 | (1,354) | (4.2%) |
| Subtotal-OTPS | $39,822 | $37,992 | $37,977 | $38,284 | $38,523 | ($1,299) | (3.3%) |
| Debt Service | |||||||
| Principal | $3,411 | $3,613 | $3,726 | $3,859 | $3,967 | $556 | 16.3% |
| Interest & Offsets | 3,219 | 3,625 | 3,899 | 4,456 | 5,103 | 1,884 | 58.5% |
| Subtotal Debt Service | $6,630 | $7,238 | $7,625 | $8,315 | $9,070 | $2,440 | 36.8% |
| FY 2018 BSA and Discretionary Transfers | (4,576) | 0 | 0 | 0 | 0 | 4,576 | (100.0%) |
| FY 2019 BSA | 3,516 | (3,516) | 0 | 0 | 0 | (3,516) | (100.0%) |
| Capital Stabilization Reserve | 0 | 250 | 250 | 250 | 250 | 250 | NA |
| General Reserve | 50 | 1,000 | 1,000 | 1,000 | 1,000 | 950 | 1,900.0% |
| Subtotal | $95,071 | $94,287 | $99,728 | $101,697 | $104,336 | $9,265 | 9.7% |
| Less: Intra-City Expenses | (2,220) | (1,819) | (1,817) | (1,815) | (1,814) | 406 | (18.3%) |
| Total Expenditures | $92,851 | $92,468 | $97,911 | $99,882 | $102,522 | $9,671 | 10.4% |
| Gap To Be Closed | $0 | $0 | ($3,481) | ($2,880) | ($3,158) | ($3,158) | NA |
Note: Numbers may not add to totals due to rounding.
Table 2. Plan-to-Plan Changes April 2019 Plan vs. February 2019 Plan
($ in millions) |
FY 2019 | FY 2020 | FY 2021 | FY 2022 | FY 2023 |
| Revenues | |||||
| Taxes: | |||||
| General Property Tax | ($70) | $0 | $0 | $0 | $0 |
| Other Taxes | 271 | 208 | 253 | 299 | 225 |
| Tax Audit Revenues | 1 | 1 | 0 | 0 | 0 |
| Subtotal: Taxes | $202 | $209 | $253 | $299 | $225 |
| Miscellaneous Revenues | 432 | 156 | 139 | 137 | 144 |
| Unrestricted Intergovernmental Aid | 50 | 0 | 0 | 0 | 0 |
| Less: Intra-City Revenues | (66) | (25) | (21) | (21) | (22) |
| Disallowances Against Categorical Grants | 0 | 0 | 0 | 0 | 0 |
| Subtotal: City-Funds | $618 | $340 | $371 | $415 | $347 |
| Other Categorical Grants | 9 | 2 | 2 | 1 | 1 |
| Inter-Fund Revenues | (33) | 74 | 10 | 11 | 11 |
| Federal Categorical Grants | 23 | (101) | (136) | (135) | (154) |
| State Categorical Grants | 215 | (57) | (118) | (119) | 340 |
| Total Revenues | $832 | $258 | $129 | $173 | $545 |
| Expenditures | |||||
| Personal Service | |||||
| Salaries and Wages | $35 | ($262) | ($353) | ($358) | $3 |
| Pensions | 86 | 0 | (300) | (300) | (450) |
| Fringe Benefits | (1) | (142) | (175) | (178) | (157) |
| Subtotal-PS | $120 | ($404) | ($828) | ($836) | ($604) |
| Other Than Personal Service | |||||
| Medical Assistance | $0 | $0 | $0 | $0 | $0 |
| Public Assistance | 0 | 34 | 34 | 34 | 33 |
| All Other | 788 | 1,107 | 942 | 959 | 1,016 |
| Subtotal-OTPS | $788 | $1,141 | $976 | $993 | $1,049 |
| Debt Service | |||||
| Principal | $0 | ($24) | $7 | $10 | $9 |
| Interest & Offsets | (107) | (83) | (40) | (32) | (25) |
| Subtotal Debt Service | ($107) | ($107) | ($33) | ($22) | ($16) |
| FY 2018 BSA and Discretionary Transfers | 0 | 0 | 0 | 0 | 0 |
| FY 2019 BSA | 347 | (347) | 0 | 0 | 0 |
| Capital Stabilization Reserve | 0 | 0 | 0 | 0 | 0 |
| General Reserve | (250) | 0 | 0 | 0 | 0 |
| Subtotal | $898 | $283 | $115 | $135 | $429 |
| Less: Intra-City Expenses | (66) | (25) | (21) | (21) | (22) |
| Total Expenditures | $832 | $258 | $94 | $114 | $407 |
| Gap To Be Closed | $0 | $0 | $35 | $59 | $138 |
Note: Numbers may not add to totals due to rounding.
Table 3. Plan-to-Plan Changes April 2019 Plan vs. June 2018 Plan
| ($ in millions) | FY 2019 | FY 2020 | FY 2021 | FY 2022 |
| Revenues | ||||
| Taxes: | ||||
| General Property Tax | $2 | $234 | $198 | $448 |
| Other Taxes | 803 | 264 | 61 | 286 |
| Tax Audit Revenues | 2 | 278 | 0 | 0 |
| Subtotal: Taxes | $807 | $776 | $259 | $734 |
| Miscellaneous Revenues | 1,273 | 224 | 174 | 168 |
| Unrestricted Intergovernmental Aid | 201 | 0 | 0 | 0 |
| Less: Intra-City Revenues | (395) | (48) | (41) | (39) |
| Disallowances Against Categorical Grants | 106 | 0 | 0 | 0 |
| Subtotal: City-Funds | $1,992 | $952 | $392 | $863 |
| Other Categorical Grants | 327 | 56 | 3 | 2 |
| Inter-Fund Revenues | (25) | 94 | 34 | 34 |
| Federal Categorical Grants | 902 | 97 | (39) | (94) |
| State Categorical Grants | 497 | 31 | (44) | (60) |
| Total Revenues | $3,693 | $1,230 | $346 | $745 |
| Expenditures | ||||
| Personal Service | ||||
| Salaries and Wages | $305 | $358 | $537 | $688 |
| Pensions | 84 | 48 | (44) | 197 |
| Fringe Benefits | (95) | (249) | (561) | (567) |
| Subtotal-PS | $294 | $157 | ($68) | $318 |
| Other Than Personal Service | $0 | $0 | $0 | $0 |
| Medical Assistance | 0 | 0 | 0 | 0 |
| Public Assistance | (10) | 34 | 34 | 34 |
| All Other | 1,970 | 1,578 | 1,244 | 1,272 |
| Subtotal-OTPS | $1,960 | $1,612 | $1,278 | $1,306 |
| Debt Service | ||||
| Principal | ($18) | ($23) | $94 | $98 |
| Interest & Offsets | (339) | (212) | (325) | (343) |
| Subtotal Debt Service | ($357) | ($235) | ($231) | ($245) |
| FY 2018 BSA and Discretionary Transfers | $0 | $0 | $0 | $0 |
| FY 2019 BSA | $3,516 | ($3,516) | $0 | $0 |
| Capital Stabilization Reserve | ($250) | $0 | $0 | $0 |
| General Reserve | ($1,075) | $0 | $0 | $0 |
| Subtotal | $4,088 | ($1,982) | $980 | $1,379 |
| Less: Intra-City Expenses | (395) | (48) | (41) | (39) |
| Total Expenditures | $3,693 | ($2,030) | $939 | $1,340 |
| Gap To Be Closed | $0 | $3,260 | ($593) | ($595) |
Note: Numbers may not add to totals due to rounding.
Table 4. Risks and Offsets to the April 2019 Financial Plan
($ in millions, positive numbers decrease the gap and negative numbers increase the gap)
| FY 2019 | FY 2020 | FY 2021 | FY 2022 | FY 2023 | |
| City Stated Gap | $0 | $0 | ($3,481) | ($2,880) | ($3,158) |
| Tax Revenues | |||||
| Property Tax | $0 | $200 | $387 | $735 | $1,085 |
| Personal Income Tax | 496 | 385 | 387 | 335 | 237 |
| Business Taxes | 87 | 95 | 128 | 119 | 114 |
| Sales Tax | 65 | 114 | 103 | 34 | (35) |
| Real Estate Transaction Taxes | 31 | 202 | 321 | 299 | 241 |
| Audit | 0 | 0 | 154 | 154 | 154 |
| Subtotal Tax Revenues | $679 | $996 | $1,480 | $1,676 | $1,796 |
| Non-Tax Revenues | |||||
| ECB Fines | $0 | $10 | $10 | $15 | $15 |
| Late Filing/No Permit Penalties | 0 | 0 | 5 | 5 | 5 |
| Other Fines | 0 | 3 | 3 | 3 | 3 |
| Subtotal Non-Tax Revenues | $0 | $13 | $18 | $23 | $23 |
| Total Revenues | $679 | $1,009 | $1,498 | $1,699 | $1,819 |
| Expenditures | |||||
| Overtime | ($195) | ($140) | ($150) | ($150) | ($150) |
| Charter School Tuition | 0 | (0) | (117) | (250) | (399) |
| Fair Fares | 65 | (106) | (212) | (212) | (212) |
| Homeless Shelters | 0 | (20) | (20) | (20) | (20) |
| DOE Medicaid Reimbursement | 0 | (20) | (20) | (20) | (20) |
| VRDB Interest Savings | 30 | 0 | 0 | 0 | 0 |
| General Reserve | 50 | 0 | 0 | 0 | 0 |
| Subtotal | ($50) | ($286) | ($519) | ($652) | ($801) |
| Total (Risks)/Offsets | $629 | $723 | $979 | $1,047 | $1,018 |
| Restated (Gap)/Surplus | $629 | $723 | ($2,502) | ($1,833) | ($2,140) |
Note: Numbers may not add to totals due to rounding.
The City’s Economy Outlook
Comptroller’s Economic Forecast, 2019-2023
After a relatively gloomy start to the year, the short-term economic outlook has brightened as risk factors have softened. Economic growth is expected to continue in both the U.S. and New York City in 2019 and for the remainder of the plan period, albeit at a slower pace than in 2018. This growth comes as a result of strong employment demand, increasing wages, and monetary policy accommodative to economic growth. Growth is expected to slow as the economic cycle matures, although the risks of recession during the financial plan period have declined – if not to zero, at least compared to the picture in the beginning of the year, when various risks – trade disruptions, more restrictive monetary policy, and other factors – weighed on projections.
In our forecast, New York City’s economy is expected to grow at a slightly faster pace than the nation as a whole. Continued strength in the labor market and rising wages will fuel consumer spending.
Table 5. Selected Economic Indicators Comptroller’s and Mayor’s Forecasts
| 2019 | 2020 | 2021 | 2022 | 2023 | ||
| Selected US Economic Indicators (Annual Averages) | ||||||
| Real GDP (2009 $, % Change) | Comptroller
Mayor |
2.6
2.4 |
1.9
2.1 |
1.6
1.8 |
1.3
1.7 |
1.5
1.6 |
| Payroll Jobs (Change In Millions) | Comptroller
Mayor |
2.0
1.7 |
1.3
1.0 |
1.2
0.5 |
0.6
0.5 |
0.4
0.4 |
| Fed Funds Rate (Percent) | Comptroller
Mayor |
2.4
2.5 |
2.4
2.8 |
2.3
2.9 |
2.3
2.9 |
2.3
2.8 |
| Selected NYC Economic Indicators (Annual Averages) | ||||||
| Real GCP (2009 $, % Change) | Comptroller
Mayor |
2.8
3.0 |
2.1
1.7 |
1.9
1.1 |
1.5
0.9 |
1.2
0.4 |
| Payroll Jobs (Change In Thousands) | Comptroller
Mayor |
69.6
68.9 |
51.5
66.1 |
46.3
53.3 |
28.0
51.3 |
26.6
47.1 |
| Wage-Rate Growth (Percent) | Comptroller
Mayor |
3.6
3.0 |
2.7
2.6 |
2.5
2.5 |
1.8
2.6 |
1.7
2.2 |
Note: Comptroller=forecast by the NYC Comptroller’s Office. GCP=Gross City Product. Mayor= forecast by the NYC Office of Management and Budget in the Executive Budget Fiscal Year 2019 Message of the Mayor. NA=not available.
Factors Affecting the Forecast
The National Economy
The U.S. economy, as measured by real GDP, grew 3.2 percent in the first quarter of 2019 after growing 2.2 percent in the fourth quarter of 2018. This growth was driven primarily by a decline in imports, an increase in private investment (mostly in inventories), consumer spending, and government expenditure.
A strong labor market, modestly increasing wages, the low likelihood of an interest rate hike by the Federal Reserve, and the short term boost from the Tax Cuts and Jobs Act of 2017 (TCJA) suggests that economic growth will continue. As the unemployment rate falls and the labor force tightens, the Comptroller is forecasting growth at a slower pace than the 2.9 percent growth in 2018. If expansionary fiscal policy creates higher budget deficits and ultimately higher long-term interest rates, the growth will taper off. We are projecting economic growth will begin to taper off in the later years of the Financial Plan period but fall short of an actual recession.
Net exports contributed the most to GDP growth in the first quarter of 2019, 1.03 percentage points (pp), mainly because of a 3.7 percent decline in imports. The decline in imports can be attributed to the imposition of tariffs. At the same time, U.S. exports increased despite fears of retaliatory tariffs by our trading partners, as well as an improvement in the economies of our trading partners in the first quarter. The strengthening U.S. dollar as a result of higher U.S. interest rates than in other large nations, however, could ultimately be a drag on future U.S. exports.
Private investment rose 5.1 percent and contributed 0.92 pp to GDP growth in the first quarter. The bulk of this rise was a change in private inventories which was responsible for 0.65 pp of GDP growth. Inventories may grow either because producers expect final demand to grow, which would sustain and extend growth, or because producers produced more goods than the market can absorb, which could result in a slowdown in future production as inventories are absorbed. Time will tell which market condition is being signaled by this component of GDP.
The surprise in the latest GDP report was the weakness in consumer spending, which grew only 1.2 percent and contributed 0.82 pp to the GDP growth. Three indicators, however – continuing job growth, rising wages, and lower tax rates – lead us to expect that this sector is poised to contribute more toward growth throughout 2019. With American household balance sheets strong and debt burdens generally manageable, consumer spending should return to help keep the expansion going.
Government expenditures rose 2.4 percent mainly because of defense spending, which grew 4.1 percent. Non-defense federal spending continued its decline, falling 5.9 percent after declining 6.1 percent in the fourth quarter of 2018. State and local government expenditures rose 3.9 percent in first-quarter 2019 after falling 1.3 percent in fourth-quarter 2018.
Wages, as measured by average hourly earnings, rose 3.3 percent in the first quarter of 2019, the highest first quarter increase since 2009. Jobs in the U.S. grew at a seasonally adjusted annual rate of 1.7 percent for the second consecutive quarter in the first quarter of 2019. The unemployment rate rose slightly to 3.9 percent in the first quarter of 2019 from 3.8 percent in the previous quarter. In the latest release, the unemployment rate for April has dropped to a 50 year low at 3.6 percent.
Despite continuing robust job growth and rising wages, inflation remains below the Federal Reserve’s policy target of 2 percent. The Fed’s preferred measure, the personal consumption expenditure deflator, was 0.6 percent in the first quarter of 2019, the lowest rate in three years.
Recent reports of rising labor productivity are positive news for the inflation outlook The Federal Reserve Open Market Committee has decided to keep the Fed Funds rate unchanged in 2019. Fears of an inverted yield curve as a harbinger of recession are overblown.
On the global front, according to the IMF, global economic growth is expected to continue but at slower pace – down from 3.6 percent in 2018 to 3.3 percent in 2019.[1]
Low probability risks to the economy in the short-run include a curtailment in consumer demand as a result of excess debt fueled by years of cheap money; a commencement of a trade war with Europe; and a drop in the dollar precipitated by the Federal Reserve losing credibility as independent of the Federal government. In the longer term, the risk that the TCJA could result in a higher spending deficit without the promised higher growth is a threat for the outyears.
A higher probability risk would include a continuing impasse in trade negotiations with China and the imposition of further tariffs. Although the U.S. economy’s exposure to trade with China is limited, a prolonged confrontation could ultimately turn into a more significant drag on the economy.
While the economy is expected to grow for the duration of this budget plan, the pace of growth is expected to be less than it was in 2018. In general, the Comptroller’s Office outlook for the US economy is slightly more optimistic than that of OMB for 2019, and slightly more pessimistic in 2020 through 2023. We expect the economy to slow in 2022, but start accelerating in 2023.
The New York City Economy
The City’s economy continued to grow strongly in the first quarter of 2019 and it is expected to continue to do so for the remainder of the year. The City’s relatively strong economic fundamentals and the national fiscal stimulus, especially corporate tax cuts enacted in December of 2017, should fuel the City’s economic growth over the planning horizon.
The City’s economy grew 3.0 percent in the first quarter of 2019, less than the 3.2 percent in the nation and the 3.5 percent in the previous quarter. Private-sector job growth slowed, adding 19,200 jobs, or 1.9 percent in the first quarter of 2019, about three-quarters of the 26,200 jobs created in the fourth quarter of 2018. This is comparable to the nation where private sector jobs grew 1.9 percent in the first quarter of 2019, slower than the 2.1 percent in the fourth quarter of 2018 (Chart 1).
Chart 1. Jobs Growth (SAAR) in NYC and the Nation First-Quarter 2019
over Fourth-Quarter 2018
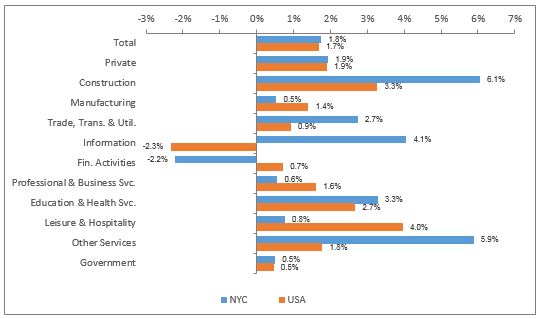
Source: U.S. Bureau of Labor Statistics and NYS Department of Labor.
A softer job market led to a slightly higher unemployment rate. NYC’s unemployment rate, adjusted for seasonality, rose to 4.2 percent in first-quarter 2019 from 4.0 percent in the fourth quarter of 2018. The rise in the City’s unemployment rate was due to an increase in the number of unemployed and a decrease in the City’s labor force. The number of unemployed City residents increased for the second consecutive quarter, increasing by 8,800 in first-quarter 2019. The City’s labor force declined by 1,100 in the first quarter of 2019, although the City’s labor force participation rate remained unchanged from the last quarter’s record high of 60.9 percent.
The number of employed City residents fell by 9,900 in first-quarter 2019. As a result, the City’s employment-to-population ratio fell slightly to 58.3 percent in first-quarter 2019 from 58.4 percent in the previous quarter.
Average hourly earnings (AHE) of all private NYC employees, a component of personal income, rose 4.4 percent on a year-over-year basis to $37.42 in the first quarter of 2019, the highest first-quarter increase since a 9.1 percent rise in 2008. This coincides with an increase in the minimum wage to $15 per hour in 2018 for employers with more than ten employees and an increase to $13.50 for employers with ten or fewer employees, which amounts to a 15.4 percent and a 12.5 percent raise, respectively.[2]
A relatively strong labor market, an increase in earnings, and a strong national economy are expected to lift consumer spending in the City. We also expect that any increase in private investment in the nation will flow through to New York City given that the City is still the nation’s leading financial center. As such, fiscal and monetary policies impacting the financial sector directly impact the City’s economy. This is evident in first-quarter 2019 banks’ earnings report, which most likely helped the City’s first-quarter 2019 economic growth. America’s six largest banks – four of which are headquarter in the City – reported record profits and attributed it to the lower corporate income tax rate.[3]. Net income after taxes rose to a record high of $31.8 billion in the first quarter of 2019, 2.8 percent higher than a year ago. Wall Street profits, as measured by the pre-tax net income of the NYSE member firms, rose 11.3 percent to $27.3 billion in 2018, the highest level since 2010. In addition to lower taxes, banks’ profits could further have increased due to deregulation.[4] Both bank earnings and Wall Street profits are expected to continue increasing in 2019.
Wall Street bonuses play an outsized role in the City’s wages and salaries and personal income. Wall Street bonuses decreased 14.3 percent to $27.5 billion in 2018 from $32.1 billion in 2017 according to the NYS Comptroller.[5] This implies a reduction in the average cash bonus from about $184,000 in 2017 to about $154,000 in 2018, but it still was double the average annual salary in the City’s workforce.[6] Bonuses are expected to bounce back in 2019.
The strong business environment is also reflected in venture capital investment. According to PwC Money Tree, venture capital investment in the New York metro area rose 64.9 percent on a year-over-year basis to $4.5 billion in the first quarter of 2019, its highest first-quarter level on record.[7]
Finally, the City’s latest leading economic indicators signal continued positive growth. A survey of business conditions among firms in the New York City area is provided by ISM-New York, Inc. Both the current business condition index (which measures the current state of the economy from the perspective of business procurement professionals) and the ISM six-month outlook (which measures where procurement professionals expect the economy to be in six months) were above 50 percent, indicating the expectation of continued expansion. Also, the NY-BCI (which measures the cumulative change in business activity) rose to a record high of 861.6 in the first quarter of 2019 from 840.4 in the fourth quarter of 2018. According to the NYS Department of Labor, initial unemployment claims, which shows the number of applicants for unemployment insurance, declined for the fifth consecutive quarter to its lowest first quarter level on record in the first quarter of 2019. Also, according to the U.S. Department of Housing and Urban Development, the total number of building permits in the City surged 22.4 percent from a year ago to 6,329, the highest first-quarter level since 2007.
The FY 2020 Executive Budget
Overview: Changes to FY 2019 and FY 2020
FY 2019 Budget
The FY 2019 Budget in the April Plan totals $92.85 billion, an increase of $832 million from the February Plan, driven primarily by increases in the City-funds and State-funds portion of the budget.[8] The State-funds portion of the budget has increase by $215 million, of which $56 million are reimbursements for prior-year claims for which there are no corresponding receivables. As such, these grants will be used to offset City-funds expenditures, $42 million of which are credited as savings in the current round of the Citywide Savings Program (CSP). Of the remaining $159 million increase, $74 million is due to an upward revision to the State early intervention service grant, a nearly 70 percent increase.
About a third of the increase to City-funds revenues are due to revisions to the tax revenue forecast, as shown in Table 6, driven primarily by an increase of $284 million in personal income tax (PIT) revenues. Tax revenues are discussed in greater detail in “Tax Revenues” beginning on page 18. Upward revisions to non-tax revenues account for another $261 million of the increase to City-funds revenues of which more than half is due to the City’s $142 million share of restitution from Standard Chartered Bank’s settlement for processing transactions in violation of Iranian sanctions. Revenue initiatives in the current round of the CSP account for the remaining $156 million increase in City-funds revenue. The revenues ranged across various agencies and revenue categories including a $35 million surplus transfer from the Education Construction Fund to the Department of Education (DOE), $12 million in additional parking meter revenues in the Department of Finance from the 2018 implementation of a citywide parking meter rate increase, and $50 million in Federal Emergency Management Agency (FEMA) reimbursements for prior year costs.
Table 6. Changes to FY 2019 City-Funds Estimates from the Preliminary Budget
($ in millions)
| revenues | expenditures | ||
| Property Tax Revenues | ($70) | Agency Expenses | $682 |
| Personal Income Tax Revenues | 284 | Miscellaneous Budget | 13 |
| Business Tax Revenues | 19 | Pensions | 86 |
| Sales Tax | 18 | General Reserve | (250) |
| Real Estate Transaction Tax | (54) | Collective Bargaining Adjustment | 4 |
| All Other Taxes | 4 | Citywide Savings Program | (264) |
| Subtotal | $201 | Subtotal | $271 |
| Non-Tax Revenues | 261 | BSA | |
| City Savings Program | 156 | 347 | |
| Total | $618 | Total | $618 |
City-funds agency expenditures are almost $700 million higher than estimated in the February Plan. This increase is mitigated by a $250 million reduction in the General Reserve and spending reductions of $264 million in the CSP, resulting in a net increase in spending of $271 million before accounting for changes in the Budget Stabilization Account (BSA), as shown in Table 6 above. The largest increase in agency spending is a $203 million increase in payments to parents of special needs children who are eligible for reimbursements for placing these children in non-public schools (Carter Cases). Another $148 million increase is due to the enacted State budget’s 10 percent cut in reimbursement rate for Temporary Assistance to Need Families (TANF) and a shortfall in anticipated TANF funding for Tier II homeless shelters. The City has added $62.7 million in City-funds spending to make up for the cut in TANF reimbursement and $85.5 million in the Tier II homeless shelter budget to meet the shortfall in anticipate TANF funding.
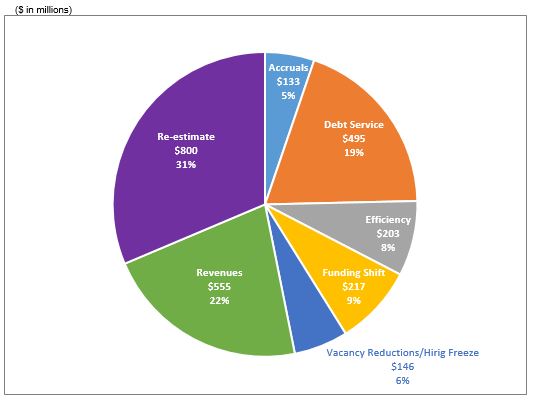
Overall, the $618 million increase in City-funds revenues, offset by the $271 million increase in City-funds expenditures, results in net additional resources of $347 million in FY 2019 to fund the BSA. The increase boosts the FY 2019 BSA to $3.5 billion. As Chart 2 shows, higher revenue forecasts and projected savings from the FY 2019 round of the Citywide Savings Program account for $2.95 billion of the BSA. The takedown of reserves and adjustments to prior-year accruals offset by a $1.26 billion increase in expenditures account for the remaining $563 million.
Chart 2. Funding the BSA and Discretionary Transfers
![]()
FY 2020 Budget
The FY 2020 Budget in the April Financial Plan totals $92.47 billion, an increase of $258 million from the February Plan. The increase is driven primarily by revisions to the City-funds portion of the budget which is $340 million higher than the February Plan. The non-City portion shows a net reduction of $82 million, primarily from a decline of $101 million in Federal categorical grants. Driving the reduction in Federal categorical grants is the ten percent cut in reimbursement rate for TANF in the enacted State budget, which reduces Federal categorical grants by $125 million and shifts this cost to the City.
As shown in Table 7, the increase in City-funds revenues in FY 2020 is due primarily to an upward revision of $209 million in tax revenues. With the exception of business tax revenues, which were revised downward by $118 million, all other tax revenue estimates were revised upward, with revisions to PIT accounting for $152 million of the increase. Tax revenues are discussed in greater detail in “Tax Revenues” beginning on page 18.
Table 7. Changes to FY 2020 City-Funds Estimates from the Preliminary Budget
($ in millions)
| revenues | expenditures | ||
| Personal Income Tax Revenues | $152 | Agency Expenses | $1,195 |
| Business Tax Revenues | (118) | Miscellaneous Budget | (12) |
| Sales Tax | 98 | Energy Adjustments | (17) |
| Real Estate Transaction | 70 | Lease Adjustments | (36) |
| All Other Tax | 7 | Collective Bargaining Adjustment | 7 |
| Subtotal | $209 | Citywide Savings Program | (449) |
| Subtotal | $687 | ||
| Non-Tax Revenues | 84 | ||
| Citywide Savings Program | 47 | BSA | (347) |
| Total | $340 | Total | $340 |
As discussed in “FY 2019 Budget” above, the FY 2019 BSA increased by $347 million resulting in an attendant reduction in FY 2020 debt service. Net of the prepayment of debt service out of the FY 2019 BSA, FY 2020 City-funds expenditures are $687 million above the Preliminary Budget estimates. The increase is driven by additional agency spending of $1.2 billion, with the impact of the enacted State budget accounting for $306 million of the increase. In addition to having to absorb the $125 million loss in TANF reimbursement, the City will have to fund a reduction in the State reimbursement for non-emergency public health spending and for election reform initiatives, as discussed in “Federal and State Aid” beginning on page 24. Similar to the revisions in FY 2019, the largest increase in the remaining agency spending revisions is for additional funding for Carter Cases. Overall, the largest increase in spending is in the Department of Education (DOE), whose FY 2020 budget is increased by $369 million, before accounting for reductions from the agency’s CSP savings.
Citywide Savings Program (CSP)
The spending increases in the April 2019 Financial Plan are mitigated by another round of CSP that is expected to provide budget relief totaling $420 million in FY 2019, $497 million in FY 2020, $383 million in FY 2021, $360 million in FY 2022, and $356 million in FY 2023. With the current round of CSP, estimated budget relief over the Plan period now totals $5.17 billion. The combined savings in FY 2019 and FY 2020 is $2.55 billon. As Chart 3 shows, additional revenues from revenue initiatives, debt service and re-estimates together account for 73 percent of the savings. Three one-time revenue infusions into the general fund in FY 2019 account for about half the revenues in the CSP: 1) a $152 million reimbursement from Health + Hospitals (H+H) primarily for prior-year payments of debt service, 2) a $50 million FEMA reimbursement for prior-year administrative costs associated with Superstorm Sandy recovery, and 3) a $35 million surplus transfer from the Education Construction to the DOE. Efficiency initiatives account for 8 percent of the savings.[9]
Chart 3. Combined FY 2019 and FY 2020 Citywide Savings Program
Risks and Offsets
As Table 8 shows, the Comptroller’s Office analysis of the April Plan shows net additional resources ranging from $629 million to $1.05 billion, in each year of the Plan. The additional resources are driven by the Comptroller’s Office’s tax revenue forecast, which is higher than the City’s projections in each year of the Plan, beginning at $679 million in FY 2019 and growing to $1.80 billion by FY 2023. (See “Tax Revenues” beginning on page 18.)
Risks to the City’s expenditure estimates offset some of the gains from the higher revenue forecast. These risks stem primarily from assumptions of overtime spending and shortfalls in funding for charter school tuition and the Fair Fares initiative. Despite increases to the overtime budget in the current Plan, the Plan’s assumptions are still significantly below recent spending patterns. The Comptroller’s Office’s analysis indicates that overtime could be above Plan by $195 million in FY 2019, $140 million in FY 2020, and $150 million in each of the outyears of the Plan.
Similarly, while the April 2019 Plan increased funding for charter school tuition by $88 million in each of the outyears of the Plan, residual risks ranging from $117 million in FY 2021 to $399 million in FY 2023 remain. The Comptroller’s Office’s risk of Fair Fares funding remains unchanged from February. The funding for the Fair Fares initiative remains at $106 million in FY 2020 with no funding in the outyears. Based on the City’s estimate of a full year cost of $212 million for the program, the funding level in the current Plan represents risks of $106 million in FY 2020 and $212 million in the outyears of the Plan.
Table 8. Risks and Offsets to the April 2019 Financial Plan
($ in millions, positive numbers decrease the gap and negative numbers increase the gap)
| FY 2019 | FY 2020 | FY 2021 | FY 2022 | FY 2023 | |
| City Stated Gap | $0 | $0 | ($3,481) | ($2,880) | ($3,158) |
| Tax Revenues | |||||
| Property Tax | $0 | $200 | $387 | $735 | $1,085 |
| Personal Income Tax | 496 | 385 | 387 | 335 | 237 |
| Business Taxes | 87 | 95 | 128 | 119 | 114 |
| Sales Tax | 65 | 114 | 103 | 34 | (35) |
| Real Estate Transaction Taxes | 31 | 202 | 321 | 299 | 241 |
| Audit | 0 | 0 | 154 | 154 | 154 |
| Subtotal Tax Revenues | $679 | $996 | $1,480 | $1,676 | $1,796 |
| Non-Tax Revenues | |||||
| ECB Fines | $0 | $10 | $10 | $15 | $15 |
| Late Filing/No Permit Penalties | 0 | 0 | 5 | 5 | 5 |
| Other Fines | 0 | 3 | 3 | 3 | 3 |
| Subtotal Non-Tax Revenues | $0 | $13 | $18 | $23 | $23 |
| Total Revenues | $679 | $1,009 | $1,498 | $1,699 | $1,819 |
| Expenditures | |||||
| Overtime | ($195) | ($140) | ($150) | ($150) | ($150) |
| Charter School Tuition | 0 | (0) | (117) | (250) | (399) |
| Fair Fares | 65 | (106) | (212) | (212) | (212) |
| Homeless Shelters | 0 | (20) | (20) | (20) | (20) |
| DOE Medicaid Reimbursement | 0 | (20) | (20) | (20) | (20) |
| VRDB Interest Savings | 30 | 0 | 0 | 0 | 0 |
| General Reserve | 50 | 0 | 0 | 0 | 0 |
| Subtotal | ($50) | ($286) | ($519) | ($652) | ($801) |
| Total (Risks)/Offsets | $629 | $723 | $979 | $1,047 | $1,018 |
| Restated (Gap)/Surplus | $629 | $723 | ($2,502) | ($1,833) | ($2,140) |
Overall, the Comptroller’s Office’s analysis of the Plan indicates that the City could end FY 2019 and FY 2020 with budget surpluses of $629 million and $723 million, respectively. In the outyears, the Comptroller’s Office analysis shows gaps of $2.50 billion, $1.83 billion and $2.14 billion in FY 2021 through FY 2023, respectively.
Revenue Analysis
Total revenues are estimated to grow by $6.51 billion over the forecast period, from $92.85 billion in FY 2019 to $99.36 billion in FY 2023. Estimated City fund revenues average 74 percent of total revenues over the Plan period. These projections reflect the City’s assumption of slower but continued growth in the local and national economies, which is on track to be the longest expansion in history.
Tax revenues are projected to grow by 3.0 percent in FY 2019 to $60.88 billion, following last year’s growth of 8.1 percent. Last year’s growth reflected a one-time boost related to Federal tax reform which contributed to a 19 percent increase in Personal Income Tax (PIT) revenue in FY 2018 that is not expected to recur. Over the forecast period, tax revenue growth is forecast to average 3.2 percent annually. This result is driven by a 4.4 percent average annual growth in property tax revenues and a slower 2.2 percent average annual growth in non-property tax revenues.
Miscellaneous revenue is projected to decline from $5.85 billion in FY 2019 to $5.14 billion in FY 2020. The decline results from an expected drop in one-time revenues. Beginning in FY 2020, non-recurring revenues such as asset sales and restitutions are projected to decline, reducing overall miscellaneous revenue projections to an average of $5 billion annually over the Plan period.
The April Plan reflects $23.97 billion of Federal and State aid for FY 2019, representing nearly 26 percent of the City’s overall revenue projections. Over the outyears of the Plan, Federal and State grants are projected to decline to $22.56 billion in FY 2020 and gradually recover over the remainder of the Plan to reach $23.66 billion by FY 2023. Federal support is projected to fall from $8.49 billion in FY 2019 to a range of $6.97 billion – $7.23 billion in each of FY 2020 – 2023 mainly due to declining Sandy-related reimbursements and the inclusion of rollover Federal funds in FY 2019. Meanwhile, State aid is projected to grow from $15.47 billion in FY 2019 to $16.69 billion by FY 2023, driven primarily by the expectation of school aid increases.
Tax Revenues
Revisions since the February Financial Plan, FY 2019 – FY 2023
In the April Plan, the City projects total tax revenues of $60.9 billion in FY 2019 and $63.1 billion in FY 2020, an increase of approximately $200 million over the February Plan. The outyears were also revised upwards, by slightly higher amounts: $253 million, $299 million and $225 million respectively in FY 2021 – FY 2023.
As Table 9 shows, the largest upward revisions in the April Plan were PIT and sales tax revenues. These changes reflect both higher than anticipated collections during the important April filing period as well as stronger assumptions for economic growth in the out years. Based on collection trends, real estate related taxes were revised downwards in FY 2019. The downward revision to real property taxes may be related to larger prepayments that occurred in FY 2018 to take advantage of the last year of full state and local tax (SALT) deductibility, which have may have subtracted from revenues this year. The outyear forecast for real estate transaction taxes, however, was revised upwards, while the pattern of revisions to business taxes is the opposite: higher near term strength followed by a lower forecast in the outer years.
Table 9. Revisions to the City’s Tax Revenue Assumptions April 2019 vs. February 2019
| ($ in millions) | FY 2019 | FY 2020 | FY 2021 | FY 2022 | FY 2023 |
| February 2019 Financial Plan | $60,681 | $62,916 | $64,768 | $66,930 | $68,895 |
| Revisions: | |||||
| Property | ($70) | $0 | $0 | $0 | $0 |
| Personal Income (PIT) | 284 | 152 | 120 | 122 | 87 |
| Business | 19 | (118) | (66) | (28) | (69) |
| Sales | 18 | 98 | 114 | 112 | 112 |
| Real Estate Transactions | (54) | 70 | 68 | 75 | 70 |
| All Other | 4 | 6 | 17 | 18 | 25 |
| Tax Audit | 1 | 1 | 0 | 0 | 0 |
| Total | $202 | $209 | $253 | $299 | $225 |
| April 2019 Financial Plan | $60,883 | $63,125 | $65,021 | $67,229 | $69,120 |
Comptroller Projections, FYs 2019 – 2023
The Comptroller’s forecast anticipates revenue growth of 4.1 percent in the current fiscal year following last year’s tax law-influenced surge of 8.1 percent. While slowing, strong momentum in the local and national economies provides support for continued expansion and revenue growth across the Plan period. Overall tax revenue growth is expected to average 3.6 percent over the four year Plan period, a remarkable result given the length of the current expansion, and slightly higher than the City’s own projections for sustained growth of 3.2 percent. By the end of the Plan period, overall tax revenues could be almost $1.8 billion higher than City’s projection, as shown in Table 11. Property tax revenues account for most of the difference in the later years of the Plan. A more detailed discussion of our projections and differences from the City’s forecast follows.
Table 10. Tax Revenue Forecast, Growth Rates
| FY 2019 | FY 2020 | FY 2021 | FY 2022 | FY 2023 | FYs 2019 – 23 Average Annual Growth | |
| Property | ||||||
| Mayor | 5.9% | 6.2% | 4.6% | 4.0% | 3.0% | 4.4% |
| Comptroller | 5.9% | 6.9% | 5.2% | 5.0% | 4.0% | 5.3% |
| PIT | ||||||
| Mayor | (4.9%) | 3.3% | 2.2% | 3.2% | 3.2% | 2.9% |
| Comptroller | (1.2%) | 2.3% | 2.1% | 2.7% | 2.4% | 2.4% |
| Business | ||||||
| Mayor | 6.3% | (1.8%) | 2.7% | 2.0% | 1.4% | 1.1% |
| Comptroller | 7.8% | (1.7%) | 3.2% | 1.8% | 1.3% | 1.2% |
| Sales | ||||||
| Mayor | 5.2% | 5.6% | 3.5% | 3.5% | 3.2% | 3.9% |
| Comptroller | 6.0% | 6.2% | 3.3% | 2.7% | 2.4% | 3.6% |
| Real Estate Transactions | ||||||
| Mayor | 5.5% | (4.9%) | 1.1% | 2.5% | 2.6% | 0.3% |
| Comptroller | 6.8% | 1.7% | 5.6% | 1.4% | 0.3% | 2.2% |
| All Other | ||||||
| Mayor | 12.5% | (1.9%) | 1.5% | 2.2% | 2.1% | 0.9% |
| Comptroller | 12.5% | (1.9%) | 1.5% | 2.2% | 2.1% | 0.9% |
| Audit | ||||||
| Mayor | (20.9%) | (5.6%) | (27.8%) | 0.0% | 0.0% | (9.1%) |
| Comptroller | (20.9%) | (5.6%) | (12.4%) | 0.0% | 0.0% | (4.6%) |
| Total Tax with Audit | ||||||
| Mayor | 3.0% | 3.7% | 3.0% | 3.4% | 2.8% | 3.2% |
| Comptroller | 4.1% | 4.2% | 3.7% | 3.6% | 2.9% | 3.6% |
Table 11. Risks and Offsets to the City’s Tax Revenue Projections
| ($ in millions) | FY 2019 | FY 2020 | FY 2021 | FY 2022 | FY 2023 |
| Property | $0 | $200 | $387 | $735 | $1,085 |
| PIT | 496 | 385 | 387 | 335 | 237 |
| Business | 87 | 95 | 128 | 119 | 114 |
| Sales | 65 | 114 | 103 | 34 | (35) |
| Real Estate Transaction | 31 | 202 | 321 | 299 | 241 |
| Audit | 0 | 0 | 154 | 154 | 154 |
| Total | $679 | $995 | $1,480 | $1,676 | $1,796 |
Property Taxes
The forecast for the City’s largest revenue source shows slowing but continued growth throughout the Plan period. Property tax revenue is estimated to grow on average by 5.3 percent annually from FY 2020 to FY 2023. This compares to recent growth of 7.0 percent in FY 2018, 5.9 percent in FY 2019, and 6.9 percent in FY 2020, based on the tentative roll released in January 2019.
The slowdown is attributable to a complex mix of changes in forecast increases in assessed values, the phase-in of assessed value increases that have already occurred, and conservative estimates for the construction of new commercial and residential property going forward.
Conditions in the commercial office market are also somewhat mixed. Class A rents have recently experienced an uptick following last year’s small decline. The increase is largely due to a favorable mix of higher quality new space being leased, however, rather than a reflection of significant strength in underlying demand. The Class A vacancy rate remains near 10 percent and new speculative inventory coming on line in Hudson Yards could put further upward pressure on office vacancies. In addition, conditions is the retail market continues to exhibit weakness.
The City projects even slower growth for the real property tax. Part of the difference is due to the Comptroller’s Office predicting a smaller decrease in billable values from the tentative to final roll, which starts our forecast from a higher baseline. The other difference is the forecast for reserves.[10] The City’s projections show reserves jumping to almost 7 percent of the levy in FY 2020 – FY 2023 from 6.1 percent last year. Assuming a more steady reserve-to-levy ratio results in a forecast for reserves that is likely to be $200 million to$300 million lower than the City’s estimate. The combined effect of lower reserves and slightly higher assumptions on property tax growth results in property tax revenue exceeding the City’s projections by $1.1 billion by the end of the Plan period.
Real Estate Transaction Taxes
Year to date collection data indicate that the City’s real estate transfer taxes have rebounded from last year’s 3.8 decline, and for the year as a whole are estimated to grow by 6.8 percent. While the outlook for the commercial and residential market remains somewhat soft due to increasing high inventory, the concern that higher interest rates would also impact transactions and refinancings has largely subsided, given the Federal Reserve’s recent more dovish stance. As a result of the more favorable interest outlook and projections of stronger economic growth, our forecast for real estate transaction revenues is for moderate growth of 2.2 percent on average over the Plan period. This is somewhat higher compared to the City’s forecast of essentially flat growth over the same period.
One potential risk to the forecast is the recently enacted increases in the State’s real property transfer tax for commercial and residential properties. While the City’s tax rate remains unchanged, if transactions were to be significantly impacted as a result of these increases, revenues could be lower than anticipated. There is still considerable ongoing debate on the extent to which sales of high end luxury properties will be impacted by these changes.
Personal Income Taxes
April’s PIT collections came in significantly higher than anticipated in February. This suggests that the decline in estimated payments in December and January was an anomaly rather than a reflection of underlying weakness in PIT. The strength was particularly evident in extension payments which surged by more than 70 percent over the previous year. Even with strong April results, year to date personal income tax revenues are still 1.3% lower than last year, mainly due to an 18% decline in estimated payments. This decline is an indication that last year’s surge in PIT was due at least partly to one-time factors related to Federal tax law changes. However these non-recurring factors were either less pronounced than expected or underlying economic growth has offset these to a greater extent than anticipated. In support of the latter explanation, recent U.S. and local economic data continues to show growth that has largely exceeded expectations.
The current momentum in PIT collections is expected to carry forward through the remainder of the current fiscal year. Overall PIT revenue is expected to be only slightly lower than last year’s exceptional result. Looking ahead, as the one time effects of tax law changes dissipate, PIT is forecast to resume a more stable trajectory in FY 2020 – FY 2023 that is consistent with the forecast for local wages and employment. The Comptroller’s forecast for PIT is significantly higher than the City’s across the Plan Period. This is mainly due to a higher starting point, almost $500 million higher than the City’s forecast for the current fiscal year. The higher starting point reflects current collections data including the final tally for the April tax filing period which was not yet available when the City released the Plan.
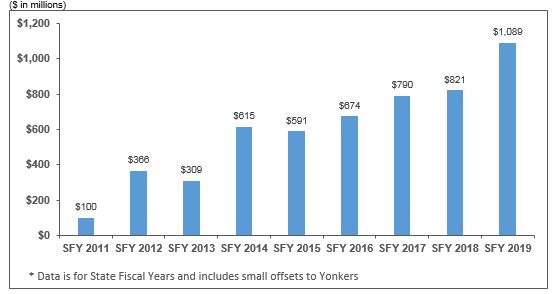
One noteworthy factor in collection trends are PIT offset payments from the State, which reconcile estimated payments with final payments. These continue to grow at a faster rate than overall PIT and are estimated to reach over $1 billion in the current State fiscal year, as shown in Chart 4. The ten-fold increase in offsets since FY 2011 has far outpaced any other component of income taxes. As we have suggested in prior reports, the formula used to distribute payments needs to be updated and be made more transparent so that the City receives PIT revenues in a timelier manner.
Chart 4. Offset Payments from the State
Business Income Taxes
March and April collections for the two main sources of business tax collections — the General Corporation Tax (GCT) and the Unincorporated Business Tax (UBT) — diverged. This was expected given that tax law changes provided GCT and UBT filers different timing incentives to shift income across tax years 2017-2019. The law also created incentives for UBT filers to incorporate, which may also explain why GCT collections through April were 17 percent higher compared to a year ago. In contrast, UBT revenue was 12 percent lower than the prior year.[11]
This year’s large uptick in GCT is expected to reverse in FY 2020, resulting in a five percent decline next year, and then resume moderate growth in the outyears. Compared to the City’s forecast, the Comptroller anticipates higher GCT revenue throughout the Plan period. Similar to PIT, the higher GCT forecast is due in large part to a higher starting point this year based on collections in the current year.
Sales Tax
A strong labor market, higher wages, and a robust tourism sector have continued to support growth in sales tax revenues. Collections from sales tax are up 5 percent in the first three quarters of FY 2019 compared to the same period last year. After registering 6.1 percent growth in FY 2018, the April Plan assumes sales tax revenue growth of 5.2 percent in FY 2019 to $7.83 billion. This projection is net of the final $150 million in payments to the State related to the City’s refinancing of STARC bonds. Sales tax revenue growth in FY 2020 is expected to accelerate slightly to 5.6 percent. Part of this growth reflects the end of the State mandated STARC intercepts, which have reduced City sales tax revenue by a combined $600 million in FY 2016 – FY 2019. The Plan assumes average growth in sales tax revenues will slow to 3.4 percent annually in FY 2021 – FY 2023.
The Comptroller’s Office expects higher wages and steady economic growth will support sales tax revenue growth of 6.0 percent in FY 2019 and 6.2 percent in FY 2020, compared to OMB’s growth estimates of 5.2 percent and 5.6 percent, respectively. These projections result in offsets of $65 million in FY 2019 and $114 million in FY 2020. In the outyears, both OMB and the Comptroller’s Office anticipate growth in sales tax collections to subside to a more modest pace, consistent with the underlying assumption of slower economic growth. The Comptroller’s Office projects sales tax revenue growth to average 2.8 percent annually in FY 2021 – FY 2023, compared to a 3.4 percent average reflected in the Plan over the same period. However, due to the Comptroller’s higher assumption for near-term growth, the Comptroller’s Office projects additional revenues of $103 million in FY 2021 and $34 million in FY 2022. However, in FY 2023 the Comptroller’s Office forecasts revenues from sales tax to be slightly below OMB’s projection, by about $35 million.
The New York State adopted budget for 2019 – 2020 included legislation requiring online marketplace providers to collect sales tax on sales of tangible goods to New York State residents regardless of vendor location. These new revenues will be intercepted by the State to fund MTA repair and upgrades. The City’s sales tax revenue intercepts will be $127.5 million in SFY 2019 – 2020, $170 million in SFY 2020 – 2021, and will increase one percent annually in SFY 2021 – 2022 and beyond. Sales tax revenue projections included in the April Plan are net of these amounts.
Audit Revenues
The City’s forecast shows audit revenue dropping significantly from over $1 billion in FY 2019 to below $800 million for the remainder of the Plan. While recognizing the volatility of single revenue sources within audit revenue, overall audit revenue has consistently hovered in the $1 billion range in recent years. We anticipate that audit revenue could exceed the City projections by about $150 million in each year from FY 2021 – FY 2023.
PILOT Revenue
The City collects payments in lieu of real estate taxes (PILOTs) mainly from local development entities that would otherwise be exempt from paying local property taxes, such as the NYC Industrial Development Agency and the Battery Park City Authority. The City estimates that in FY 2020, it will collect just over $500 million from PILOTs. Thereafter the City projects that PILOTs will decline to $444 million. The underlying projections of some of the PILOT revenue sources such as those from the Hudson Yards development area show real property taxes flat in the out-years. This seems unlikely given existing growth in this market and that new development will likely come on line. As such, combined PILOT revenue from all sources could be higher than the City’s estimates by $50 million to $100 million in FY 2020 to FY 2023.
Miscellaneous Revenues
In the April 2019 Financial Plan the City raised its FY 2019 miscellaneous revenue projection by a net $366 million, to $5.85 billion. Nearly $105 million of this increase are revenue initiatives included in the CSP. The revised FY 2019 miscellaneous revenue forecast is $877 million above the $4.97 billion realized last fiscal year. This is mostly due to higher revenue projections for “other miscellaneous,” including asset sales, restitution, and other non-recurring revenues in FY 2019. The current Plan also increases the FY 2020 miscellaneous revenue forecast by $131 million to $5.14 billion. This reflects a 12 percent decline in the miscellaneous revenue projection for the upcoming fiscal year.
Table 12 Changes in FY 2019 Estimates April 2019 vs. February 2019
| ($ in millions) | February | April | Change |
| Licenses, Franchises, Etc. | $728 | $795 | $67 |
| Interest Income | 193 | 213 | 20 |
| Charges for Services | 1,025 | 1,016 | (9) |
| Water and Sewer Charges | 1,464 | 1,453 | (11) |
| Rental Income | 259 | 272 | 13 |
| Fines and Forfeitures | 980 | 1,047 | 67 |
| Other Miscellaneous | 830 | 1,049 | 219 |
| Total | $5,479 | $5,845 | $366 |
*Water and sewer revenues collected by the Water Board from dedicated water and sewer charges represent reimbursements for operation and maintenance of the water delivery and sewer systems and therefore are not available for general operating purposes.
Table 12 shows the changes in the FY 2019 miscellaneous revenue projections since the February 2019 Plan. Except for small downward revisions to charges for services and water and sewer charges, the April Plan increased FY 2019 projections for all other categories of miscellaneous revenue. The largest revision, a $219 million increase in the category “other miscellaneous” reflects additional non-recurring revenues in FY 2019 including $141.7 million in restitution resulting from a settlement with Standard Chartered Bank for illegal transactions on behalf of sanctioned Iranian entities and individuals, $35 million in surplus transfer from the Educational Construction Fund, and $30 million in revenues associated with New York City Economic Development Corporation (NYCEDC) management of City owned-properties and asset sales. Projected revenues from licenses, franchises and permits increased by $67 million mainly due to higher projected revenues from construction permits, taxi licenses and mobile telecom franchises. Re-estimates of overnight investments increased the forecast for interest income by $20 million. Projected rental income increased by $13 million as anticipated revenues from commercial rents increased. Estimated revenues from fines and forfeitures increased by $67 million, including additional revenues from parking fines ($40.8 million), Environmental Control Board (ECB) fines ($19 million), Department of Buildings (DOB) late filling/no permit penalties ($8 million), motor vehicle fines ($2 million), and Real Property Income and Expense (RPIE) late penalties ($2 million). These increases were partially offset by a $6.4 million reduction in projected revenues from speed camera fines.
After averaging $59 million over the past three fiscal years, revenues from speed camera fines are expected to drop to $45 million in FY 2019. In March, the State passed legislation to expand the City’s school zone speed camera program, which was signed by the Governor on May 12th. The new legislation expands the City’s speed enforcement program from 140 to 750 school zones. Hours of operation were also expanded to 6 a.m. to 10 p.m. instead of school hours. Currently, the City’s Department of Transportation (DOT) operates 195 fixed and 40 mobile cameras within 140 school zones. The program expansion to 750 school zones is expected to be phased in over three years. However, the April Plan reflects expense funding to cover just 300 additional cameras throughout the Plan period and assumes fine related revenues equal to the maintenance cost of 300 cameras. Revenues from speed camera fines are forecast to rise to $58 million in FY 2020 and then decrease by an average of 6.5 percent annually over the Plan period. Total projected fine revenues increased by $59 million in FY 2020 and by $44 million annually in FY 2021 – FY 2023. This revision reflects additional speed camera fine revenues as well as additional parking fines resulting from an expected increase in the alternate side parking fine amounts and a projected increase in NYPD traffic enforcement headcount and productivity.
Total miscellaneous revenues, excluding intra-City revenues, are projected to decline 12 percent in FY 2020 because of non-recurring revenues reflected in the current year, falling to around $5.1 billion and remaining at similar levels in FY’s 2021-2023.
Based on recent collection trends, the Comptroller’s Office expects revenues from fines to be above the City’s forecast by $13 million in FY 2020, $18 million in FY 2021, and $23 million in FY 2022 – FY 2023. These additional revenues result from the Comptroller’s Office slightly higher projections for Environmental Control Board (ECB) fines, and penalties from the Department of Buildings’ (DOB) and the Department of Finance (DOF).
Federal and State Aid
The FY 2020 Executive Budget assumes $22.56 billion in Federal and State assistance, reflecting a decline of $158 million since the February Plan. About 83 percent of this total is expected to support education and social services spending. On a year-over-year basis, the FY 2020 assumptions represent a decline of nearly $1.41 billion from projected Federal and State support in the current year, attributable mainly to the rapid decline in Sandy-related reimbursement and more conservative estimates of certain Federal grants in FY 2020.
Since the Preliminary Budget, the City’s Federal aid assumptions have fallen by $101 million. Net of Sandy-related funding, the City anticipates about $7.16 billion in Federal assistance for FY 2020. The majority of the Federal aid decline is reflected in social services, including TANF funding reduction enacted by the State ($125 million) and cash assistance and rental assistance re-estimates ($40 million). These changes are partly offset by additional school Medicaid revenue of $27 million and a net increase of $16 million in Community Development Block Grants and other areas. The City expects State aid to total $15.3 billion in FY 2020, a decrease of $57 million from projections in the Preliminary Plan. The decline mainly captures the impact on school aids and public health funding stemming from the enacted State budget.
State Budget Impact in the Executive Budget
Following adoption of the 2019 – 2020 State budget that began on April 1, the City estimates that actions in the State budget will increase City expenses in fiscal year 2020 by roughly $300 million, as shown in Table 13. Most significantly, under a provision in the adopted State budget, the City will now be required to fund 10 percent of the Family Assistance program, which provides cash assistance to needy families and is jointly funded by the Federal and State governments. The City estimates a loss of $125 million annually due to this new requirement.
Table 13 Impact of Adopted 2019 – 20 State Budget
| ($ in millions) | FY 2020 |
| School Aid | ($25) |
| Cost Shifts | |
| Family Assistance | ($125) |
| Public Health | (59) |
| Subtotal, Cost Shifts | ($185) |
| Election Reforms | |
| Early Voting | ($75) |
| Electronic Poll Books | (21) |
| Subtotal, Election Reform | ($96) |
| Total Impact | ($306) |
The adopted State budget also included a reduction in State reimbursements for non-emergency public health spending, such as communicable disease control and chronic disease prevention, which will result in an estimated loss of $59 million in annual State aid.
Other proposals in the Governor’s Executive Budget that would have negatively impacted the City’s financial plan were avoided, including a mandate to steer additional funding to designated “under-funded” and “high-need” public schools. Instead, under the final State budget agreement, the City will be required to “prioritize” funding for such schools and submit a report to the State Education Department describing how funds are to be appropriated. Compared to OMB’s forecast, total State school aid for FY 2020 fell short by $25 million, far less than initially proposed.
Congestion Pricing and MTA Funding
The State budget also included a far-reaching plan to generate new revenue for the MTA, including authorization for a new fee to enter the central business district in Manhattan, a new “mansion” tax on property transactions in the City, and the dedication of a portion of new City and State sales tax revenue generated from internet purchases.
In late 2020, a newly created Traffic Mobility Review Board will recommend the congestion toll amount and structure, including any exemptions, discounts or credits, with a target to fund $15 billion in the MTA’s 2020-2024 capital plan. According to the enacted legislation, the bulk of the new revenue — 80 percent — will be allocated to “capital project costs of the New York City transit authority and its subsidiary, Staten Island Rapid Transit Operating Authority, and MTA Bus with priority given to the subway system, new signaling, new subway cars, track and car repair, accessibility, buses and bus system improvements and further investments in expanding transit availability to areas in the outer boroughs that have limited mass transit options.”[12] The remainder will be split between the Long Island Railroad and MetroNorth.
The MTA funding plan also imposes two supplemental taxes on residential and commercial property sales in New York City priced at $2 million and above. The first component is a 0.25 percent increase in the New York State real property transfer tax on residential sales priced at $3 million and above and commercial sales priced at $2 million and above. The second component is a supplemental “mansion” tax that begins at 0.25 percent for residential sales priced from at least $2 million to less than $3 million and tops out at 2.9 percent for residential sales priced at $25 million and above. The new rates take effect on July 1, 2019, and all additional revenue will be dedicated to the MTA. The State forecasts an additional $365 million per year for the MTA, although actual revenue collections in any given year are likely to fluctuate with swings in the luxury housing market. With the new tax, the combined City and State top transfer tax rate will increase from 2.825 percent for sales priced at $1 million and above to 5.975 percent for sales priced at $25 million and above. It is possible that the higher rates will result in a diminishment of sales relative to current expectations, and thus reduce the City’s own real property transfer tax revenues, and ultimately its real property tax.
Beginning in State fiscal year 2019 – 2020, the City is required to dedicate $127.5 million in sales taxes to the MTA, followed by $170 million in 2020 – 2021. These amounts are based on the State’s projection for new sales tax collections on online marketplace providers and out-of-state online retailers. Given the State’s lower sales tax rate — 4 percent vs 4.5 percent in the City — the State will contribute $112.5 million in 2019 – 2020 and $150 million in 2020 – 2021. In subsequent years, the required allocation will equal 101 percent of the preceding year amount. While the contribution amounts are based on new sales tax projections and a modest future growth rate, if the State’s revenue estimate proves too optimistic, the City could experience a revenue shortfall.
Early Voting
The City has also allocated $96 million in FY 2020 to comply with new early voting requirements adopted by the State earlier in the year — $75 million for early voting and $21 million for electronic poll books. Beginning with the November 2019 general election, the City Board of Elections (BOE) must provide nine extra days of voting for any general, primary, run-off primary election, or special election. Under the early voting law, local boards of election are generally expected to provide at least one early voting site for every fifty thousand registered voters. However, under the law, New York City does not have to provide more than 34 sites. While Mayor de Blasio recommended at least 100 sites to the BOE, and provided funding to do so, the BOE announced that it plans to operate only 38 sites.
According to the City’s estimates, operating roughly 100 early voting poll sites would cost $25 million per election. More than half of the cost would go to staffing and the remainder would fund expenses such as rental payments, ballot printing, equipment transportation, and security. In FY 2020 the City BOE will hold three elections – the general election (November 2019), the 2020 presidential primary, and a State/Federal primary in June 2020. While the City holds at least two elections every year, the City has not yet allocated any funding for early voting beyond FY 2020.
If the BOE operates only 38 early voting sites for all of FY 2020, the estimated cost would fall from $75 million to about $28.5 million. However, the BOE has indicated that it may increase the number of sites over time, and the City has pressed them to do so.
The adopted State budget further permits, but does not mandate, the use of electronic poll books. The use of electronic books will allow the BOE to more easily ensure that people vote only once following the implementation of early voting. In addition, each early voting site will require a full list of all voters in the county or early election zone. Without access to electronic poll books, each site would require a substantial amount of paper poll books.
The City may be able to access some State funding to offset these new election costs. The enacted State budget includes $10 million in local assistance funds to implement early voting Statewide and $14.7 million in capital appropriations for costs associated with electronic poll books hardware and software, as well as on-demand ballot printers and cyber security. The State Board of Elections will determine how to allocate these funds. The State’s package of election reforms also include a consolidation of Federal, State and local primaries, which will further reduce costs for the BOE.
Criminal Justice Reform
Sweeping reforms to the State criminal justice system will also have long-term impacts on the City’s financial plan. Beginning on January 1, 2020, cash bail will be eliminated for most people charged with a misdemeanor or non-violent felony. The State estimates that under the new law 90 percent of defendants will be released without bail. The new policy includes an expansion of release under non-monetary conditions, such as electronic monitoring, and directs judges to use the least restrictive conditions necessary to ensure a person’s return to court. If bail is set, the judge must consider the person’s financial circumstances and their ability to post bail without undue hardship. The adopted reforms also require prosecutors and defenders to abide by strict deadlines for sharing material intended to be used at trial and additional judicial oversight to enforce existing speedy trial requirements. Police officers will also be required to issue desk appearance tickets for most low-level crimes, rather than make an arrest.
Over time, the criminal justice reforms should result in a smaller jail population and enable the Department of Correction to reduce staffing costs. However, the City may incur additional costs in the short term for expanded pretrial services, such as electronic monitoring or supervised release. The State budget did not include any additional funding for such services.
School Speed Zone Cameras
Outside of the State budget, under State legislation that passed in March, the City may undergo a significant expansion of its school speed zone camera program. The program, which had lapsed in July 2018 until the Governor issued an Executive Order and the City Council passed legislation, was permitted to operate cameras in 140 school zones. The revised law increased the number of authorized zones to 750 and extended authorization through July 1, 2022, and is discussed in greater detail in “Miscellaneous Revenues” beginning on page 23.
Local Aid Cuts Possible if Revenues Fall
Another provision in the State budget could pose a risk to the City if State tax revenues fall short or if State expenses exceed expectations. The new provision will allow certain local aid payments to be uniformly reduced by up to 1 percent in the event of a “reasonably anticipated” $500 million imbalance in the general fund at the end of the year. Exempted aid categories include public assistance, debt service, and legal or federal obligations. The legislature would have 30 days to propose its own alternative plan. The adopted State budget also extends Executive authority to reduce spending if federal Medicaid revenues are cut by $850 million, or if non-Medicaid federal revenues are cut by $850 million in State fiscal years 2020 and 2021. The Legislature would have 90 days to propose and adopt an alternative plan.
Over the remainder of the Plan, Federal and State grants are projected to range between $22.79 billion in FY 2021 and $23.66 billion in FY 2023. These projections represent average annual growth of about 1.6 percent from the FY 2020 projections, driven primarily by the City’s expectation of State education aid increases averaging more than 3.7 percent annually. Assuming these assumptions hold, the level of Federal and State support for the City’s expense budget would decline from 24.4 percent in FY 2020 to about 23 percent by FY 2023.
Expenditures Analysis
Total-funds FY 2020 expenditures in the April Financial Plan are projected to remain relatively unchanged from FY 2019, declining by a modest $383 million, or less than half a percent. However, both the FY 2019 and FY 2020 expenditures include prepayments which lower debt service expenditures in these fiscal years. In addition, expenditures in FY 2019 are further reduced by the take-down of the general reserve and the re-estimates of prior-year accruals. After adjusting for prepayments, and excluding re-estimates of prior-year accruals and reserves, expenditures are projected to grow from $94.26 billion in FY 2019 to $94.73 billion in 2020, a modest growth of 0.5 percent, as shown in Table 14.
Over the Plan period, expenditures net of reserves and prior-year re-estimates are projected to grow by 7.4 percent, driven by spending on salaries and wages, debt service, health insurance, and other fringe benefits excluding pensions. The combined spending in these areas is projected to grow by 16.7 percent over the Plan period, averaging 3.9 percent annually. All other expenditures, net of the reserves and prior-year re-estimates, are projected to decline by 1.3 percent over the same period, with a projected annual average decline of 0.3 percent.
Table 14. FY 2019 – FY 2023 Expenditure Growth Adjusted for Prepayments and Prior-Year Actions
| ($ in millions) | FY 2019 | FY 2020 | FY 2021 | FY 2022 | FY 2023 | Growth FYs 19-23 | Annual Growth |
| Salaries and Wages | $28,623 | $29,570 | $30,501 | $30,355 | $31,244 | 9.2% | 2.2% |
| Debt Service | $6,631 | 7,238 | 7,625 | 8,315 | 9,070 | 36.8% | 8.1% |
| Health Insurance | $6,487 | 7,086 | 7,455 | 8,013 | 8,593 | 32.5% | 7.3% |
| Other Fringe Benefits | $4,053 | 4,200 | 4,286 | 4,401 | 4,523 | 11.6% | 2.8% |
| Subtotal | $45,794 | $48,094 | $49,867 | $51,085 | $53,430 | 16.7% | 3.9% |
| Pensions | $9,824 | $9,839 | $10,006 | $10,452 | $10,507 | 7.0% | 1.7% |
| Medicaid | $5,915 | $5,915 | $5,915 | $5,915 | $5,915 | 0.0% | 0.0% |
| Public Assistance | $1,595 | $1,651 | $1,651 | $1,651 | $1,650 | 3.5% | 0.9% |
| J & C | $697 | $712 | $727 | $742 | $758 | 8.8% | 2.1% |
| Contractual Services | $17,962 | $16,669 | $16,590 | $16,660 | $16,703 | (7.0%) | (1.8%) |
| Other OTPS | $12,474 | $11,855 | $11,906 | $12,128 | $12,309 | (1.3%) | (0.3%) |
| Subtotal | $48,467 | $46,641 | $46,794 | $47,547 | $47,842 | (1.3%) | (0.3%) |
| Expenditures Before Reserves and Prior-Year Re-estimates | $94,261 | $94,734 | $96,661 | $98,632 | $101,272 | 7.4% | 1.8% |
| Prior-Year Accruals Re-estimate | ($400) | $0 | $0 | $0 | $0 | ||
| General Reserve | $50 | $1,000 | $1,000 | $1,000 | $1,000 | ||
| Capital Stabilization Reserve | $0 | $250 | $250 | $250 | $250 | ||
| Total | $93,911 | $95,984 | $97,911 | $99,882 | $102,522 | 9.2% | 2.2% |
Note: Numbers may not add due to rounding.
Headcount: Hiring Freeze Offset by New Needs
Full-time headcount, as shown in Table 15, is projected to increase from 305,071 in FY 2019 to 310,302 in FY 2022 before declining to 310,248 in FY 2023. The increase is primarily in pedagogical headcount which is projected to grow from 125,138 in FY 2019 to 130,919 in FY 2023. Uniformed headcount shows a net decline of 555 over this period while civilian headcount is projected to remain relatively flat with a modest reduction of 49.
Table 15. Total Funded Full-Time Year-End Headcount Projections April 2019 Financial Plan
| FY 2019 | FY 2020 | FY 2021 | FY 2022 | FY 2023 | |
| Pedagogical | |||||
| Dept. of Education | 120,697 | 121,771 | 123,735 | 126,478 | 126,478 |
| City University | 4,441 | 4,441 | 4,441 | 4,441 | 4,441 |
| Subtotal | 125,138 | 126,212 | 128,176 | 130,919 | 130,919 |
| Uniformed | |||||
| Police | 36,113 | 36,113 | 36,113 | 36,113 | 36,113 |
| Fire | 10,951 | 10,952 | 10,951 | 10,951 | 10,951 |
| Correction | 10,226 | 9,854 | 9,854 | 9,695 | 9,695 |
| Sanitation | 7,823 | 7,799 | 7,799 | 7,799 | 7,799 |
| Subtotal | 65,113 | 64,718 | 64,717 | 64,558 | 64,558 |
| Civilian | |||||
| Dept. of Education | 12,376 | 12,545 | 12,739 | 13,015 | 13,015 |
| City University | 1,942 | 1,946 | 1,946 | 1,946 | 1,946 |
| Police | 15,611 | 15,472 | 15,471 | 15,471 | 15,471 |
| Fire | 6,252 | 6,366 | 6,605 | 6,605 | 6,605 |
| Correction | 2,151 | 1,997 | 1,997 | 1,997 | 1,997 |
| Sanitation | 2,270 | 2,247 | 2,247 | 2,247 | 2,247 |
| Admin. for Children’s Services | 7,168 | 7,217 | 7,474 | 7,474 | 7,474 |
| Social Services | 14,305 | 14,523 | 14,502 | 14,502 | 14,502 |
| Homeless Services | 2,578 | 2,385 | 2,228 | 2,129 | 2,129 |
| Health and Mental Hygiene | 5,788 | 5,580 | 5,566 | 5,566 | 5,566 |
| Finance | 2,155 | 2,146 | 2,146 | 2,146 | 2,146 |
| Transportation | 5,495 | 5,458 | 5,468 | 5,467 | 5,467 |
| Parks and Recreation | 4,399 | 4,263 | 4,256 | 4,258 | 4,258 |
| All Other Civilians | 32,330 | 32,167 | 32,069 | 32,002 | 31,948 |
| Subtotal | 114,820 | 114,312 | 114,714 | 114,825 | 114,771 |
| Total | 305,071 | 305,242 | 307,607 | 310,302 | 310,248 |
The April 2019 Headcount Plan, as shown in Table 16, shows net decreases, as compared to the February 2019 Plan, in year-end headcount of 884 in FY 2019, 121 in FY 2020, 162 in FY 2021, 288 in FY 2022 and 292 in FY 2023. Of the projected changes, the CSP generates projected headcount reductions of 1,197 in FY 2019, 1,894 in FY 2020, and reaching 2,162 positions by FY 2022. Over the Plan period, nearly three-quarters of CSP headcount reductions are due to the hiring freeze and vacancy reduction program, which reduced the FY 2019 year-end headcount by 1,205 from the February Plan estimate and by nearly 1,400 positions in subsequent years.[13] Other major initiatives include a reduction in homeless shelter security positions as responsibility for shelter security is shifted to providers, and a further reduction in housing areas on Rikers Island as the detainee population continues its decline.
Over three-quarters of the reductions in headcount from the CSP, however, are offset by increased headcount for new agency needs. Major new needs include DOE investments in special education and insourcing of certain central administration contractual services; the Fire Department (FDNY) EMS Bronx Fly Car program; and staffing for the expanded Department of Sanitation (DSNY) organics collection program.
Table 16. Full-time Headcount Changes by Category – April 2019 Financial Plan vs. February 2019 Financial Plan
| FY 2019 | FY 2020 | FY 2021 | FY 2022 | FY 2023 | |
| Headcount, February Plan | 305,955 | 305,363 | 307,769 | 310,590 | 310,540 |
| Citywide Savings Plan | |||||
| Hiring Freeze/Vacancy Reduction | (1,205) | (1,393) | (1,395) | (1,395) | (1,395) |
| DHS Shelter Security Reorganization | 0 | (200) | (320) | (320) | (320) |
| DHS Shelter Reorganization | 0 | (38) | (75) | (174) | (174) |
| DOC Housing Area Consolidation | 0 | (209) | (209) | (209) | (209) |
| All Other CSP | 8 | (54) | (64) | (64) | (64) |
| Subtotal | (1,197) | (1,894) | (2,063) | (2,162) | (2,162) |
| New Needs | |||||
| DOE Special Educ. Investments | 27 | 653 | 653 | 653 | 653 |
| DOE Insourcing | 0 | 243 | 243 | 243 | 243 |
| FDNY Bronx Fly Car Program | 0 | 6 | 225 | 225 | 225 |
| DSNY Organics Program | 0 | 115 | 115 | 115 | 115 |
| DOT Speed Cameras Expansion | 0 | 67 | 80 | 80 | 80 |
| DDC Borough-Based Jails | 0 | 41 | 41 | 41 | 41 |
| All Other New Needs | 33 | 617 | 506 | 462 | 462 |
| Subtotal | 60 | 1,742 | 1,863 | 1,819 | 1,819 |
| Other Adjustments | 253 | 31 | 38 | 55 | 51 |
| Total Change | (884) | (121) | (162) | (288) | (292) |
| Headcount, April Plan | 305,071 | 305,242 | 307,607 | 310,302 | 310,248 |
Chart 5 compares planned FY 2019 headcount changes as of the April Plan between June 30, 2018 and June 30, 2019 with the actual change in headcount between June 30, 2018 and March 31, 2019 – nine months through the fiscal year. The Administration projected an increase of 6,701 fulltime positions during FY 2019, consisting of 6,997 civilian positions and 689 pedagogical positions (an increase of 797 at the Department of Education, combined with a decline of 108 at CUNY), and a net decrease of 985 positions amongst the uniformed services.
Chart 5. Planned FY 2019 Headcount Change vs Change Through 3/31/2019
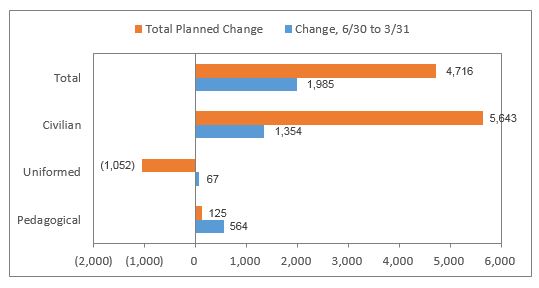
As of March 31st, however, the City remained well short of this overall goal, having increased fulltime headcount by just 1,985 positions, or about 30% of the goal. As such, it is likely that the City will be able to recognize additional accrual savings from a shortfall in hiring for the current fiscal year.
Overtime: Growth Slows
The FY 2020 Executive Budget projects overtime expenditures of $1.35 billion for FY 2020, about 9 percent lower than the current FY 2019 overtime cost estimate of $1.47 billion. Fiscal year-to-date spending through April 2019 is already within $32 million of the current FY 2019 estimate. The Comptroller’s Office estimates that overtime spending is on pace to reach about $1.7 billion for the fiscal year, approximately $100 million below FY 2018 spending of $1.8 billion. This downward trend is expected to continue in FY 2020 as the City achieves cost savings from several initiatives implemented to reduce civilian overtime expenditures and benefit from increased uniformed headcount levels. The Comptroller’s Office projects overtime spending of $1.49 billion for FY 2020, exceeding the Executive Budget’s overtime projections by $140 million, as shown in Table 17.
Table 17. Projected FY 2020 Overtime Spending
| ($ in millions) | City | Comptroller | Risk |
| Uniformed | |||
| Police | $535 | $560 | ($25) |
| Fire | 208 | 208 | 0 |
| Correction | 151 | 151 | 0 |
| Sanitation | 118 | 118 | 0 |
| Total Uniformed | $1,012 | $1,037 | ($25) |
| Civilians | |||
| Police-Civilian | $80 | $110 | $(30) |
| Admin for Child Svcs | 17 | 30 | (13) |
| Environmental Protection | 22 | 35 | (13) |
| Transportation | 47 | 55 | (8) |
| All Other Agencies | 169 | 220 | (51) |
| Total Civilians | $335 | $450 | ($115) |
| Total City | $1,347 | $1,487 | ($140) |
In FY 2018, the City spent $607 million for civilian overtime, a 6.3 percent increase from FY 2017. Through April 2019, the City has spent $511 million for FY 2019 and is on pace to spend a similar amount as in FY 2018. Civilian overtime expenditures have steadily increased over the last several years, growing at an average annual rate of 9.4 percent from $424 million in FY 2014 to $607 million in FY 2018. To curb the growth in civilian overtime, the City has included several overtime control initiatives including restricting waivers on civilian overtime caps, monitoring the use of overtime by skilled trade workers, and employing pensioners as part-time workers to reduce reliance on overtime. These initiatives are expected to generate annual savings of at least $28 million in FY 2020 and at least $38 million in each of FYs 2021 to 2023. The Comptroller’s Office estimates that civilian overtime will cost the City about $450 million in FY 2020, $115 million higher than the City’s projection.
In contrast, expenditures for uniformed overtime declined slightly to $1.19 billion in FY 2018 from $1.21 billion in FY 2017. Recent increases in headcount, mainly the New York Police Department (NYPD), the FDNY, and the Department of Corrections (DOC), have reduced the reliance on overtime usage to meet day-to-day operations. This has been especially evident at the FDNY and the DOC. In FY 2018, the City spent $263 million on uniformed overtime at the FDNY compared to $272 million in FY 2017, and $277 million in FY 2016. This cost is expected to be even lower for FY 2019 at approximately $254 million. Even more impressive is the decline in uniformed overtime costs at DOC. The City spent $198 million for DOC’s uniformed overtime expenses in FY 2018, 18 percent lower than the FY 2017 amount of $240 million and 22 percent lower than the FY 2016 amount of $254 million. It is estimated that DOC’s uniformed overtime cost will be about $150 million for FY 2019. The City’s FY 2020 overtime projections for FDNY and DOC are reasonable. However, The Comptroller’s Office projects a small risk to uniformed overtime spending at the NYPD of $25 million for FY 2020.
Health Insurance: Little Change
FY 2020 spending on health insurance for City employees and retirees is projected to increase by $599 million, from $6.49 billion in FY 2019 to $7.09 billion.[14] As shown in Table 18, health insurance costs are then projected to increase at an average annual rate of 6.6 percent to $7.455 billion in FY 2021, $8.013 billion in FY 2022 and $8.593 billion by FY 2023. The current projections reflect savings of $1.3 billion annually as a result of the 2014 Health Savings Agreement and additional savings of $200 million in FY 2019, $300 million in FY 2020, and $600 million annually in FY 2021 and beyond from the 2018 Health Savings Agreement.[15]
Table 18. Pay-As-You-Go Health Expenditures
| ($ in millions) | FY 2019 | FY 2020 | FY 2021 | FY 2022 | FY 2023 |
| Department of Education | $2,423 | $2,647 | $2,869 | $3,128 | $3,427 |
| CUNY | 105 | 105 | 111 | 140 | 143 |
| All Other | 3,659 | 4,334 | 4,475 | 4,745 | 5,023 |
| Subtotal | $6,187 | $7,086 | $7,455 | $8,013 | $8,593 |
| FY 2019 Prepayment | 300 | 0 | 0 | 0 | 0 |
| Adjusted Pay-As-You-Go Health Insurance Costs | $6,487 | $7,086 | $7,455 | $8,013 | $8,593 |
Cost reductions from the Health Savings Agreements have helped curbed the annual growth of health insurance costs. Expenditures increased at an average annual rate of 3.7 percent over the last five fiscal years from $5.378 billion in FY 2014 to $6.209 billion in FY 2018, compared to an annual increase of 7.6 percent between FY 2010 and FY 2014. As a share of the City’s personal services expenditures, health insurance costs have averaged about 13 percent annually. Going forward health insurance expenditures are projected to increase from 13 percent of FY 2019 estimated personal services expenditures to almost 16 percent of the personal service budget by FY 2023, because health insurance costs are projected to grow faster than the budget as a whole.
Projected premium rates for health insurance remain unchanged from the February Plan. Rates are projected to grow by 6.5 percent in FY 2020, then slow steadily to 6.0 percent in FY 2021, 5.5 percent in FY 2022, and 5.0 percent in FY 2023. Premiums for retiree health insurance are projected to increase by 5 percent in each of FY 2020 through FY 2023. According to the 2018 Health Savings Agreement, any savings from lower rate increases relative to the current projections will be credited toward the health savings goal in the agreement.
Compared to the February Plan, health insurance projections were lowered by $15 million in FY 2019, $19 million in FY 2021, and $22 million in FY 2022. There was an increase in the FY 2020 projection of $10 million while the FY 2023 projection remained approximately the same. The revisions to the projections resulted mainly from the expansion of the City’s hiring freeze that began in FY 2019. The FY 2020 Executive Budget includes the elimination of approximately 1,600 vacant positions across several agencies, resulting in lower health insurance costs of $2 million in FY 2019, $20 million in FY 2020, $28 million in FY 2021, and about $31 million in each of FY 2022 and FY 2023. This is in addition to an average savings of $15 million annually from the previous elimination of about 1,000 vacant positions. Health insurance costs related to the planned increase of 653 positions to support the expansion of special education programs and other funding re-estimates partially offset these reductions in FY 2021 and FY 2022 and more than offset the cost savings in FY 2020 and FY 2023.
Pensions: Actuarial Adjustments Less than Anticipated, Yielding Outyear Savings
The FY 2020 Executive Budget projects pension expenditures of $9.84 billion, relatively flat when compared to the current FY 2019 estimate of $9.82 billion. Pension contributions are then projected to grow to $10.0 billion in FY 2021, $10.45 billion in FY 2022, and $10.51 billion in FY 2023. Compared to the February Plan, pension contributions are higher by $86 million in FY 2019, and lower by $300 million in each of FYs 2021 and 2022, and $450 million in FY 2023.
FY 2020 pension contributions remain relatively unchanged from February. The change in pension contributions reflect mainly the rectification of a coding error related to members who transferred to New York City Employees’ Retirement System(NYCERS) from other pension systems and the adoption of certain actuarial assumptions and methods as recommended by the City’s Chief Actuary.
Over the past several years, approximately 2,900 NYCERS participants who transferred into NYCERS from other retirement systems were coded as members that had transferred out of NYCERS and hence were not included in the data used by the Office of the Actuary (OA). As a result, the costs for these participants’ pension benefits were not funded for several years. The OA has indicated that including these participants has resulted in a liability of $730 million. This liability, which is being amortized over five years (i.e. four payments under the One Year Lag Methodology) will cost all employers in NYCERS a total of $223 million per year in FY 2019 through FY 2022. The City’s portion for this cost is estimated to be $150 million annually through FY 2022.
Pursuant to Chapter 96 of the New York City Charter, Bolton Partners, Inc., (“Bolton”) was hired by the Comptroller’s Office to conduct two consecutive biennial independent actuarial audits of the retirement systems. Bolton has completed both audits and issued draft reports with its findings and recommendations.[16] The Chief Actuary has reviewed the findings and recommendations and subsequently updated the assumptions and methods used to calculate annual employers’ pension contributions beginning with the final FY 2019 employer contribution. The Boards of Trustees of the Systems have approved and adopted the recommendations as presented by the City’s Chief Actuary.
Among the recommendations adopted that affect the City’s cost are:
- The revision of the post-retirement mortality tables for liability-weighted mortality and the application of Mortality Improvement Scale MP-2018.
- Bolton reviewed retiree mortality rates against individual member liabilities. The review showed that higher liability retirees generally lived longer than lower liability retirees.[17] Revising the post-retirement mortality tables to reflect liability-weighted mortality resulted overall in higher pension contributions for the City.
- The additional contribution resulting from the implementation of the liability-weighted mortality table was substantially offset by the adoption of Mortality Improvement Scale MP-2018. The current mortality improvement scale projects lower future rates of mortality improvement when compared to the scale previously used for the post-retirement mortality assumptions.
- Modifications to retirement rate assumptions: Several modifications were made to the assumptions of service retirement rates. These include lowering the assumed retirement rates in the first year of eligibility for members in the General and Sanitation groups of NYCERS, the New York City Teachers’ Retirement System (TRS), the Board of Education Retirement System (BERS), the New York City Police Pension Fund (POLICE) and the New York City Fire Pension Fund (FIRE) in the mandated retirement plans. The assumed retirement rates after the first year of eligibility were lowered for members in the General and Sanitation groups of NYCERS, BERS, and FIRE, but were increased for members in TRS. The assumed retirement rates in the first year and after the first year of eligibility for members of BERS who are in an elected retirement plan were also lowered. In contrast, the assumed retirement rates in the first year and after the first year of eligibility for TRS members in the elected plan were increased. The assumed retirement rates for members eligible for early service retirement were increased for members in the General and Sanitation groups of NYCERS, BERS, and TRS. Lastly, these retirement rates were extended out to age 80 from age 70 for NYCERS General, BERS, and TRS.
- Changes to the ordinary and accidental disability rates: The assumed rates for active service ordinary disability were lowered for members in the General and Sanitation groups of NYCERS, POLICE, and FIRE. The assumed rates of active service accidental disability were lowered for NYCERS General, BERS male, and Police members. The assumed rates for active service accidental disability, however, were increased for NYCERS Correction and BERS female members, and non-WTC eligible FIRE members. Lastly, these active service ordinary and accidental disability rates were extended for NYCERS General, BERS, and TRS to reflect expected longer careers.
- Changes to the active service ordinary and accidental mortality rates: the assumed rates for active service ordinary mortality were lowered for members in the General and Correction groups of NYCERS, BERS, and FIRE, but increased for TRS female members. The assumed rates for active service accidental mortality were decreased for members in NYCERS Correction and FIRE. Lastly, these active service ordinary and accidental mortality rates were extended for NYCERS General, BERS, and TRS to reflect expected longer careers.
- Increase termination rates for members in the General and Correction groups of NYCERS and BERS, but decrease termination rates for members in POLICE.
- Increase in the salary scale for members of POLICE and FIRE, but a decrease in the salary scale for members of NYCERS Sanitation.
- Increase in the assumed overtime rates for members of POLICE, FIRE, and NYCERS (General and Correction).
In addition to the changes to the demographic assumptions, the OA also implemented a technical refinement in performing normal cost calculations under the One-Year-Lag Method (OYLM) as proposed by Bolton.[18] Changes to actuarial assumptions and methods are amortized over a twenty-year period.
Table 19. Changes to City Pension Contributions
| ($ in millions) | FY 2019 | FY 2020 | FY 2021 | FY 2022 | FY 2023 |
| Five Actuarial Systems | $9,765 | $9,680 | $9,600 | $9,816 | $10,084 |
| Other Systems & Reserves | 85 | 270 | 818 | 1,048 | 985 |
| Less: Intra City-Expense | (112) | (112) | (112) | (112) | (112) |
| Net Pension Expense February Plan | $9,738 | $9,838 | $10,306 | $10,752 | $10,957 |
| OA Valuation Adjustments | 0 | 156 | 274 | 367 | 38 |
| Pension Reserve and Financial Plan Savings | 86 | (159) | (597) | (697) | (558) |
| Administrative Expenses | 0 | 0 | 14 | 28 | 56 |
| Other | 0 | 4 | 9 | 2 | 14 |
| Net Pension Expense April Plan | $9,824 | $9,839 | $10,006 | $10,452 | $10,507 |
As shown in Table 19, the net financial impact of all pension data updates, including the correction of the coding error for NYCERS, modifications to the actuarial assumptions and methods, headcount revisions and salary adjustments, increased pension contributions by $156 million in FY 2020, $274 million in FY 2021, $367 million in FY 2022, and $38 million in FY 2023. These additional contributions are more than offset by the drawdown of the pension reserve.[19] In contrast to outyears, the City added $86 million to the FY 2019 pension reserve. The FY 2019 pension contributions are not yet finalized and the $86 million addition is to address any potential increase from the current estimate of the FY 2019 contribution.
Public Assistance: Despite Declining Caseload, City’s Costs Rise Due to State Budget
Through March, the City’s public assistance caseload has averaged 347,965 recipients per month, representing a decline of about 5 percent, or 18,636 recipients, from the monthly average over the same period in FY 2018. In fact, the March caseload of 341,290 marks the lowest number of public assistance recipients on the City’s rolls since July 2014. The FY 2019 year-to-date monthly average grants expenditures are similarly lower by about 5 percent at $118 million, compared with the monthly average of $124 million in FY 2018.
The Executive Budget currently contains public assistance caseload projections at a monthly average of 339,421 for FY 2020 and 339,000 over the remainder of the Financial Plan. These projections are in line with declining caseload levels in the current year. Baseline grants expenditures are projected at about $1.48 billion annually in FYs 2020-2023. These projections represent decreases of about $72 million annually from the February Plan, reflecting recent trends. The City’s share of baseline grants spending has risen sharply from 45 percent in the Preliminary Budget to 53 percent in the Executive Budget, however, because the enacted State budget authorized the imposition of a 10 percent local contribution on the City for the funding of Family Assistance program costs.
Department of Education
The April Modification shows a net increase of $484 million in the Department of Education’s (DOE) FY 2019 budget, which now totals $26.95 billion and represents an increase of 7.4 percent or $1.87 billion above actual FY 2018 spending of $25.08 billion. The increase in the current year is largely attributable to new needs of about $314 million primarily for Carter Cases spending ($203 million), transportation ($59 million) and leases costs ($38 million). In addition, the FY 2019 budget also reflects collective bargaining lump sum payment of $122 million and recognition of $45 million in State aid.
The FY 2020 Executive Budget projects DOE funding at $27.1 billion, an increase of $151 million or less than 1 percent from the FY 2019 budget. The nominal year-to-year increase is mainly due to collective bargaining lump sum payments of nearly $900 million, mainly from the prior teachers’ contract, currently included in the FY 2019 budget. Compared to the Preliminary Budget, the FY 2020 Budget for DOE shows a net increase of $218 million. In the Executive Budget, the Department reflects spending needs totaling $349 million. The highlights of the new needs include a baseline increase for Carter Cases costs ($102 million), charter school tuition ($88 million), special education support services in district early education and citywide programs ($33 million), comprehensive school support ($20 million) and funding to offset State aid shortfall ($74 million). The State aid backfill represents DOE’s portion of the school aid impact from the enacted State budget, with the remainder captured in Building Aid assumption in the Miscellaneous Budget. In addition, the Department’s budget reflects a $33 million increase in adjustments mainly for energy costs and custodial services.
These funding increases are partly offset by the State aid shortfall and additional CSP actions generating net savings of $92 million in FY 2020. The new initiatives in the Executive Budget includes savings consisting mainly of hiring freeze ($21 million), procurement ($27 million) and various program re-estimates including Renewal Schools ($30 million). In addition, DOE is seeking to expand its Federal Medicaid special education reimbursement claiming process to include new revenue for transportation and charter schools, which are estimated to bring in new revenues of about $27 million. The new Medicaid revenues represent funding shifts between Federal and City dollars and therefore have a neutral impact on DOE’s overall budget.
Over the remainder of the plan, funding for the Department is expected to rise to $28.01 billion in FY 2021 and $28.93 billion in FY 2022 before reaching $29.75 billion in FY 2023, reflecting an average increase of $883 million annually. State aid would comprise about $1.32 billion or 50 percent of the projected DOE budget growth of $2.65 billion between FY 2020 and FY 2023, while City funds would provide a $1.46 billion boost in the outyears. Federal and other categorical funds, on the other hand, are expected to decline by $130 million over the same span.
The DOE budget also has not reflected the potential costs from increased charter school tuition rates approved by the State in the outyears. The City has provided a baseline increase of $88 million in FY 2020 – FY 2023 to support the additional tuition costs. However, the new funding will not fully cover charter tuition increases beyond FY 2020. Unless the State provides additional reimbursement in future years, DOE could face risks of $117 million in FY 2021, $250 million in FY 2022 and $399 million in FY 2023. In addition, the DOE will likely face a risk of $20 million in each of FY 2020 – FY 2023 for a new proposal to seek Medicaid reimbursement for eligible special education transportation expenses. While the Medicaid claiming process has improved over the years, with DOE likely to meet its target of $97 million for the first time in FY 2018, the assumptions beginning in FY 2020 include a new proposal to claim for transportation reimbursement which has yet to receive approval from the State.
Homeless Services: Spending Tops $3.2 Billion
The Comptroller’s Office began measuring homeless services expenditures across multiple agencies for the first time during the FY 2016 budget cycle to provide a comprehensive overview of citywide, multi-agency spending on homelessness. As of the FY 2020 Executive Budget, a revision to the Comptroller’s homeless services construct includes new expense categories that have emerged since the original construct was formulated, refines the definition of shelter spending, and accounts for omissions in earlier versions. This updated approach to measuring homeless services spending provides the most comprehensive summary of the City’s homeless services expenditures to date.
Spending on adult and family shelter in the Department of Homeless Services (DHS) is the primary driver of the City’s homelessness expenses. However, funding for homeless assistance is also, and increasingly, drawn from the budgets of other agencies, including the Departments of Social Services, Youth and Community Development, Health and Mental Hygiene, and Veterans Services. Table 20 details funding for seven major categories of homeless services across these agencies. (Note that the numbers presented in this table will not tie to the numbers presented in previous reports due to the change in methodology described above.)
Table 20. Citywide Homeless Services Expenditures
| ($ in millions) | FY 2018 | FY 2019 | FY 2020 | FY 2021 | FY 2022 | FY 2023 |
| Adult Shelter Operations | $709 | $666 | $638 | $638 | $637 | $637 |
| Family Shelter Operations | 1,134 | 1,126 | 1,142 | 1,141 | 1,141 | 1,141 |
| Homeless Administration & Support | 260 | 316 | 324 | 317 | 315 | 315 |
| Rental Assistance | 464 | 546 | 585 | 588 | 583 | 583 |
| Prevention, Diversion, Anti-Eviction & Aftercare | 430 | 463 | 442 | 461 | 461 | 461 |
| Domestic Violence and Youth Shelters | 91 | 111 | 110 | 110 | 110 | 110 |
| Total Citywide Homeless Spending | $3,083 | $3,227 | $3,241 | $3,256 | $3,248 | $3,248 |
Note: FY 2018 actual expenditures; FY 2019 – FY 2023 budgeted.
Since FY 2014, total citywide homeless services expenses have surged by 118% to more than $3.2 billion of planned expenses in the executive FY 2020 budget. This expanded spending coincides with an 11.5 percent rise in the City’s overall shelter census, which includes increases of 9.4 percent among the number of families with children, 34.6 percent among the number of adult families and 57.6 percent among single adults.[20] However, the number of children in shelter has dropped by 7.6 percent since FY 2014.
The FY 2020 Executive Budget proposes to increase spending for family shelter operations by $15.9 million and family shelter administration by $6.4 million from current FY 2019 levels. Family shelter expenses continue to be the single largest driver of homeless services expenses. Meanwhile, as the persistent rise in the single adult shelter census continues without signs of abatement, adult shelter operations expenses in the Executive Budget for FY 2020 have been scheduled to decrease by $27.5 million in total funds compared to their FY 2019 levels. This planned reduction rests on an assumption that the adult shelter population will decline in FY 2020. Given that the single adult shelter census rose by approximately 1,100 from April 24, 2018 to April 24, 2019 and that no major shifts in homelessness policy that could reduce the single adult shelter census have been publicly announced, the executive FY 2020 budget for adult shelter operations appears to be insufficient. Because City funds will account for 87 percent of adult shelter operations spending in FY 2020, the Comptroller’s Office anticipates that a minimum of $20.4 million in City funds will have to be added to the adult shelter operations budget in the next fiscal year.
Capital Budget and Financing Program
Ten-Year Capital Strategy
The City is required by Sections 215 and 234 of the City Charter to issue a Ten-Year Capital Strategy (the Strategy) every odd calendar year. The Strategy for FY 2020 – FY 2029 totals $116.91 billion – $110.71 billion in City-funds and $6.20 billion in non-City funds. This is a $12.81 billion, or 12.3 percent, increase from the Preliminary Ten-Year Capital Strategy published in February 2019 (the “Preliminary Strategy”). The Strategy remains front-loaded with 72 percent of estimated commitments over the first five years.
Approximately $91 billion, or 78 percent of the Strategy is financed with City debt – General Obligation (GO) and Transitional Finance Authority bonds. Another $19.7 billion, or 17 percent of the Strategy is supported by Municipal Water Finance Authority (NYW) debt. Together these funding sources represent the City-funded portion of the Strategy.
Federal, State and private funding support the remaining of 5.3 percent of the Strategy. As shown in Chart 6, a significant portion of Federal funding is concentrated in commitments for Community Facilities and Road and Bridge Works while most of the State funding supports commitments for Educational Facilities work. Of the $4.1 billion of Federal support, $1.87 billion is allocated for Community Facilities and Road and Bridge Works while $1.3 billion of the $2.0 billion in State support is allocated for Education Facilities work. Private funding accounts for only $164 million of non-City funding and support commitments for Road and Bridge Works and Parks and Open Spaces.
Almost 40 percent of total planned commitments are allocated for Educational Facilities and Public Buildings and Facilities, as shown on Chart 6. Commitments for Educational Facilities, which includes DOE and CUNY, total $24.5 billion. Planned commitments for the reconstruction and rehabilitation of existing schools ($14.99 billion) and new school construction ($8.89 billion) comprise the bulk of these commitments.
Estimated commitments for Public Buildings and Facilities total $21.9 billion and is comprised of $8.75 billion for new jail facilities in four of the five boroughs, $5.19 billion for energy efficiency and sustainability projects, along with $1.99 billion for new or renovated court facilities, and $1.28 billion for Department of Sanitation garages and facilities.
Another 35 percent of the Capital Strategy is allocated for Road and Bridge Works, Housing, and Stormwater and Wastewater management. Planned commitments for Road and Bridge works sum to $15.2 billion, over half of which are for the rehabilitation and reconstruction of bridges, including $3.95 billion for the rehabilitation of bridges and highway bridges rated “fair” or “good”, and $3.48 billion for the reconstruction of bridges rated “fair”. Just less than 40 percent of the commitments for Road and Bridge works are allocated for street reconstruction and resurfacing, including $3.09 billion for primary street reconstruction, and $1.57 billion for primary street resurfacing. The remaining commitments Roads and Bridge works are allocated for traffic related and lighting projects, facility reconstruction and sidewalk improvements and reconstruction.
Estimated commitments for Housing sum to $12.8 billion and includes $3.66 billion for the preservation of the existing affordable housing stock by HPD, along with the City’s investment of $3.03 billion for a variety of NYCHA related capital projects, and $2.86 billion for the construction of new affordable housing (HPD).
Chart 6. FY 2020 – FY 2029 Ten-Year Capital Strategy Capital Commitments by Service Category Classification
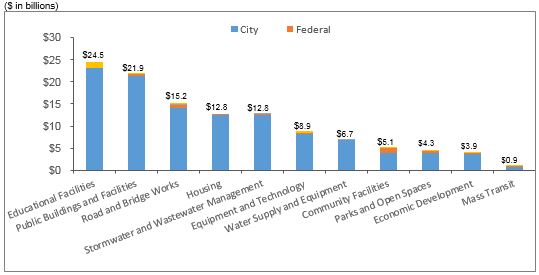
Source: New York City Office of Management & Budget, FY 2020-2029 Ten-Year Capital Strategy, April 2019
The Stormwater and Wastewater category, also at $12.8 billion, is administered by the Dept. of Environmental Protection (DEP) and consists of $5.10 billion for water pollution control plant upgrades and reconstruction, $2.05 billion to address water quality mandates, and $1.87 billion for the replacement and augmentation of sewer systems.
The remaining 25 percent of the Strategy is allocated among six service categories, with over one half of it allocated for Equipment and Technology ($8.9 billion), and Water Supply and Equipment ($6.7 billion). The top three items in the Equipment and Technology category are the Dept. of Sanitation’s trucks and equipment purchases totaling $1.75 billion, citywide computer equipment at $1.57 billion, and computer related equipment for DOITT and Citynet at $820 million. Capital works in the Water Supply and Equipment category includes the reconstruction of the City water tunnels, trunks and distribution main extensions, dam safety and filtration works and various improvements, upgrades and capital maintenance works related to the conveyance and supply of water to the City. Major commitments in this area include $1.54 billion for water main replacements citywide, $1.28 billion for the Kensico Tunnel project upstate, and $1.08 billion for water quality preservation efforts.
Capital commitments in the current capital strategy are allocated among three “lifecycle” project categories: state of good repair, which involves maintaining and repairing facilities and infrastructure, program expansion, which involves adding new or expanding current facilities and infrastructure, and programmatic replacement, which involves replacing facilities or equipment. More than half of the commitments, $59.72 billion, are allocated for state of good repair followed by $29.68 billion for programmatic replacement, and $27.51 billion for program expansion, as shown in Table 21. Thus, state of good repair projects comprise 51 percent, with programmatic replacement at 25 percent, and program expansion accounting for 24 percent of the Strategy.
Educational Facilities, Public Building and Facilities, and Road and Bridge Works constitute just less than 70 percent of commitments for state of good repair, with commitments for Educational Facilities and Road and Bridge Works totaling more than $15 billion each. These commitments account for over 60 percent of planned commitments for Educational Facilities and the entirety of planned commitments for Road and Bridge Works. Details of commitments by service and life cycle category are shown in Table A3 in the appendix on page 47.
Within the program expansion category, Educational Facilities, Housing, and Stormwater and Wastewater projects constitute 68 percent. Highlights include the construction of new schools at $8.89 billion, $5.26 billion of new and special needs housing construction, and $2.93 billion of sewer related projects.
Within the programmatic replacement category, Public Buildings and Facilities, Equipment and Technology, and Stormwater and Wastewater projects make up 88 percent. Projects include $8.75 billion for the design and construction of new borough-based jail facilities, $5.1 billion for upgrades to water pollution control plants, $2.64 billion for citywide information systems and equipment, and $2.05 billion for water quality mandates and preservation.
Table 21. FY 2020 – FY 2029 Ten-Year Capital Strategy Major Capital Commitments by Service Category Classification
| ($ in millions
Service Category |
State of Good Repair | Program Expansion | Programmatic Replacement | Total | Percent of Total |
| Educational Facilities | $15,586 | $8,889 | $3 | $24,478 | 20.9% |
| Public Buildings and Facilities | 10,717 | 265 | 10,904 | 21,886 | 18.7% |
| Road and Bridge Works | 15,162 | 0 | 0 | 15,162 | 13.0% |
| Stormwater and Wastewater Management | 927 | 4,446 | 7,414 | 12,787 | 10.9% |
| Housing | 7,522 | 5,259 | 0 | 12,781 | 10.9% |
| Equipment and Technology | 700 | 318 | 7,879 | 8,897 | 7.6% |
| Water Supply and Treatment | 234 | 3,978 | 2,453 | 6,665 | 5.7% |
| Community Facilities | 4,831 | 120 | 113 | 5,064 | 4.3% |
| Parks and Open Spaces | 4,035 | 315 | 0 | 4,350 | 3.7% |
| Economic Development | 0 | 3,922 | 0 | 3,922 | 3.4% |
| Mass Transit | 6 | 0 | 910 | 916 | 0.8.% |
| Total | $59,720 | $27,514 | $29,676 | $116,909 | 100.0% |
Source: Office of Management and Budget, FY 2020-2029 Ten-Year Capital Strategy, April 2019.
Note: Numbers may not tie due to rounding.
Capital Commitment Plan, FY 2019-2023
The April 2019 Capital Commitment Plan, which covers the five-year period, FYs 2019 – 2023, totals $86.16 billion in authorized all-funds commitments, as shown in Table 22.[21] City-funds commitments account for $79.89 billion of the total. All-funds commitments increased by $2.40 billion, or 2.9 percent, from the February 2019 Commitment Plan, largely due to the inclusion of $2.58 billion in commitments over the course of the Plan for construction of new jail facilities.[22]
All-Funds Commitments
All-funds commitments, after adjusting for the $8.79 billion reserve for unattained commitments, total $77.37 billion, an average of $15.47 billion per year. Approximately 19 percent of all-funds commitments are scheduled for FY 2019, reflecting the City’s success in reducing the front loading of the five-year Plan, which in the past 27 plans had ranged from 21 to 55 percent (an average of 37 percent) of commitments in the first year.
Similar to past capital commitment plans, commitments for DOE and CUNY, the Department of Environmental Protection (DEP), the Department of Transportation (DOT) and Mass Transit, and Housing and Economic Development account for a majority of total commitments at $57.45 billion, or 67.0 percent of total commitments.[23]
Table 22. April Plan FY 2019 – FY 2023 All-Funds Capital Commitments
($ in millions)Project Category |
Apr 2019 FY 2019 – FY 2023 Commitment Plan |
Percent of Total |
Change from Feb 2019 Plan |
Education and CUNY |
$19,519 |
22.7% |
$141 |
Environmental Protection |
12,927 |
15.0 |
($416) |
Dept. of Transportation and Mass Transit |
12,037 |
14.0 |
(64) |
Housing and Economic Development |
12,964 |
15.0 |
(19) |
Administration of Justice |
7,712 |
8.9 |
2,565 |
Resiliency, Technology and Equipment |
5,144 |
6.0 |
116 |
Parks Department |
4,536 |
5.3 |
60 |
Hospitals |
2,777 |
3.2 |
27 |
Other City Operations and Facilities |
8,546 |
9.9 |
(13) |
Total Authorized Commitment |
$86,162 |
100.0% |
$2,398 |
Reserve for Unattained Commitments |
(8,789) |
N/A |
(1,444) |
Total Net of Reserve for Unattained Commitments |
$77,373 |
N/A |
$954 |
Source: NYC Office of Management and Budget, FYS 2019 – 2023 April Capital Commitment Plan, April 2019. Numbers may not add due to rounding.
The net increase of $2.40 billion in authorized commitments from the February 2019 Plan is comprised of increases of $3.16 billion in FY 2022, and $3.09 billion in FY 2023, offset by decreases of $3.03 billion in FY 2019, $194 million in FY 2020, and $628 million in FY 2021.
A significant portion of the FY 2019 decrease stems from the rolling out of FY 2019 commitments into future years, including $953 million for DOE, $471 million in the Department of Correction (DOC), and $281 million for the Parks Department. In FY 2020, the decrease of $194 million is driven by reductions of $483 million in the DOC reflecting rollovers to subsequent years, and a decrease of $372 million in highway bridges projects, partially offset by an increase to DOE of $631 million and a net increase of $30 million from revisions across 37 different project types.
The decrease of $628 million in FY 2021 is driven by reductions of $421 million in Parks Department related commitments, $302 million in highway bridges projects, and $292 million in economic development related projects and a net decrease of $96 million across 36 project types. These decreases are offset, in part, by an increase of $482 million to DOC.
The increase of $3.16 billion in FY 2022 reflects the impact of better estimates on the timing of various projects. This is largely comprised of increases of $839 million in the Parks Department, an increase of $823 million in the DOC, $207 million in highway bridge projects, an increase of $205 million in the DOE, and a net increase of $1.09 billion across 36 other project types.
In FY 2023, over 70 percent of the $3.09 billion increase is for the planned construction of new jail facilities, with an estimated $2.23 billion in commitments.
Financing Program
The April 2019 Financial Plan for FY 2019 – FY 2023 contains $54.06 billion of planned borrowing, as shown in Table 23. The borrowing is comprised of $20.67 billion of GO bonds, $23.95 billion of TFA borrowing, $8.71 billion of NYW borrowing and $737 million of borrowing from TFA Building Aid Revenue Bonds (BARB) that are supported by State building aid revenues.
Table 23. April 2019 Financial Plan Financing Program
| ($ in millions) | Estimated Borrowing and Funding Sources FY 2019 – FY 2023 | Percent of Total |
| General Obligation Bonds | $20,670 | 38.2% |
| TFA – PIT Bonds | 23,945 | 44.3 |
| NYC Water Finance Authority | 8,711 | 16.1 |
| TFA – BARBs | 737 | 1.4 |
| Total | $54,063 | 100.0% |
Source: NYC Office of Management and Budget, April 2019 Financial Plan.
Total projected borrowing in the April Plan for FY 2019 through FY 2022 is $579 million less than the February 2019 Financial Plan estimate. This is comprised of a decrease of $779 million in FY 2019, offset by an increase of $200 million in FY 2020. The outyears of the Plan remain unchanged. GO borrowing decreased by $1.1 billion in FY 2019 due to the elimination of a fourth quarter borrowing. TFA PIT, however, increased by $575 million in FY 2019. Both GO and TFA PIT borrowing remain unchanged from the prior Plan over FYs 2020-2023 NYW borrowing in FY 2019 is reduced by $254 million, while FY 2020 borrowing increased by $200 million, reflecting a delay in some issuance to FY 2020. As in the February 2019 Plan estimate, the current estimated borrowing for FY 2023 would represent the highest level of borrowing in the City’s history at $13.02 billion across all four financing sources. This reflects the anticipated commitment levels over FY 2019-2023 previously discussed in “Capital Commitment Plan” beginning on page 41.
Debt Service
As shown in Table 24, debt service, net of prepayments, in the April Plan totals $6.70 billion in FY 2019, $7.32 billion in FY 2020, $7.71 billion in FY 2021, $8.39 billion in FY 2022, and $9.15 billion in FY 2023.[24] These amounts represent decreases from the February 2019 Financial Plan of $106 million in FY 2019, $107 million in FY 2020, $32 million in FY 2021, $21 million in FY 2022, and $16 million in FY 2023. Between FY 2019 and FY 2023, total debt service is expected to increase by $2.44 billion, or 36.5 percent. These projections do not include debt service of the NYW, which is backed by water and sewer user fees, and that of the TFA BARBs, which is supported by New York State building aid.
Table 24. April 2019 Financial Plan Debt Service Estimates
| ($ in millions) | FY 2019 | FY 2020 | FY 2021 | FY 2022 | FY 2023 | Change FY 2019 –
FY 2023 |
% Change FY 2019 – FY 2023 |
|
| GO | $3,775 | $4,082 | $4,191 | $4,524 | $4,885 | $1,110 | 29.4% | |
| TFAa | 2,733 | 3,031 | 3,308 | 3,666 | 4,038 | 1,305 | 47.7% | |
| Lease-Purchase | 122 | 126 | 126 | 126 | 147 | 25 | 20.5% | |
| TSASC, Inc. | 72 | 82 | 82 | 76 | 76 | 4 | 5.6% | |
| Total | $6,702 | $7,321 | $7,707 | $8,392 | $9,146 | $2,444 | 36.5% | |
Source: April 2019 Financial Plan.
notes: Debt service is adjusted for prepayments. Amounts do not include TFA BARBs.
The $106 million decrease in FY 2019 is due to GO savings of $67 million, and TFA savings of $39 million. The GO savings stem primarily from a $47 million reduction in estimated variable-rate interest costs, and $11 million in savings from a completed bond refunding. The decrease in TFA debt service results primarily from lower variable rate interest costs ($26 million) and a revision in the assumptions for excess building aid revenues available for the payment of TFA FTS debt service ($13 million).
In FY 2020, the projected reduction of $107 million is comprised of GO savings of $67 million from the elimination of the FY 2019 4th quarter borrowing, $29 million from the continuing impact of the afore-mentioned refunding transaction, and other GO baseline adjustments of $29 million, offset by $15 million in additional estimated TFA debt service costs.
The estimated $32 million decrease in FY 2021 stems from GO debt service savings of $80 million from the elimination of the FY 2019 GO borrowing, $29 million in refunding savings, along with other GO baseline savings adjustments of $29 million, offset by a $106 million increase in projected TFA debt service re-estimates. The savings in FY 2022 and 2023 follow a similar pattern to that of FY 2021.[25]
Debt Affordability
Debt service as a percent of local tax revenues and as a percent of total-funds revenues are commonly used measures of debt affordability.[26] In FY 2018, the City’s debt service was 10.3 percent of local tax revenues. The April Plan projects debt service will consume 10.9 percent of local tax revenues in FY 2019, 11.5 percent in FY 2020, 11.7 percent in FY 2021, 12.4 percent in FY 2022 and 13.1 percent in FY 2023, as shown in Chart 7.[27] The upward trend in the debt service to tax revenue ratio reflects the disparity between debt service and tax revenue growth rates over the Plan period. Debt service is projected to grow at an average annual rate of 8.1 percent from FY 2019 to FY 2023 while tax revenue during this period is projected to grow 3.2 percent annually. Based on an assumption of 4 percent annual tax revenue growth in FY 2023 through FY 2029, the City projects this ratio to remain fairly constant at average of 13.2 percent over this period.
Even at half the assumed annual tax revenue growth, this ratio would still not exceed the 15 percent threshold that is considered prudent. Tax revenue growth would have to fall below 1.2 percent per year after FY 2023 for the ratio to breach 15 percent by FY 2028 as shown on Chart 8.
Chart 7. NYC Debt Service as a Percent of Tax Revenues
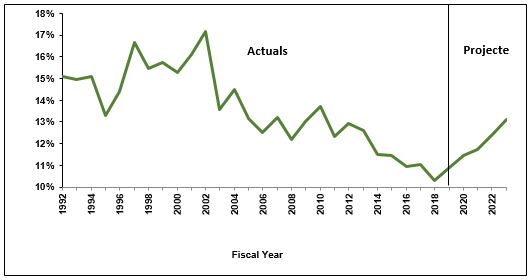
Source: Office of the NYC Comptroller, Comprehensive Annual Financial Reports, FY 1992 – FY 2018.
Chart 8. NYC Debt Service as a Percent of Tax Revenues
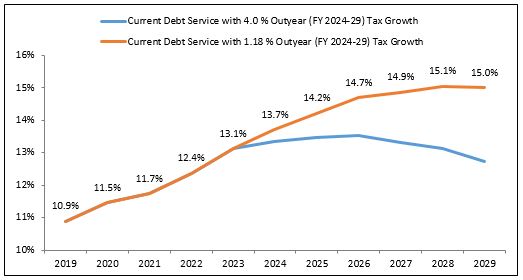
Source: NYC Office of Management and Budget, April 2019 Financial Plan.
Debt service is also projected to grow at a faster rate than total revenues (including taxes, non-tax revenues, and Federal, State and other categorical aid) over the plan period. As such, debt service is projected to consume an increasing share of the total budget. As shown in Chart 9, the City’s debt service as a percent of all-funds revenues is estimated to be 7.2 percent in FY 2019, 7.9 percent in FY 2020, 8.2 percent in FY 2021, 8.7 percent in FY 2022, and 9.2 percent in FY 2023. The debt service growth of 8.1 percent over the Financial Plan period is significantly higher than the projected total revenue growth of 1.7 percent.
Chart 9. NYC Debt Service as a Percent of Total Revenues
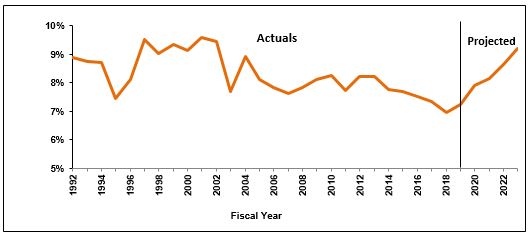
Source: Office of the NYC Comptroller, Comprehensive Annual Financial Reports, FY 1992 – FY 2018,
and NYC Office of Management and Budget, April 2019 Financial Plan.
Appendix
Table A1. April 2019 Financial Plan Revenue Detail
| ($ in millions) | FY 2019 | FY 2020 | FY 2021 | FY 2022 | FY 2023 | Change FYs 2019 – 2023 Dollars Percent |
Annual Percent Change | |
| Taxes: | ||||||||
| Real Property | $27,976 | $29,711 | $31,089 | $32,328 | $33,286 | $5,310 | 19.0% | 4.4% |
| Personal Income Tax | 12,729 | 13,145 | 13,429 | 13,856 | 14,296 | 1,567 | 12.3% | 2.9% |
| General Corporation Tax | 3,930 | 3,722 | 3,727 | 3,790 | 3,815 | (115) | (2.9%) | (0.7%) |
| Banking Corporation Tax | (60) | 0 | 0 | 0 | 0 | 60 | (100.0%) | (100.0%) |
| Unincorporated Business Tax | 2,103 | 2,141 | 2,294 | 2,352 | 2,415 | 312 | 14.8% | 3.5% |
| Sale and Use Tax | 7,827 | 8,267 | 8,553 | 8,852 | 9,134 | 1,307 | 16.7% | 3.9% |
| Real Property Transfer | 1,498 | 1,486 | 1,504 | 1,544 | 1,586 | 88 | 5.9% | 1.4% |
| Mortgage Recording Tax | 1,073 | 958 | 968 | 991 | 1,014 | (59) | (5.5%) | (1.4%) |
| Commercial Rent | 887 | 870 | 894 | 930 | 965 | 78 | 8.8% | 2.1% |
| Utility | 386 | 397 | 410 | 421 | 430 | 44 | 11.4% | 2.7% |
| Hotel | 626 | 627 | 630 | 643 | 658 | 32 | 5.1% | 1.3% |
| Cigarette | 36 | 34 | 33 | 32 | 31 | (5) | (13.9%) | (3.7%) |
| All Other | 814 | 768 | 769 | 769 | 769 | (45) | (5.5%) | (1.4%) |
| Tax Audit Revenue | 1,058 | 999 | 721 | 721 | 721 | (337) | (31.9%) | (9.1%) |
| Total Taxes | $60,883 | $63,125 | $65,021 | $67,229 | $69,120 | $8,237 | 13.5% | 3.2% |
| Miscellaneous Revenue: | ||||||||
| Licenses, Franchises, Etc. | $795 | $758 | $742 | $748 | $752 | ($43) | (5.4%) | (1.4%) |
| Interest Income | 213 | 235 | 252 | 254 | 256 | 43 | 20.2% | 4.7% |
| Charges for Services | 1,016 | 1,018 | 1,015 | 1,015 | 1,015 | (1) | (0.1%) | (0.0%) |
| Water and Sewer Charges | 1,453 | 1,509 | 1,513 | 1,496 | 1,490 | 37 | 2.5% | 0.6% |
| Rental Income | 272 | 255 | 250 | 250 | 250 | (22) | (8.1%) | (2.1%) |
| Fines and Forfeitures | 1,047 | 1,015 | 977 | 964 | 960 | (87) | (8.3%) | (2.1%) |
| Miscellaneous | 1,049 | 346 | 345 | 342 | 342 | (707) | (67.4%) | (24.4%) |
| Intra-City Revenue | 2,220 | 1,819 | 1,817 | 1,815 | 1,814 | (406) | (18.3%) | (4.9%) |
| Total Miscellaneous Revenue | $8,065 | $6,955 | $6,911 | $6,884 | $6,879 | ($1,186) | (14.7%) | (3.9%) |
| Unrestricted Intergovernmental Aid | $201 | $0 | $0 | $0 | $0 | ($201) | (100.0%) | (100.0%) |
| Reserve for Disallowance of Categorical Grants | $91 | ($15) | ($15) | ($15) | ($15) | ($106) | (116.5%) | NA |
| Less: Intra-City Revenue | ($2,220) | ($1,819) | ($1,817) | ($1,815) | ($1,814) | $406 | (18.3%) | (4.9%) |
| TOTAL CITY-FUNDS | $67,020 | $68,246 | $70,100 | $72,283 | $74,170 | $7,150 | 10.7% | 2.6% |
| ($ in millions) | FY 2019 | FY 2020 | FY 2021 | FY 2022 | FY 2023 | Change FYs 2019 – 2023 Dollars Percent |
Annual Percent Change | |
| Other Categorical Grants | $1,207 | $928 | $870 | $863 | $863 | ($344) | (28.5%) | (8.0%) |
| Inter-Fund Agreements | $657 | $735 | $672 | $672 | $672 | ($15) | (2.3%) | (0.6%) |
| Federal Categorical Grants: | ||||||||
| Community Development | $1,009 | $399 | $294 | $278 | $252 | ($757) | (75.0%) | (29.3%) |
| Welfare | 3,726 | 3,348 | 3,347 | 3,347 | 3,347 | (379) | (10.2%) | (2.6%) |
| Education | 1,848 | 2,106 | 2,108 | 2,071 | 2,071 | 223 | 12.1% | 2.9% |
| Other | 1,911 | 1,373 | 1,320 | 1,302 | 1,296 | (615) | (32.2%) | (9.3%) |
| Total Federal Grants | $8,494 | $7,226 | $7,069 | $6,998 | $6,966 | ($1,528) | (18.0%) | (4.8%) |
| State Categorical Grants | ||||||||
| Social Services | $1,908 | $1,832 | $1,831 | $1,823 | $1,823 | ($85) | (4.5%) | (1.1%) |
| Education | 11,202 | 11,386 | 11,817 | 12,256 | 12,708 | 1,506 | 13.4% | 3.2% |
| Higher Education | 296 | 288 | 288 | 288 | 288 | (8) | (2.7%) | (0.7%) |
| Department of Health and Mental Hygiene | 661 | 501 | 486 | 486 | 486 | (175) | (26.5%) | (7.4%) |
| Other | 1,406 | 1,326 | 1,297 | 1,333 | 1,388 | (18) | (1.3%) | (0.3%) |
| Total State Grants | $15,473 | $15,333 | $15,719 | $16,186 | $16,693 | $1,220 | 7.9% | 1.9% |
| TOTAL REVENUES | $92,851 | $92,468 | $94,430 | $97,002 | $99,364 | $6,513 | 7.0% | 1.7% |
Note: Numbers may not add due to rounding.
Table A2. April 2019 Financial Plan Expenditure Detail
| ($ in millions) | FY 2019 | FY 2020 | FY 2021 | FY 2022 | FY 2023 | Change FYs 2019 – 2023 Dollars Percent |
Annual Percent Change |
|
| Mayoralty | $153 | $155 | $150 | $149 | $146 | ($7) | (4.8%) | (1.2%) |
| Board of Elections | 161 | 246 | 131 | 131 | 131 | (30) | (18.7%) | (5.0%) |
| Campaign Finance Board | 32 | 28 | 14 | 14 | 14 | (18) | (55.5%) | (18.3%) |
| Office of the Actuary | 7 | 7 | 7 | 7 | 7 | 0 | 7.1% | 1.7% |
| President, Borough of Manhattan | 5 | 5 | 5 | 5 | 5 | (0) | (5.5%) | (1.4%) |
| President, Borough of Bronx | 6 | 6 | 6 | 6 | 6 | (0) | (6.6%) | (1.7%) |
| President, Borough of Brooklyn | 7 | 7 | 6 | 6 | 6 | (1) | (12.6%) | (3.3%) |
| President, Borough of Queens | 6 | 6 | 5 | 5 | 5 | (1) | (21.5%) | (5.9%) |
| President, Borough of Staten Island | 5 | 5 | 4 | 4 | 4 | (0) | (4.0%) | (1.0%) |
| Office of the Comptroller | 110 | 113 | 113 | 113 | 113 | 3 | 2.8% | 0.7% |
| Dept. of Emergency Management | 72 | 39 | 29 | 29 | 29 | (43) | (59.6%) | (20.3%) |
| Office of Administrative Tax Appeals | 5 | 6 | 6 | 6 | 6 | 0 | 4.2% | 1.0% |
| Law Dept. | 253 | 247 | 248 | 248 | 248 | (5) | (2.0%) | (0.5%) |
| Dept. of City Planning | 50 | 48 | 44 | 42 | 41 | (9) | (17.2%) | (4.6%) |
| Dept. of Investigation | 49 | 45 | 54 | 54 | 54 | 5 | 10.4% | 2.5% |
| NY Public Library — Research | 28 | 29 | 29 | 29 | 29 | 0 | 1.6% | 0.4% |
| New York Public Library | 145 | 141 | 142 | 142 | 142 | (3) | (2.1%) | (0.5%) |
| Brooklyn Public Library | 109 | 106 | 106 | 107 | 107 | (2) | (1.9%) | (0.5%) |
| Queens Borough Public Library | 113 | 111 | 111 | 112 | 112 | (1) | (1.2%) | (0.3%) |
| Dept. of Education | 26,950 | 27,101 | 28,013 | 28,931 | 29,749 | 2,799 | 10.4% | 2.5% |
| City University | 1,169 | 1,159 | 1,167 | 1,182 | 1,198 | 29 | 2.5% | 0.6% |
| Civilian Complaint Review Board | 19 | 18 | 18 | 18 | 18 | (0) | (1.8%) | (0.5%) |
| Police Dept. | 5,654 | 5,307 | 5,273 | 5,263 | 5,263 | (391) | (6.9%) | (1.8%) |
| Fire Dept. | 2,136 | 2,089 | 2,087 | 2,066 | 2,066 | (70) | (3.3%) | (0.8%) |
| Dept. of Veterans’ Services | 5 | 5 | 5 | 5 | 5 | 0 | 0.6% | 0.2% |
| Admin. for Children Services | 3,187 | 2,655 | 2,685 | 2,677 | 2,677 | (510) | (16.0%) | (4.3%) |
| Dept. of Social Services | 10,163 | 10,202 | 10,071 | 10,062 | 10,061 | (102) | (1.0%) | (0.3%) |
| Dept. of Homeless Services | 2,125 | 2,117 | 2,109 | 2,106 | 2,107 | (18) | (0.9%) | (0.2%) |
| Dept. of Correction | 1,379 | 1,361 | 1,409 | 1,406 | 1,406 | 27 | 2.0% | 0.5% |
| Board of Correction | 3 | 3 | 3 | 3 | 3 | 0 | 11.1% | 2.7% |
| Citywide Pension Contribution | 9,824 | 9,839 | 10,005 | 10,452 | 10,507 | 683 | 7.0% | 1.7% |
| Miscellaneous | 10,400 | 12,267 | 12,949 | 12,768 | 13,694 | 3,293 | 31.7% | 7.1% |
| Debt Service | 3,897 | 4,208 | 4,317 | 4,649 | 5,032 | 1,135 | 29.1% | 6.6% |
| T.F.A. Debt Service | 2,733 | 3,031 | 3,308 | 3,666 | 4,038 | 1,305 | 47.7% | 10.2% |
| FY 2018 BSA and Discretionary Transfers | (4,576) | 0 | 0 | 0 | 0 | 4,576 | (100.0%) | (100.0%) |
| FY 2019 BSA | 3,516 | (3,516) | 0 | 0 | 0 | (3,516) | (100.0%) | (100.0%) |
| Public Advocate | 4 | 4 | 4 | 4 | 4 | 0 | 3.0% | 0.7% |
| City Council | 83 | 88 | 56 | 56 | 56 | (26) | (31.6%) | (9.1%) |
| City Clerk | 6 | 6 | 6 | 6 | 6 | 0 | 2.3% | 0.6% |
| Dept. for the Aging | 395 | 363 | 363 | 363 | 363 | (32) | (8.0%) | (2.1%) |
| Dept. of Cultural Affairs | 202 | 145 | 149 | 149 | 149 | (52) | (26.0%) | (7.2%) |
| Financial Info. Serv. Agency | 112 | 115 | 112 | 112 | 112 | (1) | (0.6%) | (0.1%) |
| Office of Payroll Admin. | 16 | 17 | 16 | 16 | 16 | (0) | (0.2%) | (0.1%) |
| Independent Budget Office | 5 | 6 | 5 | 5 | 5 | 0 | 2.1% | 0.5% |
| Equal Employment Practices | 1 | 1 | 1 | 1 | 1 | 0 | 7.7% | 1.9% |
| Civil Service Commission | 1 | 1 | 1 | 1 | 1 | 0 | 10.1% | 2.4% |
| Landmarks Preservation Commission | 7 | 7 | 7 | 7 | 7 | (0) | (2.3%) | (0.6%) |
| Taxi & Limousine Commission | 51 | 52 | 53 | 54 | 54 | 3 | 5.1% | 1.2% |
| Commission on Human Rights | 14 | 14 | 14 | 14 | 14 | 0 | 2.9% | 0.7% |
| Youth & Community Development | 733 | 622 | 594 | 595 | 595 | (138) | (18.8%) | (5.1%) |
| Conflicts of Interest Board | 3 | 3 | 3 | 3 | 3 | 0 | 0.2% | 0.1% |
| Office of Collective Bargaining | 2 | 2 | 2 | 2 | 2 | 0 | 5.6% | 1.4% |
| Community Boards (All) | 21 | 19 | 19 | 19 | 19 | (2) | (11.3%) | (2.9%) |
| Dept. of Probation | 110 | 111 | 112 | 112 | 112 | 2 | 1.9% | 0.5% |
| Dept. Small Business Services | 300 | 188 | 161 | 140 | 139 | (161) | (53.7%) | (17.5%) |
| Housing Preservation & Development | 1,372 | 985 | 990 | 1,007 | 991 | (381) | (27.8%) | (7.8%) |
| Dept. of Buildings | 199 | 200 | 190 | 190 | 183 | (16) | (8.2%) | (2.1%) |
| Dept. of Health & Mental Hygiene | 1,855 | 1,683 | 1,680 | 1,682 | 1,682 | (173) | (9.3%) | (2.4%) |
| NYC Health + Hospitals | 829 | 914 | 951 | 1,000 | 1,001 | 173 | 20.8% | 4.8% |
| Office of Administrative Trials & Hearings | 49 | 51 | 52 | 51 | 51 | 2 | 4.8% | 1.2% |
| Dept. of Environmental Protection | 1,436 | 1,366 | 1,359 | 1,340 | 1,333 | (103) | (7.2%) | (1.8%) |
| Dept. of Sanitation | 1,758 | 1,747 | 1,741 | 1,734 | 1,720 | (38) | (2.1%) | (0.5%) |
| Business Integrity Commission | 9 | 10 | 10 | 10 | 10 | 1 | 8.8% | 2.1% |
| Dept. of Finance | 308 | 309 | 306 | 306 | 306 | (2) | (0.6%) | (0.1%) |
| Dept. of Transportation | 1,066 | 1,084 | 1,039 | 1,039 | 1,039 | (27) | (2.5%) | (0.6%) |
| Dept. of Parks and Recreation | 529 | 479 | 477 | 477 | 477 | (52) | (9.8%) | (2.6%) |
| Dept. of Design & Construction | 264 | 189 | 165 | 165 | 165 | (100) | (37.7%) | (11.2%) |
| Dept. of Citywide Admin. Services | 493 | 483 | 526 | 537 | 529 | 36 | 7.3% | 1.8% |
| D.O.I.T.T. | 573 | 542 | 569 | 566 | 566 | (7) | (1.2%) | (0.3%) |
| Dept. of Record & Info. Services | 10 | 12 | 15 | 16 | 16 | 6 | 59.3% | 12.3% |
| Dept. of Consumer Affairs | 41 | 41 | 42 | 42 | 42 | 1 | 2.8% | 0.7% |
| District Attorney – N.Y. | 129 | 112 | 113 | 113 | 113 | (17) | (12.9%) | (3.4%) |
| District Attorney – Bronx | 83 | 83 | 84 | 84 | 84 | 1 | 1.7% | 0.4% |
| District Attorney – Kings | 112 | 110 | 111 | 111 | 111 | (1) | (0.5%) | (0.1%) |
| District Attorney –Queens | 72 | 69 | 70 | 70 | 70 | (3) | (3.8%) | (1.0%) |
| District Attorney – Richmond | 17 | 16 | 16 | 16 | 16 | (1) | (5.8%) | (1.5%) |
| Office of Prosec. & Special Narc. | 24 | 24 | 24 | 24 | 24 | 1 | 2.9% | 0.7% |
| Public Administrator – N.Y. | 3 | 1 | 1 | 1 | 1 | (2) | (58.2%) | (19.6%) |
| Public Administrator – Bronx | 1 | 1 | 1 | 1 | 1 | 0 | 2.5% | 0.6% |
| Public Administrator – Brooklyn | 1 | 1 | 1 | 1 | 1 | 0 | 3.5% | 0.9% |
| Public Administrator – Queens | 1 | 1 | 1 | 1 | 1 | 0 | 4.7% | 1.1% |
| Public Administrator – Richmond | 1 | 1 | 1 | 1 | 1 | 0 | 2.0% | 0.5% |
| Prior Payable Adjustment | (400) | 0 | 0 | 0 | 0 | 400 | (100.0%) | (100.0%) |
| General Reserve | 50 | 1,000 | 1,000 | 1,000 | 1,000 | 950 | 1,900.0% | 111.5% |
| Citywide Savings Initiatives | 0 | (1) | (52) | (58) | (60) | (60) | NA | NA |
| Energy Adjustment | 0 | 0 | 25 | 45 | 79 | 79 | NA | NA |
| Lease Adjustment | 0 | 0 | 37 | 75 | 114 | 114 | NA | NA |
| OTPS Inflation Adjustment | 0 | 0 | 56 | 111 | 167 | 167 | NA | NA |
| TOTAL EXPENDITURES | $92,851 | $92,468 | $97,911 | $99,882 | $102,522 | $9,671 | 10.4% | 2.5% |
Note: Numbers may not add due to rounding.
Table A3. Ten Year Capital Strategy by Life Cycle Category
| ($ in millions) | State of Good Repair | Program Expansion | Programmatic Replacement | Total |
| Community Facilities | ||||
| Access for the Handicapped | $1 | $0 | $0 | $1 |
| Administration | 0 | 0 | 6 | 6 |
| Animal Care | 0 | 94 | 0 | 94 |
| Child Welfare Facilities | 223 | 0 | 0 | 223 |
| Clinic Renovation and Rehabilitation | 318 | 0 | 0 | 318 |
| Day Care Facilities | 52 | 0 | 0 | 52 |
| Department for the Aging Building Reconstruction | 39 | 0 | 0 | 39 |
| Essential Reconstruction of Facilities | 1,426 | 0 | 0 | 1,426 |
| Expansion and Construction of Facilities | 0 | 7 | 0 | 7 |
| Expansion and Construction of Research Libraries | 0 | 1 | 0 | 1 |
| Improvements to Existing Facilities | 45 | 0 | 1 | 46 |
| Major Or Partial Hospital Reconstruction | 0 | 0 | 5 | 5 |
| New Technology and Construction | 0 | 19 | 0 | 19 |
| Reconstruction Necessary to Maintain Facilities | 71 | 0 | 0 | 71 |
| Rehabilitation and Relocation pf Branch Libraries | 0 | 0 | 0 | 0 |
| Replacement Branches | 0 | 0 | 63 | 63 |
| Routine Reconstruction | 1,920 | 0 | 0 | 1,920 |
| Shelters for Homeless Families | 181 | 0 | 0 | 181 |
| Shelters for Homeless Individuals | 424 | 0 | 0 | 424 |
| Social Service Buildings | 45 | 0 | 0 | 45 |
| Social Services Buildings | 88 | 0 | 0 | 88 |
| Support Services Improvements | 0 | 0 | 37 | 37 |
| Subtotal | $4,831 | $120 | $113 | $5,064 |
| Economic Development | ||||
| Commercial Development | $0 | $413 | $0 | $413 |
| Community Development | 0 | 147 | 0 | 147 |
| Industrial Development | 0 | 607 | 0 | 607 |
| Market Development | 0 | 128 | 0 | 128 |
| Miscellaneous | 0 | 329 | 0 | 329 |
| Neighborhood Revitalization | 0 | 1,582 | 0 | 1,582 |
| Waterfront Development | 0 | 715 | 0 | 715 |
| Subtotal | $0 | $3,922 | $0 | $3,922 |
| Educational Facilities | ||||
| Athletic Fields, Gymnasiums and Equipment | $0 | $0 | $0 | $0 |
| Educational Enhancements | 2,296 | 0 | 0 | 2,296 |
| Emergency, Inspection and Miscellaneous | 4,571 | 0 | 0 | 4,571 |
| Energy Conservation Projects | 0 | 0 | 3 | 3 |
| Federal, State and Local Mandates | 0 | 0 | 0 | 0 |
| Miscellaneous Reconstruction | 597 | 0 | 0 | 597 |
| New School Construction | 0 | 28 | 0 | 28 |
| Rehabilitation of School Components | 7,644 | 0 | 0 | 7,644 |
| Safety and Security | 478 | 0 | 0 | 478 |
| System Expansion (New Schools) | 0 | 6,576 | 0 | 6,576 |
| System Expansion (Other) | 0 | 2,286 | 0 | 2,286 |
| Subtotal | $15,586 | $8,889 | $3 | $24,478 |
| ($ in millions) | State of Good Repair | Program Expansion | Programmatic Replacement | Total |
| Equipment and Technology | ||||
| Automotive and Other Equipment | $0 | $0 | $39 | $39 |
| Automotive Equipment | 0 | 0 | 4 | 4 |
| Bridge Vehicles | 0 | 0 | 18 | 18 |
| Capital Equipment | 0 | 0 | 31 | 31 |
| Communications | 0 | 0 | 124 | 124 |
| Communications Equipment | 0 | 0 | 170 | 170 |
| Communications, Surveillance Equipment | 5 | 0 | 0 | 5 |
| Computer Equipment | 0 | 0 | 181 | 181 |
| Conservation for Water Meter Replacements | 0 | 0 | 74 | 74 |
| Data Processing and Information Technology | 0 | 0 | 21 | 21 |
| Data Processing and Other Equipment | 0 | 0 | 38 | 38 |
| Data Processing Equipment | 0 | 0 | 199 | 199 |
| Electrical, Mechanical and HVAC System Upgrading | 0 | 0 | 0 | 0 |
| Electronic Data Processing Equipment – City-Wide | 0 | 0 | 1,571 | 1,571 |
| Electronic Data Processing Equipment – FISA | 0 | 0 | 92 | 92 |
| Electronic Data Processing Equipment for DOITT, Citynet | 0 | 0 | 820 | 820 |
| Electronics and Data Processing | 0 | 0 | 142 | 142 |
| Emergency Medical Services Equipment | 0 | 0 | 413 | 413 |
| Equipment | 0 | 0 | 2,112 | 2,112 |
| Equipment And Interagency Services | 0 | 0 | 139 | 139 |
| Equipment And Vehicles | 0 | 0 | 99 | 99 |
| Equipment For Bridge Maintenance | 0 | 0 | 6 | 6 |
| Information Systems | 0 | 0 | 248 | 248 |
| Information Technology | 47 | 0 | 0 | 47 |
| Information Technology And Telecommunications | 0 | 0 | 49 | 49 |
| Laboratories | 3 | 0 | 0 | 3 |
| Major Medical Equipment | 0 | 0 | 34 | 34 |
| Management Information Systems | 0 | 0 | 161 | 161 |
| Miscellaneous Equipment | 0 | 0 | 36 | 36 |
| OCME | 0 | 58 | 0 | 58 |
| Purchase Of Vehicles | 0 | 0 | 0 | 0 |
| Replacement Of Electrical Distribution Systems | 31 | 0 | 0 | 31 |
| Security Systems | 0 | 0 | 0 | 0 |
| Signal Installation And Computerization | 294 | 0 | 0 | 294 |
| Smart Schools Bond Act | 0 | 260 | 0 | 260 |
| Telecommunications Equipment | 35 | 0 | 0 | 35 |
| Utility Relocation For Se And Wm Projects | 0 | 0 | 179 | 179 |
| Vehicles | 0 | 0 | 185 | 185 |
| Vehicles And Equipment | 241 | 0 | 37 | 278 |
| Vehicles, Firefighting Tools And Equipment | 0 | 0 | 656 | 656 |
| Water For The Future | 44 | 0 | 0 | 44 |
| Subtotal | $700 | $318 | $7,879 | $8,897 |
| Housing | ||||
| Low To Moderate Income Public Housing Construction | $80 | $0 | $0 | $80 |
| Low To Moderate Income Public Housing Upgrade | 2,954 | 0 | 0 | 2,954 |
| New Housing Construction | 0 | 2,860 | 0 | 2,860 |
| Occupied In Rem Rehabilitation | 600 | 0 | 0 | 600 |
| Other Housing Support Investment | 232 | 0 | 0 | 232 |
| Preservation | 3,655 | 0 | 0 | 3,655 |
| Special Needs Housing | 0 | 2,400 | 0 | 2,400 |
| Subtotal | $7,522 | $5,259 | $0 | $12,781 |
| ($ in millions) | State of Good Repair | Program Expansion | Programmatic Replacement | Total |
| Mass Transit | ||||
| Ferry Maintenance Facility Construction | $6 | $0 | $0 | $6 |
| IFA Trackwork Project For New York City Transit | 0 | 0 | 350 | 350 |
| Miscellaneous Projects For New York City Transit | 0 | 0 | 50 | 50 |
| Miscellaneous Transit Improvement Projects | 0 | 0 | 81 | 81 |
| MTABC Related Capital Purchases | 0 | 0 | 29 | 29 |
| Reconstruction Of Ferry Boats | 0 | 0 | 145 | 145 |
| Reconstruction Of Ferry Terminal Facilities | 0 | 0 | 255 | 255 |
| Subtotal | $6 | $0 | $910 | $916 |
| Parks And Open Spaces | ||||
| Beaches And Boardwalks | $186 | $0 | $0 | $186 |
| Land Acquisition And Tree Planting | 0 | 315 | 0 | 315 |
| Large, Major And Regional Park Reconstruction | 1,751 | 0 | 0 | 1,751 |
| Major Recreational Facilities And Facility Reconstruction | 727 | 0 | 0 | 727 |
| Neighborhood Parks And Playgrounds | 1,330 | 0 | 0 | 1,330 |
| Zoos | 42 | 0 | 0 | 42 |
| Subtotal | $4,035 | $315 | $0 | $4,350 |
| Public Buildings And Facilities | ||||
| Acquisition Of Real Property | $0 | $32 | $0 | $32 |
| Board Of Elections Modernization | 0 | 0 | 12 | 12 |
| Building Construction, Reconstruction Or Retrofit | 2,833 | 0 | 0 | 2,833 |
| Building Systems And Infrastructure | 868 | 0 | 0 | 868 |
| Construction Of New Court Facilities | 0 | 12 | 0 | 12 |
| Distributed Generation | 32 | 0 | 0 | 32 |
| Facility Purchases And Reconstruction | 0 | 0 | 165 | 165 |
| Garages And Facilities | 1,277 | 0 | 0 | 1,277 |
| Legal Mandates And Correction Of Unsafe Conditions | 621 | 0 | 0 | 621 |
| Miscellaneous Construction | 75 | 0 | 0 | 75 |
| Miscellaneous Energy Efficiency And Sustainability | 2,360 | 0 | 0 | 2,360 |
| New Facilities And Renovations | 471 | 0 | 0 | 471 |
| New Jail Facilities | 0 | 0 | 8,746 | 8,746 |
| Parking Meters, Lots, And Garages | 40 | 0 | 0 | 40 |
| Police Facilities | 1,148 | 0 | 0 | 1,148 |
| Reconstruction/Renovation Of Court Facilities | 0 | 0 | 1,981 | 1,981 |
| Rehabilitation Of City-Owned Office Space | 549 | 0 | 0 | 549 |
| Rehabilitation Of Court Buildings | 1 | 0 | 0 | 1 |
| Rehabilitation Of Non-Waterfront Properties | 0 | 0 | 0 | 0 |
| Rehabilitation Of Waterfront Properties | 53 | 0 | 0 | 53 |
| Renovation Of Leased Space | 317 | 0 | 0 | 317 |
| Renovation Of Other City-Owned Facilities | 71 | 0 | 0 | 71 |
| Solid Waste Management | 0 | 117 | 0 | 117 |
| Support Space | 0 | 103 | 0 | 103 |
| Subtotal | $10,717 | $264 | $10,904 | $21,886 |
| ($ in millions) | State of Good Repair | Program Expansion | Programmatic Replacement | Total |
| Road and Bridge Works | ||||
| Bridge Facilities | $9 | $0 | $0 | $9 |
| Bridge Life Extension And Miscellaneous Work | 3,571 | 0 | 0 | 3,571 |
| Bridge Painting | 293 | 0 | 0 | 293 |
| East River Bridges | 553 | 0 | 0 | 553 |
| Facility Reconstruction | 236 | 0 | 0 | 236 |
| Fair Bridges | 3,478 | 0 | 0 | 3,478 |
| Highway Drawdown Program | 14 | 0 | 0 | 14 |
| Installation Of Lampposts And Luminaires | 125 | 0 | 0 | 125 |
| Installation Of Pavement Markings | 90 | 0 | 0 | 90 |
| Local Street Reconstruction | 22 | 0 | 0 | 22 |
| Pedestrian Ramp Construction | 1,205 | 0 | 0 | 1,205 |
| Primary Street Reconstruction | 3,091 | 0 | 0 | 3,091 |
| Primary Street Resurfacing | 1,569 | 0 | 0 | 1,569 |
| Reconstruction Of Step Streets | 12 | 0 | 0 | 12 |
| Sidewalk Reconstruction | 475 | 0 | 0 | 475 |
| Traffic Work In Conjunction With Fair Bridges | 1 | 0 | 0 | 1 |
| Traffic Work In Conjunction With Highway Reconstruction | 42 | 0 | 0 | 42 |
| Useful Life Extension | 376 | 0 | 0 | 376 |
| Useful Life Extension And Miscellaneous Work | 0 | 0 | 0 | 0 |
| Subtotal | $15,162 | $0 | $0 | $15,162 |
| Stormwater And Wastewater Management | ||||
| Biological Nutrient Removal | $0 | $40 | $0 | $40 |
| Bluebelt Program | 0 | 326 | 0 | 326 |
| Consent Decree Upgrading And Construction | 0 | 259 | 0 | 259 |
| Extensions To Accommodate New Development | 0 | 1,004 | 0 | 1,004 |
| Green Infrastructure Program | 0 | 891 | 0 | 891 |
| Plant Component Stabilization | 0 | 0 | 40 | 40 |
| Plant Upgrading And Reconstruction | 0 | 0 | 5,061 | 5,061 |
| Programmatic Replacement And Reconstruction | 0 | 0 | 242 | 242 |
| Programmatic Response To Regulatory Mandates | 0 | 54 | 0 | 54 |
| Replacement Of Chronically Failing Components | 927 | 0 | 0 | 927 |
| Replacement Or Augmentation Of Existing Systems | 0 | 1,872 | 0 | 1,872 |
| Trunk And Distribution Main Replacement | 0 | 0 | 23 | 23 |
| Water Quality Mandates | 0 | 0 | 2,049 | 2,049 |
| Subtotal | $927 | $4,446 | $7,414 | $12,788 |
| Water Supply And Equipment | ||||
| Augmentation Of Water Supply Systems | $0 | $195 | $0 | $195 |
| Bluebelt Program | 0 | 22 | 0 | 22 |
| City Tunnel No. 1, Reconstruction | 1 | 0 | 0 | 1 |
| City Tunnel No. 3, Stage 1 | 0 | 342 | 0 | 342 |
| City Tunnel No. 3, Stage 2 | 0 | 653 | 0 | 653 |
| Conveyance | 0 | 34 | 0 | 34 |
| Croton Filter Project | 0 | 41 | 0 | 41 |
| Dam Safety Program | 0 | 0 | 912 | 912 |
| Extensions | 0 | 38 | 0 | 38 |
| Filtration Avoidance Determination | 211 | 0 | 0 | 211 |
| Kensico-City Tunnel | 0 | 1,280 | 0 | 1,280 |
| Miscellaneous Improvements Upstate | 0 | 14 | 0 | 14 |
| Miscellaneous Programs | 0 | 1 | 0 | 1 |
| Trunk And Distribution Main Extension | 0 | 273 | 0 | 273 |
| Trunk And Distribution Main Replacement | 0 | 0 | 1,541 | 1,541 |
| Water For The Future | 23 | 0 | 0 | 23 |
| Water Quality Preservation | 0 | 1,084 | 0 | 1,084 |
| Subtotal | $234 | $3,978 | $2,453 | $6,665 |
| Grand Total | $59,720 | $27,514 | $29,676 | $116,909 |
Note: Numbers may not add due to rounding.
Endnotes
[1] https://www.imf.org/en/Publications/WEO/Issues/2019/03/28/world-economic-outlook-april-2019
[2] https://labor.ny.gov/workerprotection/laborstandards/workprot/minwage.shtm
[3] https://www.nytimes.com/2019/04/12/business/wall-street-bank-earnings-economy.html
[4] https://www.brookings.edu/interactives/tracking-deregulation-in-the-trump-era/
[5] http://www.osc.state.ny.us/press/releases/mar18/032618.htm
[6] https://www.osc.state.ny.us/press/releases/mar19/032619.htm
[7] For a detailed review of recent venture capital activity in New York City, see Office of the New York City Comptroller, Venture Capital in New York City’s Economy, April 2019 (https://comptroller.nyc.gov/reports/venture-capital-in-new-york-citys-economy/)
[8] Revisions to the remaining categorical-grants-supported portion of the budget approximately offset each other, with increases of $23 million and $9 million in Federal and other categorical grants, respectively, and a decrease of $33 million in interfund agreement revenues.
[9] The City’s categorization of efficiency initiatives includes some initiatives that are categorized under funding shift, re-estimate, and new revenues in our categorization. Thus, under OMB’s accounting, efficiencies in FY 2019 and FY 2020 total more than $203 million.
[10] These reserves are offsets against collections and include estimates of tax expenditures such as abatements and discounts as well as delinquency and defective liens.
[11] Prior to the TCJA, the federal corporate tax rate of 35 percent and top marginal pass-through rate for UBT filers, at 39.6 percent, were similar. With the enactment of the TCJA the difference can be as high as 14 percent, with the corporate rate at 21 percent and the top marginal UBT rate tax at 35 percent.
[12] Part ZZZ of S1509/A2009 of 2019, https://www.nysenate.gov/legislation/bills/2019/s1509.
[13] An increase of 8 in the planned headcount in the Office of Trials and Hearings related to an insourcing initiative results in the net reduction of 1,197 from the Citywide Savings Program.
[14] FY 2019 health insurance spending is net of the $300 million reduction from the FY 2018 prepayment of FY 2019 retiree health insurance.
[15] The FY 2014 Health Savings Agreement provides for savings of $400 million in FY 2015, $700 million in FY 2016, $1 billion in FY 2017 and $1.3 billion annually beginning in FY 2018.
[16] The final actuarial audit reports will be released in early June. The reports will be available on the website of the New York City Comptroller’s Office.
[17] Liability weighted mortality data was only available for the four-year period ending 6/30/14, 6/30/15, 6/30/16, and 6/30/17.
[18] Under the OYLM, returns above or below the Actuarial Interest Rate (AIR) assumption of 7.0% for a given fiscal year are phased-in over a six-year period beginning one year after the end of the given fiscal year and pension contributions for a given fiscal year are determined based on the fiscal year-end actuarial valuation date as of the second preceding year. For example, FY 2019 Employers’ pension contributions were calculated based on the June 30, 2017 actuarial valuation date.
[19] The pension reserve contains funding for any potential from changes in actuarial assumptions and methodology arising from the actuarial audits as well as additional pension costs due to salary and headcount adjustments.
[20] NYC Open Data publishes shelter census data dating back to August 21, 2013. Our measurement extends from April 24, 2014 to April 24, 2019. We use the same start and end dates to control for seasonal differences in the shelter population.
[21] The Commitment Plan is a schedule of anticipated capital contract registrations.
[22] The balance of the total $8.7 billion for new borough-based jails is in the outyears.
[23] This percentage assumes all DOT project types, not just bridges and highways.
[24] Includes GO, conduit debt, TFA PIT bonds, and TSASC.
[25] Savings figures include $11.8 million of lowered swap payments in FY 2019, and $21.3 million in each of FYs 2020 through 2023. These expense savings are offset by lowered swap receipts under other categorical revenue.
[26] Debt service in this discussion is adjusted to exclude prepayments.
[27] TSASC debt service is not included in this discussion as it is supported by dedicated tobacco settlement revenues.