Comments on New York City’s Fiscal Year 2021 Adopted Budget
I. Executive Summary
The COVID-19 pandemic has wreaked havoc on the global economy, with a devastating impact on the national and local economies. U.S. real (inflation-adjusted) Gross Domestic Product (GDP) fell at an annualized rate of five percent during the first quarter of calendar year 2020 (January to March), as the initial impact of the pandemic began to take a toll on the economy. In the second quarter, the economy contracted by a record annualized rate of 32.9 percent, plunging the economy into a recession after close to 11 years of expansion. The record contraction came as states across the country imposed lockdowns to contain the spread of the virus. The lockdown also contributed to record job losses. The private sector lost 16.9 million jobs in the second quarter, falling 13.1 percent and setting a new record of job losses in a single quarter since record became available in 1939.
The economy of New York City, which was the epicenter of the coronavirus pandemic at its onset, has been hit harder than the nation thus far. City jobs declined faster than the nation through June. From February to April U.S. employment declined by 14.5 percent, but bounced back by 5.8 percent from April to June, for a net decline of 9.6 percent from February to June. In New York City employment plunged by about 20 percent from February to April and grew by a smaller 3.4 percent from April to June. This 20 percent decline in New York City employment was equivalent to the loss of an unprecedented 921,100 jobs between February and April.
Small businesses in New York City have suffered a devastating blow. Small business revenues declined dramatically in March. Manhattan small business revenue was already declining in early March, and had declined by 70 percent by month’s end, as businesses shuttered and commuters stayed home. Despite some recovery, Manhattan small business revenue in early July is still down over 40 percent from the beginning of January. Outer borough small businesses, less dependent on commuters, fared better but still experienced revenue declines of 40 percent to 60 percent by early April. In July, Staten Island and Queens small business revenue remained down over 20 percent from January, while in the Bronx, small business revenue has begun to recover, and is up 9 percent over January.
The FY 2021 Adopted Budget reflects the ravaging of the City’s economy and tax revenues by the pandemic. The Adopted Budget of $88.19 billion is $9.57 billion less than the modified FY 2020 budget, a drop of almost 10 percent. The sharp reduction eclipsed the drop of $1.8 billion, or approximately 3 percent, in FY 2009, following the 2008 financial crisis. Revenues are $7.1 billion less than forecasted in the Preliminary Budget released in January, before the COVID-19 outbreak in the City. The drop in revenues, along with State budget actions, City Council initiatives and additional agency expenditures opened an $8.33 billion shortfall in the FY 2021 budget.
To bridge the shortfall, the City put forward $2.83 billion in savings proposals. Of these, less than half have recurring outyear value. Non-recurring initiatives for FY 2021 include savings from closed or cancelled programs due to COVID-19 restrictions; non-recurring savings, such as the $328 million reduction in NYPD overtime; and one-time revenues such as a $137 million rental payment from the Water Board, and $40 million from the sale of residual interest from securitized loan transactions by the Department of Housing Preservation and Development.
Other significant actions to close the shortfall include the use of $2.75 billion of reserves. The City will draw down $1.6 billion from the Retiree Health Benefits Trust (RHBT) to partially pay for FY 2021 retiree health benefits, and reduced budgeted reserves by $1.15 billion — leaving just $100 million in budgeted reserves for the year, the statutory minimum. The budget also relies on $1 billion in unspecified labor savings. The mayor has threatened up to 22,000 layoffs if savings are not found by October 1. These additional resources coupled with the use of $605 million of eFMAP Federal funding under the Family First Coronavirus Response Act to pay the City’s share of Medicaid payments in FY 2021 and an additional $1.1 billion prepayment of FY 2021 debt service allow the City to close the $8.33 billion shortfall.
While the Adopted Budget is balanced, the Comptroller’s Office’s analysis of the Budget and Financial Plan shows a budget deficit risk of $543 million in FY 2021 and larger gaps of $4.84 billion, $3.55 billion, and $3.59 billion in FY 2022 through FY 2024, respectively. The FY 2021 budget deficit and larger outyear gaps projected by the Comptroller’s Office stem from risks to the City’s expenditure assumptions primarily in the Plan’s overtime projections, several Department of Education expenditures including funding for charter school tuition and special education Carter cases, the Fair Fares program, homeless shelter spending, and pension contributions. The Comptroller’s Office estimates that overall, spending could be higher than projected in the Plan by $764 million in FY 2021, $744 million in FY 2022, $986 million in FY 2023, and $1.27 billion in FY 2024. The expenditure risks are partially offset by the Comptroller’s Office’s higher tax revenues forecast, resulting in net risks to the Financial Plan of $543 million in FY 2021, $662 million in FY 2022, $504 million in FY 2023, and $412 million in FY 2024.
However, there are risks to the budget beyond those quantified in our analysis. Most immediately, a failure by the Federal government to provide adequate fiscal relief to state and local governments could upend the State budget — and by extension, the City’s. New York State has threatened to reduce local aid by as much as 20 percent if Congress does not appropriate additional, unrestricted aid to states and local governments, using executive powers included in the enacted State budget.
Other risks stem from the uncertainty surrounding the trajectory of the coronavirus itself: A recurring surge of the virus could lead to another round of business shutdowns and stay-at-home orders. Longer-term, changes in work patterns and behavior could impact the City’s tax base, even with the eventual development of a vaccine.
With these risks, and a gap of as much as $4.84 billion in FY 2022, the City must act promptly to reduce the gaps through actions that will bring the City’s revenues and spending into sustainable balance. In past crises the City has relied on a wide range of actions, and asked all stakeholders to come to the table and participate in the City’s recovery. This is the only path to a budget that reflects the unique nature of the current health and social crises facing the City and the nation.
Table 1. FY 2021 – FY 2024 Financial Plan
| ($ in millions) | FY 2021 | FY 2022 | FY 2023 | FY 2024 | Change FYs 2021 –2024 |
|
| Dollar | Percent | |||||
| Revenues | ||||||
| Taxes: | ||||||
| General Property Tax | $30,852 | $32,001 | $32,863 | $33,226 | $2,374 | 7.7% |
| Other Taxes | 26,869 | 31,026 | 33,079 | 33,995 | 7,126 | 26.5% |
| Tax Audit Revenues | 921 | 721 | 721 | 721 | (200) | (21.7%) |
| Subtotal: Taxes | $58,642 | $63,748 | $66,663 | $67,942 | $9,300 | 15.9% |
| Miscellaneous Revenues | 6,960 | 6,844 | 6,829 | 6,829 | (131) | (1.9%) |
| Less: Intra-City Revenues | (1,842) | (1,837) | (1,834) | (1,834) | 8 | (0.4%) |
| Disallowances Against Categorical Grants | (15) | (15) | (15) | (15) | 0 | 0.0% |
| Subtotal: City-Funds | $63,745 | $68,740 | $71,643 | $72,922 | $9,177 | 14.4% |
| Other Categorical Grants | 975 | 989 | 988 | 986 | 11 | 1.1% |
| Inter-Fund Revenues | 677 | 675 | 675 | 675 | (2) | (0.3%) |
| Federal Categorical Grants | 7,370 | 6,966 | 6,922 | 6,917 | (453) | (6.1%) |
| State Categorical Grants | 15,425 | 16,284 | 16,739 | 16,788 | 1,363 | 8.8% |
| Total Revenues | $88,192 | $93,654 | $96,967 | $98,288 | $10,096 | 11.4% |
| Expenditures | ||||||
| Personal Service | ||||||
| Salaries and Wages | $29,749 | $29,972 | $30,536 | $30,815 | $1,066 | 3.6% |
| Pensions | 9,932 | 10,482 | 10,374 | 10,070 | 138 | 1.4% |
| Fringe Benefits | 10,565 | 11,456 | 12,255 | 13,060 | 2,495 | 23.6% |
| Retiree Health Benefits Trust | (1,600) | 0 | 0 | 0 | 1,600 | (100.0%) |
| Subtotal-PS | $48,646 | $51,910 | $53,165 | $53,945 | $5,299 | 10.9% |
| Other Than Personal Service | ||||||
| Medical Assistance | $5,238 | $5,915 | $5,915 | $5,915 | $677 | 12.9% |
| Public Assistance | 1,628 | 1,651 | 1,650 | 1,650 | 22 | 1.4% |
| All Other | 30,871 | 30,939 | 31,153 | 31,399 | 528 | 1.7% |
| Subtotal-OTPS | $37,737 | $38,505 | $38,718 | $38,964 | $1,227 | 3.3% |
| Debt Service | ||||||
| Principal | $3,718 | $3,968 | $4,078 | $4,067 | $349 | 9.4% |
| Interest & Offsets | 3,652 | 4,038 | 4,633 | 5,078 | 1,426 | 39.0% |
| Subtotal Debt Service | $7,370 | $8,006 | $8,711 | $9,145 | $1,775 | 24.1% |
| FY 2020 BSA | ($3,819) | $0 | $0 | $0 | $3,819 | (100.0%) |
| Capital Stabilization Reserve | $0 | $250 | $250 | $250 | $250 | NA |
| General Reserve | $100 | $1,000 | $1,000 | $1,000 | $900 | 900.0% |
| Less: Intra-City Expenses | ($1,842) | ($1,837) | ($1,834) | ($1,834) | $8 | (0.4%) |
| Total Expenditures | $88,192 | $97,834 | $100,010 | $101,470 | $13,278 | 15.1% |
| Gap To Be Closed | $0 | ($4,180) | ($3,043) | ($3,182) | ($3,182) | NA |
NOTE: Numbers may not add to totals due to rounding.
Table 2. Plan-to-Plan Changes
June 2020 Plan vs. April 2020 Plan
| ($ in millions) | FY 2021 | FY 2022 | FY 2023 | FY 2024 |
| Revenues | ||||
| Taxes: | ||||
| General Property Tax | ($149) | ($70) | ($131) | ($195) |
| Other Taxes | (1,395) | (816) | (481) | (423) |
| Tax Audit Revenues | 0 | 0 | 0 | 0 |
| Subtotal: Taxes | ($1,544) | ($886) | ($612) | ($618) |
| Miscellaneous Revenues | 83 | 14 | 14 | 12 |
| Less: Intra-City Revenues | 6 | (3) | (3) | (3) |
| Disallowances Against Categorical Grants | 0 | 0 | 0 | 0 |
| Subtotal: City-Funds | ($1,455) | ($875) | ($601) | ($609) |
| Other Categorical Grants | 103 | 128 | 128 | 129 |
| Inter-Fund Revenues | 2 | 0 | 0 | 0 |
| Federal Categorical Grants | 233 | 2 | 0 | 0 |
| State Categorical Grants | (23) | 1 | 1 | 0 |
| Total Revenues | ($1,140) | ($744) | ($472) | ($480) |
| Expenditures | ||||
| Personal Service | ||||
| Salaries and Wages | ($606) | ($398) | ($719) | ($985) |
| Pensions | 5 | (20) | (60) | (36) |
| Fringe Benefits | (1,050) | (1,048) | (1,056) | (1,059) |
| Subtotal-PS | ($606) | ($1,466) | ($719) | ($985) |
| Other Than Personal Service | ||||
| Medical Assistance | ($161) | $0 | $0 | $0 |
| Public Assistance | (23) | 0 | 0 | 0 |
| All Other | 373 | (98) | (100) | (95) |
| Subtotal-OTPS | $189 | ($98) | ($100) | ($95) |
| Debt Service | ||||
| Principal | $0 | $25 | $25 | $26 |
| Interest & Offsets | (20) | (46) | (46) | (47) |
| Subtotal Debt Service | ($20) | ($21) | ($21) | ($21) |
| FY 2020 BSA and Discretionary Transfers | $336 | $0 | $0 | $0 |
| Capital Stabilization Reserve | $0 | $0 | $0 | $0 |
| General Reserve | $0 | $0 | $0 | $0 |
| Less: Intra-City Expenses | $6 | ($3) | ($3) | ($3) |
| Total Expenditures | ($1,140) | ($1,588) | ($1,959) | ($2,199) |
| Gap To Be Closed | $0 | $844 | $1,487 | $1,719 |
NOTE: Numbers may not add to totals due to rounding.
Table 3. Plan-to-Plan Changes
June 2020 Plan vs. January 2020 Plan
| ($ in millions) | FY 2021 | FY 2022 | FY 2023 | FY 2024 |
| Revenues | ||||
| Taxes: | ||||
| General Property Tax | ($330) | ($435) | ($551) | ($893) |
| Other Taxes | (6,642) | (3,432) | (2,396) | (2,480) |
| Tax Audit Revenues | 0 | 0 | 0 | 0 |
| Subtotal: Taxes | ($6,972) | ($3,867) | ($2,947) | ($3,373) |
| Miscellaneous Revenues | (126) | (235) | (267) | (268) |
| Less: Intra-City Revenues | 10 | 7 | 8 | 8 |
| Disallowances Against Categorical Grants | 0 | 0 | 0 | 0 |
| Subtotal: City-Funds | ($7,088) | ($4,095) | ($3,206) | ($3,633) |
| Other Categorical Grants | 101 | 125 | 125 | 125 |
| Inter-Fund Revenues | 1 | (1) | (1) | (1) |
| Federal Categorical Grants | 257 | (44) | (54) | (54) |
| State Categorical Grants | (378) | 21 | 19 | 19 |
| Total Revenues | ($7,107) | ($3,994) | ($3,117) | ($3,544) |
| Expenditures | ||||
| Personal Service | ||||
| Salaries and Wages | ($1,194) | ($849) | ($1,192) | ($1,476) |
| Pensions | (7) | 60 | (84) | (42) |
| Fringe Benefits | (1,237) | (1,151) | (1,161) | (1,167) |
| Retiree Health Benefits Trust | (1,600) | 0 | 0 | 0 |
| Subtotal-PS | ($4,038) | ($1,940) | ($2,437) | ($2,685) |
| Other Than Personal Service | ||||
| Medical Assistance | ($677) | $0 | $0 | $0 |
| Public Assistance | (23) | 0 | 0 | 0 |
| All Other | (3) | (162) | (136) | (123) |
| Subtotal-OTPS | ($703) | ($162) | ($136) | ($123) |
| Debt Service | ||||
| Principal | ($38) | ($2) | ($7) | ($10) |
| Interest & Offsets | ($93) | ($150) | ($188) | ($211) |
| Subtotal Debt Service | ($130) | ($152) | ($195) | ($221) |
| FY 2020 BSA and Discretionary Transfers | ($1,096) | $0 | $0 | $0 |
| Capital Stabilization Reserve | ($250) | $0 | $0 | $0 |
| General Reserve | ($900) | $0 | $0 | $0 |
| Less: Intra-City Expenses | $10 | $7 | $8 | $8 |
| Total Expenditures | ($7,107) | ($2,247) | ($2,760) | ($3,021) |
| Gap To Be Closed | $0 | ($1,747) | ($357) | ($523) |
NOTE: Numbers may not add to totals due to rounding.
Table 4. Plan-to-Plan Changes
June 2020 Plan vs. June 2019 Plan
| ($ in millions) | FY 2021 | FY 2022 | FY 2023 |
| Revenues | |||
| Taxes: | |||
| General Property Tax | ($237) | ($327) | ($423) |
| Other Taxes | (6,342) | (3,154) | (2,034) |
| Tax Audit Revenues | 200 | 0 | 0 |
| Subtotal: Taxes | ($6,379) | ($3,481) | ($2,457) |
| Miscellaneous Revenues | 51 | (38) | (47) |
| Less: Intra-City Revenues | (25) | (22) | (20) |
| Disallowances Against Categorical Grants | 0 | 0 | 0 |
| Subtotal: City-Funds | ($6,353) | ($3,541) | ($2,524) |
| Other Categorical Grants | 105 | 126 | 125 |
| Inter-Fund Revenues | 5 | 3 | 3 |
| Federal Categorical Grants | 299 | (32) | (45) |
| State Categorical Grants | (285) | 106 | 56 |
| Total Revenues | ($6,229) | ($3,338) | ($2,385) |
| Expenditures | |||
| Personal Service | |||
| Salaries and Wages | ($1,186) | ($815) | ($1,138) |
| Pensions | (198) | (94) | (258) |
| Fringe Benefits | (1,289) | (1,071) | (973) |
| Retiree Health Benefits Trust | (1,600) | 0 | 0 |
| Subtotal-PS | ($4,273) | ($1,980) | ($2,369) |
| Other Than Personal Service | |||
| Medical Assistance | ($677) | $0 | $0 |
| Public Assistance | (23) | 0 | 0 |
| All Other | 395 | 152 | 133 |
| Subtotal-OTPS | ($305) | $152 | $133 |
| Debt Service | |||
| Principal | ($8) | $109 | $111 |
| Interest & Offsets | (170) | (296) | (338) |
| Subtotal Debt Service | ($178) | ($187) | ($227) |
| FY 2020 BSA | ($3,819) | $0 | $0 |
| Capital Stabilization Reserve | ($250) | $0 | $0 |
| General Reserve | ($900) | $0 | $0 |
| Less: Intra-City Expenses | ($25) | ($22) | ($20) |
| Total Expenditures | ($9,750) | ($2,037) | ($2,483) |
| Gap To Be Closed | $3,521 | ($1,301) | $98 |
NOTE: Numbers may not add to totals due to rounding.
Table 5. Risks and Offsets to the June 2020 Financial Plan
($ in millions, positive numbers decrease the gap and negative numbers increase the gap)
| FY 2021 | FY 2022 | FY 2023 | FY 2024 | |
| City Stated Gap | $0 | ($4,180) | ($3,043) | ($3,182) |
| Tax Revenues | ||||
| Property Tax | $268 | $349 | $738 | $1,078 |
| Personal Income Tax | 216 | (131) | (271) | (410) |
| Business Taxes | (383) | (245) | 152 | 332 |
| Sales Tax | 20 | (259) | (265) | (277) |
| Real Estate Transaction Taxes | 100 | 128 | (40) | (72) |
| All Other | 0 | 86 | 14 | 56 |
| Audit | 0 | 154 | 154 | 154 |
| Subtotal Tax Revenues | $221 | $82 | $482 | $861 |
| Expenditures | ||||
| Overtime | ($661) | ($130) | ($130) | ($130) |
| Charter School Tuition | (35) | (205) | (380) | (600) |
| Carter Case | (125) | (125) | (125) | (125) |
| Pupil Transportation | (75) | (75) | (75) | (75) |
| DOE Medicaid Reimbursement | (20) | (20) | (20) | (20) |
| Pre-K Special Education | 50 | 50 | 50 | 50 |
| Fair Fare | 0 | (100) | (100) | (100) |
| Homeless Shelters | (73) | (73) | (73) | (73) |
| Pension Contributions | 0 | (66) | (133) | (200) |
| VRDB Interest Savings | 175 | 0 | 0 | 0 |
| Subtotal Expenditures | ($764) | ($744) | ($986) | ($1,273) |
| Total (Risks)/Offsets | ($543) | ($662) | ($504) | ($412) |
| Restated (Gap)/Surplus | ($543) | ($4,842) | ($3,547) | ($3,594) |
NOTE: Numbers may not add to totals due to rounding.
II. The State of the City’s Economy
The COVID-19 pandemic has had great economic impacts around the world, and profound impacts on New York City’s economy. Whole industries shut down entirely. Those who could work from home did. Many who could not were laid off. Aggressive measures have contained the virus for now, but as New York City progresses through a cautious reopening, great uncertainty remains about how much and how quickly the New York City economy will recover.
When dense office towers can be safely reoccupied, and how comfortable workers will be with working there, remains an open question. No one knows if office workers will be willing to get on trains and buses as public transportation gets more crowded, or whether they will continue to work primarily from home.
The extent to which public schools and universities can be safely reopened to full-time in-person learning remains largely undecided. If public schools don’t reopen, parents of up to a million school children will have to provide their own childcare on at least a part-time basis, inhibiting many parents’ ability to return to full-time work. Whether universities reopen will determine the extent to which half a million college students pay rent and spend money in New York City or live and study remotely. How many tourists and shoppers return to New York City streets and stores, or continue to stay home and shop online, remains to be seen.
The coronavirus remains a considerable source of uncertainty as well. The likelihood of resurgence in New York City infections is affected by growing outbreaks in other states, and by how well those states are able to curtail infection. Currently visitors from 31 other states face mandatory quarantine in New York. This risk may be mitigated by testing and contact tracing, which requires testing capacity that is currently under strain at the national level. On the other hand, the development of effective treatments, or even better, an effective vaccine, would allow a quicker return to normal.
U.S. Economic Performance: A Collapse Without Precedent
In the U.S., real (inflation-adjusted) Gross Domestic Product (GDP) fell at an annualized rate of 32.9 percent during the second quarter of 2020, compared with a 5.0 percent decline during the previous quarter. The Federal Government has enacted fiscal and monetary policies to combat or minimize the economic calamity resulting from the spread of the pandemic. About $2.4 trillion in Federal stimulus has been appropriated to support economic recovery, with another roughly $3 trillion in actions to shore up the economy and financial markets by the Federal Reserve.
Consumer spending fell at an annual rate of 6.8 percent in the first quarter of 2020, the largest drop since an 8.7 percent decline in the second quarter of 1980. The decline in consumer spending was driven by a 13.8 percent drop in purchases of durable goods and a 9.8 percent decline in services, even while consumers stocked up on nondurable goods (most likely food and other perishable items), purchases of which rose 8.0 percent. Another factor impairing economic growth was gross private domestic investment which fell (for the fourth consecutive quarter) 10.2 percent. Exports and imports experienced declines of 9.0 percent and 15.7 percent, respectively.
The recession has been driven by the economic lockdown imposed to save lives, which resulted in an unprecedented level of job losses, as well as loss of wages and corporate earnings. Private sector job losses totaled 16.9 million in Q2 2020, falling 13.1 percent, from the 129.2 million private-sector jobs in Q1 2020, setting a new record of job losses in a single quarter since 1945. Job losses have been widespread with no sector spared. Construction employment has dropped 9.1 percent, manufacturing by 8.3 percent, trade transportation and utilities by 10.0 percent, information by 10.6 percent, professional and business services by 9.5 percent, education and health services by 9.2 percent, other services by 17.7 percent, government by 5.7 percent, and leisure and hospitality by a whopping 38.7 percent. The financial activities sector was the least hard hit, declining at a 2.8 percent rate (Table 6). Even hospital employment within the education and health services sector fell 2.7 percent.
Table 6. U.S. Payroll Employment, Seasonally Adjusted
($ in millions) |
Employment (in 1,000s) |
Change from Previous Qtr. |
Percent Change from Previous Qtr. |
|||
| 1Q2020 | 2Q2020 | 1Q2020 | 2Q2020 | 1Q2020 | 2Q2020 | |
| Total | 151,922 | 133,702 | 133.3 | (18,219.3) | 0.1% | (12.0%) |
| Private | 129,193 | 112,271 | 65.3 | (16,922.0) | 0.1% | (13.1%) |
| Construction | 7,602 | 6,911 | 57.0 | (691.3) | 0.8% | (9.1%) |
| Manufacturing | 12,834 | 11,774 | (14.0) | (1,059.7) | (0.1%) | (8.3%) |
| Trade, Transportation, and Utilities | 27,795 | 25,012 | 21.3 | (2,783.0) | 0.1% | (10.0%) |
| Wholesale Trade | 5,931 | 5,568 | 3.7 | (363.6) | 0.1% | (6.1%) |
| Retail Trade | 15,643 | 13,782 | (6.7) | (1,860.7) | (0.0%) | (11.9%) |
| Transportation and Warehousing | 5,675 | 5,122 | 25.2 | (552.5) | 0.4% | (9.7%) |
| Information | 2,892 | 2,586 | 18.0 | (306.0) | 0.6% | (10.6%) |
| Financial Activities | 8,832 | 8,583 | 28.3 | (248.3) | 0.3% | (2.8%) |
| Professional and Business Services | 21,510 | 19,463 | 33.7 | (2,047.0) | 0.2% | (9.5%) |
| Education and Health Services | 24,509 | 22,260 | 88.0 | (2,249.0) | 0.4% | (9.2%) |
| Educational Services | 3,818 | 3,368 | 14.8 | (449.3) | 0.4% | (11.8%) |
| Health Care and Social Assistance | 20,692 | 18,892 | 73.6 | (1,799.7) | 0.4% | (8.7%) |
| Health Care | 16,465 | 15,259 | 53.4 | (1,205.8) | 0.3% | (7.3%) |
| Hospitals | 5,259 | 5,119 | 24.6 | (140.6) | 0.5% | (2.7%) |
| Social Assistance | 4,227 | 3,633 | 20.2 | (593.9) | 0.5% | (14.1%) |
| Leisure and Hospitality | 16,600 | 10,180 | (143.3) | (6,419.3) | (0.9%) | (38.7%) |
| Arts, Entertainment, and Recreation | 2,458 | 1,301 | (9.6) | (1,156.6) | (0.4%) | (47.1%) |
| Performing Arts and Spectator Sports | 506 | 266 | (10.1) | (239.8) | (2.0%) | (47.4%) |
| Accommodation and Food Services | 14,142 | 8,879 | (133.9) | (5,262.5) | (0.9%) | (37.2%) |
| Accommodation | 2,073 | 1,183 | (19.4) | (890.1) | (0.9%) | (42.9%) |
| Food Services and Drinking Places | 12,068 | 7,696 | (114.5) | (4,372.4) | (0.9%) | (36.2%) |
| Other Services | 5,909 | 4,864 | (9.7) | (1,044.7) | (0.2%) | (17.7%) |
| Government | 22,729 | 21,432 | 68.0 | (1,297.3) | 0.3% | (5.7%) |
| Federal Government | 2,869 | 2,887 | 22.3 | 18.0 | 0.8% | 0.6% |
| State Government | 5,184 | 4,949 | 0.7 | (234.3) | 0.0% | (4.5%) |
| Local Government | 14,676 | 13,595 | 45.0 | (1,081.0) | 0.3% | (7.4%) |
SOURCE: Bureau of Labor Statistics, Current Employment Statistics
Similarly, the unemployment rate increased from 3.8 percent in Q1 2020 to 13.0 percent in Q2 2020, the highest quarterly rate since modern statistics were first recorded in 1948. In a seeming paradox, average hourly earnings for private-sector employees rose from $28.55 in Q1 2020 to $29.71 in Q2 2020, increasing 4.1 percent, topping the previous 1.0 percent record established in Q3 2008 by 3.1 percentage points. The seeming contradiction is explained by the fact that most of the 16.9 million jobs eliminated have been in low-wage sectors such as food services and drinking places, retail trade, and personal services. Jobs at the low end of the pay-scale have been decimated at a much higher rate than higher-paying jobs, hence the increased in average hourly earnings.
Going into the crisis, consumers’ economic fundamentals were strong. Consumer debt was at an historic low, while homeowner’s equity was high. But household net worth (total assets minus total liabilities) suffered a $6.55 trillion single quarter loss in Q1 2020, dropping from $117.34 trillion in Q4 2019 to $110.79 trillion on Q1 2020 (Chart 1). This can be explained by a combination of the dramatic fall in the stock market toward the end of the quarter, which subsequently recovered about three-quarters of its losses, and an employment-driven collapse in personal earnings, leading households to draw down savings.
Chart 1. Net Worth of Households and Nonprofit Organizations
($ in millions)
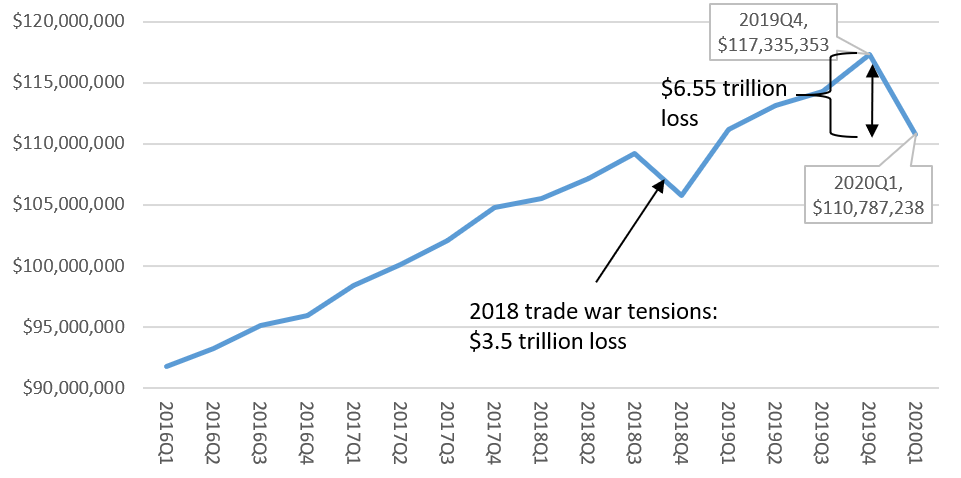
SOURCE: Federal Reserve Board of Governors
Private investment fell 10.2 percent in the first quarter of 2020, the fourth consecutive decline. The main reason for the decline was the drop in investment in equipment, which fell at an annual rate of 16.6 percent, the biggest drop since a 37.7 percent decline in Q1 2009 (during the Great Recession of 2008-2009). Increases in nonresidential investment in structures and intellectual property products as well as in residential investment partially offset the decline in equipment.
Government expenditure grew at an average annual rate of 1.1 percent in Q1 2020. Expenditure on national defense grew 1.1 percent and nondefense expenditure grew 3.3 percent. The combined effect of higher government expenditure and lower tax revenue has led to a mammoth increase in the budget deficit. In the first nine months of FY 2019, the cumulative budget deficit was $747.1 billion; during the same period in FY 2020, that figure has increased to $2.7 trillion, rising by almost $2.0 trillion (Chart 2).[1]
Chart 2. U.S. Cumulative Budget Deficit in the First Nine Months of
FYs 2019 and 2020
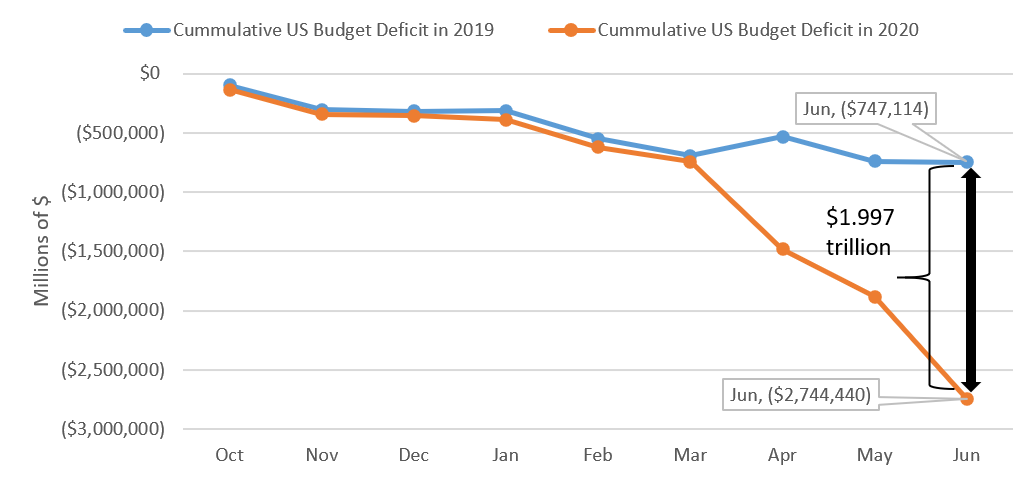
SOURCE: U.S. Treasury
New York City’s Economic Performance in 2020
Through June, New York City and New York State employment declined faster, and partially recovered more slowly, than the nation. From February to April U.S. employment declined by 14.5 percent, but bounced back by 5.8 percent from April to June, for a net decline of 9.6 percent from February to June. For New York City and New York State, the initial decline was closer to 20 percent. From April to June New York State employment grew by 5.1 percent as the suburban and rural areas of the State stepped more quickly through phased reopening, while New York City employment grew by a comparatively smaller 3.4 percent.
Chart 3. U.S., New York State, and New York City Employment Changes in 2020
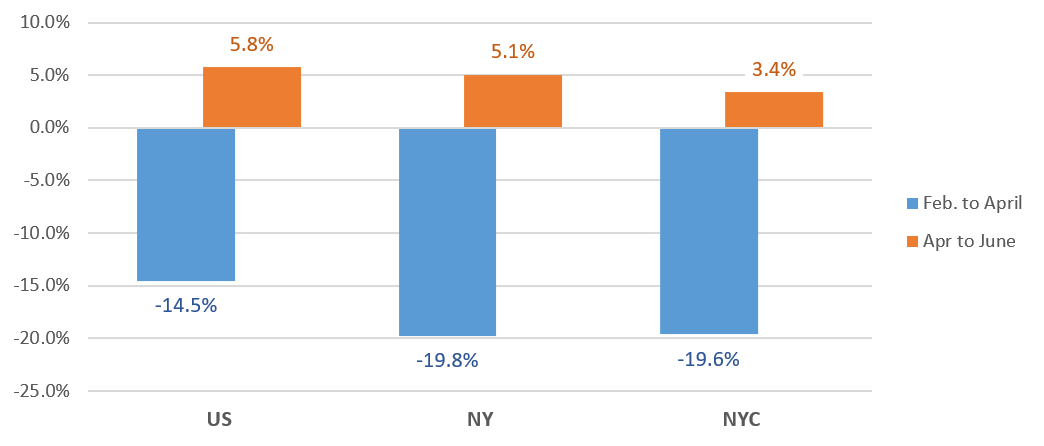
This 20 percent decline in New York City employment was equivalent to the loss of an unprecedented 921,100 jobs between February and April. However, the City did recover somewhat, adding back 128,800 jobs from April to June, for a net decline of 792,300 jobs from February to June.
Table 7. 2020 New York City Employment Changes, by Industry
(Seasonally Adjusted)
| Feb. | March | April | May | June | Feb to Apr | Apr to Jun | Feb to Jun | |
| Total Nonfarm | 4,694.9 | 4,618.1 | 3,773.9 | 3,783.2 | 3,902.6 | (921.1) | 128.8 | (792.3) |
| Total Private | 4,100.1 | 4,022.4 | 3,196.4 | 3,215.1 | 3,326.6 | (903.6) | 130.2 | (773.5) |
| Leisure and Hospitality | 464.6 | 427.9 | 157.2 | 159.6 | 199.5 | (307.4) | 42.2 | (265.1) |
| Accom. & Food Services | 373.5 | 339.3 | 124.0 | 132.7 | 166.9 | (249.5) | 42.9 | (206.6) |
| Trade, Trans., and Util. | 628.7 | 620.8 | 481.0 | 483.7 | 501.6 | (147.70 | 20.5 | (127.2) |
| Prof. and Bus. Serv. | 810.0 | 805.2 | 693.9 | 685.3 | 686.9 | (116.1) | (7.1) | (123.2) |
| Educ. and Health Serv. | 1,076.8 | 1,070.2 | 938.3 | 937.3 | 971.3 | (138.5) | 33 | (105.5) |
| Health Care & Soc. Assist. | 829.6 | 821.2 | 723.3 | 724.1 | 747.1 | (106.3) | 23.9 | (82.5) |
| Administrative Serv. | 293.1 | 287.7 | 213.8 | 209.6 | 212.3 | (79.3) | (1.5) | (80.8) |
| Retail Trade | 342.3 | 335.6 | 251.4 | 262.9 | 277.0 | (90.9) | 25.6 | (65.3) |
| Arts, Entertainm’t., & Rec. | 91.1 | 88.6 | 33.3 | 26.9 | 32.6 | (57.8) | (0.7) | (58.5) |
| Other Services | 199.9 | 196.0 | 138.5 | 138.9 | 141.7 | (61.5) | 3.2 | (58.2) |
| Trans. and Warehousing | 132.1 | 131.9 | 98.6 | 88.9 | 90.7 | (33.6) | (7.8) | (41.4) |
| Construction | 159.6 | 157.6 | 82.5 | 102.4 | 122.9 | (77) | 40.3 | (36.7) |
SOURCE: Monthly data from the U.S. Bureau of Labor Statistics, the NYS Department of Labor, and NYC OMB
As the New York City economy ground to a halt in late March, job losses were concentrated in industries providing in-person goods and services to consumers: hotels, restaurants, bars, spas, hair salons, and retail stores. From February to April, employment in leisure and hospitality declined by over 307,000, and employment in accommodation and food services declined by almost 250,000. Despite the pandemic, 138,500 healthcare jobs were lost between February and April as many people delayed healthcare visits out of caution.
Some industries rebounded as New York City progressed through phased reopening in May and June. Construction was permitted in the first phase of reopening and New York City added 40,300 construction jobs from April to June. New York City recovered nearly 43,000 jobs in accommodation and food services as outdoor dining resumed, and 25,600 retail jobs with the gradual reopening of stores.
Employment in industries that have yet to reopen, such as arts and entertainment, saw no recovery in employment. Similarly, as office buildings remained closed, employment in professional and business services declined without interruption every month from February to June, with a total loss of 123,200 jobs.
The City’s unemployment rate and the employment-to-population ratio have both set new records. Unemployment rose from 3.4 percent in February 2020, the lowest rate on record, to 20.4 percent in June 2020, the highest ever on record. Meanwhile, the City’s employment-to-population ratio decreased to 46.5 percent, the lowest on record, in Q2 2020 from 57.7 percent in Q1 2020. For its part, the labor-force participation rate (LFPR) has dropped to 56.7 percent in Q2 2020, the lowest LFPR since the second quarter of 1992, from 59.9 percent in the previous quarter. The City’s unemployment rate has continuously increased through June, while the nation’s unemployment rate peaked at 14.7 percent in April 2020 before changing trajectory in May and June (Chart 4).
Chart 4. U.S. and NYC Unemployment Rates Diverge
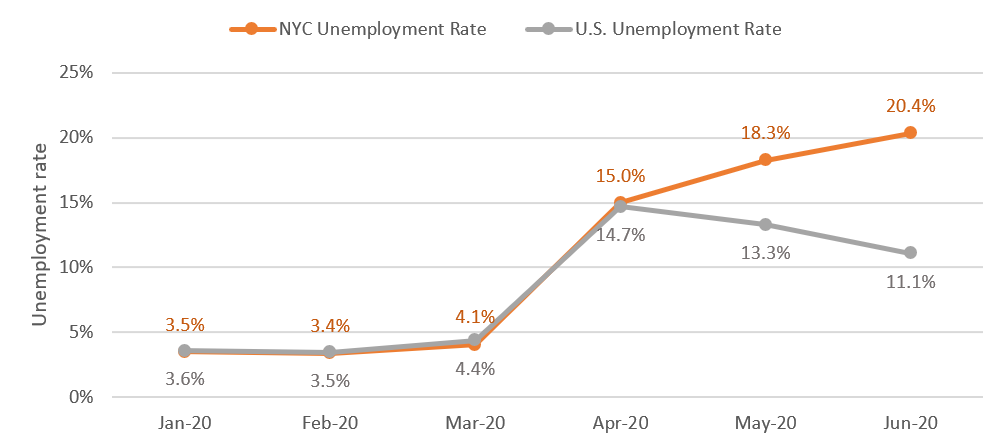
SOURCE: NYS Department of Labor.
Total venture capital investment in the New York metro area dropped 20.5 percent to $3.5 billion in the second quarter of 2020 from $4.4 billion a year earlier, after dropping 30.8 percent in Q1 2020, according to PwC/CB MoneyTree. The NY metro area’s share of national venture capital investment fell to 13.1 percent in the second quarter of 2020 from 14.3 percent in the second quarter of 2019.
While unemployment is still rising, not all the news is grim. Wall Street took advantage of market volatility to have its most profitable quarter in over a decade, with $10.7 billion in pretax profits in the first quarter of 2020.
Chart 5. Quarterly Wall Street Profits
($ in billions)
SOURCE: Intercontinental Exchange/NYSE
Small business revenue declined dramatically across New York City in March, but has since begun to recover. Manhattan small business revenue was already declining in early March, and had declined by 70 percent by month’s end, as businesses shuttered and commuters stayed home. Despite some recovery, Manhattan small business revenue in early July is still down over 40 percent from the beginning of January. Outer borough small businesses, less dependent on commuters, fared better but still experienced revenue declines of 40 percent to 60 percent by early April. In July, Staten Island and Queens small business revenue remained down over 20 percent from January, while in the Bronx, small business revenue was up 9 percent over January.
Chart 6. Percent Change in Small Business Revenue
Seven-Day Average, Seasonally Adjusted
SOURCE: Womply, via Tracktherecovery.org
MTA ridership has also begun a slow recovery. After falling to a weekday average of 416,500 in mid-April, MTA subway ridership rose to 1.22 million during the week beginning July 13th. Average weekday bus ridership similarly increased from a low point of 428,700 in early April to 1.19 million. While these are positive signs more people are getting back to work in July, ridership is still far below pre-crisis levels. Prior to the shutdown, weekday ridership averaged 5.4 million on subways and 2.2 million on buses.
Chart 7. MTA Average Weekly Ridership
SOURCE: Metropolitan Transportation Authority, Day-by-Day Ridership Numbers.
NOTE: Excludes holidays. Figures for the week ending July 17 includes data through Thursday, July 16.
The Economic Outlook
In our forecast, New York City’s economy is expected to contract at a slightly faster pace than the nation as a whole and recover more slowly. Although this prediction may be affected by New York’s relative success in fighting the epidemic since March, the New York City economy is uniquely vulnerable to a collapse in tourism, commuting, and business done face-to-face. We are assuming that, while the local economy recovers, visitors will remain reluctant to return for a longer period of time than local businesses will remain closed.
Table 8 provides summary projections for seven NYC and U.S. indicators from 2020 to 2024, comparing the Mayor’s April forecast with the Comptroller’s Office forecast.
Table 8. Selected Economic Indicators, Annual Averages
Comptroller and Mayor’s Forecasts, 2020 – 2024
SOURCE: Comptroller=forecast by the NYC Comptroller’s Office. GCP=Gross City Product. Mayor= forecast by the NYC Office of Management and Budget in the April 2020 Financial Plan.
III. The FY 2021 Adopted Budget
Overview
Shortly after midnight on July 1, 2020, the City Council voted to adopt an FY 2021 budget of $88.19 billion. The budget that was adopted amid the economic fallout from the COVID-19 pandemic is $7.1 billion less than the Preliminary FY 2021 Budget released in January, prior to the COVID-19 outbreak in the City. The reduction in the FY 2021 budget from January is driven primarily by a drop of $6.72 billion in projected tax revenues.[2] Overall, since January, the drop in projected City-funds revenues, State budget actions, City Council initiatives and additional agency expenditures opened an $8.33 billion shortfall in the FY 2021 budget, as shown in Table 9.
Table 9. Changes to FY 2021 City-Funds Estimates
from the Preliminary Budget
($ in millions, positive number decrease the gap and negative numbers increase the gap)
| January 2020 Financial Plan Gap | $0 |
| Revenue Shortfall/Spending Increases | |
| Tax Revenuesa | ($6,721) |
| Non-Tax Revenues | (373) |
| State Budget Impactb | (763) |
| City Council Initiatives | (376) |
| Expenditure Increase | (101) |
| Total Revenue Shortfall/Spending Increase | ($8,334) |
| Additional Resources | |
| Citywide Savings Program | $2,831 |
| Reserves | |
| Retiree Health Benefits Trust | $1,600 |
| General Reserve | 900 |
| Capital Stabilization Reserve | 250 |
| Subtotal Reserves | $2,750 |
| Labor Savings | $1,000 |
| Eliminate Funding for Two 1% Increases in Labor Reserve | $53 |
| Federal Aid | $605 |
| Total Additional Resources | $7,239 |
| Gap to be Closed Before Prepayments | ($1,095) |
| FY 2020 Prepayments | $1,095 |
| June 2020 Financial Plan Gap | $0 |
a Excludes the loss of $250 million due to the State intercept of $250 million of sales tax revenues to support financially distressed hospitals.
b Includes the State intercept of $250 million of City sales tax revenues to support financially distressed hospitals.
SOURCE: New York City Office of Management and Budget.
To close the shortfall, the City put forth savings initiatives in the Executive and Adopted Budget that together are expected to generate $2.8 billion in savings (see “Citywide Savings Plan” below).[3] On top of this, the City is relying on the use of reserves to provide another $2.75 billion of budget relief, including using $1.6 billion of Retiree Health Benefits Trust balances to pay for a portion of FY 2021 retiree health insurance expenditures. Additionally, the City is reducing the General Reserve by $900 million to $100 million and eliminating the $250 million Capital Stabilization Reserve.
The Adopted Budget is also balanced by assuming unspecified labor savings of $1 billion, which are expected to extend to the outyears of the Plan. The City is negotiating with municipal unions on how these savings will be achieved, operating under an October 1st deadline set by the Mayor.
The City is also eliminating funding for budgeted one percent increases in each of the first two years of the next round of collective bargaining. The elimination of this funding will save the City $53 million in FY 2021, growing to $217 million in FY 2022 and reaching $805 million by FY 2024.
Finally, the City is using $605 million of eFMAP Federal funding under the Family First Coronavirus Response Act to pay the City’s share of Medicaid payments in FY 2021. Together, these additional resources, along with debt service reduction of $1.10 billion from additional prepayments in FY 2020, allow the City to bridge the budget shortfall that had opened up since January 2020.
Spending and Funding in FY 2021
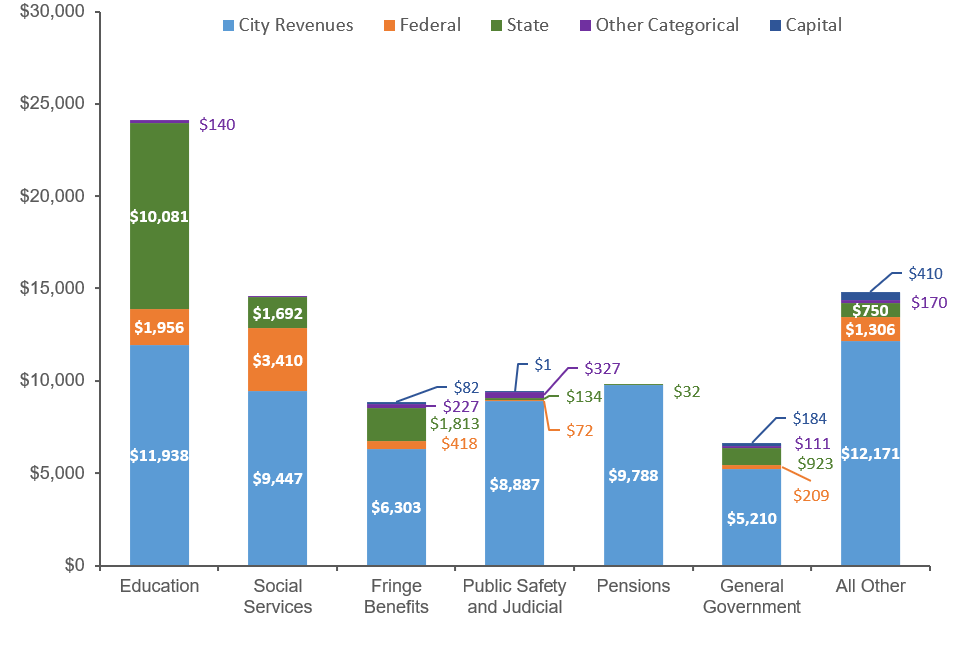
About three-quarters of the FY 2021 budget is allocated for education, social services, fringe benefits, public safety and judicial, and pensions, which together consume $66.75 billion of the budget. Spending on general government, including the Mayor’s Office, the Office of the Comptroller, the City Council, Department of Finance and Department of Citywide Administrative Services, accounts for about 7.5 percent of the budget. The Adopted Budget includes a General Reserve of $100 billion, $900 million less than the General Reserve in the Preliminary FY 2021 budget. Chart 8 shows the allocation of the FY 2020 budget by service areas and centrally budgeted expenditures such as fringe benefits, debt service and pension contributions.
Chart 8. FY 2021 Budget by Service Areas and Centrally Budgeted Expenditures
($ in millions)
* Centrally Budgeted Expenditures
Approximately 72 percent of the budget is supported by City-generated revenues of $63.75 billion. Tax revenues, which are projected to total $58.64 billion, account for the bulk of City-generated revenues, as shown in Chart 9. Real property and personal income tax (PIT) revenues account for almost three quarters of total tax revenues, with property tax revenues making up 53 percent of total tax revenues and PIT revenues contributing another 20 percent. City generated non-tax revenues include revenues from licenses, permits and franchises; interest income; charges for services; water and sewer payments from the New York City Water Board; fines and forfeitures; and miscellaneous other non-tax revenues. Revenues from charges for services ($1.01 billion), fines and forfeitures ($1.03 billion), and New York City Water Board payments ($1.73 billion) account for almost three quarters of City-generated non-tax revenues.[4]
Chart 9. Funding Sources, FY 2020 Budget
($ in millions)
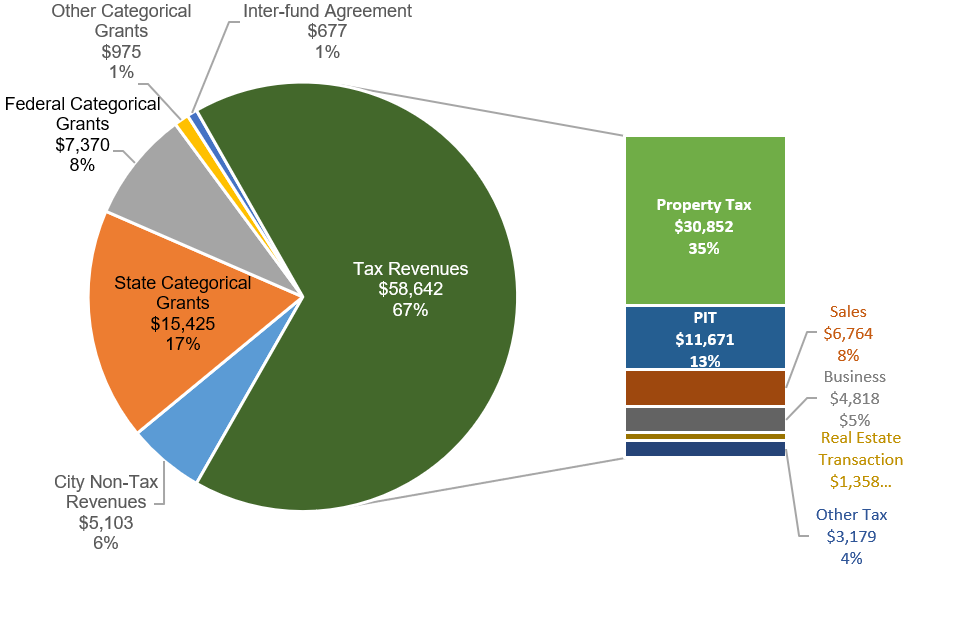
State categorical grants, which support many mandated programs, are estimated at $15.43 billion, accounting for more than 63 percent of non-City revenues. Almost two-thirds of State categorical grants fund over 40 percent of the Department of Education budget.
Federal categorical grants account for another $7.37 billion of non-City revenues. Approximately 46 percent of Federal grants go towards social services and account for more than one-fifth of total funding for social services. A significant portion of the budgets of the City’s social services agencies rely on Federal funding, including 40 percent of the budget for the Administration for Children’s Services (ACS), 37 percent of the budget for the Department of Homeless Services (DHS), 18 percent of the budget for the Department for the Aging (DFTA), and 16 percent of the budget for the Department of Social Services/Human Resources Administration (HRA).
Other categorical grants and inter-fund agreement (IFA) revenues round out the remaining non-City generated revenues. Other categorical grants consist primarily of reimbursements to the Fire Department for emergency medical services; reimbursements for health benefits from the Health Stabilization Fund; reimbursements to the City from NYC Health + Hospitals (H + H) for fringe benefits, judgments and claims, and energy costs; interest exchange agreements, and private grants from foundations and other sources. IFA revenues are reimbursements from the Capital Fund for expense budget costs related to capital projects such as planning, design and construction supervision. Chart 10 shows the funding allocation among the different service areas of the budget.
Chart 10. Funding Allocation by Service Areas and Centrally Budgeted Expenditures
($ in millions)
Citywide Savings Program (CSP)
Subsequent to the Executive Budget, estimated FY 2021 City-funds revenues fell by a further $1.69 billion, with tax revenues accounting for $1.54 billion of the drop. To make up for the revenue shortfall the City proposed another round of Citywide Savings Program (CSP), which is intended to provide budget relief of $1.56 billion in FY 2021 and a cumulative $3.66 billion over FY 2020 through FY 2024. The Adopted Budget also reversed $230 million of reductions proposed in the April CSP. Net of the reversals, the combined FY 2020 and FY 2021 savings from the April and June CSP total $4.56 billion.
As Chart 11 shows, spending reductions as a result of the COVID-19 pandemic such as the closing of schools, campuses and administrative buildings, savings on Fair Fares due to lower ridership, and delays of a police officer class and cadet program account for $1.04 billion, or 23 percent of the combined FY 2020 and FY 2021 savings. For the most part, these savings do not extend beyond FY 2021 as the economy is expected to re-open with businesses and government able to resume more or less normal operations. The CSP also includes one-time savings from overtime reductions, the bulk of which, $305 million, is in uniformed police overtime. However, as discussed in “Risks and Offsets’ beginning on page 28, in the absence of a detailed plan as to how this reduction will be achieved, the Comptroller’s Office considers this targeted savings to be a risk.
Savings classified as “efficiencies” include $164 million in savings from the hiring freeze and vacancy reductions in FY 2021, growing steadily in the outyears to $176 million by FY 2024.[5] Other major sources of “efficiency” savings include savings from closures of City jails; cancellation of July’s planned police officer class; and reductions in outside professional development contracts at the Department of Education, among others.
Chart 11. Combined FY 2020 and FY 2021 Citywide Savings Program
in the April and June Citywide Savings Program
($ in millions)
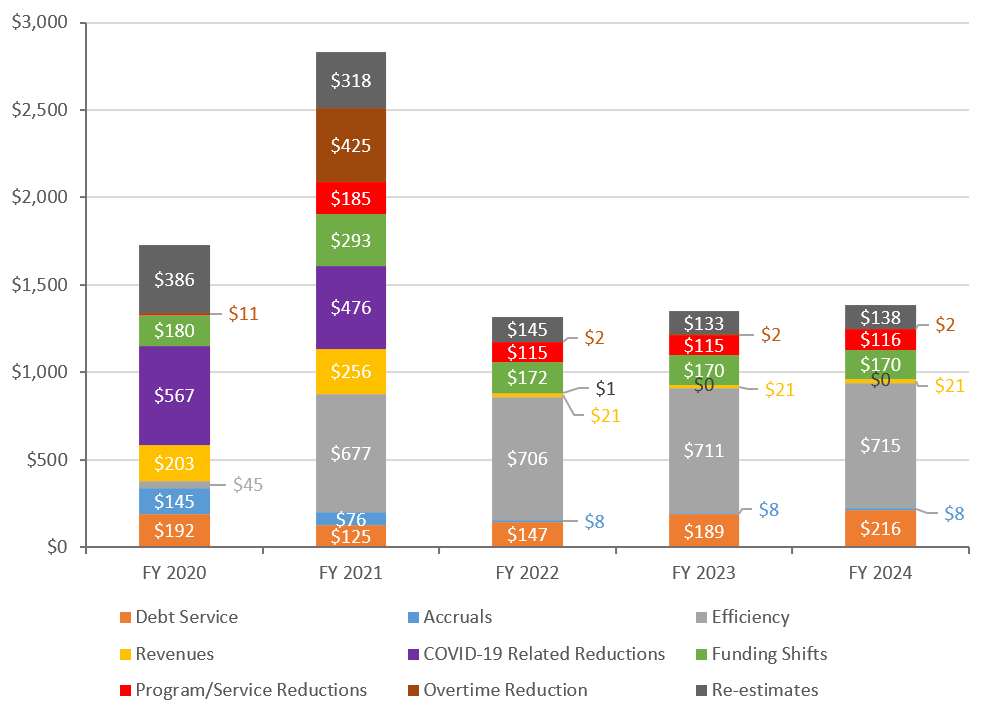
Program/service reductions include a $42 million cut in DOE’s Equity and Excellence program in FY 2021, which increase to $54 million in each of the outyears of the Plan, and a temporary reduction of $40 million in FY 2021 in School Allocation Memorandum funding.[6] Other significant program/service reductions include a citywide suspension of organic waste collection in FY 2021 and ending the appointment based electronic waste collection program. Overall, program/service reductions are expected to save $185 million in FY2021 and more than $115 million in each of the outyears of the Plan.
Revenue initiatives account for $256 million of the budget relief in FY 2021 and $21 million annually in the outyears of the Plan. The bulk of the revenues are non-recurring, the largest of which being a rental payment of $137 million from the Water Board in FY 2021.[7] Other non-recurring revenues include the sale of residual interest from the Department of Housing Preservation and Development’s 2014 and 2018 securitized loan transactions and additional FY 2021 parking violations revenues from the reallocation of 165 traffic enforcement agents from intersection control to parking enforcement.
More than half the savings in FY 2021 are from initiatives that do not have recurring saving that extend throughout the Plan period. Of the $2.83 billion savings in FY 2021, less than half have recurring savings in the outyears, with COVID-19 related reductions accounting for $475 million of non-recurring savings. Other significant non-recurring savings include police uniform and civilian overtime savings of $295 million and $33 million, respectively and the use of CARES Emergency Solutions Grant (ESG) funding to support adult shelter operations in the Department of Homeless Services.
Changes from FY 2020
As shown in Table 10, the FY 2021 Adopted Budget is $9.57 billion less than the modified FY 2020 budget, a drop of almost 10 percent. The sharp reduction eclipsed the drop of $1.80 billion, or approximately 3 percent, in FY 2009, following the 2008 financial crisis.[8] The decline in revenues is due to a projected $5.67 billion drop in non-City-funds revenues and $3.90 billion in City-funds revenues. The drop in non-City-funds revenues is driven primarily by a reduction of $5.12 billion in Federal categorical grants, more than 75 percent of which stem from the end of Federal COVID-19 relief. In total, the City expects to receive $4.28 billion in Federal COVID-19 relief over FY 2020 and FY 2021 with the bulk of it, $4.12 billion in FY 2020 and only $158 million in FY 2021. Of the remaining non-City funds revenues, State and other categorical grants are projected to drop by $457 million and $113 million, respectively, while IFA revenues are projected to increase by $17 million.
The decline in City-funds revenues is driven by a $3.43 billion drop in tax revenues, a 5.5 percent reduction. Non-property tax revenues are projected to fall by $4.51 billion. Real property tax revenues, because of the lagged nature of property tax assessments and the buffer created by the gradual phase-ins of assessments, are projected to increase by $1.16 billion, cushioning some of the drop in non-property tax revenues.
Table 10. Change FY 2020 – FY 2021
| ($ in millions) | FY 2020 | FY 2021 | $ Change | % Change |
| Revenues | ||||
| Taxes | ||||
| General Property Tax | $29,695 | $30,852 | $1,157 | 3.9% |
| Other Taxes | 31,376 | 26,869 | (4,507) | (14.4%) |
| Tax Audit Revenues | 999 | 921 | (78) | (7.8%) |
| Subtotal Taxes | $62,070 | $58,642 | ($3,428) | (5.5%) |
| Miscellaneous Revenues | 7,563 | 6,960 | (603) | (8.0%) |
| Unrestricted Intergovernmental Aid | 253 | 0 | (253) | (100.0%) |
| Less: Intra-City Revenues | (2,228) | (1,842) | 386 | (17.3%) |
| Disallowances Against Categorical Grants | (15) | (15) | 0 | 0.0% |
| Subtotal City-Funds | $67,643 | $63,745 | ($3,898) | (5.8%) |
| Other Categorical Grants | 1,088 | 975 | (113) | (10.4%) |
| Inter-Fund Revenues | 660 | 677 | 17 | 2.6% |
| Federal Categorical Grants | 12,487 | 7,370 | (5,117) | (41.0%) |
| State Categorical Grants | 15,882 | 15,425 | (457) | (2.9%) |
| Total Revenues | $97,760 | $88,192 | ($9,568) | (9.8%) |
| Expenditures | ||||
| Personal Services | ||||
| Salaries and Wages | $29,743 | $29,749 | $6 | 0.0% |
| Pensions | 9,786 | 9,932 | 146 | 1.5% |
| Fringe Benefits | 11,284 | 10,565 | (719) | (6.4%) |
| Retiree Health Benefits Trust | (1,000) | (1,600) | (600) | 60.0% |
| Subtotal PS | $49,813 | $48,646 | ($1,167) | (2.3%) |
| Other Than Personal Service | ||||
| Medical Assistance | $6,186 | $5,238 | ($948) | (15.3%) |
| Public Assistance | 1,601 | 1,628 | 27 | 1.7% |
| All Other | 35,986 | 30,871 | (5,115) | (14.2%) |
| Subtotal OTPS | $43,773 | $37,737 | ($6,036) | (13.8%) |
| Debt Service | ||||
| Principal | $3,612 | $3,718 | $106 | 2.9% |
| Interest & Offsets | 3,172 | 3,652 | 480 | 15.1% |
| Subtotal Debt Service | $6,784 | $7,370 | $586 | 8.6% |
| FY 2019 BSA & Discretionary Transfer | ($4,221) | $0 | $4,221 | (100.0%) |
| FY 2020 BSA | $3,819 | ($3,819) | ($7,638) | (200.0%) |
| General Reserve | $20 | $100 | $80 | 400.0% |
| Less: Intra-City Expenses | ($2,228) | ($1,842) | $386 | (17.3%) |
| Total Expenditures | $97,760 | $88,192 | ($9,568) | (9.8%) |
NOTE: Numbers may not add due to rounding
Expenditures as presented in the FY 2021 Adopted Budget are reduced by FY 2020 prepayments. Similarly, the FY 2020 Modified Budget was reduced by the net impact of FY 2019 and FY 2020 prepayments and the use of $1.0 billion of accumulated Retiree Health Benefits Trust (RHBT) balances to pay for a portion of retiree health insurance. After netting out the impact of prepayments and the use of RHBT funds, FY 2021 expenditures before reserves total $93.51 billion, a reduction of $6.03 billion or 6.1 percent from the adjusted FY 2020 expenditure, as shown in Table 11.[9]
Table 11. FY 2021 Expenditures vs. FY 2020 Expenditures
Adjusted for Prepayments
| ($ in millions) | FY 2020 | FY 2021 | $ Change | % Change |
| Contractual Services* | $19,545 | $16,821 | ($2,724) | (13.9%) |
| Other OTPS | 14,531 | 12,122 | (2,409) | (16.6%) |
| Medicaid | 6,186 | 5,238 | (948) | (15.3%) |
| Health Insurance | 6,890 | 6,255 | (635) | (9.2%) |
| Other Fringe Benefits | 4,286 | 4,196 | (90) | (2.1%) |
| Subtotal | $51,438 | $44,632 | ($6,806) | (13.2%) |
| Salaries and Wages | $29,312 | $29,333 | $21 | 0.1% |
| Pensions | 9,674 | 9,820 | 146 | 1.5% |
| Debt Service | 6,784 | 7,370 | 588 | 8.7% |
| Public Assistance | 1,601 | 1,628 | 27 | 1.7% |
| Judgments and Claims | 734 | 728 | (6) | (0.8%) |
| Subtotal | $48,104 | $48,880 | $776 | 1.6% |
| Expenditures Before Reserves | $99,542 | $93,511 | ($6,031) | (6.1%) |
| RHBT Deposit | (1,000) | (1,600) | (600) | 60.0% |
| Prior-Year Adjustment | (400) | 0 | 400 | (100.0%) |
| General Reserve | 20 | 100 | 80 | 400.0% |
| Total | $98,162 | $92,011 | ($6,151) | (6.3%) |
*Excludes contractual services for debt service and Medicaid
NOTE: Numbers may not add due to rounding
Almost $4 billion of the reduction is due to the drop off in COVID-19 related spending which is projected to fall from $4.01 billion in FY 2020 to $118 million in FY 2021. COVID-19 related spending in FY 2020 accounts for $1.04 billion of contractual services expenditures and $2.29 billion of OTPS spending. COVID-19 related spending in these two categories fall to $35 million and $81 million, respectively and is the primary driver of their reductions in FY 2021. Combined, spending on contractual services and other OTPS are expected to drop by more than $5 billion in FY 2021.
Other significant expenditure reductions include decreases of $948 million in Medicaid spending and $635 million in employee health insurance expenses. Medicaid spending is expected to fall to $5.24 billion as a result of eFMAP savings enacted under the Families First Coronavirus Response Act that now total $605 million. eFMAP savings is expected to expire at the end of calendar year 2020 and would mainly impact FY 2021. The reduction in health insurance spending in FY 2021 is due to the assumption of $1 billion of unspecified savings to be negotiated with the City’s labor unions. For the time being the savings are recognized in employee health insurance as a placeholder.
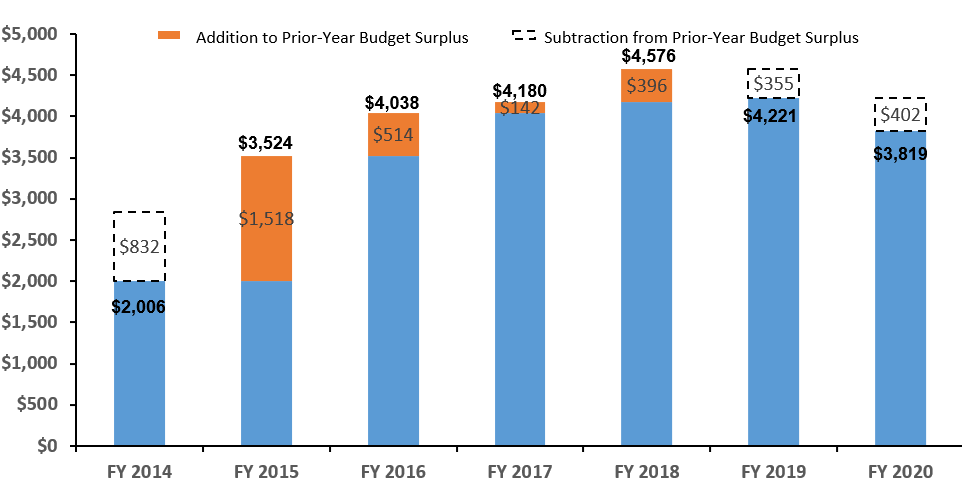
Accumulated Prior-Year Surplus and Prepayments
The FY 2021 Budget reflects prepayments of $3.82 billion of debt service. Without these prepayments, FY 2020 expenditures would be $3.82 billion higher, as discussed in “Changes from FY 2020” above. The prepayments allow the City to roll budget surpluses accumulated in prior fiscal years to future fiscal years, and represent the balance of the accumulated surpluses.
In FY 2014, the City prepaid $2.006 billion of FY 2015 debt service, drawing down $832 million of the accumulated surplus from prior years, as shown in Chart 12. Since then, the City has added to the accumulated surplus by increasing its prepayments in each subsequent year through FY 2018. However, in FY 2019 the City prepaid $4.221 billion of FY 2020 expenditures, $355 million less than the FY 2018 prepayment, balancing the FY 2019 budget by drawing the accumulated surplus. The City is once again drawing down on the accumulated surplus to balance the FY 2020 budget. Over the last two fiscal years the City has used a cumulative $757 million of the accumulated surplus to close budget deficits.
Chart 12. Accumulation of the Year-End Surplus
($ in millions)
The Outyears
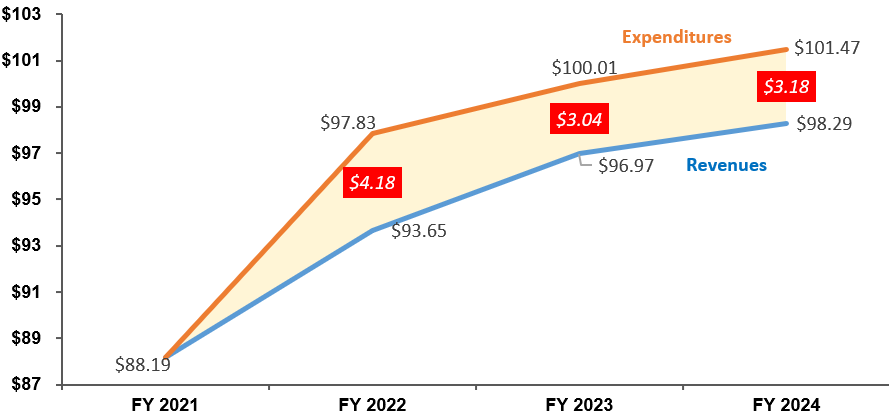
While the FY 2021 budget is balanced, the June 2020 Financial Plan projects budget gaps of $4.18 billion in FY 2022, $3.04 billion in FY 2023, and $3.18 billion in FY 2024, as shown in Chart 13. Over this period, revenues are projected to grow by 11.4 percent from $88.19 billion in FY 2021 to $98.29 billion in FY 2024 while expenditures are projected to grow by 15.1 percent to $101.47 billion.
Chart 13. June Financial Plan Revenues, Expenditures and Budget Gaps
($ in billions)
As shown in Table 12, revenues are projected to grow at an average annual rate of 3.7 percent in the outyears of the Plan. Tax revenues, which account for about two-thirds of overall revenues, contribute to 92 percent of the growth, with a projected growth of almost 16 percent from FY 2021 to FY 2024. More than half the growth over this period is expected to occur in FY 2022 as business re-openings are phased in during FY 2021. Tax revenues are projected to grow by 8.7 percent in FY 2022, 4.6 percent in FY 2023 and 1.9 percent in FY 2024. State categorical grants, and other categorical grants are projected to grow at annual average rates of 2.9 percent and 0.4 percent respectively in the outyears, while all other non-City revenues are projected to decline over the Plan period.
Table 12. FY 2021 – FY 2024 Revenue Growth
| ($ in millions) | FY 2021 | FY 2022 | FY 2023 | FY 2024 | Growth FYs 21-24 | Annual Growth |
| General Property Tax | $30,852 | $32,001 | $32,863 | $33,226 | 7.7% | 2.5% |
| Non-Property Tax | 27,790 | 31,747 | 33,800 | 34,716 | 24.9% | 7.7% |
| Subtotal Tax Revenues | $58,642 | $63,748 | $66,663 | $67,942 | 15.9% | 5.0% |
| Non-Tax Revenues | $5,103 | $4,992 | $4,980 | $4,980 | (2.4%) | (0.8%) |
| Subtotal City-Funds | $63,745 | $68,740 | $71,643 | $72,922 | 14.4% | 4.6% |
| Federal Categorical Grants | $7,370 | $6,966 | $6,922 | $6,917 | (6.1%) | (2.1%) |
| State Categorical Grants | 15,425 | 16,284 | 16,739 | 16,788 | 8.8% | 2.9% |
| Other Categorical Grants | 975 | 989 | 988 | 986 | 1.1% | 0.4% |
| IFA Revenues | 677 | 675 | 675 | 675 | (0.3%) | (0.1%) |
| Subtotal Non-City-Funds | $24,447 | $24,914 | $25,324 | $25,366 | 3.8% | 1.2% |
| Total | $88,192 | $93,654 | $96,967 | $98,288 | 11.4% | 3.7% |
As discussed above, FY 2021 expenditures are reduced by the prepayments of debt service and the use of RHBT funds to pay part of retiree health insurance expenditures. Adjusted for prepayments and the use of RHBT funds, expenditures before reserves in the Financial Plan are projected to grow by 7.2 percent between FY 2021 and FY 2024.
Expenditure growth in the outyears is driven by spending on debt service, health insurance, other fringe benefits and judgments and claims. Together, these expenditures are projected to grow at an average annual rate of 7.2 percent, as shown in Table 13. All other expenditures, excluding reserves, are projected to grow at a more modest 1.1 percent annual rate. Overall, expenditures adjusted for prepayments are projected to grow at an average rate of 3.3 percent.
Table 13. FY 2021 – FY 2024 Expenditure Growth
Adjusted for Prepayments
| (in millions) | FY 2021 | FY 2022 | FY 2023 | FY 2024 | Growth FYs 21-24 | Annual Growth |
| Debt Service | $7,370 | $8,006 | $8,711 | $9,145 | 24.1% | 7.5% |
| Health Insurance | 6,255 | 6,952 | 7,634 | 8,308 | 32.8% | 9.9% |
| Other Fringe Benefits | 4,196 | 4,389 | 4,507 | 4,638 | 10.5% | 3.4% |
| Judgments and Claims | 728 | 743 | 759 | 775 | 6.5% | 2.1% |
| Subtotal | $18,549 | $20,090 | $21,611 | $22,866 | 23.3% | 7.2% |
| Salaries and Wages | $29,333 | $29,548 | $30,114 | $30,393 | 3.6% | 1.2% |
| Pensions | 9,820 | 10,370 | 10,262 | 9,958 | 1.4% | 0.5% |
| Medicaid | 5,238 | 5,915 | 5,915 | 5,915 | 12.9% | 4.1% |
| Public Assistance | 1,628 | 1,651 | 1,650 | 1,650 | 1.4% | 0.5% |
| Contractual Services* | 16,821 | 16,757 | 16,795 | 16,777 | (0.3%) | (0.1%) |
| Other OTPS | 12,122 | 12,253 | 12,412 | 12,661 | 4.4% | 1.5% |
| Subtotal | $74,962 | $76,494 | $77,148 | $77,353 | 3.2% | 1.1% |
| Expenditures Before Reserves | $93,511 | $96,584 | $98,759 | $100,220 | 7.2% | 2.3% |
| RHBT | ($1,600) | $0 | $0 | $0 | ||
| General Reserve | $100 | $1,000 | $1,000 | $1,000 | ||
| Capital Stabilization Reserve | $0 | $250 | $250 | $250 | ||
| Total | $92,011 | $97,834 | $100,009 | $101,470 | 10.3% | 3.3% |
*Excludes contractual services for debt service and Medicaid.
Risks and Offsets
The Comptroller’s Office’s analysis of the FY 2021 Adopted Budget and Financial Plan shows a budget deficit risk of $543 million in FY 2021 and gaps of $4.84 billion, $3.55 billion, and $3.59 billion in FY 2022 through FY 2024, respectively, larger than those projected by the City. The FY 2021 budget deficit and larger outyear gaps projected by the Comptroller’s Office stem from risks to the City’s expenditure assumptions. The Comptroller’s Office estimates that overall, spending could be higher than projected in the Plan by $764 million in FY 2021, $744 million in FY 2022, $986 million in FY 2023 and $1.27 billion in FY 2024, as shown in Table 14. The expenditure risks are partially offset by the Comptroller’s Office’s higher tax revenues forecast, resulting in net risks to the Financial Plan of $543 million in FY 2021, $662 million in FY 2022, $504 million in FY 2023, and $412 million in FY 2024.
Table 14. Risks and Offsets to the June 2020 Financial Plan
($ in millions, positive numbers decrease the gap and negative numbers increase the gap)
| FY 2021 | FY 2022 | FY 2023 | FY 2024 | |
| City Stated Gap | $0 | ($4,180) | ($3,043) | ($3,182) |
| Tax Revenues | ||||
| Property Tax | $268 | $349 | $738 | $1,078 |
| Personal Income Tax | 216 | (131) | (271) | (410) |
| Business Taxes | (383) | (245) | 152 | 332 |
| Sales Tax | 20 | (259) | (265) | (277) |
| Real Estate Transaction Taxes | 100 | 128 | (40) | (72) |
| All Other | 0 | 86 | 14 | 56 |
| Audit | 0 | 154 | 154 | 154 |
| Subtotal Tax Revenues | $221 | $82 | $482 | $861 |
| Expenditures | ||||
| Overtime | ($661) | ($130) | ($130) | ($130) |
| Charter School Tuition | (35) | (205) | (380) | (600) |
| Carter Case | (125) | (125) | (125) | (125) |
| Pupil Transportation | (75) | (75) | (75) | (75) |
| DOE Medicaid Reimbursement | (20) | (20) | (20) | (20) |
| Pre-K Special Education | 50 | 50 | 50 | 50 |
| Fair Fare | 0 | (100) | (100) | (100) |
| Homeless Shelters | (73) | (73) | (73) | (73) |
| Pension Contributions | 0 | (66) | (133) | (200) |
| VRDB Interest Savings | 175 | 0 | 0 | 0 |
| Subtotal Expenditures | ($764) | ($744) | ($986) | ($1,273) |
| Total (Risks)/Offsets | ($543) | ($662) | ($504) | ($412) |
| Restated (Gap)/Surplus | ($543) | ($4,842) | ($3,547) | ($3,594) |
Revenues
Both the Comptroller’s Office and the City have reduced estimates of tax revenues since the Executive Budget as a result of a slower expected trajectory for recovery. The Comptroller’s projections are lowered in FY 2021 by $1.1 billion, bringing the total estimated lost revenue compared to pre-pandemic levels to more than $7 billion in FY 2021, and more than $20 billion for the Plan period. Most of the estimated loss, about $16 billion, is expected to occur in non-property tax revenue. This is due to the lagged nature of property tax assessments and the potential buffer to property tax declines due to the gradual phase-ins of lower assessments.
The City, which had been anticipating a faster recovery, also reduced its forecast for revenues — by $1.54 billion in FY 2021 and $600 million to $800 million in each of the outyears. With these lowered estimates, the City’s tax revenue forecast which was higher than the Comptroller’s Office’s in April is now below the Comptroller’s Office’s current forecast. As shown in Table 14, the Comptroller’s Office’s current tax revenues forecasts are above the City’s by $221 million in FY 2021 and by $82 million to $861 million in the outyears.
Expenditure Risks
Risks to the City’s expenditure estimates stem from risks to the Plan’s funding for overtime, several Department of Education expenditures including funding for charter school tuition and special education Carter cases, Fair Fares program, homeless shelters, and pension contributions.
Overtime
The Comptroller’s Office estimates that overtime spending will exceed the Plan projections by $661 million in FY 2020 and $130 million in each of the outyears of the Plan. Risk to the uniformed police overtime budget accounts for more than half the overall overtime risk in FY 2021.The Adopted Budget includes a proposal to reduce uniform police overtime to $227 million, almost 60 percent below the FY 2020 uniform police overtime budget and only $5 million above the FY 2000 uniform police overtime. While the suspension of planned events such as parades and street fairs will lower overtime, continued protests in support of the Black Lives Matter movement will result in additional overtime. Past experience has demonstrated that attempts to reduce overtime spending are often thwarted by reality. In the absence of a detailed plan on how to achieve the unprecedented reduction in uniformed police overtime, the Comptroller’s Office estimates that FY 2021 uniformed police overtime could exceed the City’s estimate by $373 million.
Department of Education
The DOE budget does not fund potential costs associated with higher charter school tuition rates that will likely be approved by the State in the outyears. While the State has frozen charter tuition rate in the upcoming school year, lacking additional support from the State, the City could face risks ranging from $35 million to $600 million annually in FY 2021 – FY 2024. In addition, the budget for special education Carter Cases spending remains underfunded and will likely require additional funding of $125 million annually over the Plan period. The Department also continues to fund pupil transportation costs well below last year’s projection that will likely result in annual risks of $75 million over the Plan period. Rounding out the assessment are Medicaid revenue risks of $20 million and special education pre-K underspending of $50 million in each year of the Plan.
Fair Fares Program
Due to the low participation rate in the Fair Fare program exacerbated by the COVID-19 pandemic, the City reduced the funding for the Fair Fare program in FY 2021 by $65 million to $41 million. The current estimate is consistent with the Comptroller’s Office’s estimate for FY 2021. However, the Plan does not include any funding for the program in the outyears. The Comptroller’s Office estimates the cost of the program will increase to $100 million in the outyears of the Plan as participation rate increases.
Homeless Shelters
The Adopted FY 2021 Budget calls for a reduction of $194 million in City-funds for adult shelter operations compared to FY 2020 levels. The reduction in City-funds spending is due in part to the use of $127 million in Emergency Solutions Grant (ESG) funding from the CARES act to support adult shelter operations. In the last year, the single adult shelter census increased by 9.1 percent and has averaged an annual increase of 9.2 percent since the close of FY 2014. Given persistent increases in the single adult shelter and the uncertainty of the COVID-19 outbreak, the Comptroller’s Office does not anticipate that shelter operations expenses in FY 2021 will decline from FY 2020 levels. After taking the ESG funding into account, the Comptroller’s Office projects a risk of $73 million for adult shelter operations in each of FY 2021 through FY 2024.
Pension Contributions
The preliminary unaudited returns for the City’s actuarial pension systems, combined, was 4.44 percent. Pension contributions in the June 2020 Plan are based on an actuarial interest rate assumption (AIRA) of 7 percent. The shortfall in earnings below the AIRA on the actuarial asset value will be phased in over six years beginning in FY 2022. The Comptroller’s Office estimates that this shortfall will result in additional pension contributions of $66 million in FY 2022, $133 million in FY 2023 and $200 million in FY 2024.
The expenditure risks are somewhat tempered by anticipated savings from lower interest rates on variable rate debt bonds (VRDB) than those assumed in the Plan. The debt service on VRDB in the Financial Plan is based on a conservative estimate of variable interest rates. With variable interest rates currently under 1 percent, the Comptroller’s Office estimates that FY 2021 debt service on variable rate demand bonds could be $175 million less than projected in the Plan.
There are risks to the budget beyond those quantified in our analysis. Most immediately, a failure by the Federal Government to provide adequate fiscal relief to state and local governments could upend the State budget – and by extension, the City’s. New York State has threatened to reduce local aid by as much as 20 percent if Congress does not appropriate additional, unrestricted aid to states and local governments, using executive powers included in the enacted State budget.
Other risks stem from the uncertainty surrounding the trajectory of the coronavirus itself: A recurring surge of the virus could lead to another round of business shutdowns and stay-at-home orders. Longer-term, changes in work patterns and behavior could negatively impact the City’s tax base, even with the eventual development of a vaccine.
Endnotes
[1] The U.S. government fiscal year extends from October through September.
[2] The drop in tax revenues excludes the interception of $250 million of City sales tax revenues by the State to support financially distressed hospitals and nursing facilities.
[3] The savings are net of a reversal of approximately $230 million of cuts proposed in the April Citywide Savings Program.
[4] Payments from the New York City Water Board, with the exception of $137 million in rental payments, are used for operation and maintenance of the water and sewer system. The City may request rental payment from the Water Board for an amount not to exceed the greater of: a) the principal and interest payable on general obligation bonds issued by the City for water and sewer purposes or b) 15 percent of the amount of the principal and interest payable on the bonds of the authority.
[5] Only hiring freeze and vacancy reductions with savings that extend to the end of the Plan period are classified as efficiency initiatives.
[6] The additional cuts in the outyears are due to an $11.6 million cut to the Single Shepherd program in each of the outyear of the Plan. This cut was reversed for FY 2021.
[7] The City may request rental payment from the Water Board for an amount not to exceed the greater of: a) the principal and interest payable on general obligation bonds issued by the City for water and sewer purposes or b) 15 percent of the amount of the principal and interest payable on the bonds of the authority.
[8] For consistency purposes, the FY 2008 and FY 2009 actuals include Inter-Fund Agreement revenues and expenditures and PIT support of TFA debt service.
[9] In addition to netting out the impact of prepayments and additional RHBT deposit, FY 2020 expenditures are also net of adjustments to prior-year payables.