Comments on New York City’s Fiscal Year 2022 Executive Budget
I. Executive Summary
Since the beginning of the year, following a successful rollout of COVID-19 vaccines and additional fiscal stimulus to support economic relief and recovery efforts, the outlook for the country and the City has improved considerably. Renewed consumer confidence as COVID cases continue to fall, pent-up demand, along with the easing of lockdown restrictions and business reopenings, point to a robust recovery beginning this year, with employment returning to pre-pandemic level by the second half of next year.
Reflecting the improving economic outlook for the City, the FY 2022 Executive Budget and Financial Plan that was released on April 26th increased tax revenues over the current fiscal year and next by $1.53 billion from the January Plan. In contrast, following the onset of the pandemic last year, the FY 2021 Executive Budget and Financial Plan reduced tax revenues over FY 2020 and FY 2021 by $7.67 billion. In addition to an improved tax revenue forecast, the FY 2022 Executive Budget and Financial Plan also includes $10.72 billion and $2.15 billion in stimulus funding over the Plan period from the American Recovery Plan Act (ARPA) and the Coronavirus Response and Relief Supplemental Appropriations Act (CRRSA), respectively. The Financial Plan also includes $1.4 billion in additional FEMA funding for eligible COVID related expenditures. In total, additional stimulus funding, FEMA reimbursement and revisions to CARES Act funding increase Federal COVID-related funding by $15.70 billion over the Plan period. Of this, $8.59 billion will be used for COVID recovery and response, $3.61 billion for program expansions and enhancements, $1.27 billion to reverse spending reductions from unspecified labor savings, $1.37 billion for expenses previously funded with City generated revenues, and $866 million to restore prior spending cuts.
Additional stimulus funds are the main driver of the increase in the FY 2022 Executive Budget from the Preliminary Budget. The $98.56 billion FY 2022 Executive Budget is $6.28 billion more than the Preliminary Budget, driven by an increase of $6.50 billion in stimulus grants. The Executive Budget assumes the use of $389 million of stimulus funds to restore prior spending cuts and to fund $811 million of expenditures previously supported with City funds. The funding swap, together with an upward revision of $158 million in City-funds revenues ($155 million of which is revision to tax revenues), budget relief of $339 million from the Citywide Savings Program (CSP), and increase of $270 million in the prepayment of FY 2022 debt service enable the City to increase the General Reserve by $200 million to $300 million and fund additional City-funds agency spending of $1.37 billion, of which $1.1 billion are for new needs across 46 agencies.
A $1.37 billion increase in the FY 2021 tax revenue forecast, the use of stimulus funds to support $289 million of City-funds spending, budget relief of $264 million from the CSP, and a $267 million downward revision to City-funds spending allows the City to rescind the use of $1.6 billion of Retiree Health Benefits Trust funds to pay a portion of FY 2021 retiree health insurance cost. The additional resources also allows the City to offset a drop of $56 million in non-tax revenues and $265 million of lower-than-anticipated Medicaid savings, leaving the City with an additional budget surplus of $270 million to add to the FY 2021 Budget Stabilization Account (BSA) in the January Plan. This brings the balance in the BSA to prepay a portion of FY 2022 debt service to $3.63 billion.
The fiscal outlook in the outyears has also improved modestly since the January Plan. Outyear gaps are on average $400 million below the January Plan projections. Outyear budget gaps are now projected at $3.91 billion in FY 2023, $3.70 billion in FY 2024, and $3.94 billion in FY 2025. However, the Comptroller’s Office estimates larger budget gaps of $5.17 billion in FY 2023, $5.13 billion in FY 2024, and $5.53 billion in FY 2025. The larger gaps stem primarily from the Plan’s assumptions of $1 billion of as yet unspecified labor savings in each of FY 2023 through FY 2025. In addition, risks to the Plan’s overtime expenditure estimates, Fair Fares program funding and projections of spending on adult shelter operations, which along with the labor savings risks and the Comptroller’s Office’s lower estimate for variable rate demand bond debt service, result in net expenditure risks of $175 million in FY 2021, $406 million in FY 2022, $1.41 billion in FY 2023, $1.43 billion in FY 2024, and $1.45 billion in FY 2025.
The use of stimulus funds to expand City programs through FY 2025 masks the potential outyear issue of identifying City resources to continue these programs — including 3-K for All, expanded senior services, and others — beyond the Plan period. The City should use this year’s budget to begin to look past the temporary infusion of Federal stimulus and ensure that future City budgets are put on a financially sound footing that will protect its ability to deliver services without interruption.
Table 1. FY 2021 – FY 2025 Financial Plan
| ($ in millions) | FY 2021 | FY 2022 | FY 2023 | FY 2024 | FY 2025 | Change FYs 2021 –2025 |
|
|---|---|---|---|---|---|---|---|
| Dollar | Percent | ||||||
| Revenues | |||||||
| Taxes: | |||||||
| General Property Tax | $31,108 | $29,522 | $30,192 | $30,619 | $31,027 | ($81) | (0.3%) |
| Other Taxes | 30,154 | 31,913 | 34,524 | 36,224 | 37,687 | 7,534 | 25.0% |
| Tax Audit Revenues | 1,171 | 921 | 721 | 721 | 721 | (450) | (38.4%) |
| Subtotal: Taxes | $62,432 | $62,356 | $65,437 | $67,564 | $69,435 | $7,003 | 11.2% |
| Miscellaneous Revenues | 7,239 | 6,873 | 6,887 | 6,878 | 6,891 | (348) | (4.8%) |
| Unrestricted Intergovernmental Aid | 1 | 0 | 0 | 0 | 0 | (1) | (100.0%) |
| Less: Intra-City Revenues | (2,091) | (1,891) | (1,858) | (1,858) | (1,853) | 238 | (11.4%) |
| Disallowances Against Categorical Grants | (15) | (15) | (15) | (15) | (15) | 0 | 0.0% |
| Subtotal: City-Funds | $67,566 | $67,323 | $70,451 | $72,569 | $74,458 | $6,892 | 10.2% |
| Other Categorical Grants | 1,121 | 1,025 | 993 | 991 | 990 | (131) | (11.7%) |
| Inter-Fund Revenues | 658 | 725 | 725 | 725 | 725 | 67 | 10.2% |
| Federal Categorical Grants | 16,305 | 13,566 | 9,157 | 8,598 | 7,904 | (8,401) | (51.5%) |
| State Categorical Grants | 15,011 | 15,921 | 16,305 | 16,624 | 16,874 | 1,863 | 12.4% |
| Total Revenues | $100,661 | $98,560 | $97,631 | $99,507 | $100,951 | $290 | 0.3% |
| Expenditures | |||||||
| Personal Service | |||||||
| Salaries and Wages | $29,294 | $31,086 | $30,740 | $30,875 | $31,158 | $1,864 | 6.4% |
| Pensions | 9,503 | 10,263 | 10,468 | 10,660 | 10,597 | 1,094 | 11.5% |
| Fringe Benefits | 11,295 | 12,382 | 11,846 | 12,940 | 13,897 | 2,602 | 23.0% |
| Subtotal-PS | $50,092 | $53,731 | $53,054 | $54,475 | $55,652 | $5,560 | 11.1% |
| Other Than Personal Service | |||||||
| Medical Assistance | $6,140 | $6,418 | $6,494 | $6,494 | $6,494 | $354 | 5.8% |
| Public Assistance | 1,604 | 1,651 | 1,650 | 1,650 | 1,650 | 46 | 2.9% |
| All Other | 38,706 | 34,891 | 32,555 | 32,408 | 32,342 | (6,364) | (16.4%) |
| Subtotal-OTPS | $46,450 | $42,960 | $40,699 | $40,552 | $40,486 | ($5,964) | (12.8%) |
| Debt Service | |||||||
| Principal | $3,612 | $3,718 | $3,943 | $4,053 | $4,041 | $429 | 11.9% |
| Interest & Offsets | 2,739 | 3,370 | 4,448 | 4,735 | 5,311 | $2,572 | 93.9% |
| Subtotal Debt Service | $6,351 | $7,088 | $8,391 | $8,788 | $9,352 | $3,001 | 47.3% |
| FY 2020 BSA | ($3,819) | $0 | $0 | $0 | $0 | $3,819 | (100.0%) |
| FY 2021 BSA | $3,628 | ($3,628) | $0 | $0 | $0 | ($3,628) | (100.0%) |
| Capital Stabilization Reserve | $0 | $0 | $250 | $250 | $250 | $250 | NA |
| General Reserve | $50 | $300 | $1,000 | $1,000 | $1,000 | $950 | 1,900.0% |
| Less: Intra-City Expenses | (2,091) | (1,891) | (1,858) | (1,858) | (1,853) | 238 | (11.4%) |
| Total Expenditures | $100,661 | $98,560 | $101,536 | $103,207 | $104,887 | $4,226 | 4.2% |
| Gap To Be Closed | $0 | $0 | ($3,905) | ($3,700) | ($3,936) | ($3,936) | NA |
Note: Numbers may not add to totals due to rounding.
Table 2. Plan-to-Plan Changes April 2021 Plan vs. January 2021 Plan
| ($ in millions) | FY 2021 | FY 2022 | FY 2023 | FY 2024 | FY 2025 |
| Revenues | |||||
| Taxes: | |||||
| General Property Tax | $264 | $0 | $0 | $0 | $0 |
| Other Taxes | 1,110 | 164 | 633 | 820 | 857 |
| Tax Audit Revenues | 0 | 0 | 0 | 0 | 0 |
| Subtotal: Taxes | $1,373 | $164 | $633 | $820 | $857 |
| Miscellaneous Revenues | (26) | 83 | 110 | 101 | 116 |
| Unrestricted Intergovernmental Aid | 1 | 0 | 0 | 0 | 0 |
| Less: Intra-City Revenues | (30) | (80) | (51) | (52) | (47) |
| Disallowances Against Categorical Grants | 0 | 0 | 0 | 0 | 0 |
| Subtotal: City-Funds | $1,318 | $167 | $692 | $869 | $926 |
| Other Categorical Grants | (12) | 5 | 5 | 5 | 5 |
| Inter-Fund Revenues | (37) | 19 | 69 | 69 | 69 |
| Federal Categorical Grants | 4,439 | 6,490 | 2,211 | 1,669 | 980 |
| State Categorical Grants | (100) | (406) | (460) | (190) | 60 |
| Total Revenues | $5,608 | $6,275 | $2,517 | $2,422 | $2,040 |
| Expenditures | |||||
| Personal Service | |||||
| Salaries and Wages | $115 | $1,402 | $723 | $587 | $407 |
| Pensions | 0 | 0 | 0 | 0 | 0 |
| Fringe Benefits | 165 | 803 | (396) | (105) | 78 |
| Retiree Health Benefits Trust | 1,600 | 0 | 0 | 0 | 0 |
| Subtotal-PS | $1,880 | $2,205 | $327 | $482 | $485 |
| Other Than Personal Service | |||||
| Medical Assistance | $587 | $503 | $579 | $579 | $579 |
| Public Assistance | (7) | 0 | 0 | 0 | 0 |
| All Other | 3,014 | 3,987 | 1,348 | 954 | 708 |
| Subtotal-OTPS | $3,594 | $4,490 | $1,927 | $1,533 | $1,287 |
| Debt Service | |||||
| Principal | $349 | ($47) | ($282) | ($57) | $1,643 |
| Interest & Offsets | (455) | (223) | 190 | 24 | (1,670) |
| Subtotal Debt Service | ($106) | ($270) | ($92) | ($34) | ($27) |
| FY 2020 BSA | $0 | $0 | $0 | $0 | $0 |
| FY 2021 BSA | $270 | ($270) | $0 | $0 | $0 |
| Capital Stabilization Reserve | $0 | $0 | $0 | $0 | $0 |
| General Reserve | $0 | $200 | $0 | $0 | $0 |
| Less: Intra-City Expenses | ($30) | ($80) | ($51) | ($52) | ($47) |
| Total Expenditures | $5,608 | $6,275 | $2,111 | $1,929 | $1,698 |
| Gap To Be Closed | $0 | $0 | $406 | $493 | $342 |
Note: Numbers may not add to totals due to rounding.
Table 3. Plan-to-Plan Changes April 2021 Plan vs. June 2020 Plan
| ($ in millions) | FY 2021 | FY 2022 | FY 2023 | FY 2024 |
| Revenues | ||||
| Taxes: | ||||
| General Property Tax | $256 | ($2,479) | ($2,671) | ($2,607) |
| Other Taxes | 3,285 | 887 | 1,445 | 2,229 |
| Tax Audit Revenues | 250 | 200 | 0 | 0 |
| Subtotal: Taxes | $3,790 | ($1,392) | ($1,226) | ($378) |
| Miscellaneous Revenues | 279 | 29 | 58 | 49 |
| Unrestricted Intergovernmental Aid | 1 | 0 | 0 | 0 |
| Less: Intra-City Revenues | (249) | (54) | (24) | (24) |
| Disallowances Against Categorical Grants | 0 | 0 | 0 | 0 |
| Subtotal: City-Funds | $3,821 | ($1,417) | ($1,192) | ($353) |
| Other Categorical Grants | 146 | 36 | 5 | 5 |
| Inter-Fund Revenues | (19) | 50 | 50 | 50 |
| Federal Categorical Grants | 8,935 | 6,600 | 2,235 | 1,681 |
| State Categorical Grants | (414) | (363) | (434) | (164) |
| Total Revenues | $12,469 | $4,906 | $664 | $1,219 |
| Expenditures | ||||
| Personal Service | ||||
| Salaries and Wages | ($455) | $1,114 | $204 | $60 |
| Pensions | (429) | (219) | 94 | 590 |
| Fringe Benefits | 730 | 926 | (409) | (120) |
| Retiree Health Benefits Trust | 1,600 | 0 | 0 | 0 |
| Subtotal-PS | $1,446 | $1,821 | ($111) | $530 |
| Other Than Personal Service | ||||
| Medical Assistance | $902 | $503 | $579 | $579 |
| Public Assistance | (24) | 0 | 0 | 0 |
| All Other | 7,835 | 3,952 | 1,402 | 1,009 |
| Subtotal-OTPS | $8,713 | $4,455 | $1,981 | $1,588 |
| Debt Service | ||||
| Principal | ($106) | ($250) | ($135) | ($14) |
| Interest & Offsets | (913) | (668) | (185) | (343) |
| Subtotal Debt Service | ($1,019) | ($918) | ($320) | ($357) |
| FY 2020 BSA | $0 | $0 | $0 | $0 |
| FY 2021 BSA | $3,628 | ($3,628) | $0 | $0 |
| Capital Stabilization Reserve | $0 | ($250) | $0 | $0 |
| General Reserve | ($50) | ($700) | $0 | $0 |
| Less: Intra-City Expenses | ($249) | ($54) | ($24) | ($24) |
| Total Expenditures | $12,469 | $726 | $1,526 | $1,737 |
| Gap To Be Closed | $0 | $4,180 | ($862) | ($518) |
Note: Numbers may not add to totals due to rounding.
Table 4. Risks and Offsets to the April 2021 Financial Plan
($ in millions, positive numbers decrease the gap and negative numbers increase the gap)
| FY 2021 | FY 2022 | FY 2023 | FY 2024 | FY 2025 | |
| City Stated Gap | $0 | $0 | ($3,905) | ($3,700) | ($3,936) |
| Tax Revenues | |||||
| Property Tax | $0 | $236 | $242 | $245 | $254 |
| Personal Income Tax | 1,050 | 229 | (358) | (206) | (167) |
| Business Taxes | 210 | 157 | (64) | (176) | (166) |
| Sales Tax | 91 | 291 | 164 | 142 | 81 |
| Real Estate Transaction Taxes | 20 | 162 | (113) | (281) | (417) |
| All Other | 8 | 98 | (6) | (7) | (11) |
| Audit | 0 | 79 | 279 | 279 | 279 |
| Subtotal Tax Revenues | $1,379 | $1,252 | $144 | ($4) | ($147) |
| Expenditures | |||||
| Overtime | ($225) | ($131) | ($130) | ($130) | ($130) |
| Fair Fares | 0 | (47) | (100) | (100) | (100) |
| Adult Shelter Operations | 0 | (147) | (147) | (147) | (147) |
| Labor Savings | 0 | 0 | (1,000) | (1,000) | (1,000) |
| Paratransit | 0 | (81) | (111) | (130) | (150) |
| VRDB Interest Savings | 0 | 0 | 80 | 80 | 80 |
| General Reserve | 50 | 0 | 0 | 0 | 0 |
| Subtotal | ($175) | ($406) | ($1,408) | ($1,427) | ($1,447) |
| Total (Risks)/Offsets | $1,204 | $846 | ($1,264) | ($1,431) | ($1,594) |
| Restated (Gap)/Surplus | $1,204 | $846 | ($5,169) | ($5,131) | ($5,530) |
Note: Numbers may not add to totals due to rounding.
II. The City’s Economic Outlook
Comptroller’s Economic Forecast, 2021 – 2025
The past year brought historic changes in American life, more dramatically to New York City than almost anywhere else: how people work, how they go to school, how they shop, and even where they choose to live. We forecast a robust New York City recovery starting in the second quarter of 2021 and through the coming year, despite unprecedented uncertainty about the extent to which these historic changes will persist, or be reversed, in the year to come. Table 5 below shows the Comptroller’s Office’s forecast of selected economic indicators.
Table 5. Selected Economic Indicators Comptroller’s and Mayor’s Forecasts
| 2021 | 2022 | 2023 | 2024 | 2025 | ||
| Selected US Economic Indicators (Annual Averages) | ||||||
| Real GDP (2012 $, % Change) | Comptroller
Mayor |
5.4
5.7 |
3.0
4.1 |
3.4
2.5 |
3.1
2.5 |
2.1
2.4 |
| Payroll Jobs (Change In Millions) | Comptroller
Mayor |
3.1
3.4 |
3.2
4.9 |
3.1
2.7 |
1.6
1.7 |
1.3
1.1 |
| Fed Funds Rate (Percent) | Comptroller
Mayor |
0.1
0.1 |
0.1
0.1 |
0.5
0.1 |
1.3
0.3 |
2.2
0.5 |
| 10-Year Treasury Notes (Percent) | Comptroller
Mayor |
1.7
1.8 |
2.1
2.3 |
2.7
2.4 |
3.1
2.6 |
3.5
2.9 |
| Selected NYC Economic Indicators (Annual Averages) | ||||||
| Real GCP (2012 $, % Change) | Comptroller
Mayor |
2.4
5.1 |
2.7
6.4 |
2.9
3.8 |
1.8
2.5 |
0.9
2.2 |
| Payroll Jobs (Change In Thousands) | Comptroller
Mayor |
122.1
151.3 |
320.8
292.5 |
100.9
147.5 |
104.5
64.3 |
108.2
72.2 |
| Wage-Rate Growth (Percent) | Comptroller
Mayor |
0.1
1.9 |
1.0
2.5 |
2.1
3.1 |
1.4
2.8 |
2.2
2.6 |
Note: Comptroller=forecast by the NYC Comptroller’s Office. GCP=Gross City Product. Mayor= forecast by the NYC Office of Management and Budget in the Fiscal Year 2022 Executive Budget Message of the Mayor.
The National Economy
The pandemic continues to recede in the United States, with COVID cases, hospitalizations and deaths falling steadily from winter highs. As of May 17th, 84.5 percent of U.S. seniors, 59.7 percent of U.S. adults and 47.3 percent of the U.S. population had received at least one vaccine dose.
U.S. gross domestic product grew at an annualized rate of 6.4 percent in the first quarter of 2021, buoyed by a reopening economy and fiscal stimulus. Going forward, the nation’s successful vaccination effort will bring a continued decline in COVID cases, allowing for continued reopening of the U.S. economy and associated economic growth.
Many factors suggest robust growth going forward. All major U.S. stock market indices have rebounded from pandemic lows. Mortgage and interest rates remain near historical lows, enabling low-cost borrowing for businesses and home buyers. Home price growth has been robust in rural and suburban areas, as Americans sought out extra space for working at home and recreation away from the crowds.
U.S. personal savings jumped from the seasonally adjusted annualized rate of $1.2 trillion before the pandemic, to $4.8 trillion in the pandemic’s immediate aftermath of the second quarter of 2020, as wary consumers prepared for the worst. Savings declined somewhat in subsequent months, while remaining elevated, before rebounding again to an annualized rate of $4.1 trillion in the first quarter of 2021, driven at least in part by large fiscal stimulus payments to U.S. families.[1]
These trillions in savings represent just one metric of pent-up demand for the millions of workers that spent much of the last year at home, and a potential source of inflationary pressure as the economy reopens. The consumer price index for all-urban consumers increased by 4.2 percent in April, from April a year ago, the fastest increase since 2008, driven by a 25.1 percent increase in energy prices, and a 49.6 percent increase in gasoline prices. Rising energy prices, in particular gas prices, which have risen above pre-pandemic levels, represent one of few headwinds to economic growth.[2]
Another potential headwind, at least in the short term, is unexpected tightness in the labor market. Although the U.S. seasonally adjusted unemployment rate has fallen dramatically to 6.1 percent in April, down from 14.8 percent in April of 2020, it remains elevated compared to the pre-pandemic rate of 3.5 percent in February 2020. Despite relatively high unemployment and robust GDP growth, the U.S. economy added only 266,000 jobs in April. While there is not a definitive explanation for the slow pace of employment growth, there is reason to suspect that many Americans may be less than eager to return to work. Current unemployment insurance benefits, including supplemental pandemic-related programs, are generous, and Federal stimulus payments made in March offering families up to $1,400, may have given those out of work the economic cushion to be more discriminating in job choices. Young adults, who are over-represented among the unemployed, but as yet under-represented among the vaccinated, may be hesitant to return to lower-wage jobs providing in-person goods and services. Those U.S. schools that have yet to fully reopen to in-person learning also make it difficult for parents to return to in-person work. As of April 2021, U.S. labor force participation also remains depressed at 67.6 percent for men and 56.1 percent for women, down from 69.2 percent and 57.8 percent, respectively, in February 2020.
The New York City Economy
As with the nation, the pandemic continues to ebb in New York City, with COVID cases declining from over 6,000 daily in early January 2021 to under 1,000 daily in early May. COVID hospitalizations have declined from more than 400 daily in early February to under 100 daily in May 2021, and COVID deaths have declined to about 30 daily, from a recent peak of 86 daily in early February. All have fallen dramatically from the worst days of the pandemic in early April of 2020, when hospitalizations peaked at over 1,600 daily, with 819 COVID deaths on April 7th, 2020 alone.[3]
All of these metrics should continue to fall thanks to New York City’s successful vaccination efforts. As of May 16th, 58 percent of New York City adults, and 47 percent of all residents had received at least one vaccine dose, rates almost identical to those of the nation as a whole.
But New York City faces a longer road to recovery than the nation. The density of people that facilitates the exchange of ideas, creativity, innovation, and collaboration, also facilitates the spread of disease, and COVID hit New York City especially hard. As office workers switched to working from home, students studied from home, and visitors stayed home, office towers and public transportation emptied. Many of the businesses patronized by commuters, students, and visitors shut down, and many of their workers remain unemployed.
Although the New York City economy has recovered substantially from the initial shutdowns of the pandemic, and more recently from a winter COVID surge, there is still a long way to go. New York City’s unemployment rate fell to 11.2 percent in March (not seasonally adjusted), down from 20.2 percent in May 2020, but well above the 4.2 percent of March 2020.[4] New York City private employment rose to a seasonally adjusted 3.5 million in March 2021, an increase of 268,000 from May 2020, but still 578,000 jobs below the seasonally adjusted peak of 4.08 million in February 2020. Losses remain concentrated in jobs providing in-person good and services.
Remote work depressed demand for office space, and Manhattan office vacancy rates rose to a multi-decade high of 16.3 percent in the first quarter of 2021, up from 11.3 percent in the first quarter of 2020. Asking rents have fallen since 2019, and will likely continue to do so.[5]
New York City’s population has likely declined as well, in line with a COVID-related shift in population from urban areas to suburban and rural ones observed across the country, and around the world. Many of the wealthiest New Yorkers decamped to second homes, office workers took advantage of remote work, and the arrival of new students, new graduates, new hires, and foreign immigrants to New York City slowed. Early estimates based on cell phone data showed a New York City population decline of about 420,000, as of May 2020.[6] Later estimates based on postal change of address data show a smaller decline of 100,000 to 200,000.[7] But more recent estimates based on cell phone data show these declines reversing, at least partially, in late 2020 and the early months of 2021, particularly in Manhattan.[8]
While home prices have remained relatively stable, the market for New York City rental apartments has deteriorated. Median New York City asking rents have fallen from a peak of $2,950 in July of 2019, to $2,475 in March of 2021, a 16 percent decline. Rental inventories rose from pre-pandemic lows under 30,000 in February and March of 2020 to over 75,000 units in August and September of 2020, before falling to 58,000 in March of 2021, still almost double pre-pandemic levels.[9]
These changes have had a meaningful impact on the cost of living in New York City. April consumer prices in the New York – New Jersey metropolitan area increased 3.2 percent from April a year ago, that largest increase since 2011, driven by a 16.1 percent increase in energy prices and a 29 percent increase in gasoline prices. But the cost of housing, the traditional driver of New York City’s high cost of living, increased only 2 percent from a year ago. Residential rent rose 0.3 percent, equal to last month, and apart from that, the smallest recorded year-over-year increase in New York area rent since 1958.[10]
While these measures suggest New York City still has a long way to go on its path to recovery, the latest data, and more forward-looking measures point to growth ahead. Although still below pre-pandemic levels, New York City Subway ridership has continued to rise steadily, rebounding to over 2 million trips weekly, compared to a winter low of fewer than 1.5 million, which reflects a gradual return to commuting, tourism, and economic activity.
Similarly, mobility data show New York City residents gradually increasing their time spent shopping, in transit and at workplaces. As of early May, time spent at workplaces was down 35 percent from pre-pandemic levels, but was down as much as 47 percent as recently as February.
April and May New York City job ads have rebounded to well above pre-pandemic levels,[11] consistent with national data showing 8.1 million job openings in March 2021, the most ever recorded.[12] New York City employers are looking to hire in anticipation of a full reopening.
Increased vaccine availability should allow all college students to return to New York City, and allow local students to return to classrooms in the fall, giving parents more flexibility to work. Vaccination will also allow New York City’s entertainment venues, and cultural institutions to return to full capacity over the summer, with Broadway scheduled to reopen at full capacity on September 14th. New York City has budgeted $30 million for an upcoming tourism campaign. Visitors from around the country will return, but foreign visitors, particularly from countries with less access to COVID vaccines, may take longer. These factors point to robust New York City economic and employment growth in the coming year, especially in the fall.
III. The FY 2022 Executive Budget and April 2021 Financial Plan
In late December 2020, Congress passed the Coronavirus Response and Relief Supplemental Appropriations Act (CRRSA) which provided $868 billion nationwide to ease the economic impact of the COVID-19 pandemic. This was followed by the American Rescue Plan Act (ARPA) in March 2021 which provided $1.9 trillion in national funding to support relief and economic recovery efforts, including $350 billion in assistance to states and localities to defray expenses, make up for revenue losses and mitigate the overall economic impact from the COVID-19 pandemic. The City’s FY 2022 Executive Budget and April 2021 Financial Plan, which was released on April 26th reflects New York City’s share of the local relief provided by both Acts.
The FY 2022 Executive Budget totals $98.56 billion, an increase of $6.28 billion from the Preliminary Budget. The increase is driven by an increase of $6.49 billion in Federal categorical grants. Similarly, the FY 2021 Budget Modification shows an increase of $5.61 billion to $100.66 billion, stemming from a $4.44 billion increase in Federal categorical grants and $1.37 billion in tax revenues. Relief from CRRSA and ARPA continues into the outyears, accounting for most of the Federal categorical grant increases of $2.21 billion, $1.67 billion, and $980 million in FY 2023 through FY 2025, respectively. The bulk of the Federal relief in the outyears is used to fund COVID recovery and response in FY 2023, and after FY 2023, to fund program expansion and enhancement as well as restorations of outyear cuts initiated in prior Financial Plans, as discussed in “Federal Stimulus Aid”, beginning on page 19.
FY 2021 Budget
The FY 2021 Budget was increased by $5.61 billion to $100.66 billion in the April Financial Plan, due in large part to the increase in Federal categorical grants. The $4.44 billion increase in Federal categorical grants stems from Federal stimulus grants and Federal actions, including $1.95 billion from the American Rescue Plan Act of 2021 (ARPA), $146 million from the Coronavirus Response and Relief Supplemental Appropriations (CRRSA) Act, and $1.38 billion in additional FEMA grants primarily from President Biden’s Executive Order to increase FEMA reimbursements from 75 percent of eligible expenses to 100 percent. In addition, the FY 2021 Budget reflects an additional $456 million from the Coronavirus Relief Fund.
The remaining increase in the FY 2021 Budget is due to an upward revision of $1.37 billion in tax revenues to reflect stronger than anticipated tax collections. Collections through March, excluding audit, were $1.15 billion above the January projection, driven by strong collections in property, personal income, and business tax revenues, which collectively was $1.29 billion above the January projection.[13]
The increase in tax revenues, combined with the use of $289 million of stimulus funding to support expenditures previously funded with City-funds revenues, savings from a new round of Citywide Savings Program and a net decrease in agency spending, provide the City with $2.19 billion of additional resources, as shown in Table 6. The additional resources allow the City to rescind the planned use of $1.6 billion of Retiree Health Benefit Trust funds to pay for a portion of FY 2021 retiree health insurance costs, and to cover a drop of $56 million in non-tax revenues and $265 million of lower-than-anticipated Medicaid savings, leaving the City with an additional budget surplus of $270 million to add to the FY 2021 Budget Stabilization Account (BSA) in the January Plan. This brings the balance in the BSA to $3.63 billion. The BSA is earmarked for prepayments of FY 2022 debt service.
Table 6. Changes to FY 2021 City-Funds Estimates from the January Plan
| ($ in millions) | |
| January 2021 Financial Plan Gap | $0 |
| Resources | |
| Tax Revenues | $1,373 |
| Agency Spending Reduction | 267 |
| Citywide Savings Program | 264 |
| Stimulus Funding Swap | 289 |
| Stimulus Funding Offsets to Restorations of Spending Cuts | 1 |
| Total Resources | $2,194 |
| Use of Resources | |
| Rescind Use of Retiree Health Benefit Trust | $1,600 |
| Takedown of eFMAP Savings | 265 |
| Decline in Non-Tax Revenues | 56 |
| Restoration of Spending Cuts | 3 |
| Total Uses | $1,924 |
| Surplus Before Prepayments | $270 |
| Prepayments of FY 2022 Expenses | ($270) |
| April 2021 Financial Plan Gap | $0 |
FY 2022 Budget
The $98.56 billion FY 2022 Executive Budget is $2.10 billion less than the FY 2021 budget. The decrease is driven by a drop in COVID-related spending, which is expected to fall from $6.94 billion in FY 2021 to $2.62 billion in FY 2022, as the City recovers from the pandemic. Net of COVID-related spending, the FY 2022 Executive Budget is $2.21 billion higher than the FY 2021 Budget.
The Executive Budget includes $1.70 billion in additional City-funds resources. Most of the additional resources arise from the use of stimulus funds to restore spending cuts in prior Citywide Savings Program (CSP) initiatives and replace expenditures previously funded with City-funds, as shown in Table 7. In addition, new CSP initiatives in the current Financial Plan are expected to provide $339 million of budget relief in FY 2022. Upward revisions to tax and City-funds non-tax revenues provide another $158 million of resources.
The additional resources enable the City to restore $399 million in spending cuts included in previous CSPs, increase the General Reserve by $200 million to $300 million, and fund agency spending increases of $1.37 billion. Funding for new needs across 46 agencies account for $1.10 billion of the agency spending increase. The new needs range from a low of $118,278 in the Equal Employment Practices Commission to a high of $106 million in the Department of Social Services (DOSS). Among the new needs are:
- $85 million to fund a shortfall in Emergency Assistance for Family funding in the Department of Homeless Services;
- $46 million for the expansion of speed cameras, bringing the total number of speed cameras citywide to 2,220;
- $27 million for the expansion of the Cure Violence program to 5 additional precincts;
- $20 million to launch a Community Care Plan to expand equitable access to services for seniors;
- $23 million to fund family home visits for first-time parents.
Table 7. Changes to FY 2022 City-Funds Estimatesfrom the Preliminary Budget
| ($ in millions) | |
| January 2021 Financial Plan Gap | $0 |
| Resources | |
| Stimulus Funding Swap | $811 |
| Stimulus Funding Offsets to Restoration of Funding Cuts | 389 |
| Citywide Savings Program | 339 |
| Tax Revenues | 155 |
| Non-Tax Revenues | 3 |
| Total Resources | $1,697 |
| Use of Resources | |
| Agency Spending Increase | $1,368 |
| Restoration of Spending Cuts | 399 |
| General Reserve | 200 |
| Total Uses | $1,967 |
| Gap to be Closed Before Prepayments | ($270) |
| FY 2021 Prepayments | $270 |
| April 2021 Financial Plan Gap | $0 |
Citywide Savings Program
The April 2021 Financial Plan includes another round of savings that is expected to provide budget relief totaling $1.15 billion over FY 2021 through FY 2025, significantly less than has been the case in prior Executive Budget Financial Plans. About 72 percent of the savings are from debt service savings and expenditure re-estimates.
The Plan also restores $391 million of spending cuts proposed in the November 2020 and January 2021 Financial Plans, of which $365 million is funded with stimulus funds. Restorations of one-time cuts in FY 2022 account for $221 million of the restoration, with reversals of initiatives proposed in January to delay the 3-K expansion, temporarily reduce Fair Student Funding, and reduce per session spending in the Department of Education (DOE) accounting for $215 million of the total. Restorations to DOE cuts are discussed in greater detail in “Department of Education” beginning on page 32. Partial restoration of hiring and attrition management, which increased replacement hiring from 1 replacement hire for every 3 separations to 1 replacement hire to every 2 separations, accounts for most of the restoration in the outyears of the Plan. The partial restoration is expected to cost between $36 million to $38 million annually, beginning in FY 2022, and will also be funded with stimulus grants.
With the restoration of cuts, savings from CSP initiated in the current fiscal year now total $7.10 billion over FY 2021 through FY 2025. Savings over the first two years total $3.89 billion, approximately 55 percent of the savings over FY 2021 through FY 2025. As Chart 1 shows, debt service savings, expenditure re-estimates and efficiency initiatives account for 78 percent of the savings in FY 2021 and FY 2022.
Chart 1. Combined FY 2021 and FY 2022 Citywide Savings Program
($ in millions)
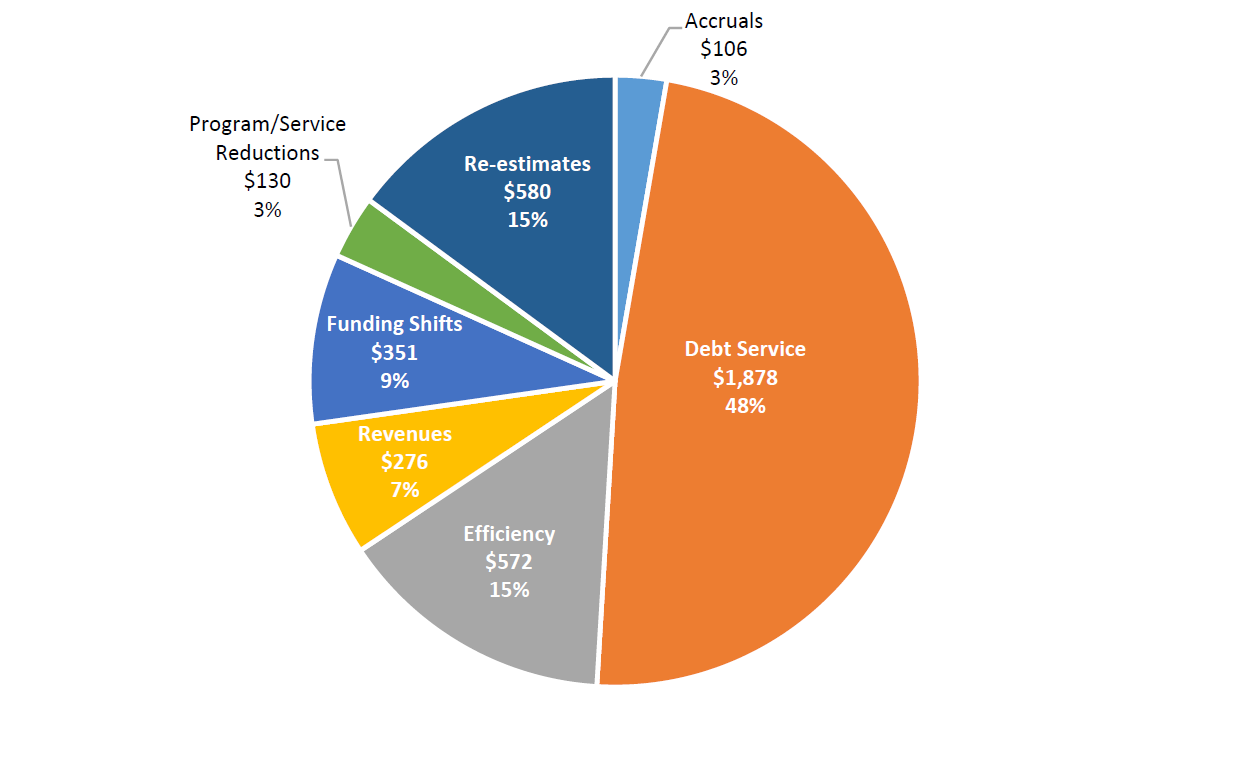
In addition to restoring some of the cuts proposed this fiscal year, the Plan also restored $371 million of outyear cuts proposed in FY 2020. All but $3 million of the restoration are funded with stimulus grants, with restorations in the DOE accounting for $336 million of the restorations. Restorations to DOE cuts are discussed in “Department of Education” beginning on page 32. Restoration of Sunday and weekday basket service in the Department of Sanitation accounts for another $32 million of the restoration over the Plan period.
Risks and Offsets
As Table 8 shows, the Comptroller’s Office’s analysis of the April Plan shows net additional resources of $1.20 million, and $846 million in FY 2021 and FY 2022, respectively, and net risks beginning at $1.26 billion in FY 2023, and growing to $1.59 billion by FY 2025. The additional resources in FY 2021 and FY 2022 stem from the Comptroller’s Office’s tax revenue forecast, which is higher than the City’s projections by $1.38 billion and $1.25 billion in FY 2021 and FY 2022, respectively. The Comptroller’s Office projects net expenditure risks in each of FY 2021 through FY 2025, beginning at $175 million in FY 2021 and growing to $1.45 billion in FY 2025. In FY 2021 through FY 2023, the Comptroller’s Office’s higher revenue forecast offsets, in whole or in part, the expenditure risks. However, in FY 2024 and FY 2025, the Comptroller Office’s lower tax revenue forecasts adds to the expenditure risks. The Comptroller’s Office’s tax revenue forecast is discussed in greater detail in “Tax Revenues” beginning on page 14.
The Comptroller’s Office estimates that expenditures could exceed the Plan projections by $175 million in FY 2021, $406 million in FY 2022, $1.41 billion in FY 2023, $1.43 billion in FY 2024, and $1.45 billion in FY 2025. The spike in expenditure risk in FY 2023 is due to the Plan’s assumption of as yet unspecified labor savings. The City had assumed annual labor savings of $1 billion beginning in FY 2021 in the June 2020 Plan. Since then, the City had credited $730 million of deferral and furlough savings to FY 2021 labor savings, leaving $270 million of unspecified savings. The City plans to use $1.27 billion of stimulus funds to substitute for the unspecified labor savings in FY 2021 and FY 2022. However, there are as yet no details on how the labor savings in FY 2023 through FY 2025 will be achieved, posing a risk of $1 billion in each of these fiscal years.
Table 8. Risks and Offsets to the April 2021 Financial Plan
($ in millions, positive numbers decrease the gap and negative numbers increase the gap)
| FY 2021 | FY 2022 | FY 2023 | FY 2024 | FY 2025 | |
| City Stated Gap | $0 | $0 | ($3,905) | ($3,700) | ($3,936) |
| Tax Revenues | |||||
| Property Tax | $0 | $236 | $242 | $245 | $254 |
| Personal Income Tax | 1,050 | 229 | (358) | (206) | (167) |
| Business Taxes | 210 | 157 | (64) | (176) | (166) |
| Sales Tax | 91 | 291 | 164 | 142 | 81 |
| Real Estate Transaction Taxes | 20 | 162 | (113) | (281) | (417) |
| All Other | 8 | 98 | (6) | (7) | (11) |
| Audit | 0 | 79 | 279 | 279 | 279 |
| Subtotal Tax Revenues | $1,379 | $1,252 | $144 | ($4) | ($147) |
| Expenditures | |||||
| Overtime | ($225) | ($131) | ($130) | ($130) | ($130) |
| Fair Fares | 0 | (47) | (100) | (100) | (100) |
| Adult Shelter Operations | 0 | (147) | (147) | (147) | (147) |
| Labor Savings | 0 | 0 | (1,000) | (1,000) | (1,000) |
| Paratransit | 0 | (81) | (111) | (130) | (150) |
| VRDB Interest Savings | 0 | 0 | 80 | 80 | 80 |
| General Reserve | 50 | 0 | 0 | 0 | 0 |
| Subtotal | ($175) | ($406) | ($1,408) | ($1,427) | ($1,447) |
| Total (Risks)/Offsets | $1,204 | $846 | ($1,264) | ($1,431) | ($1,594) |
| Restated (Gap)/Surplus | $1,204 | $846 | ($5,169) | ($5,131) | ($5,530) |
Other expenditure risks include funding for the Fair Fares program, paratransit funding, overtime and adult shelter operations. The Financial Plan includes funding of $41 million in FY 2021 and $53 million in FY 2022 for the Fair Fares program. However, the outyears remain unfunded. The Comptroller’s Office estimates that the program could cost at least $100 million annually beginning in FY 2022 as participation rate picks up, posing risks of $47 million in FY 2022, and $100 million in each of FY 2023 through FY 2025. In addition, the Comptroller’s Office estimates shortfalls in paratransit funding beginning at $81 million in FY 2022 and growing to $150 million by FY 2025. While the State requires the City to increase its funding of the Metropolitan Transportation Authority’s (MTA) net paratransit deficit from 33 percent to 50 percent, funding for paratransit in the Financial Plan does not reflect the increase in funding requirement. Risks to overtime and adult shelter operations are discussed below in the “Expenditure Analysis” section beginning on page 24.
The City’s conservative estimates of interest rates on variable rate debt bonds (VRDB) provide some offset to the Comptroller’s Office’s expenditure risks. In an environment of low variable interest rates and no indication that rates will rise to the level assumed over the Plan period, the Comptroller’s Office estimates that debt service on VRDB could be less than the Plan projections by $80 million annually, beginning in FY 2023.
Overall, the Comptroller’s Office’s analysis of the Plan indicates that the City could end FY 2021 and FY 2022 with additional budget surpluses of $264 million and $646 million, respectively. However, in the outyears, net risks identified by the Comptroller’s Office would increase the gaps to $5.17 billion in FY 2023, $5.13 billion in FY 2024, and $5.53 billion in FY 2025.
In addition to the risks and offsets to risks above, assumptions used in computing pension contributions could be revised, depending on the decision by the five pension system Boards of Trustees on recommended changes to actuarial assumptions and methodology. Pension contributions in the Financial Plan are based on the assumption that changes to actuarial assumptions and methodology proposed by the Chief Actuary (discussed in greater detail in “Pensions” beginning on page 31) will be adopted. Should the proposed changes not be adopted, pension contributions would increase by $430 million in FY 2021, $304 million in FY 2022, and $65 million in FY 2023, and decrease by $358 million and $443 million in FY 2024 and FY 2025, respectively.
Revenue Analysis
Total revenues in the Executive Budget are expected to total $100.7 billion in FY 2021, boosted by significant Federal aid. Almost all the boost from Federal aid is from stimulus grants and Federal actions as discussed above and in greater detail in “Federal and State Aid,” beginning on page 19. Even as Federal aid diminishes over the Plan, the forecast growth of $7.0 billion in local revenues over the Plan keeps total revenues at over $100 billon in FY 2025. The increase in overall local tax revenues is driven almost entirely by an expected rebound in non-property tax revenues as the City’s economy recovers from the negative impact of the pandemic. Property tax revenues, on the other hand, are projected to fall significantly in FY 2022, by 5.1 percent, and grow only gradually through the remainder of the Plan. In FY 2025 property tax revenues are expected to be essentially unchanged compared to FY 2021, a significant reversal from the projected growth of previous forecasts.
Tax Revenues
Revisions since the January Financial Plan, FY 2021 – FY 2025
The April 2021 Financial Plan incorporates significant upward revisions totaling almost $1.4 billion in FY 2021. The increase is primarily driven by changes in the personal and business income tax revenues, which total over $1 billion, as shown in Table 9. The extraordinary fiscal boost provided by the Federal government, along with Wall Street’s exceptional year, contributed to far stronger growth than was originally forecast in the income taxes. This higher growth is expected to carry forward, at least partly in the out years, with overall tax revenues exceeding the City’s January forecast by $857 million by the end of the Plan period.
Table 9. Revisions to the City’s Tax Revenue Assumptions April 2021 vs. January 2021
| ($ in millions) | FY 2021 | FY 2022 | FY 2023 | FY 2024 | FY 2025 |
| January Financial Plan | $61,059 | $62,192 | $64,804 | $66,744 | $68,578 |
| Revisions: | |||||
| Property Tax | 264 | 0 | 0 | 0 | 0 |
| Personal Income (PIT) | 600 | 321 | 471 | 504 | 516 |
| Business | 482 | 143 | 226 | 329 | 333 |
| Sales | (67) | (225) | (75) | 0 | 50 |
| Real-Estate Transactions | 102 | 23 | 5 | (20) | (53) |
| All Other | (8) | (98) | 6 | 7 | 11 |
| Tax Audit | 0 | 0 | 0 | 0 | 0 |
| Total | 1,373 | 164 | 633 | 820 | 857 |
| Executive Budget 2022 – Total | $62,432 | $62,356 | $65,437 | $67,564 | $69,435 |
Comptroller’s Office’s Revisions and Projections, FY 2021 – FY 2025
The Comptroller’s Office’s revenue projections incorporate even greater revisions in FY 2021 to reflect recently available collections for personal income taxes that were due May 17th which showed much higher strength particularly in the components related to capital gains realizations. PIT in FY 2021 is expected to exceed the City’s revised forecast by just over $1 billion and overall revenues are expected to exceed the City’s forecast by almost $1.4 billion. Similarly in FY 2022, the Comptroller projects overall revenues will exceed the City’s projections by over $1 billion as some of the near term growth is expected to carry forward. The outyear projections for overall revenues in FY 2023 – FY 2025 are similar to the City’s as shown in tables 10 and 11 although there are relatively minor differences within the various revenue sources. These are shown in tables 10 and 11, and discussed in more detail below.
Table 10. Risks and Offsets to the City’s Tax Revenue Projections
| ($ in millions) | FY 2021 | FY 2022 | FY 2023 | FY 2024 | FY 2025 |
| Property | $0 | $236 | $242 | $245 | $254 |
| PIT | 1050 | 229 | (358) | (206) | (167) |
| Business | 210 | 157 | (64) | (176) | (166) |
| Sales | 91 | 291 | 164 | 142 | 81 |
| Real Estate Transaction | 20 | 162 | (113) | (281) | (417) |
| All Other | 8 | 98 | (6) | (7) | (11) |
| Audit | 0 | 79 | 279 | 279 | 279 |
| Total | $1,379 | $1,252 | $144 | ($4) | ($147) |
Table 11. Tax Revenue Forecast, Growth Rates
| FY 2021 | FY 2022 | FY 2023 | FY 2024 | FY 2025 | FYs 2021 – 25 Average Annual Growth |
|
| Property | ||||||
| Mayor | 4.3% | (5.1%) | 2.3% | 1.4% | 1.3% | -0.1% |
| Comptroller | 4.3% | (4.3%) | 2.3% | 1.4% | 1.4% | 0.1% |
| PIT | ||||||
| Mayor | (1.5%) | 3.6% | 6.5% | 3.7% | 3.7% | 4.4% |
| Comptroller | 6.2% | (2.3%) | 2.2% | 4.9% | 4.0% | 2.2% |
| Business | ||||||
| Mayor | (1.6%) | 0.6% | 5.2% | 2.5% | 1.7% | 2.5% |
| Comptroller | 1.6% | (0.2%) | 1.7% | 0.9% | 1.8% | 1.0% |
| Sales | ||||||
| Mayor | (12.0%) | 14.5% | 12.3% | 7.8% | 5.7% | 10.0% |
| Comptroller | (10.8%) | 17.3% | 10.2% | 7.4% | 4.9% | 9.9% |
| Real Estate Transactions | ||||||
| Mayor | (14.3%) | 13.3% | 10.0% | 5.6% | 5.4% | 8.5% |
| Comptroller | (13.3%) | 21.0% | (3.2%) | (2.0%) | (0.4%) | 3.4% |
| All Other | ||||||
| Mayor | (21.5%) | 2.7% | 11.6% | 8.0% | 5.3% | 6.9% |
| Comptroller | (21.2%) | 6.8% | 6.7% | 8.0% | 5.2% | 6.7% |
| Audit | ||||||
| Mayor | 14.2% | (21.3%) | (21.7%) | 0.0% | 0.0% | (11.4%) |
| Comptroller | 14.1% | (14.6%) | 0.0% | 0.0% | 0.0% | (3.9%) |
| Total Tax with Audit | ||||||
| Mayor | (1.0%) | (0.1%) | 4.9% | 3.3% | 2.8% | 2.7% |
| Comptroller | 1.1% | 0.3% | 3.1% | 3.0% | 2.6% | 2.1% |
Property Taxes
The City revised the FY 2021 forecast for property tax revenue to reflect lower than originally anticipated offsets to revenues from delinquencies and cancellations due to appeals. Similarly, the Comptroller’s forecast is also adjusted to reflect lower reserves and offsets to billed property taxes. Unlike the City’s forecast which has only been revised in FY 2021, the Comptroller projects lower reserve offsets throughout the Plan, resulting in higher revenues of about $250 million in each fiscal year.
Outside of the forecast for reserves, the property tax revenue forecast is similar to the City’s, showing only a gradual recovery in property markets and property tax revenue from the sharp decline in FY 2022.[14] The slow pace of recovery is due to both the gradual phase in of assessments, as well as the expectation that landlords’ ability to increase rents will continue to be constrained by high vacancies and structural changes in the demand for commercial properties. The extent to which changes in work patterns associated with work from home, the continuing shift to online retail sales, and changes in business travel in the Zoom world, will impact property demand and values across most property types remains highly uncertain at this time. The downside risks that these changes potentially pose are significant and will be reassessed as more data becomes available.
Real Estate Transaction Taxes
The latest available data for the first three quarters of FY 2021 have shown a slow but steady increase in sales of residential properties, whereas sales of commercial properties still show no signs of recovery. Sales of 1-3 family homes are down by 12 percent (from $14.7 billion to $12.9 billion) compared to the same period in FY 2020, while sales of condo and coops are down by 26 percent (from $26.2 billion to $19.3 billion) and sales of commercial buildings are down by 57 percent (from $19.8 billion to $8.5 billion).
As a result, collection of real property transaction taxes (RPTT) for the first three quarters is down by 31.3 percent ($676 million in FY 2021 compared to $985 million for the first three quarters of FY 2020) and collection of mortgage recording taxes (MRT) is down by 26.6 percent ($605 million in FY 2021 compared to $824 million in first three quarters of FY 2020).
The Comptroller’s Office projects that the steady but very slow increase in collections in the past two quarters will continue in the final quarter of FY 2021, bringing projected RPTT collections to $984 million and MRT collections to $844 million, $20 million lower than the City’s projections.
As more people go back to offices with increased vaccinations as well as employment growth, the Comptroller’s Office projects a rebound of 21 percent in the combined revenues from real estate transaction taxes in FY 2022, to $2.2 billion, $162 million higher compared to the City’s projections.
In the outyears, while the City projects continued growth in the transaction taxes, the Comptroller projects that increases in interest rates will offset steady employment gains, resulting in a slight decline in real estate related taxes. The forecast for transaction tax revenues is lower compared to the City’s, as shown in Table 10.
Personal and Business Income Taxes
The Personal and the Business income tax revenue projections have been revised significantly higher in FY 2021. As noted previously, the extraordinary fiscal boost and the exceptional year that Wall Street had in 2020 in spite of the pandemic, contributed to a much different trajectory for PIT and Business taxes than was originally anticipated. Instead of the steep declines initially projected, PIT is now projected to grow by over 6 percent and business taxes are expected to grow as well in FY 2021.
The Comptroller’s and the City’s forecast diverge in terms of growth in FY 2022. The Comptroller anticipates some pullback in growth to occur as Wall Street profits decline from near record levels in FY 2021. Given the higher starting point, the forecasts for both PIT and business tax revenues remains higher than the City’s in FY 2022 as shown in Table 10. The outyear forecast for FY 2023 – FY 2025 assumes that both PIT and Business taxes will continue to grow along with the City’s economy at a moderate pace.
Legislation and other factors Impacting PIT and Business taxes
While legislation enacted by the State is expected to have a marginal impact on personal and business income taxes, projections could be significantly impacted by Federal tax reform, as discussed in greater detail below.
NY State Legislation
The State recently enacted legislation to increase both personal and business income taxes. These are mainly rate changes that do not have a direct effect on the City income and business taxes.[15] These increases begin in the current year, so changes in the timing of revenues due to income shifting effects are not expected to occur. While the direct effects of these changes on City PIT are expected to be small, the indirect effects related to taxpayers relocating outside the State and the City due to these higher tax rates, need to be monitored closely. New York State also faces a potential challenge to its ability to tax commuters from a case pending before the U.S. Supreme Court.[16] Although the City does not have a commuter tax, the outcome of this case could indirectly affect City taxpayer behavior.
Proposed Federal Tax Reform
The Biden administration has also proposed a framework of significant tax increases for both personal and business income taxes to fund infrastructure improvements and programs to support lower income households. Unlike the State’s enacted increases, these proposals, if enacted, would likely occur only beginning in tax year 2022. If enacted, these proposals could potentially cause taxpayers to shift income from future higher taxed years into the current tax year. The magnitude of this shifting could be considerable, much like what occurred when the 2017 Tax Cuts and Jobs Act was enacted.
Sales Tax
While the forecast for PIT and Business Taxes was revised upwards in the Plan, sales taxes were revised downwards as the effects of the pandemic on the hospitality sector continue to drag down sales revenue. The City also cited permanent and temporary relocations outside the City as a reason for lower revenues. While the Comptroller also recognizes that these factors contributed to large revenue decline in FY 2021, the Comptroller’s projected pace of recovery of the hospitality sector is faster compared to the City’s. The Comptroller projects that hospitality employment will recover to 2019 pre-pandemic levels by CY 2024, while the City does not expect this sector to recover during the Plan.[17] As a result, the Comptroller anticipates higher sales tax revenue throughout the Plan period as shown in Table 10.
The State recently enacted legislation to legalize and tax recreational cannabis. The legislation enables the City to collect sales tax on retail sales of cannabis, which the Comptroller’s Office estimates could bring in revenues of as much as $45 million. (For more detail see “Federal and State Aid”, beginning on page 19.)
Audit Revenues
The City’s forecast assumes that audit collections will decline from $921 million in FY 2022 to only $721 million throughout the remainder of the Plan. The Comptroller’s forecast, while recognizing the volatility in individual audit collections, assumes that overall tax revenues should remain more closely in line with the $1 billion level realized in recent years. As a result, the City could collect about $280 million more in each year from FY 2023 – FY 2025.
Miscellaneous Revenues
Miscellaneous revenue projections in the FY 2022 Executive Budget remain relatively unchanged from the January Plan, with a net increase of $3 million to $4.98 billion, excluding intra-city revenues. The net increase stems mostly from a $73 million increase in water and sewer revenues, which were mostly offset by downward revisions of $36 million in revenues from fines and forfeitures, $28 million in licenses and franchise revenues, and $10 million in charges for services.
Miscellaneous revenue projection for FY 2021 increased by a net $56 million, to $5.15 billion. Table 12 shows the changes to the FY 2021 miscellaneous revenue forecast since January.
Table 12. Changes in FY 2021 Estimates January 2021 Plan vs. April 2021 Plan
| ($ in millions) | January | April | Change |
| Licenses, Permits & Franchises | $649 | $607 | ($42) |
| Interest Income | 14 | 14 | 0 |
| Charges for Services | 968 | 896 | (72) |
| Water and Sewer Charges | 1,720 | 1,721 | 1 |
| Rental Income | 245 | 258 | 13 |
| Fines and Forfeitures | 953 | 986 | 33 |
| Other Miscellaneous | 655 | 666 | 11 |
| Total | $5,204 | $5,148 | ($56) |
Projected revenues from licenses, permits and franchises declined by a net $42 million. This includes a $28 million decline in bus stop, mobile telecom and other franchise revenues, a $14 million decline in revenues from construction and building permits and recreational facility permits, and a $9 million decline in licenses from consumer and worker protection, restaurant and vendor, and park concessions. These are somewhat offset by an $11 million increase in projected revenues from taxi licenses and utility permits.
The net decline in charges for services ($72 million) reflects mainly a $56.5 million drop in tuition revenues due to lower enrollment at community colleges, a $12.5 million decline in revenues from marshal booting due to the city’s suspension of vehicle booting during the COVID-19 pandemic and a combined $10 million drop in parking meter and towing operation revenues. Estimated rental income increased $13 million, reflecting additional revenues from airport and commercial rents. Projection for “other miscellaneous” which includes non-recurring revenues such as restitutions, asset sales and refunds of prior year expenditures increased by a net $11 million. This includes an additional $5.3 million in revenues from affirmative litigation and $7 million in additional tobacco settlement revenues.
FY 2021 miscellaneous revenues are $91 million less than FY 2020, driven by a combined $364 million, or 12 percent, drop in recurring revenues from licenses, permits and franchises, fines and forfeitures, interest and rental income, and charges for services as the slowdown in business and social activities caused by the pandemic continued to impact city business activity.[18] Overall, miscellaneous revenues are projected to remain relatively flat at around $5 billion annually through FY 2025.
Federal and State Aid
The April Plan projects total Federal and State aid of $31.3 billion in FY 2021 and $29.5 billion in FY 2022, reflecting a net combined increase from the January Plan of nearly $10.4 billion in the first two years of the Plan. Federal and State assistance would support over 30 percent of the City’s expenditure budget in these years. With the exception of a few minor adjustments, the entire increase in Federal funding stems from the continued recognition of COVID-related reimbursements totaling almost $11 billion in FY 2021 and FY 2022. Over the Plan period, the City has reflected additional Federal COVID grants of $15.7 billion through FY 2025. The Federal aid increase is partly offset by a decline of $1.1 billion in State grants over the same span, mainly from school aid re-estimates that brings the City’s Foundation Aid projections in line with those established in the State budget. Beyond the FY 2022 Executive Budget, the Plan estimates Federal and State grants to fall to $25.5 billion in FY 2023, $25.2 billion in FY 2024 before settling to $24.8 billion in FY 2025.
Federal Stimulus Aid
The April Plan reflects additional Federal COVID grants of $4.4 billion in FY 2021, $6.5 billion in FY 2022, $2.2 billion in FY 2023, $1.7 billion in FY 2024 and nearly $1 billion in FY 2025, as detailed in Table 13. The largest component of the new Federal resources is for local government relief provided under the ARPA. Under the bill, the City would receive a total of $5.9 billion, 84 percent or $5 billion of which would support a broad range of spending in FY 2021 and FY 2022.
Table 13. Sources and Uses of Additional Federal COVID Assistance April 2021 Plan
| ($ in millions) | FY 2021 | FY 2022 | FY 2023 | FY 2024 | FY 2025 | FYs 2021-2025 Total |
| Sources | ||||||
| FEMA Emergency Measures | $1,377 | $0 | $0 | $0 | $0 | $1,377 |
| CARES Act-Coronavirus Relief Fund | 456 | 9 | 9 | 9 | 9 | 493 |
| CARES Act-Other | 61 | 6 | 0 | 0 | 0 | 67 |
| Epidemiology & Lab Grants | 368 | 253 | 102 | 5 | 0 | 728 |
| ARPA-Local Government Relief | 1,949 | 3,034 | 268 | 212 | 438 | 5,902 |
| CRRSA-Education | 146 | 1,381 | 452 | 172 | 0 | 2,151 |
| ARPA-Education | 0 | 1,756 | 1,320 | 1,212 | 530 | 4,817 |
| All Other | (2) | 57 | 57 | 57 | 0 | 168 |
| Total Assistance | $4,356 | $6,495 | $2,208 | $1,667 | $977 | $15,703 |
| Uses | ||||||
| COVID Recovery and Response | $3,534 | $3,600 | $1,095 | $345 | $16 | $8,590 |
| Labor Savings Substitution | 270 | 1,000 | 0 | 0 | 0 | 1,270 |
| New Expansion/Enhancement | 92 | 655 | 948 | 1,186 | 725 | 3,606 |
| Restoration | 131 | 389 | 165 | 136 | 45 | 866 |
| Funding Swap* | 329 | 851 | 0 | 0 | 191 | 1,371 |
| Total Spending | $4,356 | $6,495 | $2,208 | $1,667 | $977 | $15,703 |
Source: New York City Office of Management and Budget, April 2021 Plan.
*Includes $81 million in State funding swap.
Note: Totals may not add due to rounding.
The City also recognizes nearly $7 billion in Federal support for education spending from the ARPA and CRRSA of December 2020, at $4.8 billion and $2.2 billion, respectively. The City currently allocates about 47 percent of the total ARPA and CRRSA grants for spending in FY 2021 and FY 2022 combined, 25 percent in FY 2023, 20 percent in FY 2024 and 8 percent in FY 2025.[19]
In addition, the City incorporates $1.4 billion in FEMA reimbursement and $560 million in CARES Act funding in the April Plan revenue assumptions. A significant portion of the FEMA revenue stems from the Federal government’s commitment to fully reimburse the City for its FEMA-eligible costs, raising the reimbursement rate from the previous expectation of 75 percent. The recognition of CARES Act funding is largely due to the rollover of Coronavirus Relief Fund revenue into the current year, providing $456 million in FY 2021. The April Plan also raises its assumption of Epidemiology and Laboratory Capacity (ELC) grants by a total of $728 million across FY 2021 – FY 2024, based on increased Federal commitment under the CRRSA and ARPA.
The uses of the new Federal stimulus funds can be categorized into five main areas. The largest is COVID response and recovery spending of $8.6 billion, the bulk of which is planned in FY 2021 and FY 2022. Major components in this group include $3.6 billion in DOE initiatives comprising $1.4 billion for operational support, $850 million for academic recovery and student support services, $840 million for programmatic and instructional support, $280 million for certain special education services and $233 million for IT support. The category also includes $728 million for ELC-funded projects, $569 million in FEMA-reimbursable costs for the DOHMH and H+H (net of vaccination), $404 million in COVID medical leave and care, $492 million in homeless services, $522 million for vaccination and immunization, $329 million for a rental assistance program, $304 million for testing and tracing, $248 million for a citywide cleanup corps, $203 million for small business assistance and support, $162 million for food assistance and $125 million for youth services.
The second largest category is spending for new expansions and programmatic enhancements, totaling about $3.6 billion over FY 2021 – FY 2025. Nearly $2.7 billion or 77 percent of this total represents DOE spending, most notably $1.9 billion for 3-K expansion, $300 million for mental health services and $252 million for expansion of Pre-K special education services. The remainder is spread across various functions, heavily concentrated in social services and health spending, including $163 million for senior care initiatives, $280 million for nonprofit indirect cost rates excluding the DOE, $160 million for mobile mental health treatment, $62 million for housing court counsel, $48 million for homeless street outreach, $42 million for Department of Transportation (DOT) street planning and $20 million for mobile food vendor health grading and permits. These new or enhanced programs will require City funding to continue once stimulus funds are exhausted after FY 2025.
In addition, the April Plan reflects $1.3 billion in labor savings substitution that the City has now replaced with Federal stimulus funds. Prior to the April Plan, the City had assumed unspecified labor savings of $270 million in FY 2021 and $1 billion in FY 2022. In a similar vein, the Plan also reflects funding swaps that will utilize about $1.4 billion in Federal stimulus funds to provide for spending previously supported almost entirely by City-funds (except for $81 million in State funding for DOHMH Article 6 health costs). The most prominent among these are $500 million to cover revenue loss that would provide expense offset for the Department of Sanitation, $280 million for Corrections uniformed personnel, $291 million in school-related costs, $92 million for emergency food assistance and $63 million for youth services mainly involving the Learning Bridges program.
The final area of stimulus spending is restoration of budget cuts previously assumed in the CSP, totaling $866 million. About 79 percent, or $682 million of this total has been allocated to DOE to offset prior cuts and hold schools harmless for midyear reductions in FY 2021. The remainder of the funding will mainly be used to partially restore $149 million in hiring reductions and attrition savings and offset $28 million in prior cuts of Sunday and weekday basket services.
State Aid
In early April, the New York State Legislature approved a $212 billion budget for State fiscal year (SFY) 2022. The enacted State budget rejected most proposed spending cuts while increasing funding for education, health care, and pandemic relief by using a combination of Federal stimulus and tax increases on high earners and corporations. The State will receive a total of $12.6 billion from the state and local relief fund in the ARPA; the enacted State budget appropriated the first $5.5 billion of those funds.
School Aid
Most significantly for the New York City budget, the State agreed to fully fund Foundation Aid over the next three years. The agreement will boost State school aid to the City by $530 million in FY 2022, $800 million in FY 2023, and $1,070 million in FY 2024.
In the wake of the Campaign for Fiscal Equity (CFE) lawsuit and a court-ordered mandate to provide a “sound, basic education” to New York City students, New York State implemented Foundation Aid to provide sufficient State aid for each school district. Foundation Aid was intended to be fully phased in over time beginning in FY 2008, but progress was quickly interrupted by the Great Recession. Despite annual increases since FY 2014, Foundation Aid has never been fully funded.
Under this year’s enacted State budget, Foundation Aid for New York City will increase to $8.6 billion in FY 2022 and will rise to $8.9 billion in FY 2023 and $9.1 billion in FY 2024, based on current State formulas (Chart 2). These State estimates are reflected in the City’s Executive Budget. While the increase in Foundation Aid was generally seen as a victory by education advocates, the City’s previous projections had assumed an even greater increase, and the Executive Budget reduced its projections of State Foundation aid by $353 million in FY 2022, $515 million in FY 2023, and $245 million in FY 2024.
For FY 2022, FY 2023, and FY 2024, districts must post a plan by July 1 explaining how funds will be used to address student performance and need. Districts must seek comments from parents, teachers and other stakeholders before posting the plan.
Chart 2. Actual and Projected State Foundation Aid to New York City
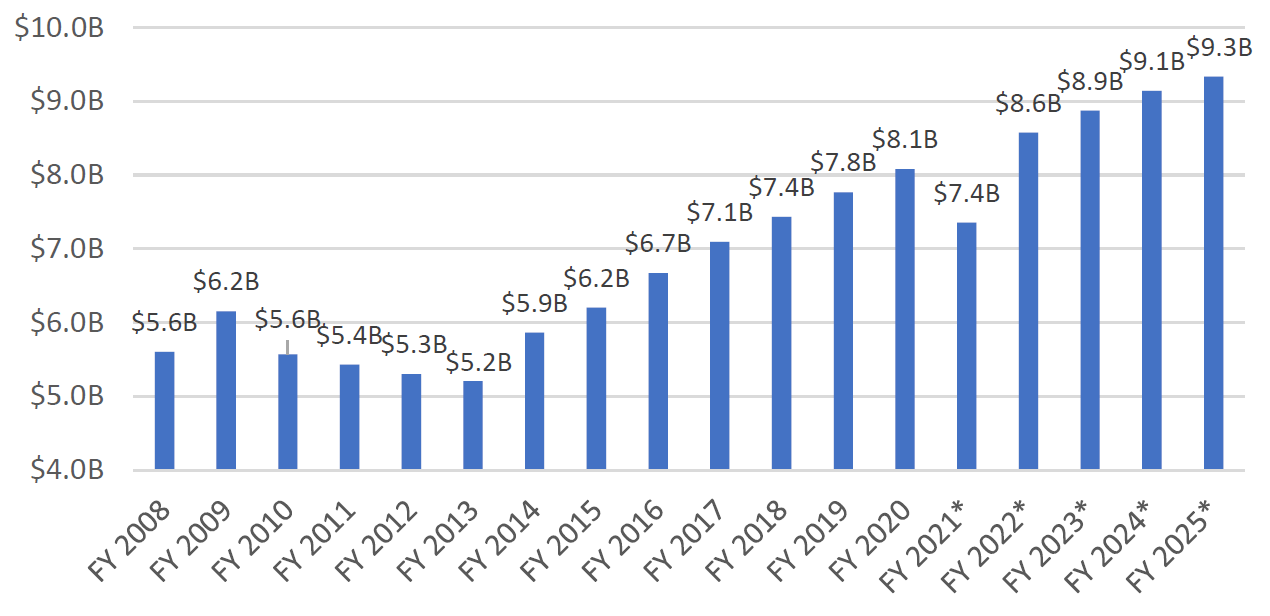
Source: Office of the New York City Comptroller, Comprehensive Annual Financial Reports; and New York City Office of Management and Budget.
Note: *Projected. In FY 2021, New York State used $1.1 billion in Federal CARES Act funding, including $721 million for New York City, to supplant State funds.
The State budget also allocates school districts’ full share of Federal stimulus funds for education from the December 2020 CRRSA and the March 2021 ARPA. New York City will receive 58 percent of the State’s education stimulus allocation: $2.15 billion from the CRRSA and $4.8 billion from the ARPA. If the State budget director determines by March 15, 2022 that the Federal government has extended the deadline by which school districts must obligate funds at least through the end of FY 2025, then the State budget requires school districts to spend at least one-half of the ARPA funds in equal increments of 12.5 percent of the total annually in fiscal years 2022 through 2025, which, for New York City, equals $602 million annually. Alternatively, if the deadline for spending funds is not extended through FY 2025, then the City would have to spend at least $602 million in FY 2022 and $903 million in each of FY 2023 and FY 2024. The City’s Executive Budget allocated $1.75 billion in FY 2022, $1.32 billion in FY 2023, $1.21 billion in FY 2024, and $530 million in FY 2025. While the City’s Executive Budget complies with the State’s minimum requirement through FY 2024, the allocation for FY 2025 may need to change, pending federal guidance The City’s proposed uses of Foundation Aid and education stimulus funding, as outlined in the Executive Budget Financial Plan, are discussed in “Department of Education”, beginning on page 32.
New COVID-19 Relief Programs
New York City residents and businesses affected by the pandemic will benefit from several new COVID-19 relief programs contained in the State budget, largely funded by the State’s share of Federal stimulus funding. The new relief programs include $1 billion for small businesses and nonprofits that have been impacted by the pandemic; $2.4 billion to pay rental arrears for qualifying households; $2.4 billion for the child care sector, including $1.3 billion in stabilization grants for providers as well as extended eligibility for households; $2.1 billion for undocumented residents who have been unable to access unemployment benefits; and $600 million for homeowner relief.
In addition, the State approved $25 million for Restaurant Resiliency Grants, $40 million for Arts and Cultural Organization Recovery Grants, $35 million for Return-to-Work Credits, and $100 million for a New York City Musical and Theatrical Production tax credit.
Housing
The State Budget appropriated $200 million in capital funds for NYCHA that will be used to address areas mentioned in the Federal agreement signed in 2019, as well as $100 million for an Adaptive Reuse Affordable Housing Program in New York City, which would finance the conversion of commercial and hotel properties to permanent affordable housing.
Homeowners with annual income below $250,000 and property tax liability exceeding 6 percent of income will also benefit from a new State property tax relief credit over the next three years. The credit will range from $250 to $300 per household.
Early Retirement Option
The State Budget gives New York City the option to participate in an early retirement incentive (ERI) program. The incentive would apply to members of the Employees’ Retirement System (NYCERS), the Teachers’ Retirement System (NYCTRS), and the Board of Education Retirement System (BERS). If the City and/or Department of Education elects to participate, they would have the option to target specific titles and must demonstrate savings, either by eliminating vacated positions or demonstrating that new hires would earn less than half of the salaries of retiring employees over the next two years. The City’s Actuary estimates that 75,610 employees would potentially meet eligibility requirements.[20] Eventual savings from the ERI will be reflected in the budget when and if the City opts to participate and decides on eligible titles.
Sales Tax Asset Receivable Corporation (STAR)
The Sales Tax Asset Receivable Corporation (STAR) was created in 2004 to issue bonds to retire remaining outstanding bonds of the Municipal Assistance Corporation. The State pays $170 million annually to the Local Government Assistance Corporation (LGAC) that is used to pay debt service on the STAR bonds. The State Budget allows LGAC to end its annual payments of $170 million, provided that the State provides funds sufficient to legally defease the STAR bonds and remit $46 million to the City on or before June 30, 2021.
Revenues
Newly adopted changes to personal and corporate income taxes will raise State revenues by an estimated $3.5 billion in SFY 2022 and $3.9 billion in SFY 2023. State tax rates on single filers earning more than $1 million and joint filers earning more than $2 million but less than $5 million will increase from 8.82 percent to 9.65 percent beginning in 2021. The tax rate on income between $5 million and $25 million will increase to 10.3 percent, and the rate on income over $25 million will rise to 10.9 percent. Tax rates for corporations with income above $5 million will also rise from 6.5 percent to 7.25 percent.
The State has also decoupled State and City corporate and personal income tax law from the Federal Opportunity Zones program. The State projects a savings of $44 million in SFY 2022 and $62 million in SFY 2023 from this action.
Outside of the budget process, the State Legislature approved the legalization of cannabis products for adults over 21 years old. Products will be subject to a wholesale tax based on THC content and a 9 percent State excise tax on retail sales. Retail cannabis sales will also be subject to a 4 percent New York City tax. The State expects to raise $20 million in SFY 2022, $115 million in SFY 2023, $158 million in SFY 2024, and $245 million in SFY 2025.[21] Net of administrative costs, 40 percent of State revenues will be dedicated to a Community Grants Reinvestment Fund, 40 percent to education through the State Lottery Fund, and 20 percent to a Drug Treatment and Public Education Fund. The local excise tax revenue can be used for general purposes.
The Comptroller’s Office has estimated that the market for adult-use marijuana in New York City would be about $1.1 billion. Consequently, the City could generate approximately $45 million per year in new tax revenue. Actual marijuana-related tax revenue will depend on numerous factors, including the establishment of retail locations, average retail prices, transition of illegal sales to the legal market, and demand from residents, commuters and tourists. The City has not yet reflected new revenue from cannabis in its financial plan.
Expenditures Analysis
Total-funds expenditures in the April Financial Plan, after adjusting for prepayments and excluding re-estimates of prior-year accruals and reserves, are projected to grow from $101.22 billion in FY 2021 to $103.64 billion in FY 2025, a growth of 2.4 percent, as shown in Table 14. The growth is driven by spending on debt service, health insurance, pension contributions, and other fringe benefits. The combined spending in these areas is projected to grow by 24.9 percent over the Plan period, averaging 5.7 percent annually. All other expenditures, net of reserves and prior-year re-estimates, are projected to decline by 5.8 percent over the same period, with a projected annual average decline of 1.5 percent. However, growth over this period is tempered by the drop in COVID related spending. COVID- related spending is projected to drop from $6.94 billion in FY 2021 to $2.62 billion in FY 2022 before tapering off to $907 million by FY 2025. Net of COVID-related spending, adjusted expenditures before reserves and prior-year adjustment is projected to grow by 10 percent between FY 2021 and FY 2025.
Table 14. FY 2021 – FY 2025 Expenditure Growth Adjusted for Prepayments and Prior-Year Actions
| ($ in millions) | FY 2021 | FY 2022 | FY 2023 | FY 2024 | FY 2025 | Growth FYs 21-25 | Annual Growth |
| Debt Service | $6,351 | $7,088 | $8,391 | $8,788 | $9,352 | 47.2% | 10.2% |
| Health Insurance | 7,136 | 7,673 | 7,190 | 8,158 | 8,991 | 26.0% | 5.9% |
| Other Fringe Benefits | 4,046 | 4,595 | 4,542 | 4,668 | 4,792 | 18.4% | 4.3% |
| Pensions | 9,390 | 10,151 | 10,356 | 10,548 | 10,484 | 11.7% | 2.8% |
| Subtotal | $26,924 | $29,507 | $30,479 | $32,162 | $33,619 | 24.9% | 5.7% |
| Salaries and Wages | $28,904 | $30,662 | $30,317 | $30,453 | $30,741 | 6.4% | 1.6% |
| Medicaid | 6,140 | 6,418 | 6,494 | 6,494 | 6,494 | 5.8% | 1.4% |
| Public Assistance | 1,604 | 1,651 | 1,650 | 1,650 | 1,650 | 2.9% | 0.7% |
| J & C | 582 | 887 | 758 | 775 | 791 | 35.9% | 8.0% |
| Contractual Services | 20,886 | 18,929 | 17,935 | 17,934 | 17,862 | (14.5%) | (3.8%) |
| Other OTPS | 16,183 | 13,833 | 12,652 | 12,489 | 12,478 | (22.9%) | (6.3%) |
| Subtotal | $74,299 | $72,381 | $69,807 | $69,795 | $70,017 | (5.8%) | (1.5%) |
| Expenditures Before Reserves and Prior-Year Re-estimates | $101,223 | $101,888 | $100,286 | $101,957 | $103,637 | 2.4% | 0.6% |
| Prior-Year Accruals Re-estimate | ($421) | $0 | $0 | $0 | $0 | ||
| General Reserve | $50 | $300 | $1,000 | $1,000 | $1,000 | ||
| Capital Stabilization Reserve | $0 | $0 | $250 | $250 | $250 | ||
| Total | $100,852 | $102,188 | $101,536 | $103,207 | $104,887 | 4.0% | 1.0% |
Note: Numbers may not add due to rounding.
COVID-19 Expenditures
The April 2020 Financial Plan increased FY 2021 COVID-19 related expenditures by $3.36 billion to $6.94 billion. About half of the increase is due to additional funding for testing and tracing, health insurance, and shelter intake. The health insurance cost is entirely funded with stimulus grants and allows the City to replace unspecified labor savings in FY 2021 and FY 2022 with stimulus funds. As discussed in “Health Insurance” on page 30, prior Financial Plans had reduced health insurance expenditures as a placeholder for the as yet unspecified savings. The use of stimulus funds to increase health insurance spending in FY 2021 and FY 2022 negates the need to replace the reduction in health insurance expenditures with labor savings in these years.
Table 15 shows the allocation of COVID-19 spending by purpose. As shown in the table, COVID related spending is projected to drop to $2.62 billion in FY 2022 as the City recovers from the pandemic. COVID related spending is then projected to fall to $184 million in FY 2023 and taper off to $9 million by FY 2025.
Table 15. FY 2021 and FY 2022 COVID-19 Budget Allocation by Purpose
| ($ in millions) | FY 2021 | FY 2022 |
| Testing and Tracing | $1,804 | $160 |
| Health Insurance | 694 | 1,020 |
| Shelter Intake (DHS) | 690 | 3 |
| Medical, Surgical and Lab Supplies | 656 | 0 |
| Food and Forage | 609 | 0 |
| Vaccination Related Cost | 459 | 1 |
| Communicable Disease Prevention and Treatment (DOHMH) | 304 | 167 |
| Emergency Response | 278 | 0 |
| Non-Medical COVID Related Leave | 100 | 100 |
| Overtime | 95 | 19 |
| Remote Learning | 82 | 0 |
| School Re-Opening | 41 | 0 |
| School Custodial Supplies | 85 | 0 |
| Taxi Medallion Relief Fund | 65 | 0 |
| Grant/Loan Program | 48 | 104 |
| 311 Surge Staffing | 13 | 0 |
| Other | 917 | 1,050 |
| Total | $6,939 | $2,624 |
Headcount
The April 2021 Headcount Plan, as shown in Table 16, shows net increases in year-end headcount of 601 in FY 2021, 4,074 in FY 2022, 4,127 in FY 2023, 5,597 in FY 2024, and 5,568 in FY 2025 as compared to the January 2021 Plan. The largest increase is in the DOE, where planned hiring to support the expansion of 3-K increases planned headcount by 75 in FY 2021, 721 in FY 2022, 1,398 in FY 2023, 2,825 in FY 2024, and 2,853 in FY 2025. Other staffing addition in the Department includes increasing headcount by 490 in FY 2022 and 520 in each of FY 2023 through FY 2025 for mental health support, and by 162 in FY 2022, 330 in FY 2023 and 402 in each of FY 2024 and FY 2025 to expand pre-K special education.
Notable increases in other agencies include:
- 485 civilian positions in each of FY 2022 through FY 2025 from the partial restoration of hiring and attrition management to increase replacement hiring from 1 replacement hiring for every 3 separations to 1 replacement for every 2 separations;
- 11 civilian positions in FY 2021 and 208 in each of FY 2022 through FY2025 in the Police Department to support police reform initiatives;
- 400 correction officers in FY 2022 from a recruit class to support increased staffing needs brought about by the pandemic;
- 59 sanitation workers in each of FY 2022 through FY 2025 from the restoration of weekday basket service;
- 37 sanitation workers for the Precision Cleaning Initiative, a new program in the Department of Sanitation to address local quality-of-life concerns including litter conditions, overflow basket and illegal dumping.
Table 16. Full-time Headcount Changes-April 2021 Financial Plan vs. January 2021 Financial Plan
| FY 2021 | FY 2022 | FY 2023 | FY 2024 | FY 2025 | |
| Pedagogical | |||||
| Dept. of Education | 3 | 1,115 | 1,747 | 2,766 | 2,784 |
| City University | 0 | 0 | 0 | 0 | 0 |
| Subtotal | 3 | 1,115 | 1,747 | 2,766 | 2,784 |
| Uniformed | |||||
| Police | 0 | 0 | 0 | 0 | 0 |
| Fire | 0 | 0 | 0 | 0 | 0 |
| Correction | 0 | 400 | 0 | 0 | 0 |
| Sanitation | 0 | 102 | 112 | 112 | 112 |
| Subtotal | 0 | 502 | 112 | 112 | 112 |
| Civilian | |||||
| Dept. of Education | 75 | 299 | 547 | 1,027 | 1,037 |
| City University | 0 | 0 | 0 | 0 | 0 |
| Police | 88 | 216 | 216 | 216 | 216 |
| Fire | 56 | 98 | 90 | 90 | 90 |
| Correction | 3 | 11 | 8 | 8 | 8 |
| Sanitation | 2 | 49 | 30 | 30 | 30 |
| Admin. for Children’s Services | 16 | 40 | 40 | 40 | 40 |
| Social Services | 0 | 26 | 26 | 26 | 26 |
| Homeless Services | 54 | 54 | 19 | 19 | 19 |
| Health and Mental Hygiene | 8 | 354 | 141 | 141 | 86 |
| Finance | 0 | 7 | 7 | 7 | 7 |
| Transportation | 83 | 166 | 191 | 204 | 206 |
| Parks and Recreation | 10 | 36 | 36 | 36 | 36 |
| All Other Civilians | 203 | 1,101 | 917 | 875 | 871 |
| Subtotal | 598 | 2,457 | 2,268 | 2,719 | 2,672 |
| Total | 601 | 4,074 | 4,127 | 5,597 | 5,568 |
Full-time headcount, as shown in Table 17, is projected to increase from 300,073 in FY 2021 to 305,939 in FY 2024 before declining modestly to 305,910 in FY 2025. The increase over the Plan period is driven by a net addition of 5,636 pedagogical headcount in the DOE. In contrast, uniformed headcount in the Department of Correction, after increasing by 241 in FY 2022 is expected to drop by 400 to 7,060 in FY 2023 and remain at this level for the remainder of the Plan period.
Table 17. Total Funded Full-Time Year-End Headcount Projections – April 2021 Financial Plan
| FY 2021 | FY 2022 | FY 2023 | FY 2024 | FY 2025 | |
| Pedagogical | |||||
| Dept. of Education | 123,971 | 127,938 | 128,570 | 129,589 | 129,607 |
| City University | 4,441 | 4,441 | 4,441 | 4,441 | 4,441 |
| Subtotal | 128,412 | 132,379 | 133,011 | 134,030 | 134,048 |
| Uniformed | |||||
| Police | 35,007 | 35,030 | 35,030 | 35,030 | 35,030 |
| Fire | 10,945 | 10,945 | 10,952 | 10,952 | 10,952 |
| Correction | 7,219 | 7,460 | 7,060 | 7,060 | 7,060 |
| Sanitation | 7,425 | 7,483 | 7,691 | 7,691 | 7,691 |
| Subtotal | 60,596 | 60,918 | 60,733 | 60,733 | 60,733 |
| Civilian | |||||
| Dept. of Education | 12,865 | 13,403 | 13,651 | 14,131 | 14,141 |
| City University | 1,947 | 1,771 | 1,946 | 1,946 | 1,946 |
| Police | 15,192 | 15,646 | 15,646 | 15,646 | 15,646 |
| Fire | 6,397 | 6,441 | 6,689 | 6,689 | 6,689 |
| Correction | 1,670 | 1,838 | 1,835 | 1,835 | 1,835 |
| Sanitation | 2,073 | 2,171 | 2,152 | 2,152 | 2,152 |
| Admin. for Children’s Services | 6,957 | 7,289 | 7,289 | 7,289 | 7,289 |
| Social Services | 12,781 | 13,618 | 13,618 | 13,618 | 13,618 |
| Homeless Services | 2,101 | 2,158 | 2,123 | 2,123 | 2,123 |
| Health and Mental Hygiene | 5,579 | 6,132 | 5,912 | 5,907 | 5,852 |
| Finance | 2,043 | 2,109 | 2,109 | 2,109 | 2,109 |
| Transportation | 5,387 | 5,574 | 5,601 | 5,616 | 5,618 |
| Parks and Recreation | 4,209 | 4,296 | 4,296 | 4,296 | 4,296 |
| All Other Civilians | 31,864 | 28,112 | 27,861 | 27,819 | 27,815 |
| Subtotal | 111,065 | 110,558 | 110,728 | 111,176 | 111,129 |
| Total | 300,073 | 303,855 | 304,472 | 305,939 | 305,910 |
Through February 28, 2021 full-time headcount had declined by almost 7,500 from FY 2020 year-end level, as shown in Table 18. The projected FY 2021 year-end headcount in the April 2021 Headcount Plan is only 373 below the FY 2020 year-end level. To meet the planned fiscal year-end level of 300,073, the City will need to increase headcount by 7,109 over the February 28th level, a 2.4 percent increase. It is unlikely that the City will be able to increase headcount by 2.4 percent over a four-month period, and as such will likely end the fiscal year below planned year-end headcount, resulting in additional personal services savings at the end of the fiscal year.
Table 18. February 28, 2021 Headcount vs. Planned June 30, 2021 Headcount
| 6/30/2020 Actuals | 2/28/2021 Actuals | 6/30/2021 Plan | Change 6/30/2020 to 2/28/2021 | Planned Change 6/30/2020 to 6/30/2021 | |
| Pedagogical | |||||
| Dept. of Education | 121,077 | 118,965 | 123,971 | (2,112) | 2,894 |
| City University | 4,545 | 4,435 | 4,441 | (110) | (104) |
| Subtotal | 125,622 | 123,400 | 128,412 | (2,222) | 2,790 |
| Uniformed | |||||
| Police | 35,910 | 34,952 | 35,007 | (958) | (903) |
| Fire | 11,047 | 10,761 | 10,945 | (286) | (102) |
| Correction | 9,237 | 8,731 | 7,219 | (506) | (2,018) |
| Sanitation | 7,755 | 7,357 | 7,425 | (398) | (330) |
| Subtotal | 63,949 | 61,801 | 60,596 | (2,148) | (3,353) |
| Civilian | |||||
| Dept. of Education | 13,607 | 13,296 | 12,865 | (311) | (742) |
| City University | 1,743 | 1,698 | 1,947 | (45) | 204 |
| Police | 15,519 | 14,658 | 15,192 | (861) | (327) |
| Fire | 6,366 | 6,299 | 6,397 | (67) | 31 |
| Correction | 1,741 | 1,655 | 1,670 | (86) | (71) |
| Sanitation | 2,107 | 2,037 | 2,073 | (70) | (34) |
| Admin. for Children’s Svcs | 7,039 | 6,869 | 6,957 | (170) | (82) |
| Social Services | 12,330 | 11,989 | 12,781 | (341) | 451 |
| Homeless Services | 2,119 | 2,050 | 2,101 | (69) | (18) |
| Health and Mental Hygiene | 5,530 | 5,411 | 5,579 | (119) | 49 |
| Finance | 1,996 | 1,940 | 2,043 | (56) | 47 |
| Transportation | 5,120 | 5,024 | 5,387 | (96) | 267 |
| Parks and Recreation | 4,236 | 4,104 | 4,209 | (132) | (27) |
| All Other Civilians | 31,422 | 30,733 | 31,864 | (689) | 442 |
| Subtotal | 110,875 | 107,763 | 111,065 | (3,112) | 190 |
| Total | 300,446 | 292,964 | 300,073 | (7,482) | (373) |
Overtime
The FY 2022 Executive Budget projects overtime expenditures of $1.16 billion for FY 2022, about 5.5 percent below the revised FY 2021 overtime budget of $1.23 billion. The scale-back of everyday operations and non-essential City employees largely working from home due to the pandemic have reduced overtime usage for most agencies in FY 2021. As non-essential City workers gradually return to work and everyday operations ramp up, it is expected that overtime costs will be higher in FY 2022. The Comptroller’s Office projects spending for FY 2022 at approximately $1.29 billion, exceeding the Plan’s FY 2022 projections by $131 million, as shown in Table 19.
More than 70 percent of the risk to the FY 2022 overtime budget stems from projected overtime spending for uniformed police personnel. Police uniformed spending in the April Plan is projected at $240 million in FY 2021 and $354 million annually in FY 2022 through FY 2025, including a planned reduction of $54 million annually as part of the Citywide Savings Plan. The suspension of planned events such as parades and street fairs has lowered police uniformed overtime costs relative to past fiscal years. While the Comptroller’s Office expects overtime spending to be lower than recent fiscal years, the Office does not expect the drop to be as sharp as the Plan projections. The Comptroller’s Office projects spending of $400 million for FY 2021 and $450 million for FY 2022, posing risks of $160 million in FY 2021 and $96 million in FY 2022, relative to the City’s projections.
Compared to the January Financial Plan, overtime projections increased by $209 million for FY 2021 and remained relatively flat for FY 2022 with a decrease of $22 million. Just over 50 percent of the increase for FY 2021, $109 million, was for uniformed overtime spending at the Department of Sanitation driven by snow removal overtime. There was a $12 million increase to the police uniformed overtime budget and a $17 million increase to the uniformed overtime budget of the Fire Department. The civilian overtime budget increased by $71 million for FY 2021 to address year-to-date spending needs.
There was a net reduction of $48 million in FY 2022 for the uniformed overtime budget from the January Plan, resulting mainly from a reduction to the police uniformed overtime budget of $51 million as the City continues its policy to lower overtime cost in the department. An increase of $26 million in the civilian overtime budget partially offset the reduction to uniformed overtime.
Table 19. Projected Overtime Spending, FY 2022
| ($ in millions) | City Planned Overtime FY 2022 |
Comptroller’s Projected Overtime FY 2022 |
FY 2022 Risk |
| Uniformed | |||
| Police | $354 | $450 | ($96) |
| Fire | 208 | 208 | 0 |
| Correction | 81 | 100 | (19) |
| Sanitation | 113 | 113 | 0 |
| Total Uniformed | $756 | $871 | ($115) |
| Civilians | |||
| Police-Civilian | $80 | $80 | $0 |
| Admin for Child Svcs | 48 | 48 | 0 |
| Environmental Protection | 44 | 44 | 0 |
| Transportation | 51 | 51 | 0 |
| All Other Agencies | 184 | 200 | (16) |
| Total Civilians | $407 | $423 | ($16) |
| Total City | $1,163 | $1,294 | ($131) |
Health Insurance
The FY 2022 employee health insurance cost totals $7.67 billion, an increase of $537 million, or 7.5 percent, from FY 2021. As shown in Table 20, health insurance costs are then projected to decline slightly to $7.19 billion in FY 2023 and increase to $8.16 billion in FY 2024 and $8.99 billion by FY 2025. The increase from FY 2021 reflects projected premium rate increases of 6.38 percent for active employees and pre-Medicare retirees and 4.9 percent for the senior care rate. The outyear projections assume annual increases in health insurance premium rates of 6.25 percent in FY 2023, 6.0 percent in FY 2024 and 5.75 percent in FY 2025. Premium rate increases for retiree health insurance are projected to be 4.8 percent for FY 2023 and FY 2024 and 4.7 percent in FY 2025.
Table 20. Pay-As-You-Go Health Expenditures
| ($ in millions) | FY 2021 | FY 2022 | FY 2023 | FY 2024 | FY 2025 |
| Department of Education | $2,699 | $2,744 | $2,896 | $3,478 | $3,995 |
| CUNY | 115 | 135 | 143 | 147 | 159 |
| All Other | 4,321 | 4,794 | 5,151 | 5,533 | 5,836 |
| Labor Savings | 0 | 0 | (1,000) | (1,000) | (1,000) |
| Budgeted Pay-As-You-Go Health Insurance Costs | $7,136 | $7,673 | $7,190 | $8,158 | $8,991 |
Numbers may not add due to rounding.
The drop in health insurance spending in FY 2023 reflects the assumption of labor savings of $1 billion annually, beginning with FY 2023. The June 2020 Financial Plan included potential savings of $1 billion annually, beginning in FY 2021, to be negotiated with the Municipal Labor Committee (MLC). The City had reduced health insurance expenditures by $1 billion annually in the June 2020 Plan as a placeholder for the yet-to-be identified labor savings. Subsequently, the City reached agreements with several unions to defer approximately $730 million of FY 2021 lump sum and welfare fund payments to FY 2022, leaving $270 million of residual savings to be realized in FY 2021. The City is using $1.27 billion of the ARPA local aid grant to replace the labor savings in FY 2021 and FY 2022. As a result, health insurance estimates in FY 2021 and FY 2022 were increased by $270 million and $1 billion, accordingly.
FY 2021 health insurance expenditures are revised upwards by $1.77 billion from the January Plan. The upward revision stems from a reversal of a planned used of $1.6 billion of RHBT funds to pay a portion of FY 2021 retiree pay-as-you-go health insurance cost and the use of stimulus funds to replace $270 million of residual labor savings. Technical adjustments to health insurance cost offsets some these increases. The use of stimulus funds to replace $1 billion in labor saving in FY 2022 along with technical adjustments result in a net increase of $748 million from the January Plan estimate. Outyear revisions are more moderate with decreases of $431 million in FY 2023, and $137 million in FY 2024 and a modest increase of $49 million in FY 2025.
Pensions
The FY 2022 Executive Budget projects pension expenditures of $10.15 billion, approximately 8 percent more than the FY 2021 estimate of $9.39 billion. Thereafter, pension contributions are projected to increase to $10.356 billion in FY 2023 and to $10.548 billion in FY 2024, before declining to $10.485 billion in FY 2025, as shown in Table 21.
Table 21. FY 2021 – FY 2025 City Pension Contributions
| ($ in millions) | FY 2021 | FY 2022 | FY 2023 | FY 2024 | FY 2025 |
| Five Actuarial Systems | $9,808 | $10,132 | $9,969 | $9,635 | $9,757 |
| Reserve for Expected Adjustments* | (415) | 16 | 382 | 905 | 716 |
| Non-City Systems | 109 | 114 | 117 | 120 | 123 |
| Less: Intra City-Expense | (112) | (112) | (112) | (112) | (112) |
| Net Pension Expense April Plan | $9,390 | $10,151 | $10,356 | $10,548 | $10,485 |
*The reserve is being held to accommodate expected changes in headcount, valuation refinements, and salary adjustments.
**Totals may not add up due to rounding.
The projections of pension contribution remain unchanged from the January Plan. In the January Plan, the City had revised pension contribution projections to reflect proposed changes to the actuarial assumptions and methodology used in determining pension contributions as proposed by the Office of Actuary (OA). Proposed changes to the actuarial assumptions center around lowering the consumer price index (CPI) assumption from 2.5 percent to 2.3 percent over a four-year period by reducing the CPI by 0.05 percent annually, beginning with the June 30, 2019 valuation. The CPI assumption is a component of the general wage increase and cost of living adjustment (COLA) assumptions. As such, the 0.05 percent annual reduction in CPI over four years as proposed will also lower the rates currently assumed for these assumptions. The change also would be reflected in the assumed return on pension fund investments (the AIRA), declining from the current 7.0 percent assumption to 6.8 percent for FY 2024. While lowering the CPI, wage increase, and COLA assumptions tend to reduce required contributions, lowering the AIRA, because it is used in the calculation of the present value of pension liabilities, raises required contributions as the higher liability is phased in.
Additionally, the Chief Actuary proposed (1) a restart of the actuarial value of assets (AVA), (2) revising of the phase-in period for recognizing gains and losses relative to the actuarial interest rate assumption (AIRA) from six years to five years to be phased-in at 20 percent annually, compared to 15 percent in the first four years, and 20 percent in the final two years under the current schedule, and (3) updating the post-retirement mortality assumptions to reflect the latest improvement scale released by the Society of Actuaries (MP-2020).
The above proposals resulted in a net reduction to pension projections of $430 million in FY 2021, $304 million in FY 2022, and $65 million in FY 2023. For FY 2024 and FY 2025 pension costs are expected to increase by $358 and $443 million, respectively. If the recommended changes are not adopted, there will be additional risks to the budget in FY 2021, FY 2022, and FY 2023. For FY 2024 and FY 2025, expenditures will be lower than projected.
The projections in the Plan are based on the assumption that pension investments will earn the actuarial interest rate assumption (AIRA) of 6.95 percent as of June 30th of the fiscal year. Pension investment return through March 31 was 19.31 percent, 12.36 percent above the AIRA. The Comptroller’s Office estimates that each percentage point in investment return above the AIRA as of June 30, 2021 will lower pension contributions by approximately $34 million in FY 2023, $68 million in FY 2024, and $102 million in FY 2025.
Department of Education
In the April Plan, the Department of Education (DOE) budget has risen substantially in FY 2022 – FY 2025 from the recognition of additional Federal stimulus funds under the CRRSA and ARPA enacted in December 2020 and March 2021, respectively, and passed through to the City in the State budget enacted in April. These two bills would provide total education support of nearly $7 billion — $2.15 billion from the CRRSA and $4.82 billion from the ARPA. The boost in Federal funding has a modest impact in the current year; about the only noteworthy item is the use of stimulus funds to offset $130 million in midyear budget reductions assigned to schools citywide in FY 2021.[22] However, the additional funding would quickly raise the DOE budget from $29.1 billion in FY 2021 to $31.4 billion in FY 2022 and remain at similar levels over the remainder of the Plan. Compared with the January Plan, projected DOE spending in the April Plan reflects net increases of $2.93 billion in FY 2022, $1.35 billion in FY 2023, $1.23 billion in FY 2024 and $940 million in FY 2025.
The April Plan has outlined a spending plan for the new Federal stimulus funds that would funnel significant resources to a wide range of areas over the course of the Plan, as detailed in Table 22. Given that the City is still waiting for Federal guidance on both the usage and the timing of the funds, the projections in the spending plan are subject to change once Federal guidelines are released. Further, the State has imposed an additional requirement on school districts to post a formal spending plan of the stimulus funds before July 1, 2021, which has to prioritize spending for in-person learning, education technology, COVID-related needs and other factors, as well as identify local support for the continuation of these programs beyond the timeline of Federal stimulus funds. The State also stipulates that school districts must allocate at least half of the ARPA funds evenly across FY 2022 – FY 2025, which equates to $602 million annually. The City currently has allocated only $530 million in FY 2025, which may need to be changed, pending Federal guidelines, in order to comply with the State’s requirement.
Table 22. DOE Stimulus Spending Plan – April 2021 Plan
| ($ in millions) | FY 2021 | FY 2022 | FY 2023 | FY 2024 | FY 2025 | FYs 2021-2025 Total |
| 3-K Expansion and Restoration | $3 | $378 | $469 | $753 | $376 | $1,980 |
| Operational Support | 1 | 1,077 | 235 | 43 | 7 | 1,363 |
| Academic Recovery/Student Support | 0 | 500 | 250 | 100 | 0 | 850 |
| Special Education Services | 0 | 198 | 192 | 95 | 47 | 532 |
| Instructional Support | 0 | 220 | 220 | 82 | 10 | 532 |
| Restoration of Other Prior Cuts | 0 | 293 | 122 | 91 | 3 | 508 |
| Programmatic Support | 2 | 202 | 52 | 52 | 0 | 308 |
| Mental Health | 0 | 80 | 86 | 86 | 49 | 300 |
| Information Technology Support | 2 | 155 | 70 | 6 | 0 | 233 |
| All Other | 138 | 35 | 75 | 76 | 38 | 363 |
| Total DOE Stimulus Spending | $146 | $3,137 | $1,772 | $1,384 | $530 | $6,968 |
Source: New York City Office of Management and Budget, April 2021 Plan.
The key component of the Plan is the restoration and expansion of the citywide 3-K program, which is estimated at a total cost of $2.36 billion in FY 2021 – FY 2025. The City expects Federal stimulus funds to fully fund the 3-K expansion through FY 2024. In FY 2025, the funding of the 3-K program would be evenly split between City and Federal funds at $376 million each. The City stated that the expansion will be phased-in over the next three years to begin offering 3-K seats in every school district until all needs are met. The targeted date for the completion of the 3-K rollout is in FY 2024, at the start of the 2023 – 24 school year.
The City has also set aside $850 million for academic recovery and student support services in the next three years to fund accelerated learning options through various strategies including tutoring and extended class time as well as support services for disadvantaged students such as multilingual and disabled. The Plan also allocates $508 million towards restorations of other prior cuts, the most significant of which are the $150 million Fair Student Funding reduction in FY 2022, $162 million for reviving the Mayor’s previously abandoned Equity and Excellence initiatives, $62 million for professional development and $46 million for expanded arts instruction. In addition, the Plan includes $300 million for mental health services, including the hiring of 350 additional social workers and $252 million for expansion of special education Pre-K services.
The remainder, totaling about $3.1 billion, represents a mixture of broad-based initiatives that are largely unspecified at this time. The list includes $1.36 billion for “operational support”, $532 million for “instructional support”, $308 million for “programmatic support”, $280 million for other special education services and $233 million for IT support. The City expects that more details on these actions will emerge in coming weeks following the release of Federal guidelines.
The April Plan also recognizes the impact of the enacted State budget, which rejected numerous cuts in charter facilities aid, prior year school aid reimbursement and teacher development programs proposed by the Governor in his January executive budget. More importantly, the State has pledged to fully fund Foundation Aid growth, as prescribed by the landmark Campaign for Fiscal Equity court case, to be phased-in over a three-year period. Once fully phased in, the State would deliver $9.1 billion in Foundation Aid to the City by FY 2024. Compared to the original FY 2021 Foundation aid base of $8.1 billion, this would represent average annual growth of 4.2 percent over the next three years.[23] Despite this development, Foundation Aid projections in the April Plan have been reduced by $353 million in FY 2022, $515 million in FY 2023 and $245 million in FY 2024 because the City had previously assumed an even higher average annual growth rate of 5.2 percent over this span.
Over the latter years of the April Plan, the DOE budget still faces net baseline risks ranging from $527 million to $870 million annually in FY 2023 – FY 2025. The largest components of the risks are charter tuition at $282 million to $625 million annually and special education Carter Cases at $200 million annually. Given the increased Federal support reflected in the April Plan, it is likely that stimulus funds could directly mitigate a significant portion of these risks or enable the Department to generate other offsets to sufficiently cover the remaining risks in the Plan.
Public Assistance
Through April, the City’s public assistance caseload has averaged 380,814 recipients per month thus far in FY 2021. Average monthly caseload has jumped 15.5 percent, or about 51,000 recipients compared to the same period in FY 2020. As shown in Chart 3, the City’s public assistance caseload rose rapidly during the early months of the Covid-19 pandemic, spiking from 325,016 in March 2020 to 391,432 in September 2020. Since September, caseload levels have receded and begun to stabilize in the 370,000 – 375,000 range in recent months, with the City reporting a caseload of 375,561 for April. Meanwhile, monthly baseline grants spending in FY 2021 has averaged about $122.6 million to date, reflecting an increase of about 7.5 percent over the same July – April period in FY 2020.
Chart 3. Public Assistance Caseload and Monthly Changes March 2020-April 2021
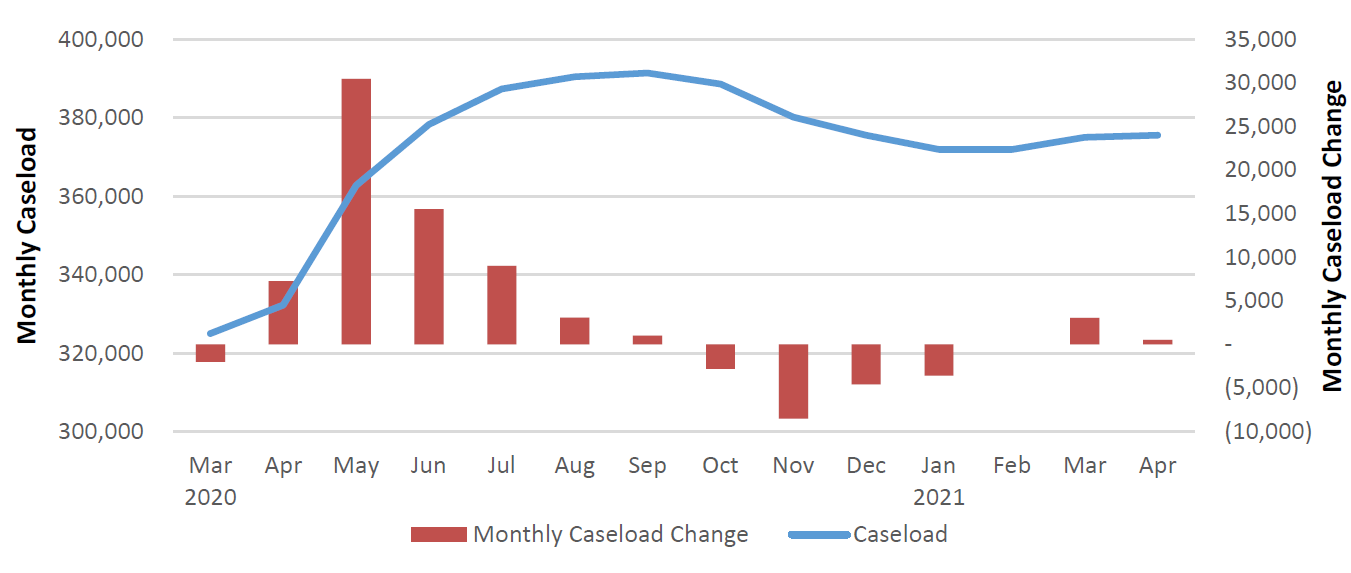
Although the City has not provided an update of its caseload projections, the April Plan maintains baseline grants expenditure estimates of approximately $1.43 billion in the current year and $1.48 billion in each of FY 2022 – FY 2025. Barring a significant rise in monthly spending, the City’s public assistance expenditures appear to be sufficiently funded. Due to the rise in monthly baseline grants spending in March and April, City-funded public assistance spending has become more tightly budgeted than our previous assessment in the January Plan. If this spending trend continues, the City may need to provide additional funding for this area in future plans.
Homeless Services
Spending on adult and family shelter in the Department of Homeless Services (DHS) is the primary driver of the City’s homelessness expenses. However, funding for homeless assistance is also, and increasingly, drawn from the budgets of other agencies, including the Department of Social Services, the Department of Youth and Community Development, the Department of Health and Mental Hygiene and the Department of Veterans Services. Table 23 details changes in total funding for seven major categories of homeless services across these agencies from FY 2021 – FY 2025.
Table 23. Citywide Homeless Services Expenditures
| ($ in millions) | FY 2021 | FY 2022 | FY 2023 | FY 2024 | FY 2025 |
| Adult Shelter Operations | $810 | $662 | $662 | $662 | $662 |
| Family Shelter Operations | 1,030 | 1,123 | 1,123 | 1,123 | 1,123 |
| Rental Assistance | 685 | 723 | 165 | 165 | 165 |
| Prevention, Diversion, Anti-Eviction & Aftercare | 483 | 489 | 489 | 489 | 488 |
| Domestic Violence, Youth & Emergency Shelters | 113 | 112 | 96 | 96 | 96 |
| Homeless Administration & Support | 986 | 367 | 277 | 277 | 277 |
| Total Citywide Homeless Spending | $4,107 | $3,476 | $2,813 | $2,812 | $2,812 |
Totals may not sum due to rounding.
Citywide homeless services expenses in FY 2021 will now reach more than $4.1 billion on the heels of substantial infusions of Federal funding to address the COVID-19 crisis. However, that total will decline in the Executive Budget for FY 2022, which reduces total citywide homeless services spending by over $630 million, relative to the prior year. The Executive Budget for FY 2022 increases projected citywide homeless services expenditures by approximately $347 million since the January plan, bolstered by $207 million in additional spending for rental assistance programming, driven by infusions of $160.7 million and $168 million in ARPA funding for rental assistance vouchers in FY 2021 and FY 2022, respectively, for COVID recovery and response. In addition, approximately $687 million in emergency Federal funding for DHS in FY 2021 and organized in its general administration budget function is not planned to extend into FY 2022, with some exceptions, including $3 million for homeless individual services and $125,000 for COVID-19 vaccines.
As of the release of the Executive Budget, there were 49,716 individuals in shelter. In the last year the total number of individuals in shelter has dropped by more than 7,400 persons as illustrated in Chart 4. Notably, over the last year, over 4,000 children exited the shelter system. At the same time, the number of single adult men increased by nearly 1,000. This recent increase in single adult men in shelter follows a pattern of persistent upward growth in the single adult shelter population. On April 24, 2014 there were 7,732 single adult men and 2,775 single adult women in shelter. Those numbers have grown to 13,648 men and 4,359 women in shelter as of April 24, 2021 — increases of 77 percent and 57 percent respectively.
Chart 4. Total Individuals in Shelter, FY 2014 – FY 2021
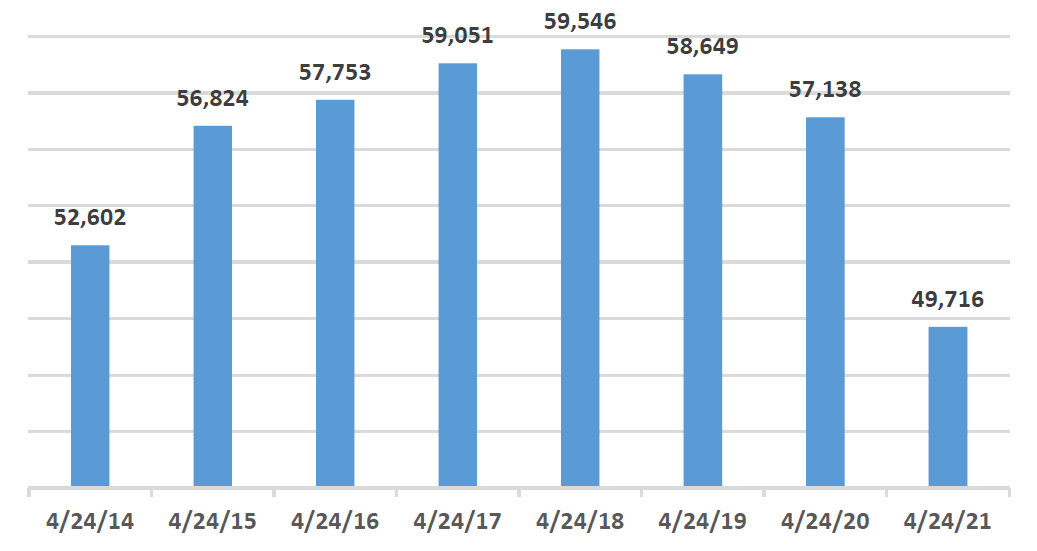
Despite these trends, the Executive Budget calls for an approximately $147 million reduction in DHS adult shelter operations spending in FY 2022. This planned spending reduction may reflect the loss of approximately $173 million in temporary Federal funding for FY 2022 as well as the addition of approximately $26 million in City-funds expenditures for adult shelter operations. However, in the absence of any forthcoming policies to aggressively reduce the single adult shelter census, reduce shelter delivery expenses for single adults or the emergence of new emergency funding from the Federal government, the Executive FY 2022 Budget for adult shelter operations appears to be insufficient. Even if the City is able to keep its adult shelter census at current levels, it is anticipated that at least $147 million in additional City-funds will be necessary to meet adult shelter expenses in FY 2022.
The Executive Budget builds on the January plan by increasing total spending for City anti-eviction programs by $23.5 million and bolsters expenditures for single-room occupancy hotels for clients of the Department of Social Services HIV/AIDS Services Administration (HASA) by $47.8 million. Other notable programmatic spending changes in FY 2022 detailed in the Executive Budget include reduced spending on housing for homeless veterans by $15.4 million, $24.7 million in increased spending for the Subsidized Jobs for Homeless Clients program and an additional $21.9 million for the 15/15 Supportive Housing program. The City will also dedicate $76.9 million in temporary Federal dollars to support the DHS Journey Home Street Homelessness Action Plan and will also use $3 million in temporary Federal aid to fund the DHS Cleanup Corps in FY 2022.
NYC Health + Hospitals
In the April Plan update, the City projects NYC Health + Hospitals (H+H; formerly the Health and Hospitals Corporation, or HHC) will end the current fiscal year with a cash balance of $734 million. For the FY 2022 Executive Budget, the City anticipates the H+H cash balance would rise modestly to $775 million. These projections represent significant improvements from prior cash balance estimates of $551 million and $256 million in FY 2021 and FY 2022, respectively.
A major factor is the elimination of the impact of a defect in the distribution of enhanced Federal Medicaid (eFMAP) payments under the CARES Act. Under the State’s methodology for distributing Medicaid Disproportionate Share Hospital (DSH) payments, H+H is the last payee in the system for the largest DSH pool and would have received a substantially smaller residual balance without a change in Federal law. H+H indicates the issue has been resolved by provisions in the ARPA, restoring previously anticipated reductions totaling $791 million in FY 2021 and FY 2022 under the January Plan.
The H+H financial plan also reflects increased disbursements of nearly $2.2 billion across FY 2021 and FY 2022, primarily attributable to test and trace and other COVID-related costs. The additional disbursements will be largely covered by increases in various Federal COVID assistance mainly earmarked for these purposes, including FEMA, ELC and ARPA grants, and expectation of higher supplemental Medicaid revenues under H+H Strategic Initiatives. As a result, H+H expects to generate modest operating surpluses of over $40 million in both FY 2021 and FY 2022, compared to projected deficits of $138 million in FY 2021 and $295 million in FY 2022 in the January Plan.
Over the remainder of the Plan, H+H anticipates retaining a cash balance of $753 million in FY 2023 before declining to $422 million in FY 2024 and $63 million in FY 2025. A major component supporting these assumptions is the increased value of Strategic Initiatives (formerly the Transformation Plan) throughout the Plan period. Compared with the January Plan, H+H has raised the revenue component of these initiatives by $535 million to $613 million annually in FY 2022 –FY 2025 solely from increased supplemental Medicaid revenue assumptions. The increases in supplemental Medicaid revenue under the Strategic Initiatives reflects a change in the way the City budgets its support for these assumptions, which were previously funded as revenues under City Services in the H+H financial plan.
IV. Capital Budget and Financing Program
Capital Commitment Plan, FY 2021 – FY 2025
The April 2021 Capital Commitment Plan for the five-year period FY 2021 through FY 2025 totals $93.0 billion in authorized all-funds commitments, as shown in Table 24. City-funds commitments account for $88.14 billion of the total. All-funds commitments increased by $8.88 billion, or 10.6 percent, from the January 2021 Commitment Plan.
All-Funds Commitments
All-funds commitments, after adjusting for the $9.90 billion reserve for unattained commitments, total $83.10 billion, or an average of $16.62 billion per year.[24] Approximately 14 percent of all-funds commitments, after netting out the reserve for unattained commitments, are scheduled for FY 2021.
Similar to past capital commitment plans, commitments for the Department of Education, the Department of Environmental Protection (DEP), transportation, including the DOT and the NYC Transit Authority, and Housing and Economic Development account for a majority of planned commitments, with 65.3 percent of total commitments.[25]
Table 24. FYs 2021 – 2025 Capital Commitments, All-Funds
| Project Category ($ in millions) | April FY 2021 – FY 2025 Commitment Plan | Percent of Total | Change from January 2021 Plan |
| Education and CUNY | $18,908 | 20.3% | $997 |
| Environmental Protection | 13,701 | 14.7% | 1,039 |
| Dept. of Transportation and Mass Transit | 13,836 | 14.9% | 2,619 |
| Housing and Economic Development | 14,299 | 15.4% | 2,529 |
| Administration of Justice | 8,740 | 9.4% | (172) |
| Resiliency, Technology and Equipment | 6,213 | 6.7% | 449 |
| Parks Department | 5,731 | 6.2% | 739 |
| Hospitals | 2,891 | 3.1% | 253 |
| Other City Operations and Facilities | 8,684 | 9.3% | 423 |
| Total Authorized Commitments | $93,002 | 100.0% | $8,876 |
| Reserve for Unattained Commitments | ($9,901) | N/A | ($1,621) |
| Total Net of Reserve for Unattained Commitments | $83,101 | N/A | $7,255 |
Source: NYC Office of Management and Budget, FY 2021 – FY 2025 April 2021 Commitment Plan.
Note: Numbers may not add due to rounding.
The net increase of $8.88 billion over FY 2021 – FY 2025 in authorized commitments from the January 2021 Plan is comprised of a decrease of $1.30 billion in FY 2021, followed by increases of $4.84 billion in FY 2022, $869.4 million in FY 2023, $617.0 million in FY 2024, and $3.85 billion in FY 2025.
The change in commitments over the Plan period is driven primarily by increases of $2.62 billion for DOT and NYC Transit, $2.53 billion in Housing and Economic Development, $1.04 billion for DEP related projects, and $997 million for DOE/CUNY related projects. These four project categories account for just over 80 percent of the $8.88 billion increase from the January 2021 Plan.
The decrease of $1.30 billion in commitments in FY 2021 from January 2021 stems primarily from decreases of $290 million in the Department of Correction, and deferrals of $249 million in citywide equipment and resiliency projects, and $196 million in Courts related projects to the outyears. The remaining reduction is due to a net decrease of $561 million among 37 project categories.
The increase of $4.84 billion from the January 2021 Plan in FY 2022 is due primarily to increases of $930 million for DOE projects, $683 million in citywide equipment and resiliency projects, $452 million for economic development projects, $320 million for water pollution control projects, and $305 million for HPD related projects. Another 35 project type categories combine for an increase of $2.15 billion.
The increase from the January 2021 Plan of $869 million in FY 2023 is largely driven by an increase of $440 million related to highways projects in DOT, along with a $265 million increase for water pollution control projects and a $222 million increase for HPD related projects. Thirty-seven other project types combine for a net decrease of $58 million.
The increase of $617 million in FY 2024 is primarily from an increase of $286 million in HPD projects and $236 million in water mains related capital commitments. Thirty-eight other project type changes arrived at a net increase of $95 million.
The $3.85 billion increase in FY 2025 is due primarily to increase in housing, parks, highway and mass transit projects. HPD capital commitments are increased by $702 million, of which $304 million is for low-income rental development and $135 million is for HPD’s Participation Loan Program. Parks Department commitments are increased by $585 million for citywide park improvements. In the DOT, planned commitments for highway bridges projects are increased by $575 million, and commitments for highway, road, and sidewalk reconstruction projects are increased by $548 million. Funding for New York City Transit increased by $460 million. About 35 other project types combined for a net increase of about $980 million.
Ten-Year Capital Strategy
The City is required by Sections 215 and 234 of the City Charter to issue a Ten-Year Capital Strategy (the Strategy) every odd calendar year. The Strategy for FY 2022 – FY 2031 totals $133.75 billion — $129.29 billion in City-funds and $4.46 billion in non-City funds. This is an increase of $14.95 billion, or 12.6 percent, from the Preliminary Ten-Year Capital Strategy published in January 2021, as shown in Table 25. The Strategy increased by $16.72 billion in City funds, but decreased by $1.76 billion in non-City funds, driven by a State funding decrease in DOE in the amount of $2.35 billion as the City anticipates it will not use TFA BARBs financing throughout the FY 2022-2031 period.
Table 25. Ten-Year Capital Strategy FY 2022 – FY 2031 vs January 2021 Preliminary Ten-Year Capital Strategy
|
($ in millions) |
January 2021 Preliminary Capital Strategy City-Funds | January 2021 Preliminary Capital Strategy All-Funds | April 2021 Capital Strategy City-Funds | April 2021 Capital Strategy All-Funds | Change in City-Funds | Change in All-Funds |
| Education (DOE and CUNY) | $19,395 | $21,752 | $22,967 | $22,971 | $3,572 | $1,219 |
| Environmental Protection | 20,439 | 20,835 | 22,046 | 22,669 | 1,607 | 1,834 |
| DOT | 17,112 | 18,497 | 21,375 | 22,846 | 4,262 | 4,349 |
| Housing (HPD and NYCHA) | 12,554 | 12,874 | 14,805 | 15,125 | 2,251 | 2,251 |
| Administration of Justice | 12,881 | 12,900 | 13,529 | 13,582 | 648 | 682 |
| Hospitals (H + H) | 2,137 | 2,850 | 2,533 | 3,300 | 397 | 450 |
| Resiliency, Tech. & Equipment | 8,103 | 8,299 | 9,035 | 9,367 | 932 | 1,068 |
| Economic Development | 4,329 | 4,524 | 4,778 | 4,999 | 449 | 475 |
| Parks Department | 4,618 | 5,026 | 5,209 | 5,613 | 591 | 588 |
| All Other | 11,005 | 11,235 | 13,012 | 13,273 | 2,006 | 2,038 |
| Total | $112,573 | $118,790 | $129,289 | $133,745 | $16,716 | $14,955 |
Source: January 2021 Preliminary Ten-Year Capital Strategy, Fiscal Years 2022-2031, and the April 2021 Ten-Year Capital Strategy. Note: Numbers may not add due to rounding.
The Strategy is front loaded with 57 percent of estimated commitments over the first four years and 68 percent over the first five. The majority of the commitments are for Education, DEP, Housing (including NYCHA), economic development, and DOT projects, which together constitute 66 percent of the Capital Strategy. The categories with the largest changes from the preliminary capital strategy are DOT with an increase of $4.35 billion, Housing with an increase of $2.25 billion, DEP with an increase of $1.83 billion, and DOE/CUNY with an increase of $1.22 billion from the preliminary strategy.
The increase in DOT is due to an increase of $1.38 billion for primary street resurfacing projects, $1.17 billion in pedestrian ramp construction, and a $632 million increase in bridge life extension related projects. The increase in Housing is due to $1.07 billion of additions for new housing, $525 million for preservation of existing housing, and $348 million for special needs housing. In addition, $300 million has been added to HPD for NYCHA preservation. DEP’s increase of $1.83 billion is comprised of $560 million to meet water quality mandates, including combined sewer overflow projects, holding and retention tanks; $401 million for replacement or augmentation of existing sewer systems, and $331 million for water quality preservation. The increase from the preliminary strategy in DOE/CUNY is due primarily to system expansion using alternatives such as the build out of leased space, building additions, and new athletic fields.
The Strategy continues to be primarily financed by City bonds (General Obligation (GO) and Transitional Finance Authority Future Tax Secured (TFA FTS)), with an estimated $107.24 billion in anticipated local tax-supported borrowing, or 80.2 percent of the Strategy. Municipal Water Finance Authority (NYW) debt is expected to fund $22.05 billion, or 16.5 percent of the Strategy. The remaining 3.3 percent, about $4.46 billion, will be funded with Federal ($3.59 billion), State ($616 million), and other non-City sources ($252 million) as shown in Table 26.
Table 26. Funding of the FY 2022 – FY 2031 Ten-Year Capital Strategy
| Agency/Project Type ($ in millions) |
Tax- Supported |
Water Authority Funded | Non-City Funded | Total Funded |
| Department of Education/CUNY | $22,967 | $0 | $4 | $22,971 |
| Department of Environmental Protection: | $0 | $22,046 | $622 | $22,668 |
| Water Pollution Control | 0 | 8,106 | 410 | 8,516 |
| Water Mains | 0 | 5,552 | 203 | 5,755 |
| Sewers | 0 | 5,390 | 9 | 5,399 |
| Water Supply | 0 | 2,387 | 0 | 2,387 |
| DEP Equipment | 0 | 611 | 1 | 612 |
| Dept. of Transportation | $21,375 | 0 | $1,471 | $22,846 |
| Bridges and Highway Bridges | 10,562 | 0 | 580 | 11,142 |
| Highways | 9,620 | 0 | 541 | 10,161 |
| Traffic | 784 | 0 | 230 | 1,014 |
| Ferries | 332 | 0 | 120 | 452 |
| Transportation Equipment | 76 | 0 | 1 | 77 |
| Housing Preservation and Development | $11,912 | $0 | $320 | $12,232 |
| NYCHA | $2,893 | $0 | $0 | $2,893 |
| Economic Development (SBS) | $4,778 | $0 | $221 | $4,999 |
| Administration of Justice | $13,529 | $0 | $53 | $13,582 |
| Police | 1,456 | 0 | 43 | 1,499 |
| Correction | 9,557 | 0 | 0 | 9,557 |
| Courts | 2,516 | 0 | 10 | 2,526 |
| Resiliency, Technology, and Citywide Equipment | $9,035 | $0 | $332 | $9,367 |
| Parks Department | $5,209 | $0 | $404 | $5,613 |
| Hospitals (H +H) | $2,533 | $0 | $767 | $3,300 |
| Other City Operations and Facilities | $13,012 | $0 | $262 | $13,274 |
| Total | $107,243 | $22,046 | $4,456 | $133,745 |
| Percent of Total Funding | 80.2% | 16.5% | 3.3% | 100.0% |
Source: Office of Management and Budget, FYs 2022 – 2031 Ten-Year Capital Strategy, April 2021.
Note: Numbers may not add due to rounding.
The TYCS is also categorized by service categories. This categorization places capital projects in broad infrastructure, equipment, vehicle, land, and facility categories. Just below 38 percent of the Capital Strategy is allocated for Road and Bridge Works, Housing, and Stormwater and Wastewater management. Planned commitments for Road and Bridge works sum to $21.6 billion, about half of which are for the rehabilitation and reconstruction of bridges, including $6.48 billion for the rehabilitation of bridges and highway bridges rated “fair” or “good”, and $3.76 billion for the reconstruction of bridges rated “fair”. Major projects include $422 million for the Trans-Manhattan Expressway and $1.5 billion for the Brooklyn Queens Expressway bridges projects (BQE). Approximately 30 percent of the commitments for Road and Bridge works are allocated for street reconstruction and resurfacing, including $3.47 billion for primary street reconstruction, and $2.96 billion for primary street resurfacing. The remaining commitments for Roads and Bridge works of about $4.9 billion, are allocated for traffic related and lighting projects, facility reconstruction, pedestrian ramp, and sidewalk improvements and reconstruction. Within the Housing category, $15.1 billion of commitments are directed primarily to the preservation of existing housing stock ($4.2 billion), new housing construction ($4.0 billion), and special needs housing ($2.9 billion). In the category of Stormwater and Wastewater management, which sums to $13.9 billion, the major components are $5.4 billion for sewer replacements, $5.1 billion for wastewater resource recovery facilities, and $2.6 billion to address water quality mandates, including the optimization of existing and construction of new traditional sewer overflow controls to prevent the release of combined sewer overflow (CSO) into harbor waters. One significant project is the Gowanus Canal superfund site for the construction of CSO retention tanks.
Almost 35 percent of total planned commitments are allocated for Public Buildings and Facilities and Educational Facilities as shown in Table 27. Estimated commitments for Public Buildings and Facilities total $23.1 billion and are comprised of $8.1 billion for new jail facilities in four of the boroughs excluding Staten Island, $6.1 billion for energy efficiency and sustainability projects, along with $2.52 billion for new or renovated court facilities, and $1.2 billion for Department of Sanitation garages and facilities. Commitments for Educational Facilities which include DOE and CUNY, total $22.9 billion. Planned commitments for the reconstruction and rehabilitation of existing schools ($6.84 billion) and new school construction and system expansion ($7.93 billion) comprise the bulk of these commitments.
Table 27. FY 2022 – FY 2031 Ten-Year Capital Strategy Major Capital Commitments by Service Category Classification
| ($ in millions
Service Category |
State of Good Repair | Program Expansion | Programmatic Replacement | Total | Percent of Total |
| Public Buildings and Facilities | $11,946 | $297 | $10,832 | $23,074 | 17.3% |
| Educational Facilities | 14,955 | 7,962 | 3 | 22,920 | 17.1% |
| Road and Bridge Works | 21,562 | 0 | 0 | 21,562 | 16.1% |
| Housing | 8,190 | 6,935 | 0 | 15,125 | 11.3% |
| Stormwater and Wastewater Management | 1,123 | 4,457 | 8,355 | 13,915 | 10.4% |
| Equipment and Technology | 1,583 | 0 | 8,692 | 10,275 | 7.7% |
| Water Supply and Treatment | 189 | 4,548 | 3,404 | 8,142 | 6.1% |
| Community Facilities | 5,818 | 213 | 143 | 6,174 | 4.6% |
| Parks and Open Spaces | 5,127 | 279 | 0 | 5,406 | 4.0% |
| Economic Development | 0 | 4,999 | 0 | 4,999 | 3.7% |
| Mass Transit | 1 | 0 | 2,151 | 2,152 | 1.6% |
| Total | $70,495 | $29,689 | $33,561 | $133,745 | 100.0% |
Source: Office of Management and Budget, FYs 2022-2021 Ten-Year Capital Strategy, April 2021
Note: Numbers may not tie due to rounding.
The remaining 28 percent of the Strategy is allocated among six service categories, with $10.2 billion of it allocated for Equipment and Technology, $8.14 billion for Water Supply and Equipment, $6.17 billion for Community Facilities, $5.41 billion for Parks and Open Spaces, $5.0 billion for Economic Development projects, and $2.15 billion for Mass Transit. The top three items in the Equipment and Technology category are the Department of Sanitation’s trucks and equipment purchases totaling $1.94 billion, citywide computer equipment purchases of $1.84 billion, and computer related equipment purchases for DOITT and Citynet for $1.03 billion. Capital works in the Water Supply and Equipment category includes the reconstruction of the City water tunnels, trunks and distribution main extensions, dam safety and filtration works and various improvements, upgrades and capital maintenance works related to the conveyance and supply of water to the City. Major commitments in this area include $2.58 billion for water main replacements and extensions citywide, $1.57 billion for the Kensico Tunnel project in upstate New York, and $1.40 billion for water quality preservation efforts. Projected capital commitments in the Community Facilities category is driven by $1.67 billion of essential reconstruction of facilities for libraries and cultural institutions along with $2.49 billion of routine reconstruction projects for H + H.
Notable projects in the Parks and Open Spaces, Economic Development, and Mass Transit categories include $2.0 billion for large, major, and regional park reconstruction projects, $1.6 billion for neighborhood parks and playgrounds, $1.65 billion for neighborhood revitalization projects, and $1.7 billion for track and other miscellaneous improvements related to New York City Transit.
Capital commitments in the current capital strategy are allocated among three “lifecycle” project categories: state of good repair, which involves maintaining and repairing facilities and infrastructure, program expansion, which involves adding new or expanding current facilities and infrastructure, and programmatic replacement, which involves replacing facilities or equipment. More than half of the commitments, $70.50 billion, are allocated for state of good repair followed by $33.56 billion for programmatic replacement, and $29.69 billion for program expansion, as shown in Table 27. State of good repair projects comprise 53 percent, with programmatic replacement at 25 percent, and program expansion accounting for 22 percent of the Strategy.
Educational Facilities, Public Building and Facilities, and Road and Bridge Works constitute just less than 69 percent, or $48.5 billion of commitments for state of good repair, with commitments for Educational Facilities and Road and Bridge Works totaling more than $36 billion combined. These commitments account for over 65 percent of planned commitments for Educational Facilities and the entirety of planned commitments for Road and Bridge Works.
Within the program expansion category, Educational Facilities, Housing, Stormwater and Wastewater, Water Supply and Treatment, and Economic Development projects constitute over 95 percent of the total. Major commitments include $7.96 billion for the construction of new schools, $6.92 billion for new and special needs housing construction, and $2.81 billion for neighborhood revitalization and community development projects administered by EDC/SBS.
Within the programmatic replacement category, Public Buildings and Facilities, Equipment and Technology, and Stormwater and Wastewater projects make up 83 percent of the total. Commitments include $8.11 billion for the design and construction of new borough-based jail facilities, $5.17 billion for upgrades to water pollution control plants, $3.4 billion for water main replacement and Dam safety programs at DEP, and $3.12 billion citywide information systems and equipment.
Financing Program
The April 2021 Financial Plan contains $56.5 billion of planned borrowing in FY 2021 – FY 2025, as shown in Table 28. The borrowing is comprised of $22.8 billion of GO bonds, $25.17 billion of TFA FTS bonds, $8.33 billion of New York Water Finance Authority (NYW) bonds and $200 million from the FY 2021 issuance of TFA Building Aid Revenue Bonds (BARB). The City does not plan to use TFA- BARBs over the remainder of the Plan period.
Table 28. April 2021 Plan Financing Program
| ($ in millions) | Estimated Borrowing and Funding Sources FY 2021 – FY 2025 |
Percent of Total |
| General Obligation Bonds | $22,800 | 40.4% |
| TFA – FTS Bonds | 25,173 | 44.6% |
| NYC Water Finance Authority (NYW) | 8,331 | 14.7% |
| TFA – BARBs | 200 | 0.3% |
| Total | $56,504 | 100.0% |
Source: NYC Office of Management and Budget, April 2021 Financial Plan.
Total projected borrowing in the April Plan for FY 2021 – FY 2025 is $2.46 billion more than the January 2021 Financial Plan estimate. This is a result of a decrease of $1.82 million in FY 2021, followed by increases of $1.55 billion in FY 2022, $656 million in FY 2023, $860 million in FY 2024, and $1.21 billion in FY 2025. Over the FY 2021 – FY 2025 period from the January 2021 Plan, NYW borrowing is estimated to remain relatively flat (+$30million), while City GO and TFA FTS borrowing is forecast to increase by $902 million and $910 million, respectively. These changes in borrowing reflect the increases in the Capital Plan over FY 2022 – FY 2025.
Debt Service
As shown in Table 29, debt service, net of prepayments, in the April 2021 Plan totals $6.43 billion in FY 2021, $7.16 billion in FY 2022, $8.47 billion in FY 2023, $8.86 billion in FY 2024, and $9.43 billion in FY 2025. Between FY 2021 and FY 2025, total debt service is expected to increase by $3.0 billion, or an annual average growth rate of 10.0 percent. These projections do not include debt service of the NYW, which is backed by water and sewer user fees, and that of the TFA BARBs, which is supported by New York State building aid.
Table 29. April 2021 Financial Plan Debt Service Estimates
| ($ in millions) | FY 2021 | FY 2022 | FY 2023 | FY 2024 | FY 2025 | Change FYs 21 – 25 |
Annual Percent Change FYs 21 –25 |
|
| GO | $3,431 | $3,876 | $4,437 | $4,741 | $4,972 | $1,541 | 9.7% | |
| TFAa | 2,815 | 3,087 | 3,806 | 3,929 | 4,264 | 1,449 | 10.9% | |
| Lease-Purchase | 105 | 125 | 148 | 118 | 116 | 11 | 2.6% | |
| TSASC, Inc. | 82 | 76 | 76 | 76 | 76 | (6) | (1.9%) | |
| Total | $6,433 | $7,164 | $8,467 | $8,864 | $9,428 | $2,995 | 10.0% | |
Source: April 2021 Financial Plan. NYC Office of Management and Budget
Note: Debt service is adjusted for prepayments. Numbers may not add due to rounding.
a Amounts do not include TFA – BARBs
The April Plan estimates represent decreases from the January 2021 Financial Plan of $105 million in FY 2021, and $270 million in FY 2022, $93 million in FY 2023, $33 million in FY 2024, and $27 million in FY 2025. The decreases from the January Plan are due primarily to re-estimates of VRDB costs, downward revisions of letter of credit (LOC) and remarketing fees, lower than projected borrowing costs, and savings from refunding actions. Over the FY 2021 – FY 2025 period, re-estimates of VRDB lowered GO debt service by $135 million and TFA FTS debt service by $45 million; revisions to LOC and remarketing fees reduced debt service by $20 million, lower borrowing costs versus plan yielded $252 million of savings, and a TFA refunding since January 2021 produced debt service savings of $255 million.
Since the beginning of FY 2021, the City has carried out two GO refundings, one in September and another in December, along with TFA FTS refundings in September 2020 and March 2021. In total, the City refunded $3.0 billion of GO bonds with the issuance of $2.89 billion in refunding bonds, lowering debt outstanding by about $112 million. With the two TFA FTS debt refundings, $3.42 billion of TFA FTS debt was refunded with the issuance of $2.85 billion in refunding bonds, lowering the TFA FTS debt outstanding by about $570 million. As shown in Table 30, the refunding actions produced savings of $445 million for GO and $627 million for TFA FTS debt service over FY 2021 – FY 2025. Combined, the savings total just over $1.07 billion over the period.
Table 30. Fiscal Year-To-Date GO and TFA FTS Savings from Refunding Actions
| ($ in millions) | FY 2021 | FY 2022 | FY 2023 | FY 2024 | FY 2025 | Total |
| GO Refunding | $272.90 | $171.80 | $0.00 | $0.00 | $0.00 | $444.70 |
| TFA FTS Refunding | 252.82 | 373.64 | 0.20 | 0.20 | 0.19 | 627.05 |
| Total | $525.72 | $545.44 | $0.20 | $0.20 | $0.19 | $1,071.75 |
Debt Affordability
Debt service as a percent of local tax revenues and as a percent of total-funds revenues are commonly used measures of debt affordability. In FY 2020, the City’s debt service was 10.7 percent of local tax revenues. The April 2021 Plan projects that debt service will consume 10.2 percent of local tax revenues in FY 2021, rising to 11.4 percent in FY 2022, 12.8 percent in FY 2023, 13.0 percent in FY 2024, and 13.5 percent in FY 2025, as shown in Chart 5. The upward trend in the debt service to tax revenue ratio reflects the continuing disparity between debt service and tax revenue growth rates over the Plan period. Debt service is projected to grow at an average annual rate of 10.2 percent from FY 2021 to FY 2025, while tax revenues during this period are projected to grow 2.7 percent annually.[26] Based on an assumption of 4 percent annual tax revenue growth in FY 2026 – FY 2031, this ratio would average 14.3 percent over this period. If annual tax revenue growth over this six-year period were to drop to 1.0 percent, the ratio would exceed the 15 percent threshold that is considered prudent by FY 2027.
Chart 5. NYC Debt Service as a Percent of Tax Revenues
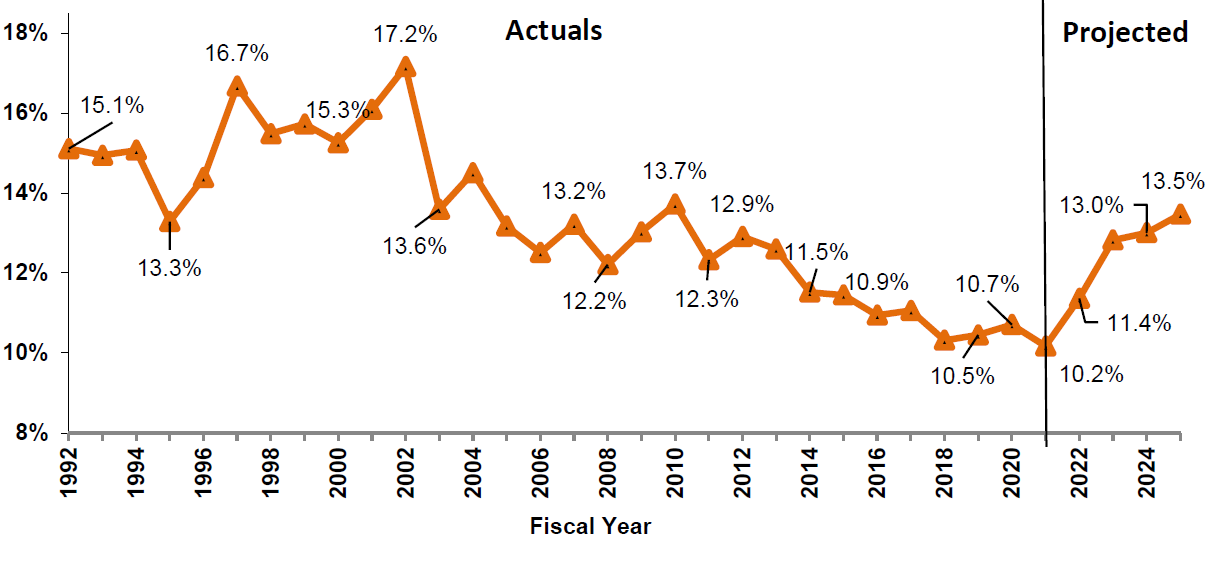
Source: Office of the NYC Comptroller, Comprehensive Annual Financial Reports, FY 1992 – FY 2020, and the NYC Office of Management and Budget, April 2021 Financial Plan.
Debt service, including TSASC, as a percent of total revenues is projected to be 6.4 percent in FY 2021, 7.3 percent in FY 2022, 8.7 percent in FY 2023, 8.9 percent in FY 2024, and 9.3 percent in FY 2025. Debt service growth over the period is 10.0 percent per year versus 0.1 percent per year for total revenues.
Chart 6. NYC Debt Service as a Percent of Total Revenues
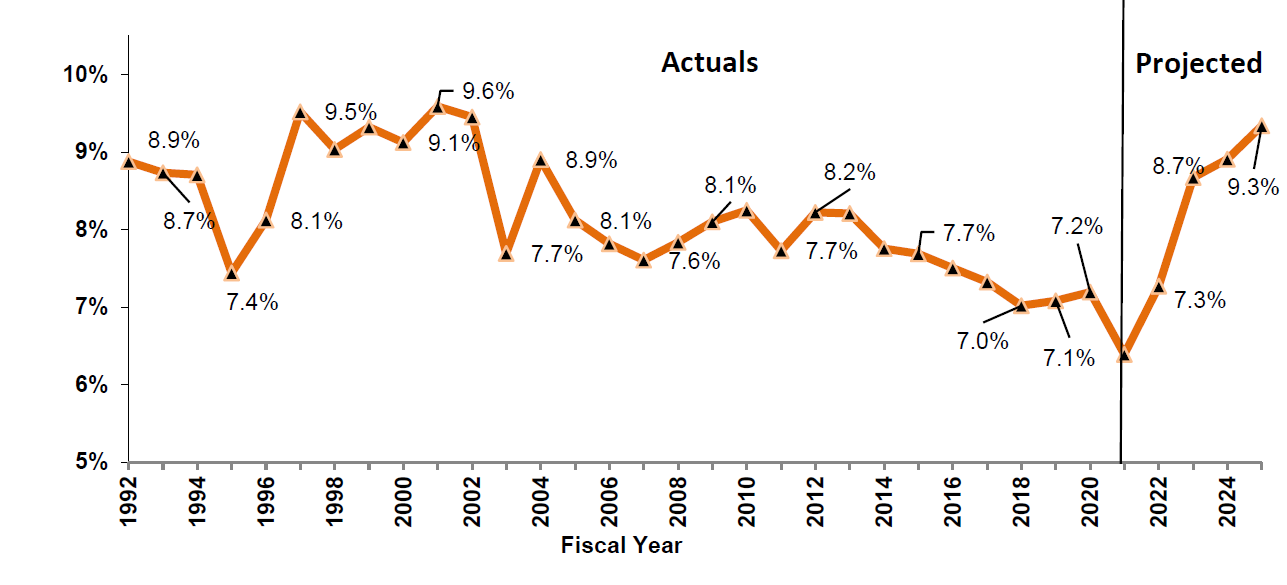
Source: Office of the NYC Comptroller, Comprehensive Annual Financial Reports, FY 1992 – FY 2020, and NYC Office of Management and Budget, April 2021 Financial Plan.
V. Appendix
Table A1. April 2021 Financial Plan Revenue Detail
| ($ in millions) | FY 2021 | FY 2022 | FY 2023 | FY 2024 | FY 2025 | Change FYs 2021 – 2025 |
Annual Percent Change | |
|---|---|---|---|---|---|---|---|---|
| Dollars | Percent | |||||||
| Taxes: | ||||||||
| Real Property | $31,108 | $29,522 | $30,192 | $30,619 | $31,027 | ($81) | (0.3%) | (0.1%) |
| Personal Income Tax | 13,344 | 13,827 | 14,728 | 15,280 | 15,849 | 2,505 | 18.8% | 4.4% |
| General Corporation Tax | 4,382 | 4,378 | 4,608 | 4,681 | 4,719 | 337 | 7.7% | 1.9% |
| Unincorporated Business Tax | 1,962 | 2,005 | 2,105 | 2,201 | 2,277 | 315 | 16.1% | 3.8% |
| Sale and Use Tax | 6,484 | 7,423 | 8,339 | 8,992 | 9,501 | 3,017 | 46.5% | 10.0% |
| Real Property Transfer | 992 | 1,155 | 1,335 | 1,409 | 1,484 | 492 | 49.6% | 10.6% |
| Mortgage Recording Tax | 816 | 894 | 919 | 971 | 1,024 | 208 | 25.5% | 5.8% |
| Commercial Rent | 841 | 880 | 913 | 937 | 959 | 118 | 14.0% | 3.3% |
| Utility | 357 | 374 | 376 | 383 | 395 | 38 | 10.6% | 2.6% |
| Hotel | 75 | 215 | 350 | 520 | 630 | 555 | 740.0% | 70.2% |
| Cigarette | 20 | 19 | 18 | 17 | 16 | (4) | (20.0%) | (5.4%) |
| All Other | 880 | 833 | 833 | 833 | 833 | (47) | (5.3%) | (1.4%) |
| Tax Audit Revenue | 1,171 | 921 | 721 | 721 | 721 | (450) | (38.4%) | (11.4%) |
| Total Taxes | $62,432 | $62,356 | $65,437 | $67,564 | $69,435 | $7,003 | 11.2% | 2.7% |
| Miscellaneous Revenue: | ||||||||
| Licenses, Franchises, Etc. | $607 | $658 | $686 | $688 | $686 | $79 | 13.0% | 3.1% |
| Interest Income | 14 | 9 | 10 | 13 | 36 | 22 | 157.1% | 26.6% |
| Charges for Services | 896 | 1,023 | 1,037 | 1,041 | 1,041 | 145 | 16.2% | 3.8% |
| Water and Sewer Charges | 1,721 | 1,634 | 1,614 | 1,596 | 1,594 | (127) | (7.4%) | (1.9%) |
| Rental Income | 258 | 248 | 248 | 248 | 248 | (10) | (3.9%) | (1.0%) |
| Fines and Forfeitures | 986 | 1,067 | 1,093 | 1,093 | 1,093 | 107 | 10.9% | 2.6% |
| Miscellaneous | 666 | 343 | 341 | 341 | 340 | (326) | (48.9%) | (15.5%) |
| Intra-City Revenue | 2,091 | 1,891 | 1,858 | 1,858 | 1,853 | (238) | (11.4%) | (3.0%) |
| Total Miscellaneous Revenue | $7,239 | $6,873 | $6,887 | $6,878 | $6,891 | ($348) | (4.8%) | (1.2%) |
| Unrestricted Intergovernmental Aid | $1 | $0 | $0 | $0 | $0 | ($1) | (100.0%) | (100.0%) |
| Reserve for Disallowance of Categorical Grants | ($15) | ($15) | ($15) | ($15) | ($15) | $0 | 0.0% | 0.0% |
| Less: Intra-City Revenue | ($2,091) | ($1,891) | ($1,858) | ($1,858) | ($1,853) | $238 | (11.4%) | (3.0%) |
| TOTAL CITY-FUNDS | $67,566 | $67,323 | $70,451 | $72,569 | $74,458 | $6,892 | 10.2% | 2.5% |
| Other Categorical Grants | $1,121 | $1,025 | $993 | $991 | $990 | ($131) | (11.7%) | (3.1%) |
| Inter-Fund Agreements | $658 | $725 | $725 | $725 | $725 | $67 | 10.2% | 2.5% |
| Federal Categorical Grants: | ||||||||
| Community Development | $895 | $327 | $261 | $261 | $261 | ($634) | (70.8%) | (26.5%) |
| Welfare | 3,767 | 3,329 | 3,453 | 3,453 | 3,453 | (314) | (8.3%) | (2.2%) |
| Education | 2,866 | 5,197 | 3,734 | 3,346 | 2,492 | (374) | (13.0%) | (3.4%) |
| Other | 8,777 | 4,713 | 1,709 | 1,538 | 1,698 | (7,079) | (80.7%) | (33.7%) |
| Total Federal Grants | $16,305 | $13,566 | $9,157 | $8,598 | $7,904 | ($8,401) | (51.5%) | (16.6%) |
| State Categorical Grants | ||||||||
| Social Services | $1,902 | $1,805 | $1,829 | $1,828 | $1,828 | ($74) | (3.9%) | (1.0%) |
| Education | 10,845 | 11,959 | 12,250 | 12,521 | 12,713 | 1,868 | 17.2% | 4.1% |
| Higher Education | 283 | 283 | 282 | 282 | 282 | (1) | (0.4%) | (0.1%) |
| Department of Health and Mental Hygiene | 484 | 515 | 548 | 548 | 548 | 64 | 13.2% | 3.2% |
| Other | 1,497 | 1,359 | 1,396 | 1,445 | 1,503 | 6 | 0.4% | 0.1% |
| Total State Grants | $15,011 | $15,921 | $16,305 | $16,624 | $16,874 | $1,863 | 12.4% | 3.0% |
| TOTAL REVENUES | $100,661 | $98,560 | $97,631 | $99,507 | $100,951 | $290 | 0.3% | 0.1% |
Note: Numbers may not add due to rounding.
Table A2. April 2021 Financial Plan Expenditure Detail
| ($ in millions) | FY 2021 | FY 2022 | FY 2023 | FY 2024 | FY 2025 | Change FYs 2021 – 2025 |
Annual Percent Change |
|
|---|---|---|---|---|---|---|---|---|
| Dollars | Percent | |||||||
| Mayoralty | $150 | $156 | $151 | $151 | $151 | $0 | 0.2% | 0.1% |
| Board of Elections | 199 | 183 | 137 | 137 | 137 | (62) | (31.2%) | (8.9%) |
| Campaign Finance Board | 95 | 73 | 15 | 15 | 15 | (80) | (84.2%) | (37.0%) |
| Office of the Actuary | 7 | 7 | 7 | 7 | 7 | 1 | 8.0% | 1.9% |
| President, Borough of Manhattan | 5 | 6 | 5 | 5 | 5 | (0) | (8.0%) | (2.1%) |
| President, Borough of Bronx | 6 | 7 | 6 | 6 | 6 | (1) | (10.1%) | (2.6%) |
| President, Borough of Brooklyn | 7 | 8 | 6 | 6 | 6 | (1) | (13.8%) | (3.6%) |
| President, Borough of Queens | 6 | 7 | 5 | 5 | 5 | (1) | (18.7%) | (5.0%) |
| President, Borough of Staten Island | 5 | 5 | 4 | 4 | 4 | (0) | (6.6%) | (1.7%) |
| Office of the Comptroller | 109 | 108 | 110 | 110 | 110 | 1 | 1.0% | 0.2% |
| Dept. of Emergency Management | 565 | 52 | 30 | 29 | 29 | (535) | (94.8%) | (52.3%) |
| Office of Administrative Tax Appeals | 6 | 6 | 6 | 6 | 6 | 0 | 2.1% | 0.5% |
| Law Dept. | 264 | 286 | 242 | 242 | 242 | (22) | (8.4%) | (2.2%) |
| Dept. of City Planning | 46 | 43 | 43 | 43 | 43 | (4) | (7.9%) | (2.0%) |
| Dept. of Investigation | 50 | 48 | 46 | 45 | 45 | (5) | (9.9%) | (2.6%) |
| NY Public Library — Research | 31 | 30 | 30 | 30 | 30 | (0) | (0.5%) | (0.1%) |
| New York Public Library | 154 | 149 | 153 | 153 | 153 | (1) | (0.8%) | (0.2%) |
| Brooklyn Public Library | 116 | 111 | 114 | 114 | 114 | (2) | (2.0%) | (0.5%) |
| Queens Borough Public Library | 121 | 116 | 119 | 119 | 119 | (2) | (1.8%) | (0.4%) |
| Dept. of Education | 29,089 | 31,400 | 30,866 | 31,141 | 31,298 | 2,208 | 7.6% | 1.8% |
| City University | 1,182 | 1,169 | 1,276 | 1,295 | 1,310 | 128 | 10.9% | 2.6% |
| Civilian Complaint Review Board | 20 | 25 | 24 | 24 | 24 | 4 | 21.0% | 4.9% |
| Police Dept. | 5,119 | 5,130 | 5,122 | 5,122 | 5,122 | 3 | 0.1% | 0.0% |
| Fire Dept. | 2,226 | 2,171 | 2,114 | 2,103 | 2,103 | (124) | (5.6%) | (1.4%) |
| Dept. of Veterans’ Services | 6 | 6 | 6 | 6 | 6 | 0 | 2.7% | 0.7% |
| Admin. for Children Services | 2,717 | 2,686 | 2,682 | 2,681 | 2,681 | (36) | (1.3%) | (0.3%) |
| Dept. of Social Services | 10,586 | 11,007 | 10,687 | 10,686 | 10,686 | 99 | 0.9% | 0.2% |
| Dept. of Homeless Services | 2,836 | 2,155 | 2,069 | 2,069 | 2,069 | (767) | (27.0%) | (7.6%) |
| Dept. of Correction | 1,139 | 1,177 | 1,204 | 1,204 | 1,204 | 66 | 5.8% | 1.4% |
| Board of Correction | 2 | 3 | 3 | 3 | 3 | 0 | 16.1% | 3.8% |
| Citywide Pension Contribution | 9,390 | 10,151 | 10,356 | 10,548 | 10,484 | 1,094 | 11.7% | 2.8% |
| Miscellaneous | 10,994 | 12,833 | 11,931 | 12,708 | 13,601 | 2,606 | 23.7% | 5.5% |
| Debt Service | 3,536 | 4,001 | 4,584 | 4,859 | 5,088 | 1,552 | 43.9% | 9.5% |
| T.F.A. Debt Service | 2,815 | 3,087 | 3,806 | 3,929 | 4,264 | 1,449 | 51.5% | 10.9% |
| FY 2020 BSA | (3,819) | 0 | 0 | 0 | 0 | 3,819 | (100.0%) | (100.0%) |
| FY 2021 BSA | 3,628 | (3,628) | 0 | 0 | 0 | (3,628) | (100.0%) | (100.0%) |
| Public Advocate | 5 | 5 | 5 | 5 | 5 | 0 | 0.6% | 0.1% |
| City Council | 82 | 81 | 56 | 56 | 56 | (25) | (30.9%) | (8.8%) |
| City Clerk | 5 | 6 | 6 | 6 | 6 | 1 | 13.7% | 3.3% |
| Dept. for the Aging | 396 | 440 | 447 | 444 | 447 | 51 | 13.0% | 3.1% |
| Dept. of Cultural Affairs | 183 | 170 | 150 | 150 | 150 | (33) | (18.0%) | (4.8%) |
| Financial Info. Serv. Agency | 116 | 113 | 113 | 113 | 113 | (4) | (3.1%) | (0.8%) |
| Office of Payroll Admin. | 16 | 15 | 15 | 15 | 15 | (1) | (7.6%) | (2.0%) |
| Independent Budget Office | 6 | 6 | 6 | 6 | 6 | 0 | 0.8% | 0.2% |
| Equal Employment Practices | 1 | 1 | 1 | 1 | 1 | 0 | 16.3% | 3.8% |
| Civil Service Commission | $1 | $1 | $1 | $1 | $1 | $0 | 12.6% | 3.0% |
| Landmarks Preservation Commission | 7 | 7 | 7 | 7 | 7 | 0 | 0.4% | 0.1% |
| Taxi & Limousine Commission | 119 | 55 | 57 | 57 | 56 | (63) | (53.0%) | (17.2%) |
| Commission on Human Rights | 13 | 13 | 13 | 13 | 13 | 0 | 3.4% | 0.8% |
| Youth & Community Development | 815 | 694 | 636 | 635 | 635 | (180) | (22.1%) | (6.1%) |
| Conflicts of Interest Board | 3 | 3 | 3 | 3 | 3 | 0 | 10.2% | 2.5% |
| Office of Collective Bargaining | 2 | 2 | 2 | 2 | 2 | 0 | 4.3% | 1.1% |
| Community Boards (All) | 19 | 19 | 19 | 19 | 19 | 0 | 0.7% | 0.2% |
| Dept. of Probation | 117 | 118 | 116 | 116 | 116 | (1) | (0.9%) | (0.2%) |
| Dept. Small Business Services | 343 | 317 | 143 | 140 | 189 | (154) | (44.9%) | (13.8%) |
| Housing Preservation & Development | 1,373 | 1,084 | 1,023 | 1,038 | 1,036 | (338) | (24.6%) | (6.8%) |
| Dept. of Buildings | 196 | 226 | 207 | 200 | 199 | 3 | 1.6% | 0.4% |
| Dept. of Health & Mental Hygiene | 2,427 | 2,128 | 1,981 | 1,892 | 1,830 | (597) | (24.6%) | (6.8%) |
| NYC Health + Hospitals | 2,419 | 899 | 602 | 610 | 610 | (1,809) | (74.8%) | (29.1%) |
| Office of Administrative Trials & Hearings | 46 | 52 | 51 | 51 | 51 | 6 | 12.1% | 2.9% |
| Dept. of Environmental Protection | 1,489 | 1,519 | 1,439 | 1,416 | 1,413 | (76) | (5.1%) | (1.3%) |
| Dept. of Sanitation | 2,428 | 1,816 | 1,817 | 1,818 | 1,827 | (601) | (24.8%) | (6.9%) |
| Business Integrity Commission | 9 | 9 | 9 | 9 | 9 | 0 | 5.0% | 1.2% |
| Dept. of Finance | 311 | 335 | 330 | 330 | 327 | 16 | 5.1% | 1.3% |
| Dept. of Transportation | 1,134 | 1,242 | 1,269 | 1,269 | 1,270 | 136 | 12.0% | 2.9% |
| Dept. of Parks and Recreation | 517 | 526 | 493 | 493 | 493 | (24) | (4.6%) | (1.2%) |
| Dept. of Design & Construction | 364 | 214 | 154 | 155 | 156 | (208) | (57.2%) | (19.1%) |
| Dept. of Citywide Admin. Services | 1,209 | 539 | 544 | 544 | 544 | (665) | (55.0%) | (18.1%) |
| D.O.I.T.T. | 906 | 567 | 572 | 582 | 589 | (318) | (35.0%) | (10.2%) |
| Dept. of Record & Info. Services | 11 | 17 | 17 | 17 | 17 | 6 | 52.0% | 11.0% |
| Dept. of Consumer & Worker Protection | 41 | 44 | 45 | 44 | 44 | 3 | 6.6% | 1.6% |
| District Attorney – N.Y. | 142 | 125 | 125 | 125 | 125 | (17) | (11.9%) | (3.1%) |
| District Attorney – Bronx | 94 | 91 | 91 | 91 | 91 | (3) | (2.8%) | (0.7%) |
| District Attorney – Kings | 127 | 120 | 120 | 120 | 120 | (8) | (5.9%) | (1.5%) |
| District Attorney –Queens | 78 | 77 | 77 | 77 | 77 | (1) | (1.6%) | (0.4%) |
| District Attorney – Richmond | 20 | 19 | 19 | 18 | 18 | (1) | (5.6%) | (1.4%) |
| Office of Prosec. & Special Narc. | 26 | 25 | 25 | 25 | 25 | (0) | (1.1%) | (0.3%) |
| Public Administrator – N.Y. | 1 | 1 | 1 | 1 | 1 | 0 | 4.9% | 1.2% |
| Public Administrator – Bronx | 1 | 1 | 1 | 1 | 1 | 0 | 0.0% | 0.0% |
| Public Administrator – Brooklyn | 1 | 1 | 1 | 1 | 1 | 0 | 0.0% | 0.0% |
| Public Administrator – Queens | 1 | 1 | 1 | 1 | 1 | 0 | 3.5% | 0.9% |
| Public Administrator – Richmond | 1 | 1 | 1 | 1 | 1 | (0) | (0.9%) | (0.2%) |
| Prior Payable Adjustment | (421) | 0 | 0 | 0 | 0 | 421 | (100.0%) | (100.0%) |
| General Reserve | 50 | 300 | 1,000 | 1,000 | 1,000 | 950 | 1900.0% | 111.5% |
| Citywide Savings Initiatives | 0 | (254) | (334) | (339) | (344) | (344) | NA | NA |
| Energy Adjustment | 0 | 0 | (0) | 20 | 43 | 43 | NA | NA |
| Lease Adjustment | 0 | 0 | 44 | 88 | 135 | 135 | NA | NA |
| OTPS Inflation Adjustment | 0 | 0 | 56 | 111 | 167 | 167 | NA | NA |
| TOTAL EXPENDITURES | 100,661 | 98,560 | 101,536 | 103,207 | 104,887 | 4,226 | 4.2% | 1.0% |
Note: Numbers may not add due to rounding.
Endnotes
[1] Federal Reserve Economic Data
[2] Bureau of Labor Statistics
[3] COVID-19: Data Trends – NYC Health
[4] Local Area Unemployment Statistics Program – New York State Department of Labor (ny.gov)
[5] Office Market Information, Cushman & Wakefield
[6] The Richest Neighborhoods Emptied Out Most as Coronavirus Hit New York City, The New York Times, 5/15/2020
[7] COVID-19 Impact on Migration Patterns, CBRE
[8] NYx2, New York is Growing 2x Faster than in 2019, Unacast.com
[9] Streeteasy Data Dashboard, Streeteasy.com
[10] Consumer Price Index, New York-Newark-Jersey City – March 2021: U.S. Bureau of Labor Statistics (bls.gov)
[11] Burning Glass, via Tracktherecovery.org.
[12] Job Openings, Total Nonfarm(JTSJOL), U.S. Bureau of Labor Statistics, via Federal Reserve Economic Data (FRED).
[13] Tax audit revenues through March were $168 million below January projection but tax audit revenue projections in the Plan remain unchanged from January.
[14] See prior report, Comments on the City’s Preliminary Budget, for discussion on the FY 2022 decline in property tax revenue
[15] Some provisions such as the decoupling from Federal Opportunity Zone tax deferrals could have minor impacts on City revenues.
[16] New Hampshire v. Massachusetts (20201019090315372_NH v. MA Orig Action.pdf (supremecourt.gov)
[17] FY 2022 Executive Budget Message of the Mayor (www.nyc.gov/omb)
[18] Although water and sewer revenues are recurring revenues, they are mostly payments from the New York City Water Board for the operation and maintenance of the water delivery and sewer system and therefore are not available for general operating purposes. However, FY 2021 water and sewer revenues include $137 million in rental payment that the City requested from the Water Board.
[19] A more detailed discussion of Federal stimulus funding for education can be found in the “Department of Education”, beginning on page 32.
[20]https://nyassembly.gov/leg/?default_fld=%0D%0A&leg_video=&bn=A03009&term=&Summary=Y&Actions=Y&Memo=Y&Text=Y
[21] https://www.osc.state.ny.us/files/reports/budget/pdf/enacted-budget-report-2021-22.pdf
[22] The April Plan also reflects a funding swap of $114 million between City funds and ARPA local relief grants with a net zero impact on the DOE budget in FY 2021. A similar transaction also takes place in FY 2025 in which $191 million in City-funds has been replaced with ARPA local relief grants.
[23] Adjusted to reflect $721 million in Foundation Aid originally supported with State funds that the State subsequently supplanted with Federal stimulus funds.
[24] The annual average commitment of total authorized commitments, which include reserve for unattained commitments, is $18.60 billion.
[25] This percentage assumes all DOT project types, not just bridges and highways.
[26] Excludes TSASC debt service.