
A Message from the Comptroller

Dear New Yorkers,
Rumors of New York City’s demise – sometimes called a “doom loop” – can be heard in some quarters these days. But as I told a group of economists and policymakers at the Federal Reserve Bank of New York’s Fiscal Policy Annual Meeting in June, I believe the data show these predictions are overblown. While the city faces significant challenges that we must thoughtfully address, we are on strong economic footing to do so.
The Local Economy
Private sector employment is back to pre-COVID-19 levels, though job growth remains below the extraordinary trend seen in the decade prior to the pandemic. Overall office occupancy is, of course, at a lower level as a result of the shift to remote and hybrid work. That has real consequences and calls for more creative solutions. But the number of office-using jobs is at an all-time high, the city’s regional share of them is increasing, and new data indicate that attendance is recovering better than in most U.S. cities.
There are also growing signs that the national economy will avoid recession and continue to add jobs in the coming quarters. Both nationally and locally, initial jobless claims remain reassuringly low, inflation has come down steadily, and surveys of consumers and businesses show improving sentiment.
The Fiscal Health of Our City
The near-term state of City finances is sound (see our Spotlight on NYC’s historically high cash position here). Personal income tax revenues are well above 2019 levels and property tax collections in the past fiscal year were up 7.1 percent versus the prior year (non-property tax collections were up 4.1 percent). Strong pension returns of 8.0 percent for the fiscal year that ended June 30th will enable the City to reduce its contributions by $330 million over the financial plan.
While some have predicted the impact of remote work on office real estate as catastrophic for the City’s revenues, our recent analysis shows that even under a “doomsday” scenario, with office values falling by 40 percent, the estimated revenue shortfall as of FY 2027 would be a manageable $1.1 billion, or 1.0 percent of the City’s total budget.
Still, there are serious fiscal pressures: long-awaited wage increases for the City’s essential workforce, the end of COVID-19 federal stimulus funding, and the growing costs for shelter and services for people seeking asylum, without adequate federal or State assistance. Because of these and other factors, we project an FY 2027 budget gap nearing $14 billion, as described in the attached report.
My office has been consistently advocating for strong fiscal stewardship to address these gaps, and to protect the City against serious economic downturns in the future. We need to transform the City’s Programs to Eliminate the Gap from short-term exercises into a regular feature of our budgeting process, focused on identifying long-term efficiencies, including staff management strategies and attrition planning, that prevent overreliance on unsustainable vacancies and overtime. Additionally, agencies should be accountable for claim settlement payouts, payroll operations should be modernized, and the City needs systems to improve grant revenue and expense tracking.
While the City made significant deposits into long-term reserves in FY 2022, no deposits were made to long-term reserves in FY 2023–nor was progress made towards establishing deposit and withdrawal rules. We continue to urge the adoption of a standardized framework for the City’s rainy-day fund, to protect it from the vicissitudes of the annual budget process.
Competent and Compassionate Government
More broadly, we urge an approach that emphasizes competent and compassionate government in rising to the challenges we face.
We should apply this framework to the dramatic increase of people seeking asylum. The issue is not the arrival of people here – immigrants have long been a driver of this city’s economic growth. However, providing so many of them with shelter is operationally demanding and very expensive. Rather than seek to overturn the right-to-shelter, the City should work to clarify that this responsibility, grounded in the New York State Constitution, applies to all 62 counties in the state, not only to the five boroughs. Albany and Washington must do more to help. One wise thing New York City could do on our own is scale up the assistance we are providing to help people apply for asylum, and then to obtain work authorization six months later.
The crisis of affordability, especially housing affordability, facing working families in New York is one of the biggest risks we face. We need an ambitious deal at the State level to expand housing supply across all incomes while simultaneously protecting tenants from eviction without good cause. Part of this deal should be a new multifamily tax framework like the one our office has put forward, that replaces 421a with something far less wasteful that enables development while focusing subsidies on truly affordable housing. At the City level, we need to revive HPD’s capacity to get housing deals moving and launch a modern-day version of the Mitchell-Lama program to provide permanently affordable cooperative homeownership opportunities to working class families currently being priced out of the city.
Finally, as the Governor and Mayor’s “New” New York Panel argued last year, securing our economic future as a place of density, diversity, and creativity will require new investments in child care, mental health, transit, the public realm, and climate readiness. Even with the approach to savings and efficiencies proposed above, these new investments will require new revenues. These revenues should be both progressive and effective, coming from high-income residents and the owners of high-value real estate, without further burdening low-income or middle-income New Yorkers.
The FY 2024 Adopted Budget Report
Our latest report assesses these and other themes at greater length and offers insight into the City’s latest budget. I hope you will find it useful.

-Brad
I. Executive Summary
New York City begins fiscal year (FY) 2024 with a stronger economy than many predicted just six months ago. While growth in the city is expected to slow this year compared with FY 2023, fears of recession have tamed considerably. Private employment in the city has almost completely returned to its historic high that preceded the pandemic. Tourism also continues to recover with hotel room demand close to pre-pandemic levels. City tax receipts for FY 2023 are greater than the Comptroller’s Office’s prior estimates, driven by stronger personal income tax revenues. Returns on the City’s pension fund investments for FY 2023 averaged 8 percent, one percentage point higher than the 7 percent target rate, which will allow the City to decrease future contributions.
While there is reason for optimism, serious challenges remain. Severe housing unaffordability threatens the inclusivity of the city and the strength of its economy. Although the recovery of jobs has been strong, it has been uneven. The growing costs of providing shelter and services to people seeking asylum, without adequate federal or State support, is putting an increased strain on the budget.
Overall, the Adopted Budget for FY 2024 totals $107.12 billion, $3.71 billion less than the final FY 2023 budget. The year-over-year decline is primarily due to a reduction in federal grants, mainly from the spending down of COVID-19 aid, along with a lower forecast for tax revenues. While the Adopted FY 2024 Budget is less than the FY 2023 budget, it reflects an increase of $426 million from the Executive FY 2024 Budget proposed by the Mayor in April.
Most of the growth from the Executive to the Adopted Budget comes from increased State grants—primarily due to greater formula-based school aid included in the State budget (although this is offset by an increase in $435 million in City funds to cover negative cost-impacts from Albany’s budget). Projections for federal aid, on the other hand, were adjusted downward—an overly rosy expectation that the City would receive $600 million from Washington for shelter and services to people seeking asylum was reduced by $465 million.
The Mayor’s Office of Management and Budget’s (OMB) estimates of City-funded revenues for FY 2024 changed little from the Executive to Adopted Budget, growing by $21 million in non-tax revenues. OMB increased its FY 2024 property tax forecast by $300 million, but the increase is offset by an equal reduction in OMB’s projections for personal income tax collections.
While OMB did not significantly revise its FY 2024 forecast, it recognized $2.05 billion more in City-funded revenues for FY 2023. The City used these revenues to increase the prepayment of FY 2024 costs in FY 2023. This freed more than $2 billion in FY 2024 for expenditures compared with the Executive Budget and balanced the budgets for both years.
OMB projects budget gaps of $5.08 billion in FY 2025, $6.84 billion in FY 2026, and $7.90 billion in FY 2027.
The Comptroller’s Office projects higher tax revenues than OMB in each year of the financial plan. For FY 2024, the Comptroller’s Office forecasts total tax revenues $767 million higher than OMB. This is $350 million more than this Office projected in April, largely due to higher-than-expected assessments in the recently released final property tax roll. While OMB also increased its property tax forecast for FY 2024, it did not revise its outyear projections. This is the main driver of the difference between the two offices’ forecasts in FY 2025 through FY 2027. In total, the Comptroller’s Office forecast of tax revenues exceed OMB’s by $1.09 billion in FY 2025, $1.39 billion in FY 2026 and $1.70 billion in FY 2027.
The Adopted Budget agreed upon between the Mayor and the City Council restored 1 percent of cuts planned for FY 2024 made as part of the Mayor’s Programs to Eliminate the Gap (PEGs) released since November, with a total of $30 million of the cumulative $3 billion in FY 2024 PEGs restored. This includes restoring a cut to the city’s libraries ($20.5 million), and a partial restoration of cuts to CUNY ($5.9 million of $41.3 million) and to the City’s older adult center meal program ($2.5 million of $7 million).
While OMB added funds in the Adopted Budget to more accurately reflect the likely costs of several programs that the Comptroller’s Office identified as underfunded in its Comments on the Executive Budget, many expenditures remain underbudgeted. These and other risks eclipse the higher revenues projected by this Office.
One of the largest fiscal risks remains that the costs of shelter for people seeking asylum will be higher than budgeted (especially in FY 2026 and FY 2027, where the financial plan does not yet include any projected expenses). In Comments on the Executive Budget, the Comptroller’s Office modeled three scenarios of potential costs of shelter provision to people seeking asylum. As of July 30, the growth in the number of households in the City’s shelter system since May exceeds even the Comptroller’s Office’s highest projection. The Comptroller’s Office is not yet increasing its risk for these costs as these new data are measured over a relatively short period of time; yet they indicate that costs may be even higher. The Office currently estimates these risks at an additional $750 million in FY 2024, $2.94 billion in FY 2025, and $3.65 billion in FYs 2026-2027.
Another substantial risk pertains to the City’s rental assistance programs. The Adopted Budget increased funding for these programs by $262 million (to $420 million), but only for FY 2024. This includes $123 million to fund a recent change that eliminated the “90-day rule” which has required that households remain in shelter for at least 90 days before being eligible for assistance. Even with the additional funds budgeted, however, the Comptroller’s Office estimates that additional resources of $374 million are still needed in FY 2024 to account for spending growth over the past two fiscal years, and $637 million in FY 2025 and beyond to sustain the current program (including the 90-day rule change). These estimates do not yet include recent legislative changes that expand program eligibility to more households at risk of eviction, recently passed by City Council over the Mayor’s veto. Given the likelihood of litigation by the Mayor to halt or stall these eligibility changes, the Comptroller’s Office is not yet including the expanded costs of the program based on Council legislation. However, both the City Council and the Administration estimate that costs will increase considerably—ranging from $10.2 billion to $17.3 billion over five years, respectively.
Similarly, the Adopted Budget added $150 million for special education Carter Cases at the Department of Education (DOE) in FY 2024 alone. Based on historic costs, the Comptroller’s Office estimates another $325 million will be necessary. Overall, the Comptroller’s Office estimates that spending at the DOE will exceed budgeted costs by $399 million in FY 2024 rising to $2.42 billion in FY 2027. This results from the increased need for Carter Cases, the expiration of Federal COVID-19 aid used to fund ongoing programs, the implementation of the State mandate to reduce class sizes, as well as other costs.
Other areas where the Comptroller’s Office estimates higher costs than budgeted include overtime (most significantly at the NYPD), public assistance, and contributions to the MTA.
There are some areas where the Comptroller’s Office estimates that spending will total less than planned. As previously mentioned, a higher rate of return on the City’s investment of its pension funds means that the City can reduce pension costs by $49 million in FY 2025, $111 million in FY 2026 and $170 million FY 2027. In addition, despite preliminary data showing a slight uptick in the number of full-time City employees over the last two months, a high vacancy rate for municipal employees (7 percent) means the City will likely spend less than budgeted on personnel costs in FY 2024.
Overall, the Comptroller’s Office projects an FY 2024 gap of $1.96 billion —which could be mostly offset by the $1.45 billion built into the budget as reserves. Outyear gaps are larger at $9.65 billion in FY 2025, $12.62 billion in 2026, and $13.98 billion in FY 2027 (Gaps total 1.8 percent of Adopted Budget in FY 2024 growing to 12.8 percent of total planned revenues by FY 2027).
In addition to the expense budget, the FY 2024 Capital Budget was adopted in June, including $1.20 billion in additions compared with the Executive Budget. The Parks Department, DOE, Cultural Affairs, and H+H account for most of the increased funding. There is a total of over $4 billion for housing-related capital projects available in FY 2024; however, the Preliminary Mayor’s Management Report raises concern that new affordable housing projects are not being financed at a pace necessary to commit these funds. Given the growing housing affordability crisis, carefully committing these funds to programs that increase affordable housing stock is critical to the city’s continued success.
Overall, while the Comptroller’s Office projects a manageable gap in FY 2024, outyear gaps present cause for concern. The City must create thoughtful, long-term strategies to increase efficiency and achieve savings without cutting core services. Such strategies should include: transforming the City’s Programs to Eliminate the Gap from short-term exercises into a regular feature of our budgeting process; identifying long-term efficiencies including staff management strategies and attrition planning that prevent overreliance on unsustainable vacancies and overtime; holding agencies accountable for claim settlement payouts; improving City systems for grant revenue and expense tracking; and, as this office has long advocated, establishing a standardized framework for deposits and withdrawals to the City’s rainy-day fund.
Even with a stronger approach to savings and efficiencies, however, new revenues will likely be necessary to make additional investments in childcare, mental health, transit, the public realm, and climate readiness, of the sort proposed by the “New” New York Panel convened by Governor Hochul and Mayor Adams, and co-chaired by former Deputy Mayors Doctoroff and Buery. As this office has outlined, these revenues should be both progressive and effective, coming from high-income residents and the owners of high-value real-estate, without further burdening low-income or middle-income New Yorkers, in order to promote inclusive growth in the years to come.
Table 1. FY 2024 – FY 2027 Financial Plan
| Change FYs 2024 –2027 |
||||||
|---|---|---|---|---|---|---|
| ($ in millions) | FY 2024 | FY 2025 | FY 2026 | FY 2027 | Dollar | Percent |
| Revenues | ||||||
| Taxes: | ||||||
| General Property Tax | $32,705 | $32,366 | $32,633 | $33,238 | $533 | 1.6% |
| Other Taxes | 37,713 | 39,747 | 41,118 | 42,962 | 5,249 | 13.9% |
| Tax Audit Revenues | 721 | 721 | 721 | 721 | 0 | 0.0% |
| Subtotal: Taxes | $71,139 | $72,834 | $74,472 | $76,921 | $5,782 | 8.1% |
| Miscellaneous Revenues | 7,808 | 7,618 | 7,557 | 7,513 | (295) | (3.8%) |
| Unrestricted Intergovernmental Aid | 0 | 0 | 0 | 0 | 0 | N/A |
| Less: Intra-City Revenues | (1,990) | (1,980) | (1,983) | (1,980) | 10 | (0.5%) |
| Disallowances Against Categorical Grants | (15) | (15) | (15) | (15) | 0 | 0.0% |
| Subtotal: City-Funds | $76,942 | $78,457 | $80,031 | $82,439 | $5,497 | 7.1% |
| Other Categorical Grants | 1,082 | 1,075 | 1,071 | 1,070 | (12) | (1.1%) |
| Inter-Fund Revenues | 720 | 725 | 732 | 732 | 12 | 1.7% |
| Federal Categorical Grants | 10,320 | 7,816 | 7,054 | 7,027 | (3,293) | (31.9%) |
| State Categorical Grants | 18,051 | 17,714 | 17,477 | 17,540 | (511) | (2.8%) |
| Total Revenues | $107,115 | $105,787 | $106,365 | $108,808 | $1,693 | 1.6% |
| Expenditures | ||||||
| Personal Service | ||||||
| Salaries and Wages | $32,998 | $33,746 | $35,144 | $36,364 | $3,366 | 10.2% |
| Pensions | 9,642 | 10,423 | 10,885 | 11,067 | 1,425 | 14.8% |
| Fringe Benefits | 13,327 | 14,173 | 14,947 | 15,563 | 2,236 | 16.8% |
| Subtotal-PS | $55,967 | $58,342 | $60,976 | $62,994 | $7,027 | 12.6% |
| Other Than Personal Service | ||||||
| Medical Assistance | $6,780 | $6,599 | $6,728 | $6,878 | $98 | 1.4% |
| Public Assistance | 1,650 | 1,650 | 1,650 | 2,000 | 350 | 21.2% |
| All Other | 40,997 | 36,566 | 35,373 | 35,668 | (5,329) | (13.0%) |
| Subtotal-OTPS | $49,427 | $44,815 | $43,751 | $44,546 | ($4,881) | (9.9%) |
| Debt Service | ||||||
| Principal | $4,139 | $4,129 | $4,150 | $4,333 | $194 | 4.7% |
| Interest & Offsets | 3,601 | 4,110 | 4,857 | 5,365 | $1,764 | 49.0% |
| Subtotal Debt Service | $7,740 | $8,239 | $9,007 | $9,698 | $1,958 | 25.3% |
| FY 2023 BSA and Discretionary Transfers | ($5,479) | $0 | $0 | $0 | $5,479 | (100.0%) |
| Capital Stabilization Reserve | $250 | $250 | $250 | $250 | $0 | 0.0% |
| General Reserve | $1,200 | $1,200 | $1,200 | $1,200 | $0 | 0.0% |
| Less: Intra-City Expenses | (1,990) | (1,980) | (1,983) | (1,980) | $10 | (0.5%) |
| Total Expenditures | $107,115 | $110,866 | $113,201 | $116,708 | $9,593 | 9.0% |
| Gap to be Closed | $0 | ($5,079) | ($6,836) | ($7,900) | ($7,900) | N/A |
SOURCE: Mayor’s Office of Management and Budget
NOTE: Numbers may not add to totals due to rounding.
Table 2. Plan-to-Plan Changes, June 2023 Plan vs. April 2023 Plan
| ($ in millions) | FY 2023 | FY 2024 | FY 2025 | FY 2026 | FY 2027 |
|---|---|---|---|---|---|
| Revenues | |||||
| Taxes: | |||||
| General Property Tax | $50 | $300 | $0 | $0 | $0 |
| Other Taxes | 1,740 | (300) | 0 | 0 | 0 |
| Tax Audit Revenues | 100 | 0 | 0 | 0 | 0 |
| Subtotal: Taxes | $1,890 | $0 | $0 | $0 | $0 |
| Miscellaneous Revenues | 208 | 15 | (6) | (5) | (5) |
| Unrestricted Intergovernmental Aid | 0 | 0 | 0 | 0 | 0 |
| Less: Intra-City Revenues | (46) | 6 | 7 | 6 | 6 |
| Disallowances Against Categorical Grants | 0 | 0 | 0 | 0 | 0 |
| Subtotal: City-Funds | $2,052 | $21 | $1 | $1 | $1 |
| Other Categorical Grants | (207) | 0 | 0 | 1 | 0 |
| Inter-Fund Revenues | (11) | 0 | 0 | 0 | 0 |
| Federal Categorical Grants | 202 | (91) | (244) | 2 | 1 |
| State Categorical Grants | (116) | 496 | 174 | 173 | 173 |
| Total Revenues | $1,920 | $426 | ($69) | $177 | $175 |
| Expenditures | |||||
| Personal Service | |||||
| Salaries and Wages | ($154) | $337 | ($47) | $54 | $67 |
| Pensions | (305) | 8 | 8 | 7 | 7 |
| Fringe Benefits | (102) | 27 | 18 | 34 | 34 |
| Subtotal-PS | ($561) | $372 | ($21) | $95 | $108 |
| Other Than Personal Service | |||||
| Medical Assistance | ($36) | $129 | $214 | $343 | $343 |
| Public Assistance | (7) | 0 | 0 | 0 | 0 |
| All Other | 217 | 2,438 | 641 | 644 | 668 |
| Subtotal-OTPS | $174 | $2,567 | $855 | $987 | $1,011 |
| Debt Service | |||||
| Principal | $0 | ($5) | ($36) | ($37) | ($38) |
| Interest & Offsets | (61) | (70) | 9 | 10 | 11 |
| Subtotal Debt Service | ($61) | ($75) | ($27) | ($27) | ($27) |
| FY 2023 BSA and Discretionary Transfers | $2,444 | ($2,444) | $0 | $0 | $0 |
| Capital Stabilization Reserve | $0 | $0 | $0 | $0 | $0 |
| General Reserve | ($30) | $0 | $0 | $0 | $0 |
| Less: Intra-City Expenses | ($46) | $6 | $7 | $6 | $6 |
| Total Expenditures | $1,920 | $426 | $814 | $1,061 | $1,098 |
| Gap to be Closed | $0 | $0 | ($883) | ($884) | ($923) |
SOURCE: Mayor’s Office of Management and Budget
NOTE: Numbers may not add to totals due to rounding.
Table 3. Plan-to-Plan Changes, June 2023 Plan vs. June 2022 Plan
| ($ in millions) | FY 2023 | FY 2024 | FY 2025 | FY 2026 |
|---|---|---|---|---|
| Revenues | ||||
| Taxes: | ||||
| General Property Tax | $199 | $692 | $220 | $477 |
| Other Taxes | 4,451 | 2,060 | 2,541 | 2,478 |
| Tax Audit Revenues | 579 | 0 | 0 | 0 |
| Subtotal: Taxes | $5,229 | $2,752 | $2,761 | $2,955 |
| Miscellaneous Revenues | 1,148 | 553 | 356 | 274 |
| Unrestricted Intergovernmental Aid | 45 | 0 | 0 | 0 |
| Less: Intra-City Revenues | (433) | (51) | (51) | (54) |
| Disallowances Against Categorical Grants | 0 | 0 | 0 | 0 |
| Subtotal: City-Funds | $5,989 | $3,254 | $3,066 | $3,175 |
| Other Categorical Grants | (127) | 66 | 60 | 59 |
| Inter-Fund Revenues | (41) | (12) | (6) | 1 |
| Federal Categorical Grants | 2,639 | 1,644 | (142) | 80 |
| State Categorical Grants | 1,245 | 1,161 | 580 | 289 |
| Total Revenues | $9,705 | $6,113 | $3,558 | $3,604 |
| Expenditures | ||||
| Personal Service | ||||
| Salaries and Wages | $1,639 | $1,025 | $1,293 | $2,094 |
| Pensions | (305) | 940 | 2,609 | 3,952 |
| Fringe Benefits | (367) | (429) | (547) | (490) |
| Subtotal-PS | $967 | $1,536 | $3,355 | $5,556 |
| Other Than Personal Service | ||||
| Medical Assistance | ($303) | $395 | $214 | $343 |
| Public Assistance | 313 | 0 | 0 | 0 |
| All Other | 5,737 | 5,848 | 1,763 | 982 |
| Subtotal-OTPS | $5,747 | $6,243 | $1,977 | $1,325 |
| Debt Service | ||||
| Principal | $9 | ($82) | $38 | ($5) |
| Interest & Offsets | (279) | (264) | (396) | (362) |
| Subtotal Debt Service | ($270) | ($346) | ($358) | ($367) |
| FY 2023 BSA and Discretionary Transfers | $0 | $0 | $0 | $0 |
| Capital Stabilization Reserve | ($250) | $0 | $0 | $0 |
| General Reserve | ($1,535) | $0 | $0 | $0 |
| Less: Intra-City Expenses | ($433) | ($51) | ($51) | ($54) |
| Total Expenditures | $9,705 | $1,903 | $4,923 | $6,460 |
| Gap to be Closed | $0 | $4,210 | ($1,365) | ($2,856) |
SOURCE: Mayor’s Office of Management and Budget
NOTE: Numbers may not add to totals due to rounding.
Table 4. Risks and Offsets to the Adopted FY 2024 Financial Plan
$ in millions, positive numbers decrease the gap and negative numbers increase the gap
| FY 2024 | FY 2025 | FY 2026 | FY 2027 | |
| City Stated Gap | $0 | ($5,079) | ($6,836) | ($7,900) |
| Tax Revenues | ||||
| Property Tax | $26 | $821 | $985 | $1,752 |
| Personal Income Tax | 730 | 124 | 99 | (245) |
| Business Taxes | (359) | (451) | (188) | (49) |
| Sales Tax | 235 | 151 | 60 | (9) |
| Real Estate Transaction Taxes | (45) | 228 | 188 | 3 |
| All Other | 1 | 40 | 67 | 70 |
| Audit | 179 | 179 | 179 | 179 |
| Subtotal Tax Revenues | $767 | $1,092 | $1,390 | $1,701 |
| Miscellaneous Revenues | $67 | $65 | $49 | $34 |
| Total Revenues | $834 | $1,157 | $1,439 | $1,735 |
| Expenditures | ||||
| PS Accrual Savings | $350 | $0 | $0 | $0 |
| Temporary and Professional Services | (142) | 0 | 0 | 0 |
| Overtime | (683) | (450) | (450) | (450) |
| Collective Bargaining Agreements | (72) | (120) | (170) | (180) |
| Pension | 0 | 49 | 111 | 170 |
| Asylum Seekers Expenses | (750) | (2,940) | (3,650) | (3,650) |
| Education | (399) | (1,053) | (1,722) | (2,423) |
| Public Health Corps | 0 | (13) | (49) | (49) |
| Public Assistance | (225) | (225) | (225) | 0 |
| Rental Assistance | (374) | (637) | (637) | (637) |
| Contributions to MTA | (155) | (162) | (254) | (420) |
| Prevailing Wage for Shelter Security Guards | (55) | (55) | (55) | (55) |
| Foster Care Reimbursement Rate | (118) | (118) | (118) | (118) |
| City Settlements | (175) | 0 | 0 | 0 |
| Total Expenditures | ($2,798) | ($5,723) | ($7,218) | ($7,812) |
| Comptroller’s (Risks)/Offsets | ($1,964) | ($4,566) | ($5,779) | ($6,077) |
| Restated (Gap)/Surplus | ($1,964) | ($9,645) | ($12,615) | ($13,977) |
NOTE: Numbers may not add to totals due to rounding.
SOURCE: Office of the New York City Comptroller
II. The City’s Economic Outlook
The National Economy
Recent data exhibit a U.S. economy that is showing few signs of an imminent recession. Real GDP had slowed to a 2.0 percent growth rate in the first quarter of 2023 and was widely expected to fall further this year. But the Bureau of Economic Analysis (BEA) recently released its preliminary estimate for second quarter GDP, which actually showed a slight acceleration to a 2.4 percent annual rate. Moreover, persistently strong labor market indicators amidst easing inflation have caused many forecasters to revise up their 2023 economic growth outlook.
These indications are consistent with the Comptroller‘s Office’s economic projections, presented in its May 2023 Comments on the City’s Executive Budget, which expect the national economy to grow by 1.7 percent this year. With growth in the first half of the year likely averaging at least 2 percent (barring any major revisions), the outlook implies a moderate slowdown in the second half. The Comptroller’s Office’s projections also show job growth exceeding GDP growth for the remainder of the year, a result of declining average productivity as lower-wage sectors continue to see faster job growth than higher-wage ones. In 2024, however, the Comptroller’s Office expects productivity growth to return to more typical rates.
Beginning in 2024, the Comptroller’s Office expects inflation to return to a more normal pace of 2.4 percent and to continue down to 2.0 percent in 2025. This will allow the Fed to lower interest rates—by approximately one percentage point in each of the next three years, according to this Office’s forecast—thus enabling economic growth to accelerate slightly. Beyond 2024, the Comptroller’s Office expects GDP to return to its long-term growth trend of just over 2.5 percent, in real terms.
In comparison, the Mayor’s Office of Management and Budget (OMB) expects the U.S. economy to grow by only 1.0 percent in 2023, implying a sharper anticipated economic slowdown which is also reflected in its tax revenue projections. OMB also anticipates slower economic growth rates in 2024 through 2027, with GDP growth rising to only 1.7 percent annually within that timeframe.
Labor Markets
Growth in payroll employment has slowed in 2023 but remains strong by historical standards. Labor force participation has largely recovered from its lows during the pandemic but remains almost a full percentage point below the pre-pandemic level. However, demographic trends that were in motion well before the pandemic—mainly the retirement of baby boomers—have driven a gradual, secular decline in U.S. labor force participation which therefore should not be expected to return to pre-2020 rates. Potential labor force growth in the years ahead will depend largely on the extent to which net immigration is high enough to offset underlying demographic trends.
There are indications that labor markets nationally remain somewhat tight. U.S. job openings and quitting ratios have been running below comparable 2022 levels but have remained steady in recent months, at fairly high levels. Similarly, initial jobless claims, which had ticked up in June, have receded to the low levels seen for most of the past two years. Wage growth has been running slightly over 4 percent, on a year-over-year basis, in recent months. Although nominal wage growth is down from around 5 percent growth in 2022, general price inflation has declined much faster, and real (i.e., inflation-adjusted) wages, which fell in 2022, have begun to increase again.
Inflation and Monetary Policy
As of June, price data almost universally point to moderating inflation. Both the Consumer Price Index (CPI) and Core CPI (excluding food and energy) showed the lowest 12-month percent change since 2021. The Producer Price Index (PPI) showed the largest 12-month decline since 2009, and surveys of consumers and businesses have pointed to easing price pressures and lower near-term inflation expectations.
Despite these declines, inflation remains above the Fed’s stated target of 2 percent, and the Fed is likely to keep the target federal funds rate at or near current levels for the remainder of the year. In 2024, the Comptroller’s Office expects the Fed will gradually lower rates as inflation continues to moderate, supply disruptions are fully abated, and the economy settles into a more moderate growth pace.
New York City’s Economy
Labor Markets
Recent data indicate that labor markets have cooled more in New York City than in the U.S. Employment growth in New York City, which was quite robust through much of 2022, tapered off toward year-end and remained fairly subdued through mid-2023. While official data indicate that job growth in the first half of 2023 has averaged just under 4 percent year-over-year, incoming data suggest that this will be revised down to about 2.5 percent (see the Comptroller’s Office’s July Economic Newsletter). Projecting forward the most recent trends, year-over-year job growth is expected to slow to about 1.3 percent in the second half of 2023, thus averaging 1.9 percent for the full year. Job openings and quitting rates as a percent of the labor force have fallen markedly in New York State from their elevated 2022 levels (data are unavailable for New York City alone). Job openings rates remain about one-half of a percentage point above where they stood pre-pandemic, and rates in 2019 were already elevated compared with prior years (see Chart 1). Nevertheless, among New York City residents, as highlighted in our August Economic Newsletter, both labor force participation and the employment-population ratio have been trending up and are at record highs.
Chart 1. Job Opening and Quit Rates
SOURCE: Bureau of Labor Statistics
Widespread layoff announcements in the tech sector this year have begun to appear in employment data for some industries. Employment in two key tech industries,[1] which had expanded by a remarkable 10 percent in 2022, have been running more than 2 percent below their 2022 levels as of mid-year 2023. In the finance sector, employment has continued to grow in commercial banking, albeit at a slowing pace, but securities employment has declined modestly.
Housing
Throughout the U.S., the pandemic has seemingly caused a permanent shift in how and where people work, and a redirection of demand from commercial to residential space. This surge in demand for housing has not been accompanied by a significant increase in housing supply and represents a major driver of escalating housing costs.
This nationwide housing shortage and affordability crisis has been particularly acute in and around New York City. Citywide rents have risen substantially over the past year and are well above pre-pandemic levels. Moreover, while selling prices for condos, co-ops and single-family homes have receded from their 2022 peak levels, they remain high relative to 2019 (see Chart 2). The rise in mortgage rates over the past year has further crimped housing affordability.
Chart 2. NYC Asking Rents and Condo Prices
SOURCE: Streeteasy.com
Commercial Real Estate
While employment in industries that have traditionally relied on office space has already exceeded its pre-pandemic peak, a sustained shift toward remote and hybrid work has reduced demand for office space. As seen in Chart 3, market rents have fallen by 6 percent relative to 2019 while available space has increased by more than 50 percent.
Still, there are reasons for optimism within the sector. While the market for Class B and C space has weakened substantially, the city’s high-end office market has shown more resilience than might have been anticipated. Note, for example, the success of Hudson Yards, as described in the Comptroller’s Office’s Economic Newsletter. Moreover, while asking rents have fallen more than in the 2001 and 2008 recessions, the downturn in the early 1990s remains more severe, with available space nearly doubling and asking rents falling by more than 20 percent.[2] The Comptroller’s Office’s June Spotlight examined hypothetical scenarios for NYC’s office market—ranging from optimistic to “doomsday”—and considered the likely effects of such developments on future NYC property tax revenues.
Chart 3. NYC Office Market – Quarterly Trends
SOURCE: CoStar
While total actual office attendance is down substantially, there is considerable variation over the course of the workweek. Table 5 shows that post-pandemic growth in remote and hybrid office work has had a comparatively smaller reduction on mid-week physical presence, with Tuesday attendance at 60 percent of its pre-pandemic level (and rising), while Friday attendance sits at only 24 percent and is growing more slowly. It remains to be seen whether future demand for office space in New York City will more closely follow needs for peak usage days.
Table 5. Card Entry Swipes as a Percent of Pre-Pandemic Levels, by day of week
| Day of week | Swipes as Percent of Baseline | ||
|---|---|---|---|
| 2021 Q2 | 2022 Q2 | 2023 Q2 | |
| Monday | 17.2% | 34.6% | 42.5% |
| Tuesday | 20.2% | 47.1% | 60.0% |
| Wednesday | 20.4% | 47.3% | 59.4% |
| Thursday | 18.8% | 42.3% | 52.4% |
| Friday | 13.0% | 21.2% | 23.6% |
| Average: All Weekdays | 17.9% | 38.6% | 46.2% |
SOURCE: KASTLE SYSTEMS
Risks to the NYC Economy
It is possible that the U.S. economy has yet to feel the full brunt of the federal funds rate’s sharp rise in 2022 and early 2023. And while the Comptroller’s Office’s forecast maintains that a recession is unlikely, it remains a possibility in an uncertain economy. Long-term interest rates have thus far remained low, in part because market expectations of an impending recession have inverted the yield curve. This situation is unlikely to last long, and long-term rates may soon rise and impact interest-sensitive sectors of the economy, such as housing and high tech.
In its Comments on the City’s Executive Budget the Comptroller’s Office highlighted concerns and risks stemming from the failure of Silicon Valley Bank and ensuing troubles at Signature and First Republic. Since then, the risk of a broader fallout and systemic crisis has diminished substantially. Nevertheless, there is a risk that lending to smaller NYC businesses and real estate purchasers may significantly tighten, as these types of loans often originate with mid-sized banks that have recently come under pressure to improve their balance sheets.
Another risk, highlighted in the Comptroller’s Office’s June Spotlight, pertains to the office market. The Comptroller’s Office currently expects a slow improvement in demand for office space over the next several years. However, if demand for office space remains weak, as more leases turn over—or even weakens further—the ensuing decline in both property values and operating income would be a drag on both the local economy and tax revenues. Because tax levies adjust gradually to changing market conditions, a severely adverse (“doomsday”) scenario as far out as FY 2027 indicates persistently sluggish growth in overall revenues. Moreover, a protracted slump in the office market also has adverse ramifications for a wide range of service businesses in the City’s central business districts.
Finally, the strikes of the SAG (Screen Actors Guild) and the WGA (Writers Guild of America), which had not been settled as of the writing of this report, could potentially be a drag on the local economy if they were to be protracted.
III. The FY 2024 Adopted Budget
Overview of the FY 2024 Adopted Budget
The Adopted Budget for FY 2024 totals $107.12 billion. A little more than half of the total budget ($57.76 billion or 54 percent) is allocated for education, social services, and public safety and judicial services.[3] Other agency spending comprises about 20 percent of the budget ($21.71 billion). Spending on fringe benefits and pensions for City employees and retirees account for another 21 percent of budgeted spending ($22.27 billion). Debt service costs to fund the City’s capital program account for 2.6 percent ($2.76 billion, adjusted for prior year pre-payments). Payments for judgments and claims make up 1.1 percent ($1.16 billion). The Adopted Budget also includes a general reserve of $1.20 billion and a capital stabilization reserve of $250 million, which account for 1.4 percent of the budget. These reserves are typically spent down as the fiscal year progresses. In addition, the City has access to about $6.58 billion in long-term reserves available for budget relief, including $2.0 billion in the Revenue Stabilization Fund (Rainy Day Fund) and $4.58 billion in the Retiree Health Benefits Trust.[4]
Chart 4 shows the allocation of the FY 2024 budget by service areas and centrally budgeted expenditures, such as fringe benefits, debt service, and pension contributions.
Chart 4. FY 2024 Budget by Service Areas and Centrally Budgeted Expenditures
NOTE: *Denotes Centrally Budgeted Expenditures. Spending on Department of Education and City University of New York fringe benefits, which are reflected within each agencies’ respective budgets have been included in the fringe benefits category. Debt service is net of prepayments.
SOURCE: Office of the New York City Comptroller
Approximately 72 percent of the spending in the FY 2024 Adopted Budget is supported by City-funded revenues of $76.94 billion. Tax revenues, which OMB projects to total $71.14 billion, account for the bulk of City-generated revenues, as shown in Chart 5. Real property tax and personal income tax revenue total more than two-thirds of forecasted tax revenues, with property tax totaling $32.71 billion, inclusive of STAR (46 percent of tax revenues), followed by $14.94 billion in personal income tax and the closely related pass-through entity tax or PTET (21 percent of tax revenues).[5] Non-tax City revenues including interest income, charges for services, and revenues from licenses, permits, and franchises are forecast to comprise 5 percent ($5.8 billion) of total FY 2024 revenues (net intracity revenues). (The Comptroller’s Office presents its own estimates of City revenues in the Risks and Offsets section of this report).
Chart 5. Funding Sources, FY 2024 Adopted Budget
($ in millions)
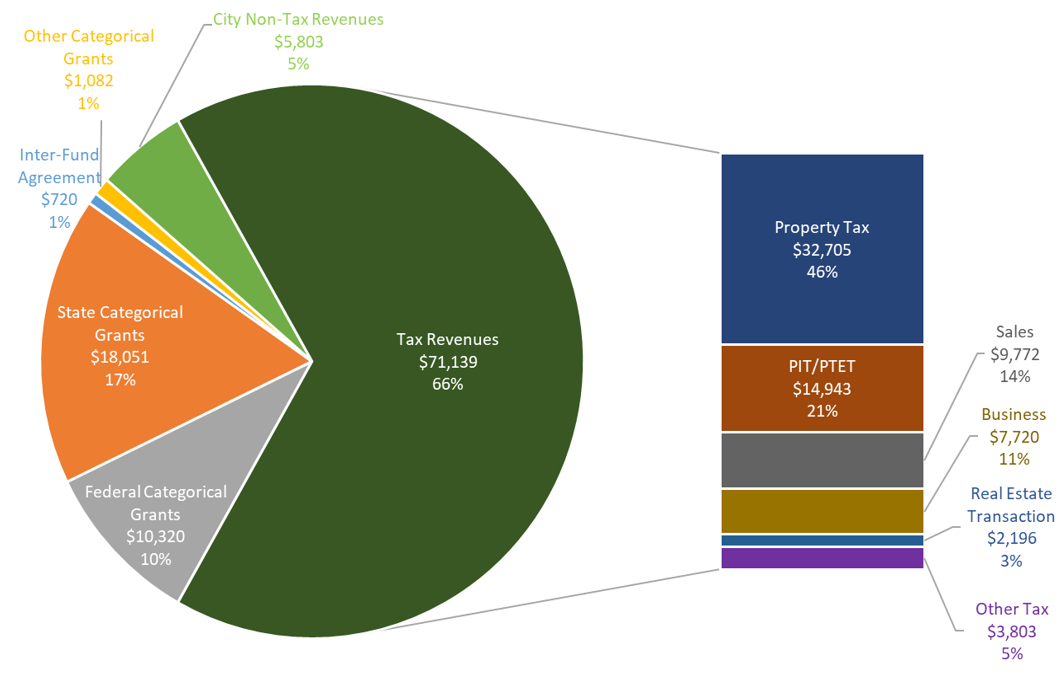
SOURCE: Office of the New York City Comptroller
State categorical grants are forecast to total $18.05 billion in FY 2024 or 17 percent of total FY 2024 projected revenues. Federal grants account for another $10.32 billion or 10 percent of FY 2024 projected revenues. Of the federal revenues planned for FY 2024, $3.02 billion or 29 percent are COVID-19-related funding. Other categorical grants and inter-fund agreement (IFA) revenues comprise the remaining City revenues (about 1 percent each). IFA revenues are reimbursements from the Capital Fund to the General Fund for costs related to the execution of capital projects. Chart 6 shows the funding allocation among the different service areas of the budget.
Chart 6. Funding Allocation by Service Area and Centrally Budgeted Expenditures for FY 2024
SOURCE: Office of the New York City Comptroller
Changes from the FY 2024 Executive Budget
The $107.12 billion FY 2024 Adopted Budget represents an increase of $426 million over the Executive Budget released in April. City-funded revenue estimates remain relatively unchanged compared with the Executive Budget, with an increase of $21 million in non-tax revenues. While the City raised its FY 2024 Property Tax forecast by $300 million compared with its April forecast to reflect the final assessment roll from the Department of Finance, this was offset by a decrease in Personal Income Tax of the same amount. Most of the growth in revenues comes from a $496 million increase in State categorical grants—largely due to a $344 million net increase in formula-based school aid included in the State’s enacted budget. The increase in State and City funding in FY 2024 is offset by a $91 million net decline in federal aid mainly from three major changes, a reduction of $465 million in expected aid for services to people seeking asylum (read more details on these costs), a shift of $246 million in education stimulus funding from FY 2025 into the current year, and recognition of $111 million in additional stimulus funding for the City University of New York (CUNY).
While the City did not significantly revise its FY 2024 City-funds forecast in the Adopted Budget, it did recognize $2.05 billion more in City-funded revenue for FY 2023, the fiscal year that ended on June 30. This includes $1.89 billion in tax revenues, driven by greater-than-budgeted Personal Income Tax receipts, which brings the City’s FY 2023 tax receipts closer in line to the Comptroller’s estimates. (The City’s FY 2024 tax forecast remains below the Comptroller’s estimates, as discussed in the Risks and Offsets section). The City used these higher-than-budgeted revenues—coupled with some savings on FY 2023 expenditures—to increase its prepayment of FY 2024 costs in FY 2023 by $2.44 billion, as shown in Table 6. This action freed more than $2 billion in funds for increased City-funded expenditures in FY 2024 compared with the Executive Budget, despite little change in forecasted City revenues for the year and resulted in balanced budgets for FY 2023 and FY 2024.
Table 6. Changes to FY 2023 and FY 2024 City-Fund Estimates from the Executive Budget
| ($ in millions) | FY 2023 | FY 2024 |
|---|---|---|
| Gap to be Closed – Executive Plan | $0 | $0 |
| Revenues | ||
| Tax Revenues | $1,891 | $0 |
| Non-Tax Revenues | 161 | 21 |
| Total Revenue Changes | $2,052 | $21 |
| Expenditures | ||
| Agency Expenditures | $27 | $1,083 |
| (Savings from PEG)/PEG Restorations | (72) | 30 |
| Council Initiatives | 0 | 528 |
| Asylum Seekers | 50 | 0 |
| Asylum Seekers-Federal Shortfall | 0 | 465 |
| State Budget Impacts | 0 | 435 |
| Pensions | (305) | 0 |
| Debt Service | (62) | (75) |
| General Reserve | (30) | 0 |
| Total Expenditure Changes | ($392) | $2,465 |
| Gap To Be Closed Before Prepayments | $2,444 | ($2,444) |
| FY 2023 Prepayment of FY 2024 Debt Service | ($1,944) | $1,944 |
| FY 2023 Prepayment of FY 2024 Retiree Health Benefits | ($500) | $500 |
| FY 2023 Total Prepayments | ($2,444) | $2,444 |
| Gap to be Closed – Adopted Plan | $0 | $0 |
SOURCE: Mayor’s Office of Management and Budget, Office of the New York City Comptroller
NOTE: The reduction of $305 million in pension costs in FY 2023 includes funds previously held in reserve for potential costs associated with the actuarial audit. Final FY 2023 pension contributions remained about the same at $9.0 billion, a net increase of $7 million compared to preliminary estimate. This was offset by a net decrease of $7 million for non-City systems. Therefore, $305 million held in reserve was not needed.
City-Funded Expenditures
City-funded expenditures in FY 2024 increased by $2.47 billion to $76.94 billion compared with the Executive Budget, largely funded by the prepayment of FY 2024 expenses in FY 2023. The increase in City-funded spending includes $1.08 billion in agency expenditure changes, $528 million in City Council Initiatives, and $30.1 million in restored cuts made in prior Programs to Eliminate the Gap (PEGs). The Adopted Budget also includes the addition of $900 million in City funds to compensate for federal and State actions that either reduced expected aid or increased City costs. This comprises $465 million in City funds to replace previously expected federal aid to fund services to people seeking asylum and $434.8 million in City-funds to cover negative cost-impacts from the State’s enacted budget. City-fund increases for FY 2024 are offset by $74.8 million in debt services savings included in the Adopted Budget.
Agency Expenditures
Of the $1.08 billion in City funds added for agency expenditures in FY 2024, half is split between two agencies, the Department of Social Services ($310 million) and the Department of Education ($234 million).[6] The largest increase to the Department of Social Services (DSS) budget is $262 million in additional funding for the City’s Family Homelessness and Eviction Prevention Supplement program (CityFHEPS). The CityFHEPS program provides rental assistance to households at risk of eviction and, predominantly, to those in City shelters. The addition brings the DSS budget for rental assistance programs up to $420 million for FY 2024—an increase from the $157 million included in the Executive Budget.[7] However, planned funding for FY 2024 remains below the $574 million allocated for rental assistance programs in FY 2023, including $38 million added in the Adopted Budget. No funds were added in FY 2025 through FY 2027, which are budgeted for only $157 million.[8]
The budgeted increase for rental assistance in FY 2024 includes $123 million resulting from the recent elimination of a rule that households must be in shelter for 90 days before becoming eligible for CityFHEPS vouchers. In May, the City Council passed a package of legislation expanding CityFHEPS eligibility, including the elimination of the 90-day shelter rule, broadening the definition of who is deemed at risk of eviction, raising the income limit for the program, and removing work requirements.[9] The Mayor vetoed the legislation, but before vetoing it, issued a rule change waiving the 90-day shelter requirement. Last month, the City Council voted to override the Mayor’s veto. While OMB included additional funds due to the 90-day rule change, cost impacts from the other changes were not included. For more details on the City’s rental assistance costs and these changes, see the Risks and Offsets section of this report.
Other increases to the City’s social service programs include:
- The addition of $20 million in baseline funding through FY 2027 for the City’s Right to Counsel program, which provides free legal services to low-income households at risk of eviction.
- An increase of $20 million in baseline funding through FY 2027 to expand the Fair Fares Program, which provides discounted transit fares to low-income New Yorkers, to households making 120 percent of the federal poverty level (FPL), up from 100 percent of the FPL.
- $16 million added to the budget of the Administration of Children’s Services for PromiseNYC, a program that provides childcare assistance to undocumented families. (Funds were added for FY 2024 only).
The largest increase in City-funding to the DOE budget is $150 million for special education Carter Cases—a cost that has been rising quickly in recent years. (These funds were added in FY 2024 only, again see the Risks and Offsets section for more details of the Comptroller’s Office’s estimate of this cost.) The City also added $20 million to help hold school budgets harmless for enrollment declines over the 2023-2024 school year, $19.6 million to hire 58 school nurses for medically frail children and to increase the number of contracted float pool nurses, and $15 million to convert vacant early childhood education seats into extended day seats (with the latter two additions baselined through FY 2027), among other increases.
Spanning multiple agencies, the Adopted Budget adds $38.6 million in FY 2024 (rising to $88.6 million in FY 2025 and subsequent years) for increases in personnel-related costs (such as wage increases, cost-of-living adjustments, or additional benefits) for the City’s non-profit contractors. These increases were funded by additional City-funds rather than as a draw-down from the City’s labor reserve, which the City uses to cover the contractual wage increases for municipal employees and has been used previously to fund wage increases for non-profit City contractors. These “workforce enhancements” are in addition to $60 million baselined for the same purpose in the City’s Adopted Budget last June.
PEGs & PEG Restorations
Cumulative savings from actions made in the Mayor’s Programs to Eliminate the Gap (PEGs) introduced in the City’s financial plans since last November totaled $3.0 billion for FY 2024 by the Executive Budget. The Adopted Budget restores a handful of cuts made as part of the programs, for a total of $30.1 million in PEG restorations. All restorations were for FY 2024 only. These include:
- Libraries: The Adopted Budget fully restores the $20.5 million reduction for the operating subsides at the City’s three library systems and the New York Research Library, included in the Preliminary Budget. In addition to this funding, the City Council added $15.7 million of its discretionary funding to support subsides for the library systems, bringing the total increase to library subsidies up to $36.2 million (more details in Council Initiative section below).
- CUNY: The Adopted Budget restores $5.9 million of the $41.3 million PEG for the City University of New York.
- Older Adult Meals: PEG cuts to older adult center meals totaled $7 million in FY 2024. The Adopted Budget restores $2.5 million of this funding.
- Civilian Complaint Review Board: $1.1 million was added to restore nearly the entire $1.2 million cut to the Civilian Complaint Review Board – an independent agency that investigates allegations of misconduct by the City’s police force. This restores 22 vacant positions previously slotted to be eliminated and $200,000 in OTPS items.
The Adopted Budget does include some PEG savings for FY 2024 (a total of $74.8 million) that are all related to reductions of the City’s debt service costs. New PEG savings ($133.6 million) were also included for FY 2023: about half were for debt service costs ($61.7 million) with the remainder split between less-than-anticipated personnel spending ($38.6 million) and less-than-anticipated other-than-personnel service costs ($33.4 million).
State Budget Impacts
The New York State Budget was passed about one week after the City’s Executive Budget was released. Thus, apart from $1 billion in increased State aid to help cover the cost of shelter stays of people seeking asylum over FY 2023 and FY 2024, State budget impacts were not included in the Executive Budget. The FY 2024 Adopted Budget reflects these actions. As previously mentioned, this includes an increase in formula-based school aid, totaling $343 million in FY 2024. In addition to this positive impact, however, the Adopted Budget reflects $434.8 million in increased City spending in FY 2024 to fund costs imposed by the State’s enacted budget. These include:
- MTA Contribution: $227 million for increased contributions to the MTA through higher paratransit subsidies ($165 million) and increases in the Metropolitan Commuter Transportation Mobility payroll tax rates ($62 million), which the City pays as an employer.
- Intercept of the City’s Federal ACA eFMAP: $129 million to replace savings previously provided through the Affordable Care Act (ACA) Enhanced Federal Medical Assistance Percentage (eFMAP). These are savings provided by the federal government to the State based on proportionate shares paid into Medicaid and have historically been passed on to localities. The State is capturing 25 percent of the savings in SFY 2024, 50 percent in SFY 2025, and the entirety thereafter.
- Court Appointed Counsel: $48 million for increased rates of reimbursement for court-appointed counsel (from $78 to $158 per hour). The State budget also provided $36 million to help pay for these increased costs.
- Social Services Block Grant: $8 million resulting from the State directing federal funding from the Social Services Block Grant towards expenses for child welfare services to help the State pay for protective and preventive services for children and families.
- State-Mandated Minimum Wage: $15 million to fund increases from $15 to $17, which are being phased in from January 2024 to January 2026. The State budget impact is limited to municipal employees not covered by the City’s collective bargaining agreements, for example participants in the City’s Summer Youth Employment Program as the City’s collective bargaining pattern includes a raise that surpasses the State’s provisions.
- Pension Adjustments: $7.3 million to fund increased pension costs due to bills enacted in the State Budget.[10]
- Charter Schools: Although no additional funding is added for FY 2024, the June Plan includes funding to reauthorize 14 charter schools that had either ceased operation or never opened in FY 2025 through FY 2027 as costs are phased in, growing from $24 million in new City funding in FY 2025 to $92 million in FY 2027.
The State capture of COVID-19-related federal eFMAP savings is not included in the Adopted Budget but will impact City coffers. These savings were made available to the City (and other localities across the state) under the Families First Coronavirus Response Act. The State’s enacted budget intercepts these as well as the ACA eFMAP funds from the City. Because the City’s budget historically has not recognized these savings, the capture has no budgetary impact but erases potential offsets previously estimated at $333 million over FYs 2023 and 2024. State budget documents indicate an intercept of $323.7 million over State fiscal years 2023 and 2024 but the State has not yet provided details on the timing and computation of the retained savings.
City Council Initiatives
About $528 million was added to the FY 2024 budget for City Council initiatives. The Council supports non-profits to meet a variety of local needs through this discretionary funding. Of the $528 million, nearly $152 million flows to non-profits through the Department of Youth and Community Development’s budget, followed by $60.2 million through the Department of Health and Mental Hygiene, about $45 million each to DSS and the Department of Cultural Affairs, and about $40 million each through the Department of Aging and the DOE, with the remainder split among other agencies. Notably, the City Council provided $15.7 million in subsidy support to the City’s library systems. This funds part of a larger $36.2 million increase in funding to the City libraries compared with earlier Financial Plans this year.
Transfers from Labor Reserve and Collective Bargaining
The FY 2024 Adopted Budget and June Financial Plan also reflects the transfer of City funds out of the labor reserve and into agency budgets to cover the cost of recent labor agreements, specifically the City’s agreement with the Police Benevolent Association (PBA), as well as some other costs. In total, $2.65 billion were transferred from FY 2023 through FY 2027, nearly all of which was moved to the New York Police Department budget. While this increases agency expenditures, because it is a transfer out the City’s labor reserve it does not require new City funding.
Since January, the City has reached contract agreements with unions representing nearly 80 percent of municipal employees for the current round of collective bargaining (2021-2026). Major unions, such as District Council 37 (DC 37) and PBA have ratified contract agreements. The United Federation of Teachers (UFT) voted to ratify its contract shortly after the Adopted Budget was released, except for the chapter that includes occupational and physical therapist, school nurses, audiologists, and supervisors, which rejected contract. Teamsters Local 237, which represents school safety agents, public hospital security guards, among others also voted to ratify their contract in early August after the Adopted Budget was released. (Because these unions voted to ratify after the Adopted Budget was released, funds have not yet been moved from the labor reserve to agency budgets). The Uniformed Officers Coalition (UOC) agreement is still subject to ratification by the 11 unions represented under this agreement.
On August 7, again after the Adopted Budget was released, the New York State Nurses Association approved a new contract for nurses employed by New York City Health + Hospitals (H+H). The contract includes salary increases to bring the pay of the city’s public sector nurse to parity with the private sector, with a $16,006 increase in the first year (effective immediately) and an additional $5,551 in the second year. In years three and four, nurses will receive 3 percent raises, and a 3.25 percent increase in year five. It also includes lower staffing ratios and staff float pool. Historically, the City has funded the labor agreement costs for H+H. Given the pay parity adjustments, the cost of the agreement is in excess of the pattern established by DC 37 for civilian employees and therefore additional funds will be necessary. See the Risks and Offsets section for more details.
So far, $5.8 billion has been transferred to agency budgets to provide for agreed-to wage increases for DC 37 and PBA under the current round of bargaining. The remaining fiscal year balances in the labor reserve are approximately $2.51 billion in FY 2024, $3.72 billion in FY 2025, $4.83 billion in FY 2026, and $5.96 billion in FY 2027.
Changes to the City’s Total Full-Time Headcount
The Adopted Budget projects City total full-time headcount for FY 2024 at 302,402 positions, declining slightly over each of the four succeeding fiscal years to 298,435 in FY 2027. Compared with the Executive FY 2024 Budget, projected headcount increased slightly by 416 in FY 2024, and by 389 in each of FYs 2025-2027. Headcount added in the Adopted Budget include 110 new positions for the Department of Sanitation for highway cleaning; 57 for the Department of Parks and Recreation, mainly for lifeguards and aquatic specialists to expand the City’s Learn to Swim programs, which provide lessons at the City’s public pools and training programs for new lifeguards; 58 for the DOE’s new school nurse positions, and 55 for the District Attorneys of Manhattan, Bronx, Brooklyn, Queens, and Staten Island. Appendix A3 includes a list of budgeted headcount by agency.
The number of municipal employees has declined since the onset of the COVID-19, leading to a high number of vacant positions. Since April, however, there has been a slight uptick in the number of full-time employees. Preliminary data[11] indicate as of June 30 there were 281,917 full-time employees, a net increase of 1,415 employees (0.5 percent) in May and June. The greatest growth has been at DSS, adding a net 406 jobs (or a 4 percent increase) in May and June, with the majority added in the budget codes that fund the City’s public assistance field offices. Other notable increases since April include at the Department of Environmental Protection (net increase of 142 employees or 3 percent growth) and Administration for Children’s Services (104 or 2 percent).
Despite the uptick in filled positions, the vacancy rate remains high by historical standards at 7.15 percent as of June’s preliminary data. As Chart 7 demonstrates, during FY 2023 the City eliminated close to 3,000 vacant positions compared with the number that were budgeted for FY 2023 in June 2022. In the chart, the blue line over each fiscal year represents headcount when that fiscal year’s budget was adopted (Adopted Plan-Beginning) compared with the red line representing the budgeted headcount for the fiscal year as of the next year’s adopted budget (and the end of that fiscal year). As the Comptroller’s Office documented in its report Title Vacant, the high number of municipal vacancies has resulted in a lack of capacity to provide core City services, from creating new housing, to providing services to low-income children, to collecting City revenues.
Chart 7. Full-Time Headcount, Budget vs. Actual, FY 2017—FY 2024
SOURCE: Office of the New York City Comptroller, Mayor’s Office of Management and Budget
NOTE: The blue line over each fiscal year represents headcount when each fiscal year’s budget was adopted (Adopted Plan-Beginning). The red line represents the budgeted headcount for the fiscal year at the end of the year, when the next year’s budget is adopted. Data on actual full-time employment is preliminary for May and June, they are derived from initial payroll results for the month of June and have not yet published by OMB.
Capital Budget Changes
The Adopted Budget includes $1.20 billion in additions to the City’s Capital Budget for FY 2024 since the Executive Budget. Four agencies—Parks, DOE, Cultural Affairs, and H+H—comprised 70 percent, or $839 million of the additions. Of the $1.20 billion added at Adoption, the Council additions total $840 million (70 percent) including $40 million for housing-related projects. Over $4 billion for housing-related capital projects is available in FY 2024. Housing-related capital funds for the outyears are budgeted at just over $2 billion a year. The City’s Adopted Capital Commitment Plan, which allocates funding included in the Capital Budget, is typically not released until the fall.
FY 2024 Budget Compared with FY 2023 Modified Budget
As shown in Table 7 the FY 2024 Adopted Budget is $3.71 billion less than the final modified for FY 2023 budget, a drop of 3.4 percent. The decline primarily due to two factors—lower forecast tax revenues and less federal categorical aid compared with FY 2023. The $1.06 billion drop in federal aid largely stems from less COVID assistance from the various federal relief packages, including reimbursements from the Federal Emergency Management Agency (FEMA). Overall, federal COVID-19 related relief is expected to fall by about $700 million in FY 2024.
OMB forecasts that tax revenues will fall by $1.84 billion in FY 2024 compared with FY 2023, a 2.5 percent decline. This is largely due to lower forecast receipts for the PIT/PTET, which OMB forecast will decline by $2.26 billion (13.1 percent). FY 2023 PIT/PTET collections came in higher than previously forecast by both OMB and, to a lesser extent, the Comptroller. (The Comptroller’s Office also forecasts PIT/PTET revenue will fall in FY 2024, although it projects a smaller decline of $1.46 billion or 8.5 percent. See the Risks and Offsets section for more details). Income taxes in New York City are highly sensitive to the fluctuations in aggregate incomes of high earners and investors, as well as the profits of financial and other corporations. The drop in forecast PIT/PTET revenue is offset somewhat by a $1.09 billion increase in property tax revenue for FY 2024 compared to FY 2023 (an increase of 3.4 percent) as assessments continue to recover. The Comptroller’s Office projects a similar increase in property tax revenues in FY 2024 (again, see Risks and Offsets section).
Table 7. Comparison Final Modified FY 2023 and Adopted FY 2024
| ($ in millions) | FY 2023 | FY 2024 | $ Change | % Change |
|---|---|---|---|---|
| Revenues | ||||
| Taxes: | ||||
| General Property Tax | $31,620 | $32,705 | $1,085 | 3.4% |
| Other Taxes | 40,058 | 37,713 | (2,345) | (5.9%) |
| Tax Audit Revenues | 1,300 | 721 | (579) | (44.5%) |
| Subtotal: Taxes | $72,978 | $71,139 | ($1,839) | (2.5%) |
| Miscellaneous Revenues | 8,459 | 7,808 | (651) | (7.7%) |
| Unrestricted Intergovernmental Aid | 297 | 0 | (297) | (100.0%) |
| Less: Intra-City Revenues | (2,407) | (1,990) | 417 | (17.3%) |
| Disallowances Against Categorical Grants | (15) | (15) | 0 | 0.0% |
| Subtotal: City-Funds | $79,312 | $76,942 | ($2,370) | (3.0%) |
| Other Categorical Grants | 902 | 1,082 | 180 | 20.0% |
| Inter-Fund Revenues | 695 | 720 | 25 | 3.6% |
| Federal Categorical Grants | 11,923 | 10,320 | (1,603) | (13.4%) |
| State Categorical Grants | 17,997 | 18,051 | 54 | 0.3% |
| Total Revenues | $110,829 | $107,115 | ($3,714) | (3.4%) |
| Expenditures | ||||
| Personal Service: | ||||
| Salaries and Wages | $33,307 | $32,998 | ($309) | (0.9%) |
| Pensions | 9,109 | 9,642 | 533 | 5.9% |
| Fringe Benefits | 12,273 | 13,327 | 1,054 | 8.6% |
| Subtotal-PS | $54,689 | $55,967 | $1,278 | 2.3% |
| Other Than Personal Service: | ||||
| Medical Assistance | $6,261 | $6,780 | $519 | 8.3% |
| Public Assistance | 1,963 | 1,650 | (313) | (15.9%) |
| All Other | 43,455 | 40,997 | (2,458) | (5.7%) |
| Subtotal-OTPS | $51,679 | $49,427 | ($2,252) | (4.4%) |
| Debt Service: | ||||
| Principal | $4,003 | $4,139 | $136 | 3.4% |
| Interest & Offsets | 3,480 | 3,601 | 121 | 3.5% |
| Subtotal Debt Service | $7,483 | $7,740 | $257 | 3.4% |
| FY 2022 BSA and Discretionary Transfers | ($6,114) | $0 | $6,114 | (100.0%) |
| FY 2023 BSA and Discretionary Transfers | $5,479 | ($5,479) | ($10,958) | (200.0%) |
| Capital Stabilization Reserve | $0 | $250 | $250 | N/A |
| General Reserve | $20 | $1,200 | $1,180 | 5900.0% |
| Less: Intra-City Expenses | ($2,407) | (1,990) | $417 | (17.3%) |
| Total Expenditures | $110,829 | $107,115 | ($3,714) | (3.4%) |
SOURCE: Office of the New York City Comptroller
NOTE: Totals may not add due to rounding.
Expenditures presented in the FY 2024 Adopted Budget are reduced by FY 2023 prepayments. Similarly, the FY 2023 final modified budget is increased by the net impact of FY 2022 and FY 2023 prepayments. As shown in Table 8, after netting out the impact of prepayments, expenditures before reserves and prior-year adjustments total $111.14 billion for FY 2024 a decrease of $300 million or 0.3 percent compared with the adjusted FY 2023 total. Including funds held in the city’s budgeted reserves, which are typically allocated throughout the fiscal year, the FY 2024 budgeted adjusted for prepayments is $1.13 billion greater than FY 2023.
Compared with FY 2023 there is a $1.89 billion budgeted reduction in OTPS spending, offset by a $1.34 billion increase in PS spending and a $257 million increase in debt service costs in FY 2024. Most of the decline in OTPS costs comes from lower budgeted spending for contractual services in FY 2024 than FY 2023. About $309 million of the decline in contractual service spending is the result of lower COVID-19 budgeted expenditures. The remainder is split among several agencies, include the Department of Education, Administration for Children’s Services, and the City’s Miscellaneous budget. As outlined in the Risks and Offsets section of this report, the Comptroller’s Office estimates that many of the contractual costs causing this decrease in the year-over-year comparison are underbudgeted and actual FY 2024 costs will be greater than currently planned. On the PS side, most of the $1.34 billion in increased costs in FY 2024 compared with FY 2023 comes from increased health insurance costs. This is due to projected premium rate increases in FY 2024 of 6.4 percent for active employees and pre-Medicare retirees and 4.8 percent for the senior care rate.
Budgeted reserves, including general reserve and capital stabilization reserve, are $1.43 billion higher in FY 2024 compared with FY 2023, as of the June Plan. This is because FY 2023 reserves have been allocated to other areas of the budget during the fiscal year.
Table 8. FY 2024 Expenditures vs. FY 2023 Expenditures, Adjusted for Prepayments
| ($ in millions) | FY 2023 | FY 2024 | $ Change | % Change |
|---|---|---|---|---|
| Personal Service | ||||
| Salaries and Wages | $32,910 | $32,645 | ($265) | (0.8%) |
| Pensions | 8,996 | 9,529 | 533 | 5.9% |
| Health Insurance | 7,583 | 8,537 | 954 | 12.6% |
| Other Fringe Benefits | 4,593 | 4,708 | 114 | 2.5% |
| Subtotal-PS | $54,083 | $55,419 | $1,336 | 2.5% |
| Other Than Personal Service | ||||
| Medicaid | $6,261 | $6,780 | $519 | 8.3% |
| Public Assistance | 1,963 | 1,650 | (313) | (16.0%) |
| Judgments and Claims | 1,199 | 1,165 | (35) | (2.9%) |
| Contractual Services | 24,667 | 22,615 | (2,052) | (8.3%) |
| Other OTPS | 15,788 | 15,774 | (14) | (0.1%) |
| Subtotal-OTPS | $49,879 | $47,984 | (1,894) | (3.8%) |
| Debt Service | $7,482 | $7,740 | $258 | 3.5% |
| Expenditures Excluding Reserves Only | $111,444 | $111,144 | ($300) | (0.3%) |
| Prior Year Adjustment | ($635) | ($5,479) | ($4,844) | |
| General Reserve | $20 | $1,200 | $1,180 | |
| Capital Stabilization Reserve | $0 | $250 | $250 | |
| Total Expenditures | $110,829 | $107,115 | (3,714) | (3.4%) |
NOTE: Excludes contractual services for debt service and Medicaid.
SOURCE: Office of the New York City Comptroller, Mayor’s Office of Management and Budget
The Outyears
While the FY 2024 budget is balanced, the June 2023 Financial Plan projects budget gaps of $5.08 billion in FY 2025, $6.84 billion in FY 2026, and $7.90 billion in FY 2027, as shown in Chart 8. Projected gaps for all years have increased since the April 2023 Plan: by $883 million for FY 2025, $884 million in FY 2026, and $923 million in FY 2027.
Chart 8. June 2023 Financial Plan Revenues, Expenditures, and Budget Gap

SOURCE: Mayor’s Office of Management and Budget
The Adopted Budget projects that revenues will grow by 1.6 percent from $107.12 billion in FY 2024 to $108.81 billion in FY 2027, while expenditures are projected to grow by 9.0 percent to $116.71 billion. As previously discussed, FY 2024 expenditures are reduced by FY 2023 prepayment of FY 2024 expenses. After adjusting for prepayments, growth in expenditures before reserves is lower at 3.7 percent over the four-year plan period, although it still outpaces revenue growth. As show in Table 9, most of the growth in spending over the Plan period comes from PS-related costs, including salaries and wage, pension, and health insurance costs.
Table 9. FY 2024- FY 2027 Expenditure Growth, Adjusted for Prepayments and Reserves
| ($ in millions) | FY 2024 | FY 2025 | FY 2026 | FY 2027 | Growth FYs 24-27 | Annual Growth |
|---|---|---|---|---|---|---|
| Personal Service | ||||||
| Salaries and Wages | $32,645 | $33,384 | $34,778 | $35,998 | 10.3% | 3.3% |
| Pensions | 9,529 | 10,310 | 10,773 | 10,955 | 15.0% | 4.8% |
| Health Insurance | 8,537 | 9,230 | 9,841 | 10,296 | 20.6% | 6.4% |
| Other Fringe Benefits | 4,708 | 4,857 | 5,019 | 5,181 | 10.0% | 3.2% |
| Subtotal-PS | $55,419 | $57,782 | $60,411 | $62,429 | 12.6% | 4.1% |
| Other Than Personal Service | ||||||
| Medicaid | $6,780 | $6,599 | $6,728 | $6,878 | 1.4% | 0.5% |
| Public Assistance | 1,650 | 1,650 | 1,650 | 2,000 | 21.2% | 6.6% |
| Judgments and Claims | 1,165 | 877 | 823 | 840 | (27.9%) | (10.3%) |
| Contractual Services | 22,615 | 20,182 | 19,343 | 19,356 | (14.4%) | (5.1%) |
| Other OTPS | 15,774 | 14,087 | 13,789 | 14,057 | (10.9%) | (3.8%) |
| Subtotal-OTPS | $47,984 | $43,395 | $42,333 | $43,131 | (10.1%) | (3.5%) |
| Debt Service | $7,740 | $8,239 | $9,007 | $9,698 | 25.3% | 7.8% |
| Expenditures Excluding Reserves Only | $111,144 | $109,416 | $111,751 | $115,258 | 3.7% | 1.2% |
| Prior Year Adjustment | (5,479) | |||||
| General Reserve | 1,200 | 1,200 | 1,200 | 1,200 | ||
| Capital Stabilization Reserve | 250 | 250 | 250 | 250 | ||
| Total Expenditures | $107,115 | $110,866 | $113,201 | $116,708 |
SOURCE: Office of the New York City Comptroller, Mayor’s Office of Management and Budget
NOTE: Intra-City adjustments are reflected in each of their respective expense categories.
As shown in Table 10, total tax revenues are projected to grow by 8.1 percent over the four years of the plan period, with an annual growth rate of 2.6 percent. Overall revenue growth is reduced by a 31.9 percent decline in federal categorical grants, due in large part to the expiration of federal COVID-19 aid.
Table 10. FY 2024- FY 2027 Revenue Growth
| (in millions) | FY 2024 | FY 2025 | FY 2026 | FY 2027 | Growth FYs 24-27 | Annual Growth |
|---|---|---|---|---|---|---|
| General Property Tax | $32,705 | $32,366 | $32,633 | $33,238 | 1.6% | 0.5% |
| Non-Property Tax | 38,434 | 40,468 | 41,839 | 43,683 | 13.7% | 4.4% |
| Subtotal Tax Revenues | $71,139 | $72,834 | $74,472 | $76,921 | 8.1% | 2.6% |
| Non-Tax Revenues | 5,803 | 5,623 | 5,559 | 5,518 | (4.9%) | (1.7%) |
| Subtotal City-Funds | $76,942 | $78,457 | $80,031 | $82,439 | 7.1% | 2.3% |
| Federal Categorical Grants | 10,320 | 7,816 | 7,054 | 7,027 | (31.9%) | (12.0%) |
| State Categorical Grants | 18,051 | 17,714 | 17,477 | 17,540 | (2.8%) | (1.0%) |
| Other Categorical Grants | 1,082 | 1,075 | 1,071 | 1,070 | (1.1%) | (0.4%) |
| IFA Revenues | 720 | 725 | 732 | 732 | 1.7% | 0.6% |
| Subtotal Non-City-Funds | $30,173 | $27,330 | $26,334 | $26,369 | (12.6%) | (4.4%) |
| Total | $107,115 | $105,787 | $106,365 | $108,808 | 1.6% | 0.5% |
SOURCE: Office of the New York City Comptroller, Mayor’s Office of Management and Budget
Update on Services to People Seeking Asylum
More than 95,600 people seeking asylum have arrived in New York City since April 2022, with 56,600 people in the City’s care as of July 30, 2023. This includes individuals and families in Department of Homeless Services (DHS) operated shelters (mainly hotels), Humanitarian Emergency Response and Relief Centers (HERRCs), which are largely managed by H+H, emergency respite centers and more.
Chart 9. Individuals in City Shelters –DHS System Plus People Seeking Asylum
SOURCE: New York City Mayor’s Office.
The FY 2024 Adopted Budget and June Financial Plan made several changes to the City’s budget for services to this population, although it did not substantially increase planned costs. For FY 2023, $50 million was added for a total of $1.45 billion due to greater growth in the census than expected at the time of the Executive Budget. And while the Adopted Budget does not reflect a significant increase in total costs planned for FY 2024, the share of costs to be paid by the City has grown since the Executive Budget. Awards of federal aid have come in well-below City projections, requiring the City to swap $465 million in previously budgeted federal aid with City funds in the Adopted Budget for FY 2024. Of the $2.91 billion budgeted for the cost of services to people seeking asylum in FY 2024, City funding now totals $2.21 billion, with $562 million expected from the State, and only $135 million expected from the federal government. In addition to the swap, the Adopted Budget also reflects the addition of $4.6 million in City funds to the Department of Investigations’ budget for an integrity monitor to oversee contractor compliance in FY 2024 and $2.3 million added for this purpose in FY 2025.
Table 11. Funding for Services to People Seeking Asylum, June 2023 Plan
| ($ in millions) | FY 2023 | FY 2024 | FY 2025 | Total |
|---|---|---|---|---|
| City | $1,016 | $2,208 | $713 | $3,937 |
| State | 438 | 562 | 290 | 1,290 |
| Federal | 0 | 135 | 0 | 135 |
| Total | $1,454 | $2,905 | $1,003 | $5,362 |
SOURCE: Mayor’s Office of Management and Budget
In its comments on the FY 2024 Executive Budget, the Comptroller’s Office projected that total FY 2024 spending could be $750 million more than what was budgeted by the City, for a total of $3.65 billion, due to two factors: greater growth in the number of people seeking asylum in City shelters and higher estimates of daily shelter costs. (The Comptroller’s Office also projected that federal aid would come in lower, which is now reflected in the City budget). For more details on this projection see the Comptroller’s Comments on the Executive Budget.
As of July 30th, there were approximately 25,000 households in the City’s shelter system. This exceeds both OMB’s and the Comptroller’s Office’s earlier projections. In its estimate, the Comptroller’s Office used daily household growth in FY 2023 (July through April) and developed three scenarios: low-growth, using the 25th percentile of daily household growth (38 households per day); medium-growth, using the 50th percentile (51 households per day); and high growth, using the 75th percentile (64 households per day). The Office used the medium-growth projection as the basis for its financial risk. OMB assumed growth of 40 households per day. Compared with these projections, the actual number of households in shelter to date is higher than the high-growth scenario: the daily household increase has averaged 105 from May 1 to July 30. Chart 10 shows July 1, 2022 through July 30, 2023 actuals.
The average per diem cost of providing services also appears to be coming in on the higher side of the Comptroller’s estimates. OMB estimated that per diem costs would average $320 for FY 2024. The most recent cost data through May shows that the average per diem for the fiscal year remains around $385—what it averaged through March and the amount that the Comptroller’s Office used in its high-cost scenario for FY 2024 forward.
Notably, if the current population of people seeking asylum in the City’s care were to remain constant, factoring in the higher per diem rate, costs for FY 2024 would total approximately $3.6 billion, a figure similar to the $3.65 billion this Office projected in its comments on the FY 2024 Executive Budget. If growth continues, which is more likely, costs will be higher, exceeding the Comptroller’s Office’s highest projection of $4.43 billion.
On August 9, OMB announced that costs would likely surpass what it had included in the Adopted Budget (as well as the Comptroller’s Office’s estimates). Assuming growth will continue, but slow to an average of 55 households per day, and that daily costs would remain around current levels, OMB projected an updated FY 2024 total cost of $4.7 billion, an increase of $1.8 billion over the Adopted Budget amount. OMB projected an FY 2025 cost of $6.1 billion, an increase of $5.1 billion, which assumes the population in the City’s care will then stabilize at the FY 2024 year-end level. Taken together with the $1.45 billion spent in FY 2023, the total for the three fiscal years is $12 billion.
The Comptroller’s Office is not yet revising its risk for FY 2024 through FY 2025, however, since the recent growth in the population is measured over a relatively short period of time. Additionally, it is unclear how the Mayor’s prior announcement, that single adults who have been in shelter for more than 60 days will have to leave shelter and reapply, will impact the census. The Comptroller’s Office is also maintaining its risk into the outyears in light of the continued growth and uncertainty. Several contracts continue into Fiscal Years 2026 and 2027, including a large contract for hotels, though OMB has not budgeted any funds yet for those years. (See the latest contract tracker here).
Chart 10. Households Seeking Asylum, Shelter Census Actual vs. Projected
SOURCE: Office of the New York City Comptroller; Office of Management and Budget
NOTE: Shelter census includes all households seeking asylum in the City’s care including those in DHS-operated shelters, HERRCs, and other facilities. Number of households are estimates based on shelter census and average household sizes provided by the Office of Management and Budget.
IV. Comptroller’s Office’s Risks & Offsets
As previously described, the FY 2024 Adopted Budget and June 2023 Financial Plan project a balanced budget for FY 2024 and gaps of $5.08 billion in FY 2025, $6.84 billion in FY 2026, and $7.90 billion in FY 2027.
The Comptroller’s Office restates the City’s gaps and surpluses based on its own estimates of City revenues and expenditures; the Office estimates projected risks, which increase City gaps, and offsets that reduce them, as shown in Table 13. Based on these risks and offsets the Comptroller’s Office estimates that the City’s overall budget gaps will total $1.96 billion in FY 2024—which could largely be covered by the City’s budgeted reserves, but growing to $9.65 billion in FY 2025, $12.62 billion in 2026, and $13.98 billion in FY 2027 (1.8 percent of the adopted budget in FY 2024 increasing to 12.8 percent of total planned revenues by FY 2027).
Revenues
The Comptroller’s Office anticipates that City-funded revenues, including tax and miscellaneous revenues, will come in higher than OMB’s projections in each year of the Plan – by $834 million in FY 2024, $1.16 billion in FY 2025, $1.44 billion in FY 2026, and $1.74 billion in FY 2027.
Most of this difference come from higher tax revenue forecasts. In FY 2024, the Comptroller’s Office projects $767 million in additional tax revenue compared with the City, which is largely due to higher forecast PIT/PTET and sales tax collections, offset somewhat by lower business taxes forecasts. The difference between the Comptroller’s Office’s and the City’s total tax forecast grows each year to $1.09 billion in FY 2025, $1.39 billion in FY 2026, and $1.70 billion in FY 2027. From FY 2025 through FY 2027, the difference between the City’s projections and the Comptroller’s Office’s, however, is largely due to the Comptroller’s Office’s higher estimates of property tax revenues.
Property Taxes
For FY 2024, the Comptroller forecasts property tax revenue to rise to $32.73 billion, an increase of 3.3 percent above FY 2023. This is $350 million more than the Comptroller’s May forecast, a result of the higher-than-expected assessments in the recently released final property tax rolls for FY 2024. Although OMB also revised its anticipated FY 2024 revenue upward (by $300 million) in the Adopted Budget, it left its property tax revenue forecast unchanged from FY 2025 to FY 2027. The Comptroller’s Office has updated its estimates each year of the plan period and projects that property tax revenues in later fiscal years will grow at an average annual rate of 2.3 percent through FY 2027, when property tax collections are expected to reach $34.99 billion.
The Comptroller’s property tax forecast exceeds the OMB forecast in the Adopted Budget by $26 million in FY 2024, and this difference grows to $821 million in FY 2025, $985 million in FY 2026, and $1.75 billion in FY 2027.
Other Taxes and Miscellaneous Revenues
The Comptroller’s Office estimates that taxes other than general property tax will total $39.17 billion in FY 2024, exceeding OMB’s projections by $740 million. The largest difference between OMB’s and the Comptroller’s Offices estimate for FY 2024 is the Comptroller’s Office’s estimates of higher PIT/PTET revenues.
Following higher-than-anticipated FY 2023 PIT/PTET revenues, which the Comptroller’s Office now expects to total $17.13 billion, a consequence of higher estimated tax payments in June and smaller PIT refunds, the Comptroller’s Office projects that PIT/PTET revenues will fall in FY 2024 by $1.46 billion or 8.5 percent to $15.67 billion. This FY 2024 estimate, however, is slightly higher ($20 million) than the Comptroller’s last published forecast. It is also higher than OMB’s FY 2024 forecast, which totals $14.94 billion—for a difference of $730 million between the two Offices. After FY 2024, the Comptroller’s Office forecasts the PIT/PTET revenues will grow at an average annual rate of 3.8 percent, somewhat slower than OMB’s average annual growth rate of 4.9 percent, which results in narrowed gaps between the two forecasts until FY 2027 when OMB’s forecast exceeds the Comptroller’s Office’s by $245 million.
The Comptroller also estimates that general sales tax revenues will come in higher than the City projects in FY 2024 by $235 million, with smaller differences projected for the outyears. One tax where OMB projects higher revenues than the Comptroller’s Office in each year of the financial plan period is the City’s business taxes, with OMB’s tax forecast exceeding the Comptroller’s by $359 million in FY 2024.[12] The difference between the Comptroller’s Office and OMB’s forecast for business tax receipts increases to $451 million in FY 2025 before declining to $49 million by FY 2027.
Apart from an upward revision to the City’s PIT/PTET revenues in FY 2024, the Comptroller’s Office has not revised its forecasts for non-property taxes for FY 2024 forward from their previously published levels. Table 12 reports the difference between the Comptroller’s Office and OMB’s tax forecasts by tax source for each year of the financial plan.
Table 12. Comparison of Tax Revenue Projections
| ($ in millions) | FY 2023 | FY 2024 | FY 2025 | FY 2026 | FY 2027 | |
|---|---|---|---|---|---|---|
| Property | Comptroller | $31,680 | $32,732 | $33,187 | $33,618 | $34,990 |
| Mayor | 31,620 | 32,705 | 32,366 | 32,633 | 33,238 | |
| PIT/PTET | Comptroller | 17,129 | 15,673 | 16,249 | 16,821 | 17,511 |
| Mayor | 17,201 | 14,943 | 16,125 | 16,722 | 17,756 | |
| Business Taxes | Comptroller | 8,564 | 7,361 | 7,294 | 7,538 | 7,777 |
| Mayor | 8,279 | 7,720 | 7,745 | 7,726 | 7,826 | |
| Sales Taxes | Comptroller | 9,546 | 10,007 | 10,471 | 10,965 | 11,343 |
| Mayor | 9,522 | 9,772 | 10,320 | 10,905 | 11,352 | |
| Real Estate-Related | Comptroller | 2,188 | 2,151 | 2,603 | 2,684 | 2,670 |
| Mayor | 2,164 | 2,196 | 2,375 | 2,496 | 2,667 | |
| Other | Comptroller | 2,928 | 3,083 | 3,222 | 3,336 | 3,431 |
| Mayor | 2,892 | 3,082 | 3,182 | 3,269 | 3,361 | |
| Audits | Comptroller | 1,300 | 900 | 900 | 900 | 900 |
| Mayor | 1,300 | 721 | 721 | 721 | 721 | |
| Total | Comptroller | $73,334 | $71,906 | $73,925 | $75,862 | $78,622 |
| Mayor | $72,978 | $71,139 | $72,834 | $74,472 | $76,921 |
The Comptroller’s Office estimates miscellaneous revenue will come in $67 million higher than in OMB’s assumptions in FY 2024, due to higher forecasts of interest rates and fines. Similar differences are seen in the outyears of the plan.
Expenditures
The Comptroller’s Office estimates expenditures will be higher than those reflected in the FY 2024 Adopted Budget and June 2023 Financial Plan in each year. In FY 2024, the Comptroller’s Office projects net expenditure risks of $2.80 billion, which grow to $7.81 billion in FY 2027.
Services to People Seeking Asylum
As described in the Update to Services to People Seeking Asylum section of this report, the City currently has $2.91 billion budget for shelter and other services in FY 2024 and $1.0 billion budgeted in FY 2025. These funds may not be sufficient given both the growth in this population and the daily costs incurred thus far by the City to provide these services, although the Comptroller’s Office acknowledges these costs are highly uncertain. In addition, the Comptroller’s Office anticipates that the City may not receive $290 million in planned reimbursements from the State government in FY 2025 as the State enacted budget includes reimbursement for only FYs 2023 and 2024—meaning those expenses may have to be paid with City funding. Lastly, the June Plan does not include any funds for services to this population in FY 2026 and FY 2027. Together, these factors lead to additional expenditure risks of $750 million in FY 2024, $2.94 billion in FY 2025, and $3.65 billion in FYs 2026-2027 even if trends stabilize but the need for services remains.
Overtime and Other PS Costs
The City continues to underbudget for overtime costs, which presents a risk of $683 million in FY 2024. There are three main areas of overtime cost risks: uniformed overtime for the police, fire, and correction departments; civilian overtime at those departments; and overtime at other City agencies.
The Comptroller’s Office projects FY 2024 overtime costs for uniformed police officers at $700 million, posing a risk to the budget of $263 million. For FY 2023, police uniformed overtime cost is expected to be over $800 million. However, FY 2023 overtime costs were higher than expected due to the enhanced subway safety coverage, which is not expected to continue at the same levels next year.
For the Department of Correction (DOC), year-to-date numbers indicate that the DOC will spend above $265 million for uniformed overtime in FY 2023. For FY 2024, the Comptroller’s Office projects a similar level of spending—$139 million more than currently projected in the budget. For the fire department, the Adopted Budget includes overtime costs of $251 million. The Comptroller’s Office projects these costs will be slightly higher at $300 million resulting in a risk of $49 million.
Civilian overtime spending for FY 2023 is expected to be above $740 million. As in FY 2022, higher-than-usual attrition, and the difficulty in hiring new staff resulted in agencies using overtime to meet daily operations. This cost should decline as the City hires new employees. At this time, the Comptroller’s Office projects that civilian overtime spending will be about $630 million in FY 2024, posing a risk to the budget of $232 million.
For the outyears, the Comptroller’s Office estimates that overtime costs are underbudgeted by $450 million in each year.
For FY 2024, due to lower-than-expected actual headcount compared with budgeted amounts, the Comptroller’s Office estimates non-overtime personnel costs will total $350 million less than budgeted by the City FY 2024, representing an offset to other cost increases.
Collective Bargaining Agreements
While the City’s labor reserve contains funds to pay for the City’s labor settlements following the patterns established by DC 37 and the PBA, the recent contract for the New York State Nurses Association provides increases above this pattern for the city’s public sector nurses. If the City funds the full cost of the pay parity and the annual increases, the Comptroller’s Office estimates that addition of $72 million will be required in FY 2024, (this is net $39 million in funds shifted from previously projected wage increases for FY 2023 and reserved for members bonuses), $120 million in FY 2025, $170 million in FY 2026, and $180 million in FY 2027.While savings may result from the reduced reliance on temporary contract nurses as a result of this agreement, there may also be additional staff costs to meet the new ratios that are not reflected in the estimated risk.
Department of Education
The Comptroller’s Office estimates DOE expenditures will be $399 million above what the City has budgeted for FY 2024, growing to $2.42 billion in FY 2027. The largest risk for FY 2024 relates to City spending on special education Carter Cases. This cost has risen dramatically in recent years, totaling nearly $920 million in FY 2022. The City has only budgeted $596 million for FY 2024, and while this represents a $150 million increase over what was planned in the Executive Budget, the Comptroller’s Office estimates that an additional $325 million is necessary to match FY 2022 costs.[13] Because the City only increased funding for Carter Cases in FY 2024 in the Adopted Budget, the Comptroller’s Office risk for this cost in the outyears increases to $475 million in each year. The DOE has also likely underbudgeted pupil transportation costs for FY 2024, as well as the outyears, and could require additional funding of $25 million in FY 2024, growing to $175 million in FY 2027 for these costs. Lastly for FY 2024, the Comptroller’s Office estimates the City will need $49 million to continue contracted school nurse services previously paid through federal COVID relief stimulus funds.
Other risks to the DOE budget in FY 2025 through FY 2027 include $457 million in each year related to the exhaustion of federal COVID stimulus funding for other programs that are expected to continue past their expiration (fiscal cliffs associated with contracted nurses, Summer Rising, Special Education Pre-K Expansion, Universal 3-K, and Community Schools Expansion). Outyear risks also include $46 million in FY 2025 for underbudgeting for charter schools, a risk that rises to $449 million in FY 2027. Lastly, the June Plan does not include funding to address the State’s mandate to reduce class size. Under the plan, the City will need to phase in reductions over a five-year period to achieve full compliance by September 2028. The DOE estimates that, once fully phased in, the new mandate could lead to additional costs of $1.3 billion annually, requiring $433 million in FY 2026 and $867 million in FY 2027.
Rental Assistance
Rental assistance costs are also underbudgeted in the Adopted Budget. Spending on the City’s rental assistance programs has been rising rapidly—from $356 million in FY 2022 to $574 million in the final current modified budget for FY 2023.[14] This growth follows earlier program reforms that increased payment standards and expanded eligibility.[15] Even before taking into account the impact of the more recent changes that expand program eligibility to more households at risk of eviction, which the City Council recently passed over the Mayor’s veto, the Comptroller’s Office estimates that the City’s rental assistance costs are underbudgeted for FY 2024 and forward. The Comptroller’s Office estimates that rental assistance costs will reach at least $794 million in FY 2024—$374 million more than budgeted. The Office baselines the $794 million cost across the outyears of the financial plan period, which are budgeted at the even lower amount of $157 million annually for a total risk of $637 million in FYs 2025-2027.[16] This risk is based on growth in program costs in recent years and does not include the impact of changing the eligibility rules for households at risk of eviction. It does, however, reflect the Administration’s estimate that eliminating the 90-day shelter rule will increase City costs by $123 million, which was included in the Adopted Budget for FY 2024.
The Mayor vetoed the rental assistance bills citing cost concerns—estimating that expanding the eligibility rules for those a risk of eviction would increase City costs by $17.3 billion over five years—and that the expansion to more households at risk of eviction would make it more difficult for households in shelter to find housing.[17] The City Council estimates a cost of $10.6 billion over the first five fiscal years of implementation, an estimate that, unlike the Mayor’s, includes a partial implementation in the first fiscal year and $2.1 billion in projected shelter savings.[18]
Because the Comptroller’s Office anticipates litigation by City Hall to halt or stall the other eligibility changes, it does not include an estimate of the expanded costs of the program as a risk. However, both the Administration and the City Council estimate that costs will increase considerably due to the change.
Public Assistance & Other Social Services
The Comptroller’s Office estimates that the City will require $225 million more annually in City funds for public assistance costs in FY 2024 through FY 2026. The City’s public assistance caseload has been growing since the end of federal Pandemic Unemployment Compensation program in September 2021. While the City increased its planned public assistance spending in FY 2023 in the Executive Budget, it has not similarly increased its funding for FYs 2024-2026 (FY 2027 costs were already budgeted above FY 2024-2026 levels).
Other risks to the City’s social service program include additional funding necessary to cover foster care reimbursement costs as mandated by the State—a $118 million ongoing cost not yet reflected for FY 2024 or the outyears, as well as additional funds to pay prevailing wage rates to Department of Homeless Services security guards.
Metropolitan Transportation Authority
The City also continues to underbudget its ongoing support for the Metropolitan Transportation Authority (MTA). While the Adopted Budget added $165 million to reflect the State budget mandate increasing the City’s contribution in FY 2024 and FY 2025 from 50 percent of paratransit expense to 80 percent (capped at a $165 million increase), additional funds are still necessary. The amount included in the City budget before the $165 million increase was below the existing 50 percent contribution requirement. Notably, in its July Financial Plan, the MTA forecast that the City’s capped 80 percent paratransit contribution requirement will be extended through FY 2027, an additional two years beyond the enacted State budget. The Comptroller’s Office risks reflect only what is in the enacted State budget. In addition to paratransit, the City has also underbudgeted operating subsidies for the MTA Bus Company and the Staten Island Railway. Together, these paratransit, MTA Bus, and Staten Island Railway obligations pose a combined risk of $155 million in FY 2024, growing to $420 million FY 2027.
The City also provides funding to the MTA to reimburse it for discounted fares provided to low-income New Yorkers through the City’s Fair Fares program. The Adopted Budget increased funding for this program by $20 million annually to expand access to more households (from 100 percent of FPL to 120 percent of FPL). Furthermore, the MTA recently voted to increase fares from $2.75 to $2.90 beginning in mid-August, which will increase the cost of the program to the City. Because take up for the program has historically been relatively low, with only about 30 percent of eligible households participating, it is premature to assess if the recent increases for the program will be sufficient to cover both an expansion of eligibility and the increased fares.
Other Expenditures
The Comptroller’s Office recognizes a risk in FY 2024 for underbudgeting for the City’s temporary and professional services. Agencies often contract with outside vendors to staff and perform essential functions, including legal services, accounting services, architectural and engineering services, and other consultant services. These can be used to counter high vacancy rates in particular areas or titles. Since FY 2019, agencies have consistently spent upwards of $1 billion on these services, with $1.24 billion committed for FY 2023 as of the end of June. It is likely that agencies will still require these services at a similar level in FY 2024, which could pose a risk of $142 million to the FY 2024 budget. The City may reduce its reliance on these services if it hires up to its authorized headcount in the outyears.
Pension investment returns above the Actuarial Interest Rate Assumption (AIRA) of 7 percent in the Financial Plan allow the City to decrease its contributions to fund pension costs. The combined FY 2023 pension investment returns of the City’s actuarial pension system averaged 8 percent. This will allow the City to decrease its pension costs by $49 million in FY 2025, $111 million in FY 2026, and $170 million in FY 2027.
The Comptroller’s Office also includes settlement costs for two class action lawsuits against the DOC in its calculation of costs that will increase City expenditures. This includes the settlement of the Lynch class action suit brought on behalf of former detainees whose releases had been delayed for hours or days after they made bail, and the Onaida class action case, which concerns the DOC’s extended detention of inmates subject to ICE detainers beyond their scheduled release date.[19]
Table 13. Risks and Offsets to the Adopted FY 2024 Financial Plan
$ in millions, positive numbers decrease the gap and negative numbers increase the gap
| FY 2024 | FY 2025 | FY 2026 | FY 2027 | |
| City Stated Gap | $0 | ($5,079) | ($6,836) | ($7,900) |
| Tax Revenues | ||||
| Property Tax | $26 | $821 | $985 | $1,752 |
| Personal Income Tax | 730 | 124 | 99 | (245) |
| Business Taxes | (359) | (451) | (188) | (49) |
| Sales Tax | 235 | 151 | 60 | (9) |
| Real Estate Transaction Taxes | (45) | 228 | 188 | 3 |
| All Other | 1 | 40 | 67 | 70 |
| Audit | 179 | 179 | 179 | 179 |
| Subtotal Tax Revenues | $767 | $1,092 | $1,390 | $1,701 |
| Miscellaneous Revenues | $67 | $65 | $49 | $34 |
| Total Revenues | $834 | $1,157 | $1,439 | $1,735 |
| Expenditures | ||||
| PS Accrual Savings | $350 | $0 | $0 | $0 |
| Temporary and Professional Services | (142) | 0 | 0 | 0 |
| Overtime | (683) | (450) | (450) | (450) |
| Collective Bargaining Agreements | (72) | (120) | (170) | (180) |
| Pension | 0 | 49 | 111 | 170 |
| Asylum Seekers Expenses | (750) | (2,940) | (3,650) | (3,650) |
| Education | (399) | (1,053) | (1,722) | (2,423) |
| Public Health Corps | 0 | (13) | (49) | (49) |
| Public Assistance | (225) | (225) | (225) | 0 |
| Rental Assistance | (374) | (637) | (637) | (637) |
| Contributions to MTA | (155) | (162) | (254) | (420) |
| Prevailing Wage for Shelter Security Guards | (55) | (55) | (55) | (55) |
| Foster Care Reimbursement Rate | (118) | (118) | (118) | (118) |
| City Settlements | (175) | 0 | 0 | 0 |
| Total Expenditures | ($2,798) | ($5,723) | ($7,218) | ($7,812) |
| Comptroller’s (Risks)/Offsets | ($1,964) | ($4,566) | ($5,779) | ($6,077) |
| Restated (Gap)/Surplus | ($1,964) | ($9,645) | ($12,615) | ($13,977) |
SOURCE: Office of the New York City Comptroller
NOTE: Numbers may not add to totals due to rounding.
V. Appendix
Table A1. June 2023 Financial Plan Revenue Detail
| ($ in millions) | FY 2024 | FY 2025 | FY 2026 | FY 2027 | Change FYs 2024– 2027 |
Annual Percent Change | |
|---|---|---|---|---|---|---|---|
| Dollars | Percent | ||||||
| Taxes: | |||||||
| Real Property | $32,705 | $32,366 | $32,633 | $33,238 | $533 | 1.6% | 0.5% |
| Personal Income Tax and Pass Through Entity Tax | 14,943 | 16,125 | 16,722 | 17,756 | $2,813 | 18.8% | 5.9% |
| General Corporation Tax | 5,189 | 5,132 | 5,023 | 5,028 | (161) | (3.1%) | (1.0%) |
| Unincorporated Business Tax | 2,531 | 2,613 | 2,703 | 2,798 | 267 | 10.5% | 3.4% |
| Sales and Use Tax | 9,772 | 10,320 | 10,905 | 11,352 | 1,580 | 16.2% | 5.1% |
| Real Property Transfer Tax | 1,343 | 1,432 | 1,503 | 1,607 | 264 | 19.7% | 6.2% |
| Mortgage Recording Tax | 853 | 943 | 993 | 1,060 | 207 | 24.3% | 7.5% |
| Commercial Rent | 890 | 912 | 930 | 945 | 55 | 6.2% | 2.0% |
| Utility | 449 | 452 | 461 | 477 | 28 | 6.2% | 2.0% |
| Hotel | 666 | 709 | 734 | 762 | 96 | 14.4% | 4.6% |
| Cigarette | 17 | 16 | 16 | 16 | (1) | (5.9%) | (2.0%) |
| All Other | 1,048 | 1,073 | 1,098 | 1,123 | 75 | 7.2% | 2.3% |
| Cannabis Tax | 12 | 20 | 30 | 38 | 26 | 216.7% | 46.8% |
| Tax Audit Revenue | 721 | 721 | 721 | 721 | 0 | 0.0% | 0.0% |
| Total Taxes | $71,139 | $72,834 | $74,472 | $76,921 | $5,782 | 8.1% | 2.6% |
| Miscellaneous Revenue: | |||||||
| Licenses, Franchises, etc. | $695 | $705 | $713 | $693 | ($2) | (0.3%) | (0.1%) |
| Interest Income | 436 | 318 | 237 | 225 | (211) | (48.4%) | (19.8%) |
| Charges for Services | 1,021 | 1,025 | 1,028 | 1,029 | 8 | 0.8% | 0.3% |
| Water and Sewer Charges | 1,862 | 1,815 | 1,813 | 1,807 | (55) | (3.0%) | (1.0%) |
| Rental Income | 258 | 261 | 258 | 258 | 0 | 0.0% | 0.0% |
| Fines and Forfeitures | 1,178 | 1,174 | 1,182 | 1,182 | 4 | 0.3% | 0.1% |
| Miscellaneous | 368 | 340 | 343 | 339 | (29) | (7.9%) | (2.7%) |
| Intra-City Revenue | 1,990 | 1,980 | 1,983 | 1,980 | (10) | (0.5%) | (0.2%) |
| Total Miscellaneous Revenue | $7,808 | $7,618 | $7,557 | $7,513 | ($295) | (3.8%) | (1.3%) |
| Reserve for Disallowance of Categorical Grants | ($15) | ($15) | ($15) | ($15) | $0 | 0.0% | 0.0% |
| Less: Intra-City Revenue | ($1,990) | ($1,980) | ($1,983) | ($1,980) | $10 | (0.5%) | (0.2%) |
| TOTAL CITY-FUNDS | $76,942 | $78,457 | $80,031 | $82,439 | $5,497 | 7.1% | 2.3% |
| Other Categorical Grants | $1,082 | $1,075 | $1,071 | $1,070 | ($12) | (1.1%) | (0.4%) |
| Inter-Fund Agreements | $720 | $725 | $732 | $732 | $12 | 1.7% | 0.6% |
| Federal Categorical Grants: | |||||||
| Community Development | $259 | $243 | $241 | $237 | ($22) | (8.5%) | (2.9%) |
| Social Services | 3,448 | 3,462 | 3,455 | 3,454 | 6 | 0.2% | 0.1% |
| Education | 3,933 | 1,901 | 1,901 | 1,901 | (2,032) | (51.7%) | (21.5%) |
| Other | 2,680 | 2,210 | 1,457 | 1,435 | (1,245) | (46.5%) | (18.8%) |
| Total Federal Grants | $10,320 | $7,816 | $7,054 | $7,027 | ($3,293) | (31.9%) | (12.0%) |
| State Categorical Grants: | |||||||
| Social Services | $2,456 | $2,193 | $1,896 | $1,896 | ($560) | (22.8%) | (8.3%) |
| Education | 13,111 | 13,039 | 13,039 | 13,039 | (72) | (0.5%) | (0.2%) |
| Higher Education | 273 | 273 | 273 | 273 | 0 | 0.0% | 0.0% |
| Department of Health and Mental Hygiene | 624 | 624 | 624 | 624 | 0 | 0.0% | 0.0% |
| Other | 1,587 | 1,585 | 1,645 | 1,708 | 121 | 7.6% | 2.5% |
| Total State Grants | $18,051 | $17,714 | $17,477 | $17,540 | ($511) | (2.8%) | (1.0%) |
| TOTAL REVENUES | $107,115 | $105,787 | $106,365 | $108,808 | $1,693 | 1.6% | 0.5% |
NOTE: Numbers may not add due to rounding.
Table A2. June 2023 Financial Plan Expenditure Detail
| ($ in millions) | FY 2024 | FY 2025 | FY 2026 | FY 2027 | Change FYs 2024 – 2027 | Annual Percent Change | |
|---|---|---|---|---|---|---|---|
| Dollars | Percent | ||||||
| Mayoralty | $176 | $158 | $158 | $155 | ($20) | (11.7%) | (4.0%) |
| Board of Elections | 138 | 138 | 138 | 138 | 0 | 0.0% | 0.0% |
| Campaign Finance Board | 73 | 13 | 13 | 13 | (60) | (82.6%) | (44.1%) |
| Office of the Actuary | 7 | 7 | 7 | 7 | 0 | 1.1% | 0.4% |
| President, Borough of Manhattan | 6 | 5 | 5 | 5 | (1) | (11.2%) | (3.9%) |
| President, Borough of Bronx | 7 | 6 | 6 | 6 | (0) | (6.0%) | (2.1%) |
| President, Borough of Brooklyn | 7 | 7 | 7 | 7 | (1) | (10.5%) | (3.6%) |
| President, Borough of Queens | 6 | 5 | 5 | 5 | (1) | (11.2%) | (3.9%) |
| President, Borough of Staten Island | 5 | 5 | 5 | 5 | (0) | (4.3%) | (1.4%) |
| Office of the Comptroller | 117 | 117 | 117 | 117 | 1 | 0.5% | 0.2% |
| Dept. of Emergency Management | 218 | 89 | 34 | 32 | (186) | (85.5%) | (47.4%) |
| Office of Administrative Tax Appeals | 6 | 6 | 6 | 6 | 0 | 2.5% | 0.8% |
| Law Dept. | 243 | 224 | 226 | 227 | (16) | (6.5%) | (2.2%) |
| Dept. of City Planning | 49 | 47 | 45 | 46 | (3) | (6.4%) | (2.2%) |
| Dept. of Investigation | 46 | 44 | 41 | 41 | (5) | (10.3%) | (3.6%) |
| NY Public Library — Research | 34 | 31 | 32 | 32 | (2) | (5.1%) | (1.7%) |
| New York Public Library | 173 | 161 | 164 | 164 | (9) | (5.4%) | (1.8%) |
| Brooklyn Public Library | 130 | 121 | 123 | 123 | (7) | (5.4%) | (1.8%) |
| Queens Borough Public Library | 135 | 126 | 128 | 128 | (7) | (5.5%) | (1.9%) |
| Dept. of Education | 31,486 | 30,614 | 31,093 | 31,322 | (164) | (0.5%) | (0.2%) |
| City University | 1,421 | 1,261 | 1,262 | 1,279 | (142) | (10.0%) | (3.5%) |
| Civilian Complaint Review Board | 25 | 24 | 24 | 24 | (1) | (5.8%) | (2.0%) |
| Police Dept. | 5,565 | 5,686 | 5,728 | 5,773 | 209 | 3.7% | 1.2% |
| Fire Dept. | 2,299 | 2,260 | 2,263 | 2,260 | (39) | (1.7%) | (0.6%) |
| Dept. of Veterans’ Services | 5 | 5 | 5 | 5 | (0) | (0.7%) | (0.2%) |
| Admin. for Children Services | 2,733 | 2,734 | 2,718 | 2,718 | (15) | (0.5%) | (0.2%) |
| Dept. of Social Services | 11,474 | 10,959 | 11,042 | 11,537 | 63 | 0.6% | 0.2% |
| Dept. of Homeless Services | 4,101 | 2,814 | 2,186 | 2,184 | (1,916) | (46.7%) | (18.9%) |
| Dept. of Correction | 1,166 | 1,155 | 1,187 | 1,187 | 21 | 1.8% | 0.6% |
| Board of Correction | 4 | 3 | 4 | 4 | (0) | (8.3%) | (2.9%) |
| Citywide Pension Contributions | 9,529 | 10,310 | 10,773 | 10,955 | 1,426 | 15.0% | 4.8% |
| Miscellaneous | 15,906 | 16,664 | 18,106 | 19,807 | 3,901 | 24.5% | 7.6% |
| Debt Service | 4,463 | 4,666 | 4,919 | 5,122 | 659 | 14.8% | 4.7% |
| TFA Debt Service | 3,277 | 3,573 | 4,089 | 4,576 | 1,299 | 39.6% | 11.8% |
| FY 2023 BSA and Discretionary Transfers | (5,479) | 0 | 0 | 0 | 5,479 | (100.0%) | (100.0%) |
| Public Advocate | 5 | 5 | 5 | 5 | 0 | 0.0% | 0.0% |
| City Council | 100 | 85 | 85 | 85 | (15) | (15.0%) | (5.3%) |
| City Clerk | 6 | 5 | 5 | 5 | (0) | (3.4%) | (1.1%) |
| Dept. for the Aging | 521 | 487 | 406 | 406 | (115) | (22.1%) | (8.0%) |
| Dept. of Cultural Affairs | 242 | 159 | 161 | 161 | (80) | (33.3%) | (12.6%) |
| Financial Info. Serv. Agency | 116 | 117 | 119 | 119 | 2 | 2.0% | 0.7% |
| Criminal Justice Coordinator | 45 | 697 | 687 | 687 | 642 | 1429.3% | 148.2% |
| Office of Payroll Admin. | 15 | 16 | 16 | 16 | 0 | 2.2% | 0.7% |
| Independent Budget Office | 7 | 7 | 7 | 6 | (0) | (6.7%) | (2.3%) |
| Equal Employment Practices | 1 | 1 | 1 | 1 | 0 | 3.6% | 1.2% |
| Civil Service Commission | 1 | 1 | 1 | 1 | 0 | 1.0% | 0.3% |
| Landmarks Preservation Commission | 8 | 7 | 8 | 8 | (0) | (0.8%) | (0.3%) |
| Taxi & Limousine Commission | 60 | 55 | 54 | 53 | (7) | (11.7%) | (4.1%) |
| Office of Racial Equity | 5 | 5 | 5 | 5 | (0) | (0.5%) | (0.2%) |
| Commission on Racial Equity | 1 | 2 | 2 | 2 | 0 | 30.4% | 9.2% |
| Commission on Human Rights | 14 | 14 | 14 | 14 | 0 | 2.0% | 0.6% |
| Youth & Community Development | 1,221 | 998 | 984 | 984 | (237) | (19.4%) | (6.9%) |
| Conflicts of Interest Board | 2 | 3 | 3 | 3 | 0 | 0.7% | 0.2% |
| Office of Collective Bargaining | 2 | 2 | 2 | 2 | 0 | 0.2% | 0.1% |
| Community Boards (All) | 21 | 20 | 21 | 21 | (0) | (0.9%) | (0.3%) |
| Dept. of Probation | 114 | 108 | 108 | 108 | (6) | (5.1%) | (1.7%) |
| Dept. Small Business Services | 282 | 190 | 152 | 149 | (133) | (47.3%) | (19.2%) |
| Housing Preservation & Development | 1,411 | 1,264 | 1,236 | 1,244 | (167) | (11.8%) | (4.1%) |
| Dept. of Buildings | 219 | 191 | 188 | 188 | (31) | (14.3%) | (5.0%) |
| Dept. of Health & Mental Hygiene | 2,190 | 2,072 | 2,055 | 2,055 | (135) | (6.2%) | (2.1%) |
| NYC Health + Hospitals | 1,742 | 1,220 | 972 | 981 | (761) | (43.7%) | (17.4%) |
| Office of Administrative Trials & Hearings | 65 | 65 | 66 | 66 | 0 | 0.6% | 0.2% |
| Dept. of Environmental Protection | 1,662 | 1,585 | 1,577 | 1,570 | (91) | (5.5%) | (1.9%) |
| Dept. of Sanitation | 1,893 | 1,852 | 1,846 | 1,862 | (31) | (1.6%) | (0.5%) |
| Business Integrity Commission | 8 | 8 | 9 | 9 | 0 | 2.4% | 0.8% |
| Dept. of Finance | 336 | 328 | 330 | 330 | (5) | (1.6%) | (0.5%) |
| Dept. of Transportation | 1,403 | 1,403 | 1,388 | 1,376 | (26) | (1.9%) | (0.6%) |
| Dept. of Parks and Recreation | 579 | 558 | 568 | 568 | (12) | (2.0%) | (0.7%) |
| Dept. of Design & Construction | 157 | 154 | 156 | 156 | (1) | (0.7%) | (0.2%) |
| Dept. of Citywide Admin. Services | 634 | 594 | 596 | 592 | (42) | (6.6%) | (2.2%) |
| D.O.I.T.T. | 652 | 609 | 563 | 558 | (94) | (14.5%) | (5.1%) |
| Dept. of Record & Info. Services | 16 | 16 | 16 | 16 | 0 | 0.5% | 0.2% |
| Dept. of Consumer & Worker Protection | 64 | 64 | 65 | 65 | 1 | 1.2% | 0.4% |
| District Attorney – N.Y. | 157 | 157 | 158 | 159 | 2 | 1.3% | 0.4% |
| District Attorney – Bronx | 105 | 106 | 107 | 107 | 2 | 2.2% | 0.7% |
| District Attorney – Kings | 135 | 136 | 137 | 137 | 2 | 1.3% | 0.4% |
| District Attorney –Queens | 90 | 91 | 91 | 91 | 1 | 1.1% | 0.4% |
| District Attorney – Richmond | 24 | 24 | 24 | 24 | 0 | 0.1% | 0.0% |
| Office of Prosec. & Special Narc. | 29 | 28 | 29 | 29 | (0) | (1.1%) | (0.4%) |
| Public Administrator – N.Y. | 1 | 1 | 1 | 1 | 0 | 2.5% | 0.8% |
| Public Administrator – Bronx | 1 | 1 | 1 | 1 | 0 | 2.7% | 0.9% |
| Public Administrator – Brooklyn | 1 | 1 | 1 | 1 | 0 | 3.3% | 1.1% |
| Public Administrator – Queens | 1 | 1 | 1 | 1 | 0 | 2.6% | 0.8% |
| Public Administrator – Richmond | 1 | 1 | 1 | 1 | (0) | (4.0%) | (1.4%) |
| General Reserve | 1,200 | 1,200 | 1,200 | 1,200 | 0 | 0.0% | 0.0% |
| Energy Adjustment | 0 | 9 | 114 | 160 | 160 | N/A | N/A |
| Lease Adjustment | 0 | 47 | 95 | 145 | 145 | N/A | N/A |
| OTPS Inflation Adjustment | 0 | 56 | 111 | 167 | 167 | N/A | N/A |
| TOTAL EXPENDITURES | $107,115 | $110,866 | $113,201 | $116,708 | $9,594 | 9.0% | 2.9% |
NOTE: Numbers may not add due to rounding. Agency expenditures shown above are net of intra-City expenditures.
Table A3. Total Funded Full-Time Year-End Headcount, June 2023 Financial Plan
| FY 2023 | FY 2024 | FY 2025 | FY 2026 | FY 2027 | % Change FY 2023 – FY 2027 | |
|---|---|---|---|---|---|---|
| Pedagogical | ||||||
| Dept. of Education | 126,895 | 126,075 | 125,186 | 123,367 | 123,367 | (2.8%) |
| City University | 4,293 | 4,289 | 4,289 | 4,289 | 4,289 | (0.1%) |
| Subtotal | 131,188 | 130,364 | 129,475 | 127,656 | 127,656 | (2.7%) |
| Uniformed | ||||||
| Police | 35,030 | 35,001 | 35,001 | 35,001 | 35,001 | (0.1%) |
| Fire | 10,952 | 10,954 | 10,954 | 10,954 | 10,954 | 0.0% |
| Correction | 7,060 | 7,060 | 7,060 | 7,060 | 7,060 | 0.0% |
| Sanitation | 7,639 | 7,978 | 8,014 | 8,016 | 8,016 | 4.9% |
| Subtotal | 60,681 | 60,993 | 61,029 | 61,031 | 61,031 | 0.6% |
| Civilian | ||||||
| Dept. of Education | 13,109 | 13,175 | 13,168 | 12,621 | 12,621 | (3.7%) |
| City University | 1,746 | 1,735 | 1,735 | 1,735 | 1,735 | (0.6%) |
| Police | 14,853 | 14,502 | 14,502 | 14,502 | 14,502 | (2.4%) |
| Fire | 6,405 | 6,375 | 6,366 | 6,366 | 6,366 | (0.6%) |
| Correction | 1,731 | 1,730 | 1,730 | 1,726 | 1,726 | (0.3%) |
| Sanitation | 1,907 | 1,948 | 1,948 | 1,948 | 1,948 | 2.1% |
| Admin. for Children’s Services | 7,079 | 7,079 | 7,079 | 7,079 | 7,079 | 0.0% |
| Social Services | 12,512 | 12,134 | 12,005 | 11,992 | 11,992 | (4.2%) |
| Homeless Services | 1,952 | 1,920 | 1,905 | 1,887 | 1,887 | (3.3%) |
| Health and Mental Hygiene | 5,992 | 5,813 | 5,592 | 5,546 | 5,546 | (7.4%) |
| Finance | 1,897 | 1,885 | 1,885 | 1,885 | 1,885 | (0.6%) |
| Transportation | 5,689 | 5,768 | 5,838 | 5,841 | 5,841 | 2.7% |
| Parks and Recreation | 4,663 | 4,755 | 4,758 | 4,758 | 4,758 | 2.0% |
| All Other Civilians | 32,209 | 32,226 | 31,855 | 31,866 | 31,862 | (1.1%) |
| Subtotal | 111,744 | 111,045 | 110,366 | 109,752 | 109,748 | (1.8%) |
| TOTAL | 303,613 | 302,402 | 300,870 | 298,439 | 298,435 | (1.7%) |
SOURCE: Office of the New York City Comptroller, Mayor’s Office of Management and Budget
Table A4. Full-Time Headcount Changes, June 2023 Financial, Plan vs. April 2023 Financial Plan
| FY 2023 | FY 2024 | FY 2025 | FY 2026 | FY 2027 | |
| Pedagogical | |||||
| Dept. of Education | 0 | 0 | 0 | 0 | 0 |
| City University | 0 | 0 | 0 | 0 | 0 |
| Subtotal | 0 | 0 | 0 | 0 | 0 |
| Uniformed | |||||
| Police | 0 | 0 | 0 | 0 | 0 |
| Fire | (2) | 0 | 0 | 0 | 0 |
| Correction | 0 | 0 | 0 | 0 | 0 |
| Sanitation | 0 | 100 | 100 | 100 | 100 |
| Subtotal | (2) | 100 | 100 | 100 | 100 |
| Civilian | |||||
| Dept. of Education | 0 | 58 | 58 | 58 | 58 |
| City University | 0 | 0 | 0 | 0 | 0 |
| Police | 8 | 0 | 0 | 0 | 0 |
| Fire | (48) | 0 | 0 | 0 | 0 |
| Correction | 0 | 0 | 0 | 0 | 0 |
| Sanitation | 0 | 10 | 10 | 10 | 10 |
| Admin. for Children’s Services |
0 | 0 | 0 | 0 | 0 |
| Social Services | 26 | 2 | 2 | 2 | 2 |
| Homeless Services | 0 | (3) | (3) | (3) | (3) |
| Health and Mental Hygiene | 3 | (2) | (2) | (2) | (2) |
| Finance | 0 | 7 | 7 | 7 | 7 |
| Transportation | 8 | 0 | 0 | 0 | 0 |
| Parks and Recreation | 0 | 57 | 57 | 57 | 57 |
| All Other Civilians | 25 | 187 | 160 | 160 | 160 |
| Subtotal | 22 | 316 | 289 | 289 | 289 |
| Total | 20 | 416 | 389 | 389 | 389 |
SOURCE: Office of the New York City Comptroller, Mayor’s Office of Management and Budget
Acknowledgements
The Comptroller wishes to thank the entire Bureau of Budget team for their contributions in analyzing the FY 2024 Adopted Budget and developing this report. He is also grateful to Archer Hutchinson for the design and layout.
Endnotes
[1] Computer Systems Design & Related Services; and, Media Streaming Distribution Services, Social Networks, etc.
[2] See The City of New York Executive Budget, Fiscal Year 1998: Message of the Mayor, page 25.
[3] Spending on Department of Education and City University of New York fringe benefits, which are typically reflected within each agencies’ respective budget have been included in the fringe benefits category.
[4] The City can only use excess RHBT balance for budget relief up to the amount of pay-as-you-go retiree health benefits in any year.
[5] In response to limits put on deductions of State and Local Taxes (SALT) made in the 2017 Tax Cuts and Jobs Act, the State enacted legislation that allows resident shareholders of 15 partnerships and S corporations (known as pass-through entities) to pay a pass-through entity tax (PTET). Unlike the PIT, the PTET paid to the State can still be deducted from the federal income tax.
[6] These totals exclude additions made through City Council Initiatives. For DSS and DOE, additions made through Council Initiatives, total $44.9 million and $40.2 million, respectively.
[7]These costs include all rental assistance included in the DSS budget. Spending is primarily for CityFHEPS but also includes spending on legacy rental assistance program and the federal HOME Tenant-Based Rental Assistance Program. Budgeted amounts in FY 2024 include $361 million in City funds and $59 million in non-City funds.
[8] Again, this includes all rental assistance programs administered by DSS. The $157 million total budget include $98 million in City funds for FY 2025, and $106 million in City funds for FY 2026 and FY 2027.
[9] For details on the legislation see: The New York City Council – File #: Int 0893-2023 (nyc.gov); The New York City Council – File #: Int 0893-2023 (nyc.gov); The New York City Council – File #: Int 0894-2023 (nyc.gov); and The New York City Council – File #: Int 0229-2022 (nyc.gov).
[10] The first bill allows NYC Fire Pension Fund members (Tier 3, Tier 3 Modified, and Tier 3 Enhanced) to obtain credit for service rendered as an emergency medical technician with the New York City Employee’s Retirement System. The second bill permits Tier 3, Tier 3 Revised, and Tier 3 Enhanced members of the NYC Police Pension Fund to take loans against their accumulated total member contributions with interest.
[11] Data for May and June are preliminary and are derived from initial payroll results and have not yet published by OMB.
[12] Compared with its estimates released in May the Comptroller’s Office now estimates that business income taxes in FY 2023 will be $427 million higher than previously expected, for a total of $8.56 billion for the year. This is a result of surprisingly high June 2023 collections, 15 percent above the prior year.
[13] Although the Comptroller’s Office does not include FY 2023 in its Risks and Offsets, it is likely that $150 million in additional funding will also be necessary for Carter Case costs before the fiscal year closes in October to bring that year’s costs in line with FY 2022 actual expenditures.
[14] These costs include all rental assistance included in the DSS budget. Spending is primarily for CityFHEPS but also includes spending on legacy rental assistance program and the federal HOME Tenant-Based Rental Assistance Program. Budgeted amounts in FY 2023 include $439 million in City funds and $135 million in non-City funds.
[15] Local Law 71 of 2021 increased the payment standard allowed for vouchers to the same as the federal Section 8 program in New York City. In early 2023, rules were changed to allow individuals in shelter to be eligible even if they had gross income above 200 percent FPL if they worked at least 35 hours per week and earned the minimum wage; and the work hours required for a household in shelter were reduced from 30 to 14.
[16] For FYs 2025 the DSS rental assistance budget includes $98 million in City funds, in FY 2026 -2027 it includes $106 million in each year.
[17] Mayor Adams vetoes NYC rental assistance expansion, but council vows override (nydailynews.com)
[18] See Fiscal Impact Statement: The New York City Council – File #: Int 0893-2023 (nyc.gov)
[19] For more information on an ICE detainer see: Detainers 101 | ICE