
I. Executive Summary
Just days before the start of the new fiscal year, the City Council and the Mayor agreed to a $112.43 billion FY 2025 Adopted Budget. This followed a tumultuous year of budget ups and downs. The swings were primarily the result of large changes in the Adams Administration’s projections of the costs of services to asylum seekers, in addition to the more typical spending and revenue revisions that have become a familiar part of the City’s budget process. Overall, the FY 2025 Adopted Budget is $809 million higher than in the Mayor’s April proposal. A modest increase ($454 million) to City tax revenues helps to fund higher City expenditures, including the reversal of some spending cuts announced earlier in the fiscal year.
In the financial plans released since November, the Mayor proposed a total of $3.86 billion in savings initiatives for FY 2025 (excluding changes in debt service costs) through Programs to Eliminate the Gap (PEGs). About 7 percent of the savings announced since November ($269 million) were reversed in subsequent plans, including $70 million in the Adopted Budget. The largest restoration at Adoption was for the City’s library systems. City library subsidies increased by $58 million in FY 2025 compared with the April Plan. The library funding includes not only the restoration of a $22 million cut in this budget cycle, but also the $21 million cut from last year’s cycle, and about $16 million of City Council discretionary funding.
Apart from PEG restorations, other City-funded additions in the Adopted Budget include $75 million for early childhood education programs at the Department of Education and $25 million for childcare through Promise NYC. Despite the additions, combined funding for the City’s 3K and Pre-K programs is projected to drop slightly in FY 2025 compared to FY 2024, and more substantially in FY 2026. Additionally, while funding was added for the City University of New York (CUNY)—including $15 million in operating support to help reduce possible structural deficits as Federal COVID aid for the system expires, about $20 million for programs aimed at helping students graduate, and $33 million in City Council discretionary funding—the Adopted Budget did not restore past baselined PEG cuts which, cumulatively since January 2022, amount to about $95 million per fiscal year.
Short-term cuts followed by selective restorations do little to improve the fiscal condition of the City and squander opportunities to invest in programs that improve services to New Yorkers. As this office has proposed, the City must incorporate ongoing and strategic efficiency reviews and long-term savings planning into the budget process.
Despite the upward revisions in revenue and spending in the Adopted Budget, the Comptroller’s Office continues to project that the City’s financial plan understates City revenues and—to a greater extent—expenditures, clouding the City’s financial picture and leading to larger gap estimates than presented by the Mayor in each year of the financial plan.
The Comptroller’s Office’s forecast of City-fund revenues exceeds those projected by the Office of Management and Budget (OMB) by $410 million in FY 2025, growing to $660 million in FY 2028. For FY 2025, the primary sources driving the difference are higher sales and personal income taxes due to this Office’s relatively stronger economic assumptions, offset somewhat by lower business income taxes based on the expectation that business profitability will decline from its currently high level.
The New York City economy has slowed considerably over the past year as the city completed its recovery from the job losses during the pandemic. Furthermore, all the job gains in 2024 were in lower wage sectors, predominantly in health care services. In the 12 months ending in June 2024, job losses occurred in information, trade, transportation and utilities, professional and business services, construction, financial activities, and manufacturing. Housing affordability remains the top issue facing working families, and recent data shows consumer debt burden and delinquencies rising. Local inflation has also picked up since the beginning of the year. While there are worrisome clouds on the horizon that could portend a weakening U.S. economy, other local economic indicators are more positive, including a low unemployment rate and a rising hotel occupancy rate that is drawing close to its pre-pandemic level. While the Manhattan office market remains weakened by pandemic-induced changes, it is showing initial signs of having bottomed out.
On the expenditure side, the Comptroller’s Office estimates that the June Financial Plan does not account for a net amount of about $3 billion in City-funded expenditures in each year of the plan, on average. Many of the additional expenditures are for chronically underbudgeted costs—costs that are expected to be incurred and are tied to ongoing programs but that are not realistically budgeted. The City must be more transparent about these costs—such as uniformed personnel overtime, special education Carter Cases, contributions to the MTA, and the City’s rental assistance programs—and control those under the City’s purview with proper planning and stronger management.
In the outyears of the financial plan, additional City funding is necessary to cover long-term costs that had previously been paid for with Federal COVID-19 aid. While the City added funding to cover many of these costs in FY 2025 and beyond, not all the additions were included in the outyears. To continue programs such as Summer Rising, emergency food programs for needy households and seniors, among others, $440 million in City-funded expenditures will be needed starting in FY 2026.
Higher expenditures are partially offset by lower pension contributions, due to the pension funds’ combined investment return of 10.0 percent achieved in FY 2024, well above the 7 percent target. These returns will allow the City to lower its pension contributions by an estimated $159 million in FY 2026, $362 million in FY 2027, and $553 million in FY 2028.
With these revenue and expenditure re-estimates, the Comptroller’s Office projects gaps of $2.92 billion in FY 2025 (2.6 percent of total revenues), growing to an average of about $8.51 billion (averaging 7.4 percent of total revenues) in FY 2026 through FY 2028. These estimates exclude more uncertain expenditure risks deriving from services to asylum seekers, the State’s mandate to reduce class size, and the cost of expanding the City’s rental assistance programs.
The Comptroller’s Office estimates that the costs associated with asylum seekers in FY 2025 will be $1.33 billion less than budgeted. This is primarily because OMB’s estimate does not take into account the plateauing of the census of the population in City shelters seen over recent months. However, in the outyears, it is likely that additional City funding will be necessary, totaling $176 million in FY 2026, $1.18 billion in FY 2027, and $2.69 billion in FY 2028. This is due to a combination of lower baseline amounts for services budgeted, as well as the risk that the State may not provide aid to help cover costs in those years as currently budgeted by the City.
To implement the State’s mandate to reduce class size, the Comptroller’s Office estimates that the DOE will need to increase its headcount by 14,445 new teachers by FY 2028. These costs are not reflected in the financial plan, leading to budget risks of at least $374 million in FY 2026, $921 million in FY 2027, and $1.50 billion in FY 2028.
This Office is not including in its re-estimates the cost of expanding the City’s rental assistance programs to households at risk of eviction, due to the uncertain outcome of ongoing litigation. On August 1, a State Supreme Court judge struck down a lawsuit that would have forced the Mayor to implement the expansion, which was passed by the City Council over the Mayor’s veto a year ago. The City Council has indicated it will appeal the decision. Both the Mayor’s and City Council’s estimates indicate substantial fiscal impacts from the implementation of the legislation.
Including the re-estimates of asylum seeker spending and the impact of the class size mandate, this Office projects a manageable gap of $1.59 billion in FY 2025, but more significant outyear gaps of $9.18 billion in FY 2026, $10.49 billion in FY 2027, and $12.70 billion in FY 2028.
In addition to the expense budget, the FY 2025 Capital Budget adopted in June included $2.80 billion in additions compared to the Executive Budget. Of the FY 2025 increase, $1.08 billion was for funding housing-related investments. A total of $1 billion for housing projects was also added in FY 2026. Education projects increased by $756 million in FY 2025. This includes $500 million to comply with the New York State FY 2025 Budget’s mandate that the City increase education funding by $2 billion to reduce class size. In each of FY 2026 through FY 2028, $500 million was added for this purpose.
The City’s final budget for FY 2024 did not include a deposit into the City’s rainy-day fund and none was budgeted for FY 2025. This Office continues to urge the adoption of rules to determine the fund’s target size, deposits, and withdrawals. This Office has proposed a formula for deposits, which is based on the growth rate of non-property taxes. According to the formula proposed by this Office, a deposit of $150 million should have been budgeted in FY 2025 based on OMB’s tax revenue forecast. The amount of the deposit would be $240 million under the Comptroller’s projections.
The tumultuous nature of this year’s budget cycle underscores the need for the City to update its fiscal framework, as this Office has proposed. In addition to the adoption of rules for the rainy-day fund, the framework includes establishing a transparent policy of regular efficiency and long-term savings planning as well as basing capital planning on clear criteria that reflect aging infrastructure, climate resiliency, and the cost of deferred maintenance. The City must also ensure that its debt remains affordable and it must pay its contractors, which provide essential services, on time. These changes will allow the City government to efficiently use its sizable but still limited resources to meet the needs of all New Yorkers for a thriving, well-educated, affordable, and well-managed city.
Table 1. FY 2025 – FY 2028 June Financial Plan
| Change FYs 2025 – 2028 |
||||||
|---|---|---|---|---|---|---|
| ($ in millions) | FY 2025 | FY 2026 | FY 2027 | FY 2028 | Dollar | Percent |
| Revenues | ||||||
| Taxes: | ||||||
| General Property Tax | $34,280 | $34,744 | $35,780 | $36,470 | $2,190 | 6.4% |
| Other Taxes | 41,995 | 42,526 | 44,283 | 45,889 | 3,894 | 9.3% |
| Tax Audit Revenues | 773 | 773 | 773 | 773 | 0 | 0.0% |
| Subtotal: Taxes | $77,048 | $78,043 | $80,836 | $83,132 | $6,084 | 7.9% |
| Miscellaneous Revenues | 8,123 | 7,980 | 7,930 | 7,965 | (158) | (1.9%) |
| Unrestricted Intergovernmental Aid | 0 | 0 | 0 | 0 | 0 | N/A |
| Less: Intra-City Revenues | (1,953) | (1,932) | (1,928) | (1,928) | 25 | (1.3%) |
| Disallowances Against Categorical Grants | (15) | (15) | (15) | (15) | 0 | 0.0% |
| Subtotal: City-Funds | $83,203 | $84,076 | $86,823 | $89,154 | $5,951 | 7.2% |
| Other Categorical Grants | 1,107 | 1,105 | 1,105 | 1,104 | (3) | (0.3%) |
| Inter-Fund Revenues | 762 | 771 | 772 | 772 | 10 | 1.3% |
| Federal Categorical Grants | 7,922 | 7,251 | 7,151 | 7,226 | (696) | (8.8%) |
| State Categorical Grants | 19,438 | 19,114 | 19,135 | 18,638 | (800) | (4.1%) |
| Total Revenues | $112,432 | $112,317 | $114,986 | $116,894 | $4,462 | 4.0% |
| Expenditures | ||||||
| Personal Service | ||||||
| Salaries and Wages | $32,899 | $33,867 | $34,859 | $35,813 | $2,914 | 8.9% |
| Pensions | 10,347 | 11,093 | 11,277 | 12,312 | 1,965 | 19.0% |
| Fringe Benefits | 14,134 | 14,853 | 15,431 | 16,039 | 1,905 | 13.5% |
| Subtotal-PS | $57,380 | $59,813 | $61,567 | $64,164 | $6,784 | 11.8% |
| Other Than Personal Service | ||||||
| Medical Assistance | $6,743 | $6,583 | $6,733 | $6,883 | $140 | 2.1% |
| Public Assistance | 1,650 | 1,650 | 2,000 | 2,463 | 813 | 49.3% |
| All Other | 43,490 | 41,369 | 41,151 | 39,901 | (3,589) | (8.3%) |
| Subtotal-OTPS | $51,883 | $49,602 | $49,884 | $49,247 | ($2,636) | (5.1%) |
| Debt Service | ||||||
| Principal | $4,105 | $4,266 | $4,410 | $4,511 | $406 | 9.9% |
| Interest & Offsets | 3,964 | 4,621 | 5,195 | 5,919 | $1,954 | 49.3% |
| Subtotal Debt Service | $8,069 | $8,887 | $9,605 | $10,430 | $2,360 | 29.3% |
| FY 2024 BSA and Discretionary Transfers | ($4,397) | $0 | $0 | $0 | $4,397 | (100.0%) |
| Capital Stabilization Reserve | $250 | $250 | $250 | $250 | $0 | 0.0% |
| General Reserve | $1,200 | $1,200 | $1,200 | $1,200 | $0 | 0.0% |
| Less: Intra-City Expenses | (1,953) | (1,932) | (1,928) | (1,928) | $25 | (1.3%) |
| Total Expenditures | $112,432 | $117,820 | $120,578 | $123,363 | $10,930 | 9.7% |
| Gap to be Closed | $0 | ($5,503) | ($5,592) | ($6,469) | ($6,469) | N/A |
Source: Mayor’s Office of Management and Budget
Note: Numbers may not add to totals due to rounding. Excludes TSASC debt service costs $76 million in FY 2025, $69 million in FYs 2026-2027, and $68 million in FY 2028, which are paid outside of the City debt service budget (099).
Table 2. Plan-to-Plan Changes, June 2024 Plan vs. April 2024 Plan
| ($ in millions) | FY 2024 | FY 2025 | FY 2026 | FY 2027 | FY 2028 |
|---|---|---|---|---|---|
| Revenues | |||||
| Taxes: | |||||
| General Property Tax | $84 | $454 | $314 | $324 | $334 |
| Other Taxes | 14 | 0 | 0 | 0 | 0 |
| Tax Audit Revenues | 100 | 0 | 0 | 0 | 0 |
| Subtotal: Taxes | $198 | $454 | $314 | $324 | $334 |
| Miscellaneous Revenues | 250 | (3) | (17) | (19) | (19) |
| Unrestricted Intergovernmental Aid | 15 | 0 | 0 | 0 | 0 |
| Less: Intra-City Revenues | (90) | (1) | 2 | 3 | 3 |
| Disallowances Against Categorical Grants | 0 | 0 | 0 | 0 | 0 |
| Subtotal: City-Funds | $373 | $450 | $299 | $308 | $318 |
| Other Categorical Grants | (107) | 1 | 1 | 1 | 0 |
| Inter-Fund Revenues | 0 | 1 | 1 | 2 | 2 |
| Federal Categorical Grants | 165 | 67 | 39 | 4 | 1 |
| State Categorical Grants | 109 | 291 | 222 | 182 | 533 |
| Total Revenues | $540 | $810 | $562 | $497 | $854 |
| Expenditures | |||||
| Personal Service | |||||
| Salaries and Wages | ($7) | $178 | $135 | $110 | $104 |
| Pensions | (20) | (32) | 292 | 351 | 445 |
| Fringe Benefits | (245) | (5) | (23) | (21) | (21) |
| Subtotal-PS | ($272) | $141 | $404 | $440 | $528 |
| Other Than Personal Service | |||||
| Medical Assistance | $150 | $0 | $0 | $0 | $0 |
| Public Assistance | 0 | 0 | 0 | 0 | 0 |
| All Other | 446 | 1,299 | 257 | 206 | 1,058 |
| Subtotal-OTPS | $596 | $1,299 | $257 | $206 | $1,058 |
| Debt Service | |||||
| Principal | $0 | $0 | $30 | $32 | $33 |
| Interest & Offsets | (123) | (170) | (81) | (44) | (45) |
| Subtotal Debt Service | ($123) | ($170) | ($51) | ($12) | ($12) |
| FY 2024 BSA | $459 | ($459) | $0 | $0 | $0 |
| Capital Stabilization Reserve | $0 | $0 | $0 | $0 | $0 |
| General Reserve | ($30) | $0 | $0 | $0 | $0 |
| Less: Intra-City Expenses | ($90) | ($1) | $2 | $3 | $3 |
| Total Expenditures | $540 | $810 | $612 | $637 | $1,577 |
| Gap to be Closed | $0 | $0 | ($50) | ($140) | ($723) |
Source: Mayor’s Office of Management and Budget
Note: Numbers may not add to totals due to rounding.
Table 3. Plan-to-Plan Changes, June 2024 Plan vs. June 2023 Plan
| ($ in millions) | FY 2024 | FY 2025 | FY 2026 | FY 2027 |
|---|---|---|---|---|
| Revenues | ||||
| Taxes: | ||||
| General Property Tax | $293 | $1,914 | $2,111 | $2,542 |
| Other Taxes | 2,187 | 2,248 | 1,408 | 1,321 |
| Tax Audit Revenues | 226 | 52 | 52 | $52 |
| Subtotal: Taxes | $2,706 | $4,214 | $3,571 | $3,915 |
| Miscellaneous Revenues | 1,086 | 505 | 423 | 417 |
| Unrestricted Intergovernmental Aid | 32 | 0 | 0 | 0 |
| Less: Intra-City Revenues | (393) | 27 | 51 | 52 |
| Disallowances Against Categorical Grants | 0 | 0 | 0 | 0 |
| Subtotal: City-Funds | $3,431 | $4,746 | $4,045 | $4,384 |
| Other Categorical Grants | (38) | 32 | 34 | 35 |
| Inter-Fund Revenues | 27 | 37 | 39 | 40 |
| Federal Categorical Grants | 2,580 | 105 | 196 | 124 |
| State Categorical Grants | 1,968 | 1,724 | 1,637 | 1,595 |
| Total Revenues | $7,968 | $6,644 | $5,951 | $6,178 |
| Expenditures | ||||
| Personal Service | ||||
| Salaries and Wages | ($316) | ($847) | ($1,277) | ($1,505) |
| Pensions | (307) | (76) | 208 | 210 |
| Fringe Benefits | (262) | (39) | (94) | (132) |
| Subtotal-PS | ($885) | ($962) | ($1,163) | ($1,427) |
| Other Than Personal Service | ||||
| Medical Assistance | ($454) | $144 | ($145) | ($145) |
| Public Assistance | 817 | 0 | 0 | 0 |
| All Other | 6,309 | 6,924 | 5,996 | 5,483 |
| Subtotal-OTPS | $6,672 | $7,068 | $5,851 | $5,338 |
| Debt Service | ||||
| Principal | $0 | ($24) | $116 | $77 |
| Interest & Offsets | ($394) | ($147) | ($236) | ($170) |
| Subtotal Debt Service | ($394) | ($171) | ($120) | ($93) |
| FY 2024 BSA | $4,397 | ($4,397) | $0 | $0 |
| Capital Stabilization Reserve | ($250) | $0 | $0 | $0 |
| General Reserve | ($1,180) | $0 | $0 | $0 |
| Less: Intra-City Expenses | ($393) | $27 | $51 | $52 |
| Total Expenditures | $7,968 | $1,565 | $4,619 | $3,870 |
| Gap to be Closed | $0 | $5,079 | $1,332 | $2,308 |
Source: Mayor’s Office of Management and Budget
Note: Numbers may not add to totals due to rounding.
Table 4. Comptroller’s Re-estimates of the June 2024 Financial Plan
$ in millions, positive numbers decrease the gap and negative numbers increase the gap
| FY 2025 | FY 2026 | FY 2027 | FY 2028 | ||
|---|---|---|---|---|---|
| City Stated Gap | $0 | ($5,503) | ($5,592) | ($6,469) | |
| Revenues Differences | |||||
| Tax Revenues Differences | $290 | $200 | $64 | $562 | |
| Property Tax | (44) | (148) | 243 | 777 | |
| Personal Income Tax/PTET | 152 | 199 | (27) | (70) | |
| Business Taxes | (133) | (175) | (517) | (484) | |
| Sales Tax | 183 | 106 | 180 | 165 | |
| Real Estate Related Taxes | (120) | (41) | (90) | (79) | |
| Audit & All Other Taxes | 252 | 259 | 275 | 253 | |
| Non-Tax Revenues Differences | 120 | 134 | 108 | 98 | |
| Subtotal Revenues | $410 | $334 | $172 | $660 | |
| Expenditures Differences | |||||
| Underbudgeting | ($2,903) | ($2,832) | ($2,544) | ($2,453) | |
| Overtime | (730) | (480) | (430) | (430) | |
| Rental Assistance | (550) | (600) | (600) | (600) | |
| Shelter Capacity – Non-Asylum Seeker | (350) | (350) | (350) | (350) | |
| Prevailing Wage for Shelter Security Guards | (50) | (50) | (50) | (50) | |
| Public Assistance | (500) | (500) | (150) | 0 | |
| Contributions to MTA | (143) | (268) | (450) | (529) | |
| DOE Carter Cases | (540) | (410) | (340) | (340) | |
| DOE Custodial Costs | 0 | (154) | (154) | (154) | |
| DOE Charter Leases | (40) | (20) | (20) | 0 | |
| Fiscal Cliffs | (87) | (440) | (440) | (440) | |
| Pension Returns | 0 | 159 | 362 | 553 | |
| Foster Care Reimbursement Rate | 0 | (118) | (118) | (118) | |
| Temporary and Professional Services | (150) | 0 | 0 | 0 | |
| DOE Medicaid Revenue Shortfall | (60) | (60) | (60) | (60) | |
| Health Insurance Stabilization Fund – Reimbursement | (112) | 0 | 0 | 0 | |
| Collective Bargaining Agreements | (117) | (166) | (176) | (193) | |
| Full-Time Personnel Service Accrual Savings | 100 | 0 | 0 | 0 | |
| Subtotal Expenditures | ($3,329) | ($3,457) | ($2,976) | ($2,711) | |
| Total Comptroller Re-estimates | ($2,919) | ($3,123) | ($2,804) | ($2,051) | |
| Restated (Gap)/Surplus | ($2,919) | ($8,626) | ($8,396) | ($8,520) | |
| Longer Term Risks | |||||
| Asylum Seekers Expenses | 1,325 | (176) | (1,176) | (2,685) | |
| Class Size Mandate | 0 | (374) | (921) | (1,499) | |
| Restated (Gap)/Surplus with Longer Term Risks | ($1,594) | ($9,176) | ($10,493) | ($12,704) | |
Source: Office of the New York City Comptroller
II. The City’s Economic Outlook
U.S. economic data in the first half of this calendar year indicate a resilient national economy that has continued expanding, although at a slower rate of growth when compared to 2023—a slowing that was widely expected. And recent labor and inflation numbers also suggest that the economy is poised to remain in “soft landing” territory, where the Fed may see its inflation targets reached while the economy still grows moderately and without a significant spike in unemployment.
In New York City, employment growth has also slowed, with flat or declining payrolls in the city’s highest-wage industries, a concerning trend for the local economy. However, many other economic signs are not overtly negative including a low unemployment rate, subdued jobless claims, rising job openings, and historically high labor force participation rates. After appearing to loosen up last winter, the NYC housing market resumed the tautness seen last summer. And while the Manhattan office market remains impaired by changes spurred by the pandemic, it is showing initial signs of having bottomed out.
U.S. Economic Growth and Inflation
After having grown by an average seasonally adjusted annual rate of 4.1 percent in the second half of 2023, U.S. Real Gross Domestic Product rose at an average of 2.1 percent in the first half of 2024—with a weaker first quarter growth rate of 1.4 percent followed by surprisingly strong second quarter growth of 2.8 percent.
Meanwhile, recent data on price levels suggest that U.S. inflation has been in decline. The Consumer Price Index (CPI) fell in June 2024—only the second occurrence of a monthly decline since May 2020—lowering the 12-month increase in price levels to 3.0 percent, its lowest level in more than three years. June core CPI, which excludes volatile food and energy prices, was 3.3 percent over the previous 12 months. The overall Personal Consumption Expenditures (PCE) price index—which is what the Fed watches most closely for its targets and has been running about 0.7 percentage points lower than CPI in recent months—increased by 2.5 percent year-on-year In June 2024, slightly below the Fed’s most recent projection for the year. Core PCE inflation was at 2.6 percent in June.
Housing costs—which are a large component of the price indexes and include both the rental cost of housing and a rental-equivalent for owner-occupied housing—continue to outpace other components of U.S. inflation, with 5.2 percent growth over the 12 months in the June CPI data. Changes in the rental cost rate of inflation often lag other consumer price movements because of the effect of leases that last one or two years gradually rolling over. And while the Fed does not explicitly target the index without housing costs, the 12-month rate of core PCE inflation less housing has already reached the Fed’s target of 2.0 percent.
In contrast to the national trend, the rate of inflation in the NYC area has been rising in recent months. The 12-month price increase for all items was 4.2 percent in June 2024 while core inflation was 4.4 percent—up from their recent lows of 2.9 percent and 3.4 percent, respectively, in February. Key components driving the higher local rise in inflation include household energy prices which were up 13.0 percent over the year driven largely by electricity, shelter (which include rent and owners’ equivalent rent) growing 6.0 percent, and recreation rising 7.4 percent.
NYC Employment
NYC payroll employment growth has exhibited weaknesses in 2024. While slightly more than 38,000 private sector jobs have been added (0.9 percent) in the city in the first half of 2024 through June,[1] job growth has not been distributed evenly across industry sectors. In particular, the Health Care and Social Assistance sector alone has grown by nearly 38,000 jobs (3.9 percent) over this same period, with all other private industries combined contributing no net job growth. Chart 1 shows NYC job growth by industry over the past 12 months and plots this against average industry weekly earnings. The size of the bubbles in the chart indicates the relative share of each sector in NYC private employment. The chart demonstrates how job gains have concentrated in the city’s two lowest-wage industries while its higher-wage sectors have shown flat or declining payrolls.
Chart 1. June 2023-24 NYC Job Growth Mostly in Low-Wage Sectors
Source: NYS Department of Labor, Mayor’s Office of Management and Budget, and Office of the New York City Comptroller
Note: Bubble size indicates relative share of NYC private employment in the sector.
Job growth in the Health Care and Social Assistance industry has far outpaced OMB’s expectations for the sector during the full year. In its most recent projection from April’s Executive Budget, OMB forecasts flat payrolls for that sector for the four quarters ending in December 2024. The Comptroller’s Office had previously forecast around 25,000-30,000 additional jobs in the sector this year, a level that was exceeded already in May. OMB based its forecast on recent efforts by State lawmakers to curb the growth of Medicaid spending, especially of the Consumer Directed Personal Assistance Program (CDPAP). The ability of recently passed State legislation to meaningfully reduce the growth of CDPAP-related employment by consolidating its fiscal intermediaries in one statewide entity remains to be seen. Governor Hochul’s recent remarks on CDPAP signal that additional policy and enforcement interventions may be forthcoming.
Excluding Health Care and Social Assistance and Leisure and Hospitality, job growth in the other industry sectors has stalled. Employment in NYC’s high-wage Financial Activities sector has declined by 1,400 (-0.3 percent) so far this year, with a 3,600 jobs decline (-1.8 percent) in its highest-wage Securities sub-sector. These reductions are likely the result of ongoing staff trimming in response to the downward swing in industry profitability after 2021, and job growth elsewhere in the nation. The Comptroller’s Office expects Wall Street pre-tax profits to grow 23.0 percent in 2024, a projection that was so far corroborated by first quarter results showing a 67.7 percent increase. But after having planned its recent job reductions, the industry does not appear likely to respond immediately to profit improvements by reverting to big payroll increases over the next 2-3 years.
The Information sector—another high-wage industry in NYC that includes many internet and print-based content providers—has declined by 4,400 jobs (-2.0 percent) so far in 2024. This loss is worse than what was expected for the industry this year, considering that the strikes that shuttered many film and television related employers last year ended in the fall of 2023. Many of the Film and Television jobs appear to have returned, but at the same time there have been continued job losses in media, publishing, and other web-based content.
Professional and Business Services—another large, high-wage, office-based industry important to the NYC economy—has grown modestly in 2024, up 4,900 jobs (0.6 percent). Within this industry, the Employment Services sub-sector, which is largely made up of temporary employment providers, has lost 3,800 jobs (-4.3 percent). While not among the highest paying jobs within the sector, demand for temporary employment is often a leading indicator of future swings in more permanent jobs.
But there are also signs that, despite sluggish employment growth in many sectors, job markets are still relatively healthy. For most of this year, initial claims for unemployment insurance in NYC have been at or below their levels 12 months prior, and the four weeks ending August 3 were 6 percent below last year. Worker Adjustment & Retraining Notifications (WARN) for NY State—which log planned, impending job layoffs—have also retreated below their 2023 levels after having been elevated early in 2024. The job openings rate in NY State (as a percent of total employment) has risen in 2024 data through May, while the quits rate has also increased—seen as a sign that workers perceive strong job opportunities. The rate of unemployment in NYC was 4.8 percent in June, against a 5.2 percent average in 2023 and a 5.7 percent average in 2022. And the ratio of employment to (working-age) population—which factors in rising labor force participation—is also at an historically high level, as can be seen in Chart 2.
Chart 2. NYC Employment-to-Population Ratio vs Total Non-Farm Employment
Source: NY State Department of Labor
NYC Housing Market
While late-2023 showed signs that the rental housing market was easing, the first half of 2024 has seen the return of rising median rents and limited available inventory. After rising by 15.8 percent in 2023, the inventory of available rental properties listed on StreetEasy.com[2] has plateaued in 2024, rising only 0.6 percent in January through June as compared to the prior year. Available inventory in 2024 to-date remains 18.3 percent below the 2015-2019 average for comparable months. Median asking rent appeared to have peaked last summer, but recent growth has seen median rents turn back up, reaching a new high of nearly $3,600 in June 2024 (Chart 3).
Chart 3. NYC Median Rent Index & Available Rental Inventory
Source: StreetEasy.com
Note: *StreetEasy’s estimate of the typical market rent for a given geography for all units, whether they are currently available for rent or not. See https://www.zillow.com/research/zillow-rent-index-methodology-2393/ for full methodology
NYC Office Market
Still affected by the seemingly permanent shift toward hybrid work schedules, physical presence in Manhattan offices remains significantly below its 2019 level. A survey by the Partnership for NYC suggests that 56 percent of Manhattan office workers were in the office on an average weekday in late-April/early-May 2024, which equates to 72 percent of the pre-2019 attendance rate. This attendance average is slightly lower than that found in their prior survey in September 2023 (58 percent). Similarly, REBNY reports visitation to Manhattan offices at 74 percent (of 2019 level) in May 2024, up from 70 percent in May 2023, based on cell phone data from Placer.ai. But REBNY also notes a significantly higher rate of visitation in the most desirable office buildings, with “A+” offices at 86 percent of 2019 levels. This measure excludes new office buildings opened since 2019.
These conditions have left the market for NYC office space unmistakably diminished from its pre-pandemic era, but it nonetheless appears to have stabilized and is now showing a few signs of slow improvement. By the end of 2021, office availability rates had risen to 17 percent while market asking rents had fallen 7 percent citywide during the pandemic. But each of these measures has remained fairly steady since the end of 2021, and asking rents overall have been rising slightly for each of the last six quarters.
At the high end of the market, trends have been stronger: availability rates on 5-star properties (top tier buildings, as defined by CoStar) have retreated from elevated levels, despite a substantial volume of such space coming onto the market in just the past two years. In fact, since mid-2022, the amount of occupied five-star office space has increased by about 7 million square feet or 14 percent, as much of the new supply has been absorbed (see Chart 4). Rents on five-star space have fallen just 3-4 percent versus pre-pandemic, which compares favorably to rents on Class B & C properties which are down by about 10 percent. It should be noted, however, that rents are down by considerably more if viewed in inflation-adjusted terms.
Chart 4. Manhattan Five-Star Office Space: Total & Occupied Square Feet
Source: CoStar
Tourism
According to the City’s tourism agency, NYC Tourism + Conventions, there were 10 percent more visitors in NYC during 2023 than in 2022, but still 7 percent fewer than in 2019. Based on slower growth in the demand for hotel rooms in the first half of 2024—the 12-month growth in room nights was 5.8 percent in June 2024, down from 28.1 percent growth for the 12 months ending June 2023—the outlook for this year is for slower growth also in the number of tourists, likely below 5 percent. However, as the supply of hotel rooms adjusts with a lag, Manhattan hotel occupancy rates have continued to climb to 84 percent for the 12 months ending in June 2024, up from 80 percent in the previous 12 months. Average daily room rates are also up about by around 20 percent versus 2019, similar to the overall inflation rate in the U.S. during the same period.[3]
Risks to the NYC Economy
Recent economic news at the U.S. national level including a weak July employment report have raised questions for many about the risk of economic downturn. Financial market volatility and the potential for a decline in business and consumer sentiments, if they persist in the wake of such uncertainties, could have broader negative implications on the NYC economy.
A continuation of recent net job losses or stagnation in NYC’s higher-wage industries would be detrimental to the local economy. These industries sell their products and services largely outside of the city, and their income has important multiplier effects on the rest of NYC’s economy including local spending on leisure and retail, as well as commercial and residential real estate in the longer-term. Despite its apparent relative stability, the office sector remains subject to default risk that could reverberate through the financial system.
Continued rising residential rents and the persistence of an overall lack of available affordable housing for new residents can discourage both new and old businesses from locating and expanding jobs in NYC, especially in the higher-wage office-based industries that have shown recent payroll declines.
III. The FY 2025 Adopted Budget Overview of the FY 2025 Adopted Budget
The Adopted Budget for FY 2025 totals $112.43 billion. Nearly half of the total budget ($47.95 billion or 43 percent) is allocated for education and social services.[4] Other agency spending comprises about 30 percent of the budget ($34.20 billion). Spending on fringe benefits and pensions for City employees and retirees account for another 22 percent of budgeted spending ($24.28 billion). Debt service costs to fund the City’s capital program account for 3 percent ($3.67 billion, net prior year pre-payments). Budget payments for judgments and claims make up 0.8 percent ($887 million).
The Adopted Budget also includes a general reserve of $1.20 billion and a capital stabilization reserve of $250 million, which account for 1.3 percent of the budget. These reserves are typically spent down as the fiscal year progresses. Chart 5 shows the allocation of the FY 2025 budget by service areas and centrally budgeted expenditures, such as fringe benefits, debt service, and pension contributions.
Total prepayments for FY 2025 made in FY 2024 are $4.40 billion, all for debt service costs. This is less than FY 2023’s prepayment of FY 2024’s costs of $5.48 billion, meaning the City is projecting expenditures will exceed revenues by approximately $1.08 billion in FY 2024 (final numbers will be available in October when the Comptroller’s Office publishes the City’s financial statements).
Chart 5. FY 2025 Budget by Service Areas & Centrally Budgeted Expenditures
Note: *Denotes Centrally Budgeted Expenditures. Spending on Department of Education and City University of New York fringe benefits, which are reflected within each agencies’ respective budgets have been included in the fringe benefits category. Debt service is net of prepayments.
Source: Office of the New York City Comptroller
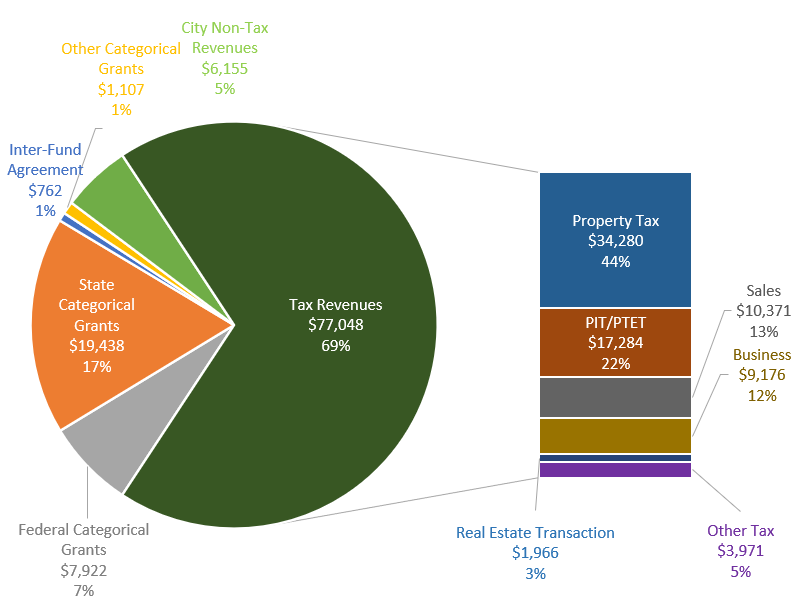
The majority the City’s spending (74 percent) is supported by City-funded revenues. Tax revenues, which OMB forecasts to total $77.05 billion account for the bulk of City-generated revenues, as shown in Chart 6. Real property taxes and personal income taxes account for more than two-thirds of projected tax revenues, with the property tax totaling $34.28 billion[5] (44 percent of tax revenues), followed by $17.28 billion in Personal Income Tax (PIT) and the closely related Pass Though Entity Tax or PTET (22 percent of revenues).[6] Non-tax City revenues, including interest income, charges for services, and revenues from licenses, permits, and franchises are projected to comprise 5 percent ($6.15 billion) of total FY 2025 revenues (net intracity transfers). The Comptroller’s Office provides its own—somewhat higher—estimates of City revenues in the Comptroller’s Office’s Re-estimates section of this report.
State categorical grants are forecast to be $19.44 billion (17 percent) of total FY 2025 projected revenues. Federal grants account for another $7.92 billion, or 7 percent, of FY 2025 projected revenues. Of the Federal revenues projected for FY 2025, $606 million or about 8 percent are COVID-19-related. Other categorical grants and inter-fund agreement (IFA) revenues comprise the remaining City revenues (about 1 percent each). IFA revenues are reimbursements from the Capital Projects Fund to the General Fund for costs related to the execution of capital projects. Chart 7 shows the funding allocation among the different service areas of the budget.
Chart 6. Funding Sources, FY 2025 Adopted Budget
($ in millions)
Source: Office of the New York City Comptroller
Note: City non-tax revenues include miscellaneous revenues less intra-city revenues, unrestricted governmental aid disallowance against categorial grants.
Chart 7. Funding Allocation by Service Area and Centrally Budgeted Expenditures for FY 2025
Note: Spending on Department of Education and City University of New York fringe benefits, which are reflected within each agencies’ respective budgets have been included in the fringe benefits category. Debt service is net of prepayments.
Source: Office of the New York City Comptroller
Changes from the FY 2025 Executive Budget
The $112.43 billion FY 2025 Adopted Budget is an $809 million increase over the Executive Budget released in April. City-funded revenue estimates increased by $450 million. The City raised its FY 2025 property tax forecast by $454 million to reflect the final assessment roll from the Department of Finance, which was offset slightly by a $4 million decrease in non-tax City revenues. State categorical grants increased by $291 million. More than half of that increase (a net $174 million) is from higher State education aid—largely formula-based Foundation aid, which was increased in the State’s Enacted Budget and only partially reflected in the Mayor’s Executive Budget. Federal aid increased by $67 million compared with the Executive Budget.
OMB also increased its FY 2024 tax revenue projections by a total of $198 million in the June Financial Plan released with the Adopted Budget. Miscellaneous revenues were increased by $160 million, while unrestricted aid increased by $14 million for a total increase of $372 million in City-funded revenue for the fiscal year that ended on June 30th. The biggest tax revenue revision was to the combined Personal Income Tax (PIT) and Pass-Through Entity Tax (PTET) which decreased by $349 million. However, this was more than offset by an upward revision to business taxes ($276 million), as well as smaller increases to other taxes and tax audit revenue.
The increase in City revenue in FY 2024, as well as some expense savings, allowed the City to increase its prepayment of FY 2025 debt service costs in FY 2024 by $459 million, freeing up FY 2025 resources for other expenditures.
Table 5. Changes to FY 2024 and FY 2025 City-Fund Estimates from the Executive Budget
| ($ in millions) | FY 2024 | FY 2025 |
|---|---|---|
| Gap to be Closed – Executive Plan | $0 | $0 |
| Revenues | ||
| Tax Revenues | $198 | $454 |
| Non-Tax Revenues | 160 | (4) |
| Unrestricted Aid | 14 | 0 |
| Total Revenue Changes | $372 | $450 |
| Expenditures | ||
| Agency Expenditure Changes | 152 | 676 |
| PEG – Expense | (105) | 0 |
| City Council Initiatives | 0 | 590 |
| Asylum Seekers | 40 | (5) |
| Pensions | (20) | (32) |
| Debt Service (PEG) | (124) | (170) |
| Labor Reserve Re-estimate | 0 | (150) |
| General Reserve | (30) | 0 |
| Total Expenditure Changes | ($87) | $909 |
| Gap to be Closed Before Prepayments | $459 | ($459) |
| FY 2024 Prepayment of FY 2025 Debt Service | ($459) | $459 |
| Gap to be Closed – Adopted Plan | $0 | $0 |
Source: Mayor’s Office of Management and Budget, Office of the New York City Comptroller
Note: Agency Expenditures include PEG restorations. There are about $43 million in Council Initiatives that the Mayor’s Office of Management and Budget classifies as agency expenditures as agreed upon by the Council and Mayor and funded on a one-year basis.
The upward revision to City-funds revenues and the $459 million increase in the prepayments of a portion of FY 2025 debt service allowed the City to increase other City-funded expenditures by $909 million compared with the Executive Budget, as shown in Table 5. Revisions to agency expenditures—including some restorations of cuts made through the Program to Eliminate the Gap (PEG) earlier in the City’s budget cycle—total $676 million. City Council Initiatives account for $590 million of this increase.[7] These additions are partially offset by decreases in planned FY 2025 spending on debt service ($170 million) and pensions ($32 million), as well as a reduction to the City’s labor reserve ($150 million), and a small ($5 million) decline in planned City-funded spending on asylum seekers in FY 2025.
Changes to City-Funded Agency Expenditures
The greatest revisions to agency expenditures in the Adopted Budget for FY 2025 compared with the Executive are to the Department of Education (DOE), where City-funded expenditures increased by $247 million. (Unless mentioned, all totals in this section exclude City Council Initiatives, which are described in more detail in a following section). The largest components of the DOE increase include $75 million in hold-harmless funding for schools that would otherwise see funding declines because of reduced enrollment and $75 million for early childhood education programs.[8] (See insert for more details of the changes to early childhood education funding, specifically 3K and Pre-K, over the last few years.) Other DOE changes include $32 million for the continuation of various initiatives previously supported by Federal stimulus funds, $20 million for school food services workers, and $18 million for community schools (including $4 million in Council Initiatives). All the aforementioned additions are for FY 2025 only—except for the funding for school food workers, which was also baselined in the outyears.
Revisions to expenditures at the Department of Social Services (DSS) in FY 2025 include $32 million for Community Food Connections, which provides funding to food pantries and community kitchens and had previously been funded with time-limited Federal COVID aid, $21 million added for the City’s Fair Fares program, and about $10 million for the City’s Shelter to Housing Action Plan.[9] The Fair Fares program provides half-priced fares for New York City Transit subways, buses, and Access-A-Ride paratransit trips for low-income New Yorkers. The increase in funding for Fair Fares in the Adopted Budget includes $11 million to expand eligibility by increasing the program’s income-limit for eligible households from 120 percent of the Federal poverty level ($18,072 for an individual) to 145 percent ($21,837 for an individual)[10], as well as $10 million in unspent FY 2024 funds rolled into FY 2025. Funding for all three of these DSS-administered programs was increased in FY 2025 alone.
Relative to the Executive Budget, the City also increased its funding for CUNY, by $37 million in FY 2025 only (excluding City Council Initiatives). This includes $15 million in general operating support to help reduce possible structural deficits as Federal COVID aid expires this year (CUNY received $111 million of Federal COVID aid in FY 2024). The City also added about $20 million to fund CUNY programs aimed at helping students graduate. These include $9 million for CUNY ACE (Accelerate, Complete, and Engage), $6 million for CUNY Reconnect, and $5 million for CUNY ASAP (Accelerated Study in Associate Programs). While funding was added for FY 2025, none of these additions are included in the outyears, and the Adopted Budget did not restore past baselined PEG cuts to the system either in FY 2025 or beyond, including $40 million in cuts taken as part of this budget cycle. In total, CUNY has undergone cumulative cuts of about $95 million per fiscal year due to City PEGs since January 2022.
Other changes, at a variety of agencies, include:
- The addition of $35 million to the budget of the Department of Cultural Affairs (DCLA) to fund multiple City cultural institutions, a $10 million increase in one-shot support for cultural groups, and $8 million to restore previously planned cuts to the City’s Cultural Institutions Groups (CIGs) and the Cultural Development Fund (CDF). Of these additions, only the restored cuts to the CIGs and the CDF are baselined in the outyears. (More information on the City’s PEG restorations, as well as City Council Initiatives to DCLA in the following sections.)
- The City added $25 million to the budget of the Administration of Children’s Services (ACS) for PromiseNYC, a program that provides childcare assistance to undocumented families (Funds were added for FY 2025 only).
- A total of $15 million was added for “Second Shift Cleaning” at city parks on nights and weekends in FY 2025 and baselined through the outyears. This addition of funds includes 343 full-time positions at the Parks Department. It comes after the City reduced the agency’s FY 2025 headcount by a net 651 full-time positions in budget updates from November through April as part of vacancy reductions, a hiring freeze, and other cost-cutting initiatives.
- At the Department for the Aging (DFTA), the City added $11 million to maintain senior food programs previously funded through COVID-19 Federal aid (for FY 2025 only) and $5 million for home delivered meals based on rate increases. (This latter change was baselined in the outyears and represents approximately $1 more per meal for the cost of groceries, food preparation, and delivery).[11]
3K/Pre-K Budget Highlights: June 2022 Plan through June 2024 Plan
Funding for the City’s 3K programs has fluctuated substantially over the City’s recent financial plans. In this section, the Comptroller’s Office examines changes in the multi-year funding for 3K and Pre-K included in each of the City’s June Financial Plans over the last three years. The programs are examined together because, in recent financial plans, OMB has reduced planned spending collectively for the two programs, without allocating the cuts to budget codes specific to either 3K or Pre-K.
As of the June 2024 Financial Plan, combined spending for 3K and Pre-K in FY 2025 is budgeted to total $1.63 billion, slightly less than the $1.67 billion currently budgeted for FY 2024 (final actual spending for FY 2024 will not be available until the City’s financial statements are released in October). In FY 2023, actual spending on the two programs was $1.68 billion—slightly above the FY 2025 and FY 2024 amounts. However, beginning in FY 2026, budgeted amounts fall more sharply, with $1.47 billion budgeted collectively for the two programs, a nearly 13 percent reduction in spending compared with FY 2023 actuals.
As described below, and shown in Table 6, budgeted amounts for these programs, particularly 3K, have swung dramatically over the past three years.
Table 6. 3K and Pre-K Financial Plan Details by Program
($ in millions)
| 3K | FY 2023 | FY 2024 | FY 2025 | FY 2026 | |
|---|---|---|---|---|---|
| June 2022 Financial Plan | $740 | $1,030 | $1,012 | $619 | |
| June 2023 Financial Plan | $769 | $761 | $634 | $634 | |
| June 2024 Financial Plan | $709 | $763 | $740 | $630 | |
| Pre-K | FY 2023 | FY 2024 | FY 2025* | FY 2026 | |
| June 2022 Financial Plan | $893 | $893 | $893 | $893 | |
| June 2023 Financial Plan | $907 | $893 | $893 | $894 | |
| June 2024 Financial Plan | $975 | $904 | $981* | $953 | |
| Combined 3K/Pre-K | FY 2023 | FY 2024 | FY 2025 | FY 2026 | |
| June 2022 Financial Plan | $1,633 | $1,922 | $1,904 | $1,511 | |
| June 2023 Financial Plan | $1,676 | $1,654 | $1,527 | $1,528 | |
| June 2024 Financial Plan (w/o unallocated reduction) | $1,684 | $1,667 | $1,722* | $1,583 | |
| June 2024 3K/Pre-K Financial Plan Savings | N/A | ($1) | ($91) | ($116) | |
| June 2024 Financial Plan Net Combined 3K/Pre-K Budget | $1,684 | $1,666 | $1,631* | $1,467 | |
Source: Office of the New York City Comptroller, Mayor’s Office of Management and Budget
Notes: Grayed amounts represent actual spending for FY 2023. While not represented here, FY 2027 and FY 2028 budgeted amounts are similar in each plan to FY 2026 totals.
*About $10 million of the funding added during Adoption in FY 2025 is currently allocated to a fringe holding code in the DOE budget. It is included in the funding shown in the table here as it will likely to be moved to the Pre-K budget codes in a future financial plan update.
- In the June 2022 Financial Plan, the budget for the City’s 3K program totaled $740 million for FY 2023, growing to $1.03 billion in FY 2024 and $1.01 billion in FY 2025, before falling to $619 million in FY 2028. This reflected the de Blasio Administration’s expansion of the 3K budget through the use of temporary Federal stimulus funds in FYs 2024 and 2025 only.
- Over the course of the following year, however, the Administration reduced the funding budgeted for the 3K program dramatically. The most significant change occurred in the November 2022 Financial Plan, which removed $568 million in City support for the 3K program in FY 2024. Using a spin-up (shifting forward) of FY 2025 Federal stimulus grants as an offset, the City was able to spread the impact evenly between FY 2024 and FY 2025, effectively lowering funding for the 3K program by $284 million in each year. Following other adjustments, by June 2023, the 3K budget totaled $761 million for FY 2024, a decrease of $269 million compared with the June 2022 funding level, and $634 million for FY 2025, a decrease of $378 million compared with one year earlier. The revised estimates also showed a year-over-year budgeted decline of about $127 million between FY 2024 and FY 2025, largely due to the drop off in Federal stimulus funding.
- Since June 2023, the 3K budget and the City’s Pre-K budget have become difficult to separate. As part of the citywide PEG program in the November 2023 and January 2024 Financial Plans, a $116 million annual reduction was assigned to the programs in FY 2025 through FY 2028, but it was left unallocated between 3K and Pre-K, making it impossible to isolate funding specific to each program.
- Subsequently, in the April 2024 Financial Plan, the City provided $92 million specifically for 3K, in FY 2025 only, as part of a larger set of actions to address fiscal cliffs resulting from expiring education stimulus grants. This shifted the large drop-off in funding until FY 2026. Further, during budget adoption, FY 2025 3K funding was raised by $21 million, Pre-K funding, specifically for special education seats, increased by $30 million, and the combined financial plan savings for 3K and Pre-K were reduced from $116 million to $91 million.
- As a result, apart from the yet-to-be known impact of the unallocated $91 million reductions, the 3K budget now totals $740 million in FY 2025. At $630 million, baseline 3K funding in FY 2026 and onward, remains essentially unchanged since the start of FY 2023 and could drop by as much as $116 million after planned funding reductions are allocated.
- The budget for Pre-K, which had been more stable, was increased over the last year (before the allocation of funding reductions).
Given all these machinations, where does this leave the budget for these programs? Because of the PEG reductions that remain unallocated to either of these programs, it becomes important to view the budget through the combined lens of both Pre-K and 3K. On a yearly basis, funding drops by $164 million between FY 2025 and FY 2026 for the two programs combined. But while the funding for Pre-K was increased, 3K remains underbudgeted even relative to the lower baseline established in FY 2023. Despite the additions in FY 2025, unallocated funding reductions for the two programs remain at $116 million annually in FY 2026 and out. OMB should provide a clear allocation of the unallocated 3K and Pre-K reductions so that the budget of each program can once again become clear.
PEG Restorations
In August 2023, OMB revised up the projected cost of providing services to asylum seekers by a combined $6.91 billion between FY 2024 and FY 2025. A month later, in September 2023, OMB announced a Program to Eliminate the Gap (PEG) to help close projected budget gaps. Agencies were notified of three cumulative PEG exercises over the upcoming financial plan updates (in November, January, and April), each expected to reduce City-funded spending by 5 percent, as well as a freeze on hiring and certain spending on other than personnel services (OTPS). The largest round of cuts was proposed in the November Plan, with spending reductions totaling $1.97 billion for FY 2025, with similar amounts in the outyears. PEG cuts in the January Plan were somewhat smaller, totaling $1.69 billion for FY 2025 and averaging $535 million in the outyears (net an average of $134 million in reversed cuts). In February, the Mayor announced the cancellation of the third PEG, apart from a reduction to estimates in asylum seeker spending, and eased the freeze on hiring and OTPS spending. The ensuing April Plan included $126 million in PEG savings, almost exclusively for asylum seeker costs, as well as the restoration of another $70 million in previously announced cuts for FY 2025.[12]
In the Adopted Budget, the City restored another $91 million in previously announced PEG cuts planned for FY 2025. This includes $70 million announced during this year’s budget cycle (November 2023 through April 2024), and $21 million for the City’s library systems announced in last year’s cycle.[13] Overall, PEG cuts announced during this year’s budget cycle but later restored total $269 million for FY 2025. Excluding debt service savings, this represents 7 percent of the $3.86 billion in total PEG initiatives announced for FY 2025 since November. For the outyears, again excluding debt service, restorations from this year’s cycle averaged $259 million or 10.9 percent of previously announced cuts.
The City’s library systems received the largest collective PEG restoration at Adoption—totaling $43 million in annual subsidies in FY 2025 and the outyears. This restores about $22 million in annual cuts announced during this budget cycle and about $21 million baselined in last year’s budget cycle. In addition, the City Council added $16 million of its discretionary funding to support library systems in the Adopted Budget. As with all Council Initiatives, this funding is for FY 2025 only, bringing the total increase to library subsidies to just over $58 million in FY 2025 (more details on Council Initiatives in the following section).
In addition to the $8 million baseline restoration for DCLA previously mentioned, other restorations added at Adoption include:
- Department of Youth and Community Development (DYCD): $20 million in funding for the City’s Summer Rising middle school cohort (in FY 2025 only).
- Department of Health and Mental Hygiene (DOHMH): Restores a baselined cut of $5 million to contracts for HIV-related program for all years of the Financial Plan.
- Department of Sanitation (DSNY): $6 million for a range of programs (all for FY 2025 only) including the Targeted Neighborhood Taskforce cleaning program, organics bins, lot cleaning, and a partial restoration of park perimeter and greenway cleaning.
- Office of the Criminal Justice Coordinator (OCJ): $2 million for Alternatives to Incarceration programming in FY 2025 only. This restoration does not fully reverse cuts from November 2023 of $7 million in FY 2025 and $9 million in FY 2026 and out. In addition to the restoration, the City Council added $14.5 million of its discretionary funding in FY 2025.
- Department for the Aging (DFTA): $1 million partial restoration for the older adult centers (from a January Plan cut of $2 million).
Asylum Seeker Costs
OMB did not change its overall estimates for asylum seeker costs for FY 2025, which total $4.75 billion. It did, however, reduce the City-funded portion slightly, by $5 million, and increased the State portion by the same amount, compared with the Executive Budget. The funding breakdown now stands at: $3.43 billion City-funded and $1.32 billion State-funded for FY 2025. The $5 million increase in State funding was rolled from FY 2024. Overall costs for FY 2024 total $3.79 billion, $35 million more than budgeted in the April Plan (a $40 million increase in City funding and a $5 million decrease in State funds).
While costs for FY 2025 through FY 2027 are relatively unchanged, the City did add costs in FY 2028 for these services—totaling $850 million ($500 million in City funds and $350 million in State). Prior to the June Plan, the City had only budgeted asylum seeker costs through FY 2027. See the Comptroller’s Re-estimate section for more details.
City Council Initiatives
City Council Initiatives included in the FY 2025 Adopted Budget total $590 million.[14] Through this discretionary funding, the Council supports non-profit organizations to meet a variety of local needs. Of the funding added (all for FY 2025 only), $177 million flows to non-profits through DYCD’s budget, followed by $73 million through DOHMH’s, $61 million through DSS, $49 million through DCLA, $42 million through DOE, and $40 million through DFTA, with the remainder split among other agencies. As previously mentioned, and as in past years, the City Council provided $16 million in subsidy support to the City’s libraries through its initiative funding.
Pension Changes
The Adopted Budget projects total pension expenditures of $10.24 billion for FY 2025, $32 million less than reflected in the Executive Budget. This net decrease is the result of several actions. Pension projections were revised downward in FY 2025 to reflect updated valuations by the City’s Office of the Actuary, based on various actuarial adjustments. However, the lower costs in FY 2025 were mostly offset by the impact of recent changes included in the State budget. This was primarily due to the reduction in the number of years used to determine the salary utilized to calculate pension benefits for certain Tier 3 and Tier 6 members of the New York City Retirement Systems (NYCRS). The City added $165 million in FY 2025 (increasing to $187 million in FY 2028) to fund this, and other smaller changes related to State legislation.
Debt Service
In addition to the $459 million increase to the prepayment of FY 2025 debt service costs in FY 2024, as previously described, projected debt service costs in FY 2025 (to be paid in FY 2025) decreased by a total of $170 million compared with the Executive Budget. The change is comprised of $180 million in Transitional Finance Authority Future Tax Secured (TFA-FTS) savings, offset by a $10 million increase in General Obligation (GO) debt service. TFA-FTS savings stems primarily from two changes: additional State Building Aid applied to TFA-FTS debt service costs, and the City shifting $1.50 billion of its planned FY 2025 issuance from TFA-FTS bonds to GO. This shift results in a more even balance of GO and TFA-FTS bonds issued in the fiscal year, a trend that is expected to remain through the Financial Plan. The additional issuance of $1.50 billion in GO bonds increases their respective debt service costs compared with the Executive Budget, but this expense is slightly offset by higher interest earnings on bond proceeds.
Changes to the City’s Total Full-Time Headcount
The Adopted Budget projects total full-time authorized headcount for FY 2025 at 299,566 positions. Compared with the Executive FY 2025 Financial Plan, authorized headcount for FY 2025 increased by 753 positions. The agencies that received most of this increase include: the Department of Sanitation (79 from PEG Restorations to Get Stuff Clean and Lot Cleaning programs, and 32 newly funded positions for Encampment and Lot Cleaning); Parks and Recreation (343 positions for Second Shift Cleaning); and the Department of Social Services (124 newly funded positions for the Shelter to Housing Action Plan).
As of July 31, the City’s full-time workforce is 284,383 with a vacancy rate of 5.1 percent against the FY 2025 Adopted Plan. See the NYC Agency Staffing Dashboard for more details by agency. A 2-for-1 hiring restriction, where one employee can be hired for every two that leave or retire, is still in effect for City agencies.
Chart 8. Full-Time Headcount, Actual vs Plan, FY 2017 – FY 2025
Source: Office of the New York City Comptroller, Mayor’s Office of Management and Budget
Note: Plan values are assigned to specific months – July through October are assigned the Adopted Plan value, November and December are the November Plan value, January through March are the Preliminary Plan value, April through May are the Executive Plan value, and June is the final June Plan value. Data on actual full-time employment is preliminary for May FY 2024 through July FY 2025; they are derived from initial payroll results and have not yet been published by OMB.
Capital Budget Changes
The FY 2025 Adopted Capital Budget totals $15.28 billion, an increase of $2.80 billion compared with the FY 2025 Executive Capital Budget. Of that, $1.08 billion was added for housing-related projects collectively at the Department of Housing Preservation and Development and New York City Housing Authority. (A total of $1 billion for housing projects was also added in FY 2026.) Education-related projects increased by $756 million for FY 2025. The education funding includes $500 million to comply with the Enacted New York State Budget’s mandate that the City increase funding for the School Construction Authority by $2 billion to reduce class size. (In each of FY 2026 through FY 2028, $500 million was also added to the City’s education capital budget for this purpose, for a total of $2 billion over four years.) The City’s Adopted Capital Commitment Plan, typically released in the fall, will provide additional details on planned capital spending.
FY 2025 Budget Compared with FY 2024 Modified Budget
As shown in Table 7, total revenues in the FY 2025 Adopted Budget are $2.65 billion less than the final modified for FY 2024 budget, a drop of 2.3 percent. The decline is primarily due to less Federal categorical aid compared with FY 2024, which is partially offset by higher projected tax revenues in FY 2025. The $4.98 billion drop in Federal aid largely stems from less COVID assistance from the various Federal relief packages, particularly American Rescue Plan Act (ARPA) Education Aid. Overall, Federal COVID-19 related relief is expected to fall by about $3.02 billion in FY 2025.
OMB forecasts that tax revenues will grow by $3.20 billion in FY 2025 compared with FY 2024, a 4.3 percent increase. This is largely due to higher forecast receipts from the PIT/PTET and property taxes. OMB forecasts PIT/PTET will grow by $1.63 billion (10.4 percent), with the high rate of growth largely a result of revenues having been reduced in early FY 2024 by continued reimbursements for PIT and PTET overpayments made in FY 2023. Property tax revenues will grow by $1.28 billion (3.9 percent) in FY 2025 compared with FY 2024 as assessments continue to recover from the COVID-19 related drop in FY 2022. As described in the re-estimates section of the report, this Office projects somewhat higher tax revenues than OMB in FY 2025 and in each year of the financial plan.
Table 7. Revenues Comparison, Final Modified FY 2024 versus Adopted FY 2025
| FY 2024 | FY 2025 | $ Change | % Change | |
|---|---|---|---|---|
| Revenues | ||||
| Taxes: | ||||
| General Property Tax | $32,998 | $34,280 | $1,282 | 3.9% |
| Other Taxes | 39,900 | 41,995 | 2,095 | 5.3% |
| Tax Audit Revenues | 947 | 773 | (174) | (18.4%) |
| Subtotal Taxes | $73,845 | $77,048 | $3,203 | 4.3% |
| Miscellaneous Revenues | 8,894 | 8,123 | (771) | (8.7%) |
| Unrestricted Intergovernmental Aid | 32 | 0 | (32) | 100.0% |
| Less: Intra-City Revenues | (2,383) | (1,953) | 430 | (18.0%) |
| Disallowances Against Categorical Grants | (15) | (15) | – | 0.0% |
| Subtotal City Funds | $80,373 | $83,203 | $2,830 | 3.5% |
| Other Categorical Grants | 1,044 | 1,107 | 63 | 6.0% |
| Inter-Fund Revenues | 747 | 762 | 15 | 2.0% |
| Federal Categorical Grants | 12,899 | 7,922 | (4,977) | (38.6%) |
| State Categorical Grants | 20,019 | 19,438 | (581) | (2.9%) |
| Total Revenues | $115,082 | $112,432 | ($2,650) | (2.3%) |
Source: Office of the New York City Comptroller
Note: Totals may not add due to rounding.
Expenditures—as presented in the FY 2025 Adopted Budget—reflect the impact of prepayments, which shift spending between fiscal years. Similarly, the FY 2024 final modified budget is impacted by FY 2023 and FY 2024 prepayments. As shown in Table 8, after netting out prepayments, total expenditures before reserves and prior-year adjustments for FY 2025 are $115.38 billion, a decrease of $1.17 billion or 1.0 percent compared with the similarly adjusted FY 2024 total.
This decline is due to a $4.28 billion budgeted reduction in other than personnel services (OTPS spending, offset by a $2.39 billion increase in personnel services (PS)spending, and a $723 million increase in debt service costs. Most of the decline in OTPS costs comes from lower budgeted spending for contractual services in FY 2025 than FY 2024—budgeted to fall by $3.79 billion. Just under half of the decline in contractual service spending ($1.76 billion) is the result of lower COVID-19 stimulus-funded expenditures. As outlined in the re-estimate section on this report, the Comptroller’s Office projects that many City-funded OTPS costs, including contractual costs, reflected in the decrease in the year-over-year comparison are underbudgeted and that actual FY 2025 costs will be greater than currently planned.
On the PS side, most of the $2.39 billion in higher costs in FY 2025 compared with FY 2024 comes from increased pension costs ($1.01 billion) and health insurance costs ($821 million). The higher pension costs in FY 2025 over FY 2024 includes $279 million held in reserve for potential costs associated with the actuarial audit—a reserve that was zeroed out for FY 2024. The final audit results will be released this fall, after which adjustments to the amount needed in this reserve may be made. The increase of health insurance from FY 2024 reflects projected premium rate increases of 7.7 percent for active employees and pre-Medicare retirees and 4.7 percent for the senior care rate.
Table 8. FY 2025 Expenditures vs. FY 2024 Expenditures Adjusted for Prepayments
| ($ in millions) | FY 2024 | FY 2025 | $ Change | % Change |
|---|---|---|---|---|
| Personnel Services (PS) | ||||
| Salaries and Wages | $32,296 | $32,597 | $300 | 0.9% |
| Pensions | 9,223 | 10,235 | 1,012 | 11.0% |
| Health Insurance | 8,314 | 9,135 | 821 | 9.9% |
| Other Fringe Benefits | 4,658 | 4,914 | 256 | 5.5% |
| Subtotal-PS | $54,492 | $56,880 | $2,389 | 4.4% |
| Other Than Personnel Services (OTPS) | ||||
| Medicaid | 6,326 | 6,743 | 417 | 6.6% |
| Public Assistance | 2,467 | 1,650 | (816) | (33.1%) |
| Judgements & Claims | 1,315 | 877 | (437) | (33.3%) |
| Contractual Services | 26,789 | 22,999 | (3,790) | (14.1%) |
| Other OTPS | 17,811 | 18,160 | 349 | 2.0% |
| Subtotal-OTPS | $54,707 | $50,429 | ($4,278) | (7.8%) |
| Debt Service | $7,346 | $8,069 | $723 | 9.8% |
| Expenditures Excluding Reserves | $116,544 | $115,379 | ($1,166) | (1.0%) |
| Prior Year Payable Adjustment | (400) | – | 400 | |
| BSA and Discretionary Transfers | (1,082) | (4,397) | (3,315) | |
| General Reserve | 20 | 1,200 | 1,180 | |
| Capital Stabilization Reserve | – | 250 | 250 | |
| Total Expenditures | $115,082 | $112,432 | ($2,651) | (2.3%) |
Note: Excludes contractual services for debt service and Medicaid.
Source: Office of the New York City Comptroller, Mayor’s Office of Management and Budget
The Outyears
While the FY 2025 budget is balanced, the June 2024 Financial Plan presents budget gaps of $5.50 billion in FY 2026, $5.59 billion in FY 2027, and $6.47 billion in FY 2028. Projected gaps have increased since the April Financial Plan: by $50 million in FY 2026, $140 million in FY 2027, and $723 million in FY 2028.
Total revenues are expected to grow by 4.0 percent from $112.43 in FY 2025 in the current year to $116.89 in FY 2028. Expenditures, as budgeted, are projected to grow by 9.7 percent in FY 2028 to $123.36 billion. As previously discussed, however, FY 2025 expenditures are reduced by pre-payments of debt service in FY 2024. After adjusting for prepayments, growth in expenditures before reserves is lower at 5.7 percent, although it still outpaces revenue growth. As shown in Table 9, most of the growth in spending over the Plan period comes from PS-related costs, including salaries and wages, pension, and health insurance. OTPS costs are budgeted to fall by 5.1 percent from FY 2025 to FY 2028. As previously mentioned, and as outlined in the following Re-Estimates section, however, the Comptroller’s Offices estimates that many outyear OTPS costs are underbudgeted in the current Financial Plan.
Table 9. FY 2025- FY 2028 Expenditure Growth, Adjusted for Prepayments and Reserves
| ($ in millions) | FY 2025 | FY 2026 | FY 2027 | FY 2028 | $ Change FY 25-28 |
Percent Change FY 25-28 |
Percent Annual Growth |
|
|---|---|---|---|---|---|---|---|---|
| Personnel Services (PS) | ||||||||
| Salaries and Wages | $32,597 | $33,537 | $34,527 | $35,482 | $2,885 | 8.9% | 2.9% | |
| Pensions | 10,235 | 10,980 | 11,165 | 12,199 | $1,965 | 19.2% | 6.0% | |
| Health Insurance | 9,135 | 9,671 | 10,066 | 10,483 | $1,348 | 14.8% | 4.7% | |
| Other Fringe Benefits | 4,914 | 5,094 | 5,278 | 5,470 | $556 | 11.3% | 3.6% | |
| Subtotal-PS | $56,880 | $59,283 | $61,037 | $63,634 | $6,754 | 11.9% | 3.8% | |
| Other Than Personnel Services (OTPS) | ||||||||
| Medicaid | $6,743 | $6,583 | $6,733 | $6,883 | $140 | 2.1% | 0.7% | |
| Public Assistance | 1,650 | 1,650 | 2,000 | 2,463 | $813 | 49.3% | 14.3% | |
| Judgements & Claims | 877 | 823 | 840 | 862 | ($15) | (1.7%) | (0.6%) | |
| Contractual Services | 22,999 | 23,801 | 23,207 | 20,993 | ($2,006) | (8.7%) | (3.0%) | |
| Other OTPS | 18,160 | 15,343 | 15,706 | 16,647 | ($1,512) | (8.3%) | (2.9%) | |
| Subtotal-OTPS | $50,429 | $48,200 | $48,486 | $47,849 | ($2,580) | (5.1%) | (1.7%) | |
| Debt Service | $8,069 | $8,887 | $9,605 | $10,430 | $2,360 | 29.3% | 8.9% | |
| Expenditures Excluding Reserves | $115,379 | $116,370 | $119,128 | $121,913 | $6,534 | 5.7% | 1.9% | |
| BSA and Discretionary Transfers | ($4,397) | $0 | $0 | $0 | $4,397 | (100.0%) | (100.0%) | |
| General Reserve | $1,200 | $1,200 | $1,200 | $1,200 | $0 | 0.0% | 0.0% | |
| Capital Stabilization Reserve | $250 | $250 | $250 | $250 | $0 | 0.0% | 0.0% | |
| Total Expenditures | $112,432 | $117,820 | $120,578 | $123,363 | $10,931 | 9.7% | 3.1% | |
Source: Office of the New York City Comptroller, Mayor’s Office of Management and Budget
As show in Table 10 total tax revenues are projected to grow by 7.9 percent from FY 2025 to FY 2028, with annual average growth of 2.6 percent. Overall revenue growth is reduced by a 5.1 percent decline in non-City Funds, partially due to the expiration of Federal COVID-19 aid.
Table 10. FY 2025- FY 2028 Revenue Growth
| ($ in millions) | FY 2025 | FY 2026 | FY 2027 | FY 2028 |
Percent Growth |
Percent |
|---|---|---|---|---|---|---|
| General Property Tax | $34,280 | $34,744 | $35,780 | $36,470 | 6.4% | 2.1% |
| Non-Property Tax | 42,768 | 43,299 | 45,056 | 46,662 | 9.1% | 2.9% |
| Subtotal Tax Revenues | $77,048 | $78,043 | $80,836 | $83,132 | 7.9% | 2.6% |
| Non-Tax Revenues | 6,155 | 6,033 | 5,987 | 6,022 | (2.2%) | (0.7%) |
| Subtotal City-Funds | $83,203 | $84,076 | $86,823 | $89,154 | 7.2% | 2.3% |
| Federal Categorical Grants | 7,922 | 7,251 | 7,151 | 7,226 | (8.8%) | (3.0%) |
| State Categorical Grants | 19,438 | 19,114 | 19,135 | 18,638 | (4.1%) | (1.4%) |
| Other Categorical Grants | 1,107 | 1,105 | 1,105 | 1,104 | (0.3%) | (0.1%) |
| IFA Revenues | 762 | 771 | 772 | 772 | 1.3% | 0.4% |
| Subtotal Non-City-Funds | $29,229 | $28,241 | $28,163 | $27,740 | (5.1%) | (1.7%) |
| Total | $112,432 | $112,317 | $114,986 | $116,894 | 4.0% | 1.3% |
Source: Office of the New York City Comptroller, Mayor’s Office of Management and Budget
Reserves
In addition to the general reserve and the capital stabilization reserve, which are included within the expense budget, the City has access to about $1.96 billion in long-term reserves available in its rainy-day fund, the Revenue Stabilization Fund (RSF).
There are currently no rules governing deposits into or withdrawals out of the RSF. The Comptroller’s Office has advocated for the adoption of a rainy-day fund policy, including proposing a formula for annual minimum deposits. The proposal calls for depositing at least 50 percent of the difference between current year growth of City’s non-property tax revenue and its average growth rate in the previous six-years (when positive). Because non-property taxes are expected to drop in FY 2024, mainly due to lower PIT/PTET collections, a minimum deposit would not be required in FY 2024. Non-property tax revenues are expected to rebound in FY 2025. Based on both the Comptroller’s Office’s current tax forecast, as well as OMB’s, a deposit should be made according to the formula in FY 2025—although none has been budgeted. Based on the formula, should the Comptroller’s Office’s revenue assumptions be met, the City should deposit $240 million into the RSF in FY 2025. Based on OMB’s lower revenue projections, the City should deposit $150 million into the RSF in FY 2025.
The City also has $4.8 billion in the Retiree Health Benefits Trust.[15] While it historically has been used as such, the RHBT is not a true rainy-day fund as it was intended to cover the long-term liability deriving from retiree health care benefits.
IV. Comptroller’s Office Re-Estimates
The Comptroller’s Office restates the City’s projected gaps and surpluses based on its own estimates of revenues and expenditures. As shown in Table 4, the Comptroller’s Office restates this gap with and without two more uncertain expenditure re-estimates: costs related to asylum seekers and the mandated reduction of class size.
Projecting the number of asylum seekers arriving in the City, and the cost of providing services to them, is challenging. While the population dropped at the beginning of 2024 and has remained relatively stable since March, future trends are still difficult to predict. Furthermore, little data is made available by the Administration on the actual costs of providing shelter and services, making an independent projection impossible. There is also still much uncertainty about the implementation of the State’s mandate to reduce class size in City schools, which carries budgetary risks starting in FY 2026.
Excluding these two costs, the Comptroller’s Office projects a gap of $2.92 billion in FY 2025, 2.6 percent of total revenues. The Comptroller’s Office is projecting higher gaps than OMB in each outyear. For FY 2026, The Office projects gaps of $8.63 billion in FY 2026, $8.40 billion in FY 2027, and $8.52 billion in FY 2028 (averaging 7.4 percent of total revenues).
Including this Office’s re-estimate of asylum seeker costs reduces the restated gap in FY 2025 to $1.59 billion (1.4 percent of total revenues), as the City has yet to reflect in its estimates the reduction in the census that began in early calendar year 2024. In the outyears, however, including asylum seeker re-estimates and the costs of the class size mandate increases restated gaps to $9.18 billion in FY 2026, growing to $12.70 billion in FY 2028 (averaging 9.4 percent of total revenues).
Revenues
The Comptroller’s Office estimates that City-funded revenues, including tax and non-tax revenue, will exceed OMB’s projections in each year of the Plan – by $410 million in FY 2025, $334 million in FY 2026, $172 million in FY 2027, and $660 million in FY 2028.
Most of the annual difference is driven by higher estimates of tax revenues, as show in Table 11. Overall, the Comptroller’s Office tax revenue estimates exceed OMB’s by $290 million, or 0.4 percent, in FY 2025. The difference narrows to $200 million in FY 2026 and $64 million in FY 2027 but increases again to $562 million in FY 2028 because of a higher projection of real property tax revenues in that year.
Property Taxes
Due to higher final property values for the FY 2025 tax roll, the Comptroller’ Office projects FY 2025 property tax revenue of $34.24 billion, $242 million more than in the forecast published in May. This is an increase of 3.8 percent from final forecasted values for FY 2024. Property tax revenues are projected to slow, growing at an average annual rate of only 2.9 percent through FY 2028 when property tax collections are expected to reach $37.25 billion. The Comptroller’s Office’s property tax forecast is lower than OMB’s by $44 million in FY 2025 and by $148 million in FY 2026, and exceeds OMB’s by $243 million in FY 2027 and $777 million in FY 2028. The difference between the Comptroller’s and OMB’s forecast from FY 2024 to FY 2027 is due to the projection of the property tax reserve. The reserve is made up of payments for prior-year liabilities, and non-collectable amounts due to delinquencies, overpayments, refunds and abatements. For FY 2028 the difference is primarily due the Comptroller’s forecast of a higher levy.
Non-Property Taxes and Miscellaneous Revenues
The Comptroller’s Office estimates that taxes other than general property tax will total $43.10 billion in FY 2025, $334 million higher than forecast for that year by OMB. Most prominently, the Comptroller’s Office projects larger collections than OMB for sales taxes, PIT/PTET, and tax audits while projecting lower revenues from business income taxes.
The sales tax forecast is $183 million above OMB’s projection in FY 2025, attributable to relatively faster economic growth in calendar year 2024. For the same reason, the Comptroller’s Office estimates for combined PIT and PTET exceed OMB’s forecasts by $152 million (0.9 percent) in FY 2025 and $199 million in FY 2026 (1.1 percent). The estimates are much closer in FY 2027 and FY 2028, despite slower underlying wage income growth in the Comptroller’s economic forecast. OMB projects higher business taxes than the Comptroller’s Office in each fiscal year 2025-2028, as the Comptroller’s Office is expecting historically high profit rates to decline somewhat.
The Comptroller’s Office estimates miscellaneous revenues will total $120 million more than OMB’s projection for FY 2025, due to $100 million in interest income on cash balances and $20 million in fines. The difference between the Comptroller’s Office and OMB increases slightly to $134 million in FY 2026 before falling to $98 million in FY 2028.
Table 11. Comparison of Tax Revenue Projection
| FY 2024 | FY 2025 | FY 2026 | FY 2027 | FY 2028 | ||
|---|---|---|---|---|---|---|
| Property | Comptroller | $32,997 | $34,236 | $34,596 | $36,023 | $37,247 |
| Mayor | 32,998 | 34,280 | 34,744 | 35,780 | 36,470 | |
| PIT/PTET | Comptroller | 15,618 | 17,436 | 17,673 | 18,374 | 19,067 |
| Mayor | 15,652 | 17,284 | 17,474 | 18,401 | 19,137 | |
| Business Taxes | Comptroller | 9,545 | 9,043 | 8,657 | 8,447 | 8,655 |
| Mayor | 9,345 | 9,176 | 8,832 | 8,964 | 9,139 | |
| Sales Taxes | Comptroller | 9,967 | 10,554 | 10,928 | 11,418 | 11,891 |
| Mayor | 9,967 | 10,371 | 10,822 | 11,238 | 11,726 | |
| Real Estate-Related | Comptroller | 1,744 | 1,846 | 2,046 | 2,183 | 2,307 |
| Mayor | 1,731 | 1,966 | 2,087 | 2,273 | 2,386 | |
| Other | Comptroller | 3,153 | 3,250 | 3,370 | 3,482 | 3,554 |
| Mayor | 3,205 | 3,198 | 3,311 | 3,407 | 3,501 | |
| Audits | Comptroller | 947 | 973 | 973 | 973 | 973 |
| Mayor | 947 | 773 | 773 | 773 | 773 | |
| Total | Comptroller | $73,971 | $77,338 | $78,243 | $80,900 | $83,693 |
| Mayor | $73,845 | $77,048 | $78,043 | $80,836 | $83,132 |
Source: Office of the New York City Comptroller, Mayor’s Office of Management and Budget
Expenditures
The Comptroller’s Office estimates expenditures will be higher than OMB in each year of the FY 2025 Adopted Budget and June 2024 Financial Plan. Excluding this Office’s re-estimates of asylum seeker costs and of the class size mandate, the Comptroller’s Office projects that City-funded expenditures will be greater than budgeted by $3.33 billion in FY 2025, $3.46 billion in FY 2026, $2.98 billion in FY 2027, and $2.71 billion in FY 2028. Including the re-estimates of costs related to asylum seekers and the class size mandate results in a lower expenditure difference in FY 2025, $2.00 billion, but higher in every following year—growing to a $6.89 billion difference by FY 2028.
Chronic Underbudgeting
The largest collective source of the expenditure differences between OMB and the Comptroller’s Office are chronically underbudgeted costs. These are costs that can be reasonably expected to be incurred and that are tied to ongoing programs with established spending patterns. However, instead of being included in the Financial Plan, the costs are recognized incrementally when budget modifications are presented. This Office estimates $2.90 billion in chronically underbudgeted costs in FY 2025, and an average of about $2.61 billion annually in the outyears.
As shown in Table 12, in FY 2025 the largest difference in estimates is City funding for overtime, which the Comptroller’s Office estimates will reach $2.3 billion, $730 million more than included in the Adopted Budget. Most of the additional funding ($473 million) is projected for uniformed Police overtime costs, which this Office estimates will reach $950 million, essentially level with this Office’s estimate of $925 million for FY 2024.
Following overtime, the next largest underbudgeted cost is rental assistance. The Comptroller’s Office estimates an additional $550 million will be required to fund the City’s rental assistance programs administered by DSS. These costs have been growing in recent years following reforms to increase payment standards and eligibility: since the start of FY 2022 liquidations have grown at an average monthly rate of nearly 4 percent. Even assuming that the monthly growth rate halves during FY 2025, as currently implemented, rental assistance costs could exceed $1.25 billion.[16] In contrast, the FY 2025 budget only includes funding for $706 million (a year-over-year drop of 16.8 percent compared with FY 2024 budgeted expenditures), and even less is included in the outyears.[17] This re-estimate of costs, however, does not include the impact of expanding the City’s rental assistance programs to households at-risk of eviction. Just over a year ago, the City Council passed legislation over the Mayor’s veto that would substantially expand eligibility to the CityFHEPS rental assistance program. However, the Administration has not implemented most of the legislative changes and was sued by the Legal Aid Society. On August 1, 2024, a judge struck down the suit, ruling that the City Council lacked the authority to expand eligibility for the program.[18] The City Council, which joined the lawsuit, has indicated it will appeal the ruling. Given the uncertainty tied to the litigation, the Comptroller’s Office does not include a risk from the expansion of the program in its re-estimates.[19]
Several DOE costs, such as special education Carter cases and charter school leases, are also underbudgeted, by $540 million and $40 million, respectively for FY 2025. The cost of public assistance, homeless shelters (outside the costs for asylum seekers), and subsidies for the Metropolitan Transportation Authority (MTA) will also projected to be higher than planned[20].
Fiscal Cliffs
As previously described, much of the Federal COVID-19 aid that the City has been receiving over the past several years expires in FY 2025. While the City has added funding to cover many of the longer-term programs previously paid for by this aid (largely DOE programs) for some programs, funds have only been added in FY 2025. This creates fiscal cliffs into the outyears. The Comptroller’s Office estimates $87 million is necessary to fund Federal COVID-19-related fiscal cliffs in FY 2025, growing to $440 million in the outyears. The outyear totals include several DOE programs, such as Summer Rising, contracted nursing, and others, as well as food assistance programs at DSS and DFTA.
Pension Savings
Pension investment returns above the Actuarial Interest Rate (AIR) of 7 percent in the Financial Plan allow the City to decrease its contributions to fund pension costs. The combined FY 2024 pension returns averaged 10.0 percent. This will allow the City to decrease its pension costs by $159 million in FY 2026, $362 million in FY 2027, and $553 million in FY 2028.
Other Expenditures
Other expenditure re-estimates include higher than budgeted spending on temporary and professional services in FY 2025 and increased funding for foster care contracts. The Comptroller’s Offices also projects that the City will not receive a $112 million budgeted payment from the City’s Health Insurance Stabilization Fund to offset healthcare costs for City employees and that an equal amount of City-funds will be required to make up for the revenue loss.[21]
In addition, spending projections in the June Plan do not assume assistance from the City for wage increases for nurses that are above the pattern the City established in its contract settlement with DC 37 last year. The increase stems from an arbitration award granted to the New York State Nurses Association (NYSNA) to establish parity with private sector nurses. The cost above the wage pattern is projected to range roughly between $120 million in FY 2025 and $190 million in FY 2028.
One area where the Comptroller’s Office estimates slightly lower costs than OMB for FY 2025 is non-overtime, full-time personnel spending. The Comptroller’s Office estimates about $100 million less than currently budgeted will be spent. This assumes, however, hiring increases given the easing of the City’s hiring freeze. If the City’s full-time workforce stays at current levels or falls, savings could be greater.
Asylum Seekers
The Comptroller’s Office estimates that the cost of providing shelter and services to asylum seekers will total $3.42 billion in FY 2025 and $3.18 billion in each of the outyears. For FY 2025 and FY 2026, this is less than currently budgeted. OMB estimates total $4.75 billion in FY 2025, $4.0 billion in FY 2026, $3 billion in FY 2027, and $850 million in FY 2028. In FY 2027 and FY 2028, budgeted costs are “placeholder” assumptions.
The lower estimate in the near term is due to this Office’s lower projection of the number of households in shelter and lower projected per diem spending. The Administration has not adjusted its shelter growth rate projections since the January Plan, using a growth rate of 28 households per day through September FY 2025 and holding the population constant afterward. Based on the trend established in 2024, the Comptroller’s Office uses a decrease of 2.3 households per day beginning in April 2024 through the end of FY 2025 and holds the census constant afterward. (For more details on the Comptroller’s Office projection and its comparison to OMB’s, see its Comments on the New York City FY 2025 Executive Budget.)
Given commitments of asylum seeker aid by the State, the Comptroller’s Office estimates that the cost to the City in FY 2025 will total $2.11 billion, with $1.31 billion funded by the State. The financial plan assumes State aid of $1 billion in each of FY 2026 and FY 2027, and $350 million in FY 2028. Because the aid is not included in the State financial plan, the Office of the Comptroller considers these amounts as expense risks for the City.
As a result of these factors, the Comptroller’s Office estimates that City-funded asylum seeker costs will be $1.33 billion less than currently budgeted in FY 2025, but higher than currently budgeted in the outyears. The Comptroller’s Office estimates additional City-funded costs of $176 million in FY 2026, $1.18 billion in FY 2027, and $2.69 billion in FY 2028.
The Comptroller’s Office acknowledges the high degree of uncertainty around these estimates due to the lack of clarity around Federal policy over time, as well as changes to City policy. This includes the implementation of shelter time limits and the slow pivot from emergency contracts to competitive procurement.
Class Size Mandate
The State’s class size reduction mandate requires New York City to phase in smaller class size caps over a five-year period and to achieve full compliance by September 2028. The State has given no indication that it would provide the City with any additional funding specifically for the implementation of this law.
Given that the system currently has a 40-percent compliance rate, new costs from hiring additional teachers will not materialize until the third year of the phase-in period, or FY 2026. As noted in its recent certification letter, the Comptroller’s Office estimates that, at full implementation in FY 2028, the additional cost not yet included in the City’s financial plan ranges between $1.50 billion and $1.65 billion.
Based on the updated DOE Class Size Report for FY 2023-2024, the Comptroller’s Office estimates that 14,445 additional teachers will be needed to be hired to reach compliance at full implementation. Using data from the UFT Salary Schedule for teachers (as of January 2025), the analysis assumes that salaries for new hires will range between $66,733 (low), $68,973 (middle) and $73,113 (high) depending on the education background, with added fringe benefits and pension costs of 52 percent. Costs ramp up over three years, with FY 2026 costs ranging between $374 million and $422 million, FY 2027 costs ranging between $921 million and $1.02 billion, and FY 2028 full implementation costs ranging between $1.5 billion and $1.65 billion.
The DOE currently estimates that it would need to hire 12,000 teachers and spend between $1.4 billion and $1.9 billion annually by FY 2028 to comply with the mandate. The higher end of the estimate represents a more inclusive funding approach through Fair Student Funding (FSF), whereby the per-student funding amount would be increased across all schools to support a higher teacher to student ratio, regardless of whether a school already achieves the class size targets. The DOE’s lower estimate, like the Comptroller’s Office’s estimate, assumes funding is provided specifically for the classroom teachers needed to meet the mandate.
Failure to meet the mandates could trigger financial penalties in terms of reduced education State aid, which could impact the gap estimates.
Table 12. Comptroller’s Re-estimates of the Adopted FY 2025 Budget and June Financial Plan
$ in millions, positive numbers decrease the gap and negative numbers increase the gap
| FY 2025 | FY 2026 | FY 2027 | FY 2028 | ||
|---|---|---|---|---|---|
| City Stated Gap | $0 | ($5,503) | ($5,592) | ($6,469) | |
| Revenues Differences | |||||
| Tax Revenues Differences | $290 | $200 | $64 | $562 | |
| Property Tax | (44) | (148) | 243 | 777 | |
| Personal Income Tax/PTET | 152 | 199 | (27) | (70) | |
| Business Taxes | (133) | (175) | (517) | (484) | |
| Sales Tax | 183 | 106 | 180 | 165 | |
| Real Estate Related Taxes | (120) | (41) | (90) | (79) | |
| Audit & All Other Taxes | 252 | 259 | 275 | 253 | |
| Non-Tax Revenues Differences | 120 | 134 | 108 | 98 | |
| Subtotal Revenues | $410 | $334 | $172 | $660 | |
| Expenditures Differences | |||||
| Underbudgeting | ($2,903) | ($2,832) | ($2,544) | ($2,453) | |
| Overtime | (730) | (480) | (430) | (430) | |
| Rental Assistance | (550) | (600) | (600) | (600) | |
| Shelter Capacity – Non-Asylum Seeker | (350) | (350) | (350) | (350) | |
| Prevailing Wage for Shelter Security Guards | (50) | (50) | (50) | (50) | |
| Public Assistance | (500) | (500) | (150) | 0 | |
| Contributions to MTA | (143) | (268) | (450) | (529) | |
| DOE Carter Cases | (540) | (410) | (340) | (340) | |
| DOE Custodial Costs | 0 | (154) | (154) | (154) | |
| DOE Charter Leases | (40) | (20) | (20) | 0 | |
| Fiscal Cliffs | (87) | (440) | (440) | (440) | |
| Pension Returns | 0 | 159 | 362 | 553 | |
| Foster Care Reimbursement Rate | 0 | (118) | (118) | (118) | |
| Temporary and Professional Services | (150) | 0 | 0 | 0 | |
| DOE Medicaid Revenue Shortfall | (60) | (60) | (60) | (60) | |
| Health Insurance Stabilization Fund – Reimbursement | (112) | 0 | 0 | 0 | |
| Collective Bargaining Agreements | (117) | (166) | (176) | (193) | |
| Full-Time Personnel Service Accrual Savings | 100 | 0 | 0 | 0 | |
| Subtotal Expenditures | ($3,329) | ($3,457) | ($2,976) | ($2,711) | |
| Total Comptroller Re-estimates | ($2,919) | ($3,123) | ($2,804) | ($2,051) | |
| Restated (Gap)/Surplus | ($2,919) | ($8,626) | ($8,396) | ($8,520) | |
| Longer Term Risks | |||||
| Asylum Seekers Expenses | 1,325 | (176) | (1,176) | (2,685) | |
| Class Size Mandate | 0 | (374) | (921) | (1,499) | |
| Restated (Gap)/Surplus with Longer Term Risks | ($1,594) | ($9,176) | ($10,493) | ($12,704) | |
Source: Office of the New York City Comptroller
V. Appendix
Table A1. June 2024 Financial Plan Revenue Detail
| ($ in millions) | FY 2025 | FY 2026 | FY 2027 | FY 2028 | Change FYs 2025 – 2028 |
Annual Percent Change |
||
|---|---|---|---|---|---|---|---|---|
| Dollars | Percent | |||||||
| Taxes: | ||||||||
| Real Property | $34,280 | $34,744 | $35,780 | $36,470 | $2,190 | 6.4% | 2.1% | |
| Personal Income Tax and Pass-Through Entity Tax | 17,284 | 17,474 | 18,401 | 19,137 | 1,853 | 10.7% | 3.5% | |
| General Corporation Tax | 6,507 | 6,074 | 6,136 | 6,246 | (261) | (4.0%) | (1.4%) | |
| Unincorporated Business Tax | 2,669 | 2,758 | 2,828 | 2,893 | 224 | 8.4% | 2.7% | |
| Sales and Use Tax | 10,371 | 10,822 | 11,238 | 11,726 | 1,355 | 13.1% | 4.2% | |
| Real Property Transfer Tax | 1,279 | 1,316 | 1,389 | 1,459 | 180 | 14.1% | 4.5% | |
| Mortgage Recording Tax | 687 | 771 | 884 | 927 | 240 | 34.9% | 10.5% | |
| Commercial Rent | 939 | 955 | 969 | 980 | 41 | 4.4% | 1.4% | |
| Utility | 420 | 462 | 492 | 495 | 75 | 17.9% | 5.6% | |
| Hotel | 743 | 764 | 783 | 836 | 93 | 12.5% | 4.0% | |
| Cigarette | 13 | 12 | 12 | 12 | (1) | (7.7%) | (2.6%) | |
| All Other | 1,073 | 1,098 | 1,123 | 1,148 | 75 | 7.0% | 2.3% | |
| Cannabis Tax | 10 | 20 | 28 | 30 | 20 | 200.0% | 44.2% | |
| Tax Audit Revenue | 773 | 773 | 773 | 773 | 0 | 0.0% | 0.0% | |
| Total Taxes | $77,048 | $78,043 | $80,836 | $83,132 | $6,084 | 7.9% | 2.6% | |
| Miscellaneous Revenue: | ||||||||
| Licenses, Franchises, etc. | $719 | $725 | $705 | $708 | ($11) | (1.5%) | (0.5%) | |
| Interest Income | 380 | 265 | 225 | 226 | (154) | (40.5%) | (15.9%) | |
| Charges for Services | 1,026 | 1,030 | 1,031 | 1,031 | 5 | 0.5% | 0.2% | |
| Water and Sewer Charges | 2,234 | 2,233 | 2,243 | 2,289 | 55 | 2.5% | 0.8% | |
| Rental Income | 260 | 260 | 260 | 260 | 0 | 0.0% | 0.0% | |
| Fines and Forfeitures | 1,234 | 1,229 | 1,235 | 1,224 | (10) | (0.8%) | (0.3%) | |
| Miscellaneous | 317 | 306 | 303 | 299 | (18) | (5.7%) | (1.9%) | |
| Intra-City Revenue | 1,953 | 1,932 | 1,928 | 1,928 | (25) | (1.3%) | (0.4%) | |
| Total Miscellaneous Revenue | $8,123 | $7,980 | $7,930 | $7,965 | ($158) | (1.9%) | (0.7%) | |
| Reserve for Disallowance of Categorical Grants | ($15) | ($15) | ($15) | ($15) | $0 | 0.0% | 0.0% | |
| Less: Intra-City Revenue | ($1,953) | ($1,932) | ($1,928) | ($1,928) | $25 | (1.3%) | (0.4%) | |
| TOTAL CITY-FUNDS | $83,203 | $84,076 | $86,823 | $89,154 | $5,951 | 7.2% | 2.3% | |
| Other Categorical Grants | $1,107 | $1,105 | $1,105 | $1,104 | ($3) | (0.3%) | (0.1%) | |
| Inter-Fund Agreements | $762 | $771 | $772 | $772 | $10 | 1.3% | (0.4%) | |
| Federal Categorical Grants: | ||||||||
| Community Development | $342 | $292 | $242 | $241 | ($101) | (29.5%) | (11.0%) | |
| Social Services | 3,480 | 3,475 | 3,474 | 3,589 | 109 | 3.1% | 1.0% | |
| Education | 1,965 | 1,965 | 1,965 | 1,965 | 0 | 0.0% | 0.0% | |
| Other | 2,135 | 1,519 | 1,470 | 1,431 | (704) | (33.0%) | (12.5%) | |
| Total Federal Grants | $7,922 | $7,251 | $7,151 | $7,226 | ($696) | (8.8%) | (3.0%) | |
| State Categorical Grants: | ||||||||
| Social Services | $2,655 | $2,705 | $2,703 | $2,339 | ($316) | (11.9%) | (4.1%) | |
| Education | 13,529 | 13,527 | 13,527 | 13,527 | (2) | (0.0%) | (0.0%) | |
| Higher Education | 280 | 280 | 280 | 280 | 0 | 0.0% | 0.0% | |
| Department of Health and Mental Hygiene | 675 | 676 | 676 | 676 | 1 | 0.1% | 0.0% | |
| Other | 2,299 | 1,926 | 1,949 | 1,816 | (483) | (21.0%) | (7.6%) | |
| Total State Grants | $19,438 | $19,114 | $19,135 | $18,638 | ($800) | (4.1%) | (1.4%) | |
| TOTAL REVENUES | $112,432 | $112,317 | $114,986 | $116,894 | $4,462 | 4.0% | 1.3% | |
Note: Numbers may not add due to rounding
Table A2. June 2024 Financial Plan Expenditure Detail
| ($ in millions) | FY 2025 | FY 2026 | FY 2027 | FY 2028 | Change
FYs 2025– 2028 |
Annual Percent Change |
|
|---|---|---|---|---|---|---|---|
| Dollars | Percent | ||||||
| Mayoralty | $171 | $171 | $169 | $169 | ($3) | (1.5%) | (0.5%) |
| Board of Elections | 146 | 147 | 147 | 147 | 1 | 0.8% | 0.3% |
| Campaign Finance Board | 103 | 13 | 13 | 13 | (90) | (87.0%) | (49.3%) |
| Office of the Actuary | 7 | 8 | 8 | 8 | 0 | 1.9% | 0.6% |
| President, Borough of Manhattan | 6 | 6 | 6 | 6 | (0) | (5.2%) | (1.8%) |
| President, Borough of Bronx | 7 | 6 | 6 | 6 | (0) | (6.2%) | (2.1%) |
| President, Borough of Brooklyn | 8 | 7 | 7 | 7 | (1) | (10.3%) | (3.6%) |
| President, Borough of Queens | 7 | 6 | 6 | 6 | (1) | (10.5%) | (3.6%) |
| President, Borough of Staten Island | 5 | 5 | 5 | 5 | (0) | (4.5%) | (1.5%) |
| Office of the Comptroller | 123 | 125 | 125 | 125 | 2 | 2.0% | 0.7% |
| Dept. of Emergency Management | 199 | 41 | 35 | 34 | (164) | (82.7%) | (44.2%) |
| Office of Administrative Tax Appeals | 6 | 6 | 6 | 6 | 0 | 2.6% | 0.9% |
| Law Dept. | 250 | 246 | 247 | 247 | (3) | (1.3%) | (0.4%) |
| Dept. of City Planning | 50 | 44 | 45 | 45 | (5) | (9.8%) | (3.4%) |
| Dept. of Investigation | 48 | 47 | 47 | 43 | (5) | (10.3%) | (3.5%) |
| NY Public Library — Research | 35 | 34 | 34 | 34 | (1) | (1.4%) | (0.5%) |
| New York Public Library | 178 | 175 | 175 | 175 | (3) | (1.6%) | (0.5%) |
| Brooklyn Public Library | 135 | 134 | 134 | 134 | (1) | (1.0%) | (0.3%) |
| Queens Borough Public Library | 140 | 138 | 138 | 138 | (2) | (1.7%) | (0.6%) |
| Dept. of Education | 32,673 | 33,265 | 34,307 | 35,043 | 2,370 | 7.3% | 2.4% |
| City University | 1,301 | 1,231 | 1,248 | 1,265 | (36) | (2.8%) | (0.9%) |
| Civilian Complaint Review Board | 28 | 28 | 28 | 28 | 0 | 0.3% | 0.1% |
| Police Dept. | 5,583 | 5,846 | 5,951 | 5,949 | 366 | 6.5% | 2.1% |
| Fire Dept. | 2,571 | 2,594 | 2,582 | 2,577 | 6 | 0.2% | 0.1% |
| Dept. of Veterans’ Services | 6 | 5 | 5 | 5 | (0) | (8.2%) | (2.8%) |
| Admin. for Children Services | 2,787 | 2,730 | 2,737 | 2,735 | (52) | (1.9%) | (0.6%) |
| Dept. of Social Services | 11,807 | 11,395 | 11,894 | 12,506 | 699 | 5.9% | 1.9% |
| Dept. of Homeless Services | 3,900 | 6,217 | 5,257 | 3,115 | (784) | (20.1%) | (7.2%) |
| Dept. of Correction | 1,050 | 1,064 | 1,070 | 1,210 | 160 | 15.3% | 4.9% |
| Board of Correction | 4 | 4 | 4 | 4 | (0) | (6.6%) | (2.2%) |
| Citywide Pension Contributions | 10,235 | 10,980 | 11,165 | 12,199 | 1,965 | 19.2% | 6.0% |
| Miscellaneous | 14,158 | 14,655 | 15,550 | 16,899 | 2,741 | 19.4% | 6.1% |
| Debt Service | 4,588 | 4,834 | 5,058 | 5,429 | 841 | 18.3% | 5.8% |
| TFA Debt Service | 3,481 | 4,053 | 4,546 | 5,000 | 1,519 | 43.6% | 12.8% |
| FY 2024 BSA | (4,397) | 0 | 0 | 0 | 4,397 | (100.0%) | (100.0%) |
| Public Advocate | 5 | 5 | 5 | 5 | 0 | 1.5% | 0.5% |
| City Council | 108 | 96 | 96 | 96 | (13) | (11.8%) | (4.1%) |
| City Clerk | 8 | 6 | 6 | 6 | (2) | (26.1%) | (9.6%) |
| Dept. for the Aging | 550 | 425 | 420 | 419 | (130) | (23.7%) | (8.6%) |
| Dept. of Cultural Affairs | 254 | 161 | 161 | 161 | (92) | (36.4%) | (14.0%) |
| Financial Info. Serv. Agency | 116 | 117 | 117 | 117 | 1 | 0.5% | 0.2% |
| Office of Criminal Justice | 779 | 739 | 749 | 749 | (30) | (3.8%) | (1.3%) |
| Office of Payroll Admin. | 15 | 16 | 16 | 16 | 1 | 4.6% | 1.5% |
| Independent Budget Office | 8 | 8 | 8 | 8 | (0) | (3.6%) | (1.2%) |
| Equal Employment Practices | 2 | 2 | 2 | 2 | 0 | 2.4% | 0.8% |
| Civil Service Commission | 1 | 1 | 1 | 1 | 0 | 2.6% | 0.8% |
| Landmarks Preservation Commission | 8 | 8 | 8 | 8 | 0 | 1.4% | 0.5% |
| Taxi & Limousine Commission | 60 | 58 | 58 | 58 | (2) | (4.1%) | (1.4%) |
| Office of Racial Equity | 8 | 6 | 6 | 6 | (2) | (30.5%) | (11.4%) |
| Commission on Racial Equity | 1 | 2 | 2 | 2 | 0 | 12.0% | 3.9% |
| Commission on Human Rights | 15 | 14 | 14 | 14 | (1) | (5.6%) | (1.9%) |
| Youth & Community Development | 1,251 | 1,050 | 1,081 | 1,093 | (158) | (12.6%) | (4.4%) |
| Conflicts of Interest Board | 3 | 3 | 3 | 3 | 0 | 3.0% | 1.0% |
| Office of Collective Bargaining | 3 | 3 | 3 | 3 | 0 | 2.6% | 0.9% |
| Community Boards (All) | 22 | 22 | 22 | 22 | (0) | (1.4%) | (0.5%) |
| Dept. of Probation | 104 | 101 | 101 | 102 | (3) | (2.7%) | (0.9%) |
| Dept. Small Business Services | 270 | 151 | 148 | 149 | (121) | (44.8%) | (18.0%) |
| Housing Preservation & Development | 1,991 | 1,395 | 1,379 | 1,386 | (605) | (30.4%) | (11.4%) |
| Dept. of Buildings | 212 | 191 | 188 | 188 | (25) | (11.5%) | (4.0%) |
| Dept. of Health & Mental Hygiene | 2,225 | 2,086 | 2,091 | 2,083 | (143) | (6.4%) | (2.2%) |
| NYC Health + Hospitals | 3,073 | 1,468 | 1,544 | 1,591 | (1,482) | (48.2%) | (19.7%) |
| Office of Administrative Trials & Hearings | 73 | 76 | 76 | 76 | 2 | 3.3% | 1.1% |
| Dept. of Environmental Protection | 1,677 | 1,637 | 1,630 | 1,631 | (46) | (2.7%) | (0.9%) |
| Dept. of Sanitation | 1,939 | 1,922 | 1,980 | 1,997 | 59 | 3.0% | 1.0% |
| Business Integrity Commission | 9 | 9 | 9 | 9 | 0 | 2.2% | 0.7% |
| Dept. of Finance | 343 | 347 | 348 | 348 | 5 | 1.4% | 0.5% |
| Dept. of Transportation | 1,447 | 1,438 | 1,424 | 1,411 | (35) | (2.4%) | (0.8%) |
| Dept. of Parks and Recreation | 618 | 610 | 611 | 611 | (6) | (1.0%) | (0.3%) |
| Dept. of Design & Construction | 180 | 159 | 159 | 159 | (20) | (11.4%) | (3.9%) |
| Dept. of Citywide Admin. Services | 1,092 | 602 | 593 | 591 | (500) | (45.8%) | (18.5%) |
| D.O.I.T.T. | 681 | 537 | 530 | 530 | (151) | (22.2%) | (8.0%) |
| Dept. of Record & Info. Services | 15 | 15 | 15 | 15 | 0 | 0.6% | 0.2% |
| Dept. of Consumer & Worker Protection | 62 | 66 | 65 | 65 | 3 | 5.1% | 1.7% |
| District Attorney – N.Y. | 171 | 176 | 177 | 177 | 6 | 3.2% | 1.1% |
| District Attorney – Bronx | 121 | 124 | 124 | 124 | 3 | 2.7% | 0.9% |
| District Attorney – Kings | 148 | 151 | 152 | 152 | 3 | 2.3% | 0.7% |
| District Attorney –Queens | 104 | 106 | 106 | 106 | 3 | 2.7% | 0.9% |
| District Attorney – Richmond | 25 | 26 | 26 | 26 | 1 | 2.1% | 0.7% |
| Office of Prosec. & Special Narc. | 31 | 32 | 32 | 32 | 1 | 2.2% | 0.7% |
| Public Administrator – N.Y. | 1 | 1 | 1 | 1 | 0 | 2.0% | 0.7% |
| Public Administrator – Bronx | 1 | 1 | 1 | 1 | 0 | 2.1% | 0.7% |
| Public Administrator – Brooklyn | 1 | 1 | 1 | 1 | 0 | 2.1% | 0.7% |
| Public Administrator – Queens | 1 | 1 | 1 | 1 | 0 | 2.3% | 0.8% |
| Public Administrator – Richmond | 1 | 1 | 1 | 1 | (0) | (2.2%) | (0.8%) |
| General Reserve | 1,200 | 1,200 | 1,200 | 1,200 | 0 | 0.0% | 0.0% |
| Energy Adjustment | 0 | 83 | 120 | 172 | 172 | N/A | N/A |
| Lease Adjustment | 0 | 52 | 106 | 161 | 161 | N/A | N/A |
| OTPS Inflation Adjustment | 0 | 56 | 111 | 167 | 167 | N/A | N/A |
| TOTAL EXPENDITURES | $112,432 | $117,820 | $120,578 | $123,363 | $10,931 | 9.7% | 3.1% |
Note: Numbers may not add due to rounding. Agency expenditures shown above are net of intra-City expenditures.
Table A3. Total Funded Full-Time Year-End Headcount, June 2024 Financial Plan
| FY 2024 | FY 2025 | FY 2026 | FY 2027 | FY 2028 | Percent Change FY 2024 – FY 2028 |
|
|---|---|---|---|---|---|---|
| Pedagogical | ||||||
| Dept. of Education | 126,077 | 125,188 | 123,369 | 123,369 | 123,369 | (2.1%) |
| City University | 4,289 | 4,289 | 4,289 | 4,289 | 4,289 | 0.0% |
| Subtotal | 130,366 | 129,477 | 127,658 | 127,658 | 127,658 | (2.1%) |
| Uniformed | ||||||
| Police | 35,051 | 35,001 | 35,001 | 35,001 | 35,001 | (0.1%) |
| Fire | 10,952 | 10,952 | 10,952 | 10,952 | 10,952 | 0.0% |
| Correction | 7,060 | 7,060 | 7,060 | 7,060 | 7,060 | 0.0% |
| Sanitation | 7,978 | 7,955 | 7,846 | 7,846 | 7,846 | (1.7%) |
| Subtotal | 61,041 | 60,968 | 60,859 | 60,859 | 60,859 | (0.3%) |
| Civilian | ||||||
| Dept. of Education | 12,587 | 12,827 | 12,280 | 12,280 | 12,280 | (2.4%) |
| City University | 1,735 | 1,735 | 1,735 | 1,735 | 1,735 | 0.0% |
| Police | 14,152 | 13,875 | 13,875 | 13,875 | 13,875 | (2.0%) |
| Fire | 6,301 | 6,225 | 6,225 | 6,225 | 6,225 | (1.2%) |
| Correction | 1,727 | 1,723 | 1,719 | 1,720 | 1,718 | (0.5%) |
| Sanitation | 1,743 | 1,632 | 1,632 | 1,632 | 1,632 | (6.4%) |
| Admin. For Children’s Services | 7,080 | 7,028 | 7,027 | 7,027 | 7,027 | (0.7%) |
| Social Services | 12,138 | 12,131 | 11,991 | 11,991 | 11,991 | (1.2%) |
| Homeless Services | 1,972 | 1,918 | 1,885 | 1,885 | 1,885 | (4.4%) |
| Health and Mental Hygiene | 5,975 | 5,664 | 5,550 | 5,542 | 5,523 | (7.6%) |
| Finance | 1,983 | 1,983 | 1,983 | 1,983 | 1,983 | 0.0% |
| Transportation | 5,762 | 5,807 | 5,806 | 5,806 | 5,806 | 0.8% |
| Parks and Recreation | 4,551 | 4,450 | 4,535 | 4,534 | 4,534 | (0.4%) |
| All Other Civilians | 32,311 | 32,123 | 31,893 | 31,871 | 31,867 | (1.4%) |
| Subtotal | 110,017 | 109,121 | 108,136 | 108,106 | 108,081 | (1.8%) |
| TOTAL | 301,424 | 299,566 | 296,653 | 296,623 | 296,598 | (1.6%) |
Source: Office of the New York City Comptroller, Mayor’s Office of Management and Budget
Table A4. Full-Time Headcount Changes, June 2024 Financial Plan vs. April 2024 Financial Plan
| FY 2024 | FY 2025 | FY 2026 | FY 2027 | FY 2028 | |||
|---|---|---|---|---|---|---|---|
| Pedagogical | |||||||
| Dept. of Education | 0 | 0 | 0 | 0 | 0 | ||
| City University | 0 | 0 | 0 | 0 | 0 | ||
| Subtotal | 0 | 0 | 0 | 0 | 0 | ||
| Uniformed | |||||||
| Police | 0 | 0 | 0 | 0 | 0 | ||
| Fire | 0 | 0 | 0 | 0 | 0 | ||
| Correction | 0 | 0 | 0 | 0 | 0 | ||
| Sanitation | 0 | 111 | 0 | 0 | 0 | ||
| Subtotal | 0 | 111 | 0 | 0 | 0 | ||
| Civilian | |||||||
| Dept. of Education | 0 | 0 | 0 | 0 | 0 | ||
| City University | 0 | 0 | 0 | 0 | 0 | ||
| Police | 0 | 32 | 32 | 32 | 32 | ||
| Fire | 0 | 0 | 0 | 0 | 0 | ||
| Correction | 0 | (1) | (1) | (1) | (1) | ||
| Sanitation | 0 | 0 | 0 | 0 | 0 | ||
| Admin. for Children’s Services | 0 | 3 | 3 | 3 | 3 | ||
| Social Services | (10) | 113 | 6 | 6 | 6 | ||
| Homeless Services | 0 | 15 | 0 | 0 | 0 | ||
| Health and Mental Hygiene | 12 | 20 | 15 | 15 | 15 | ||
| Finance | 0 | 0 | 0 | 0 | 0 | ||
| Transportation | 0 | 4 | 4 | 4 | 4 | ||
| Parks and Recreation | 39 | 343 | 343 | 343 | 343 | ||
| All Other Civilians | 45 | 113 | 76 | 76 | 76 | ||
| Subtotal | 86 | 642 | 478 | 478 | 478 | ||
| TOTAL | 86 | 753 | 478 | 478 | 478 | ||
| % change | 0.0% | 0.3% | 0.2% | 0.2% | 0.2% | ||
Source: Office of the New York City Comptroller, Mayor’s Office of Management and Budget
Acknowledgements
The Comptroller would like to thank the entire Bureau of Budget for their work on this report and Archer Hutchinson and Angela Chen for their work on its design.
Endnote
[1] All employment data cited are from the Current Employment Statistics, NY State Department of Labor, with seasonal adjustment provided by the NYC Office of Management and Budget (available here).
[2] Note that listings on StreetEasy.com primarily reflect only a segment on the NYC rental market. Listings from this site are most representative of properties with unregulated rents in Manhattan and the sections of Queens and Brooklyn that are relatively close to Manhattan. While not including the many properties rented through other non-online or non-public channels, changes seen in listed properties on StreetEasy.com should generally reflect broader movements in the NYC rental housing market.
[3] Occupancy and room rate data are from CoStar.
[4] Spending on Department of Education and City University of New York fringe benefits, which are typically reflected within each agencies’ respective budget have been included in the fringe benefits category. Totals are net intracity funding.
[5] Property tax revenues are inclusive of the NY State reimbursement of STAR exemptions.
[6] In response to limits put on deductions of State and Local Taxes (SALT) payments in the 2017 Tax Cuts and Jobs Act, the State enacted legislation that allows partnerships and S corporations (known as pass-through entities) to pay City and State entity-level taxes. Unlike PIT, PTET payments can be fully deducted from the federal individual income tax.
[7] There are about $43 million included in the $590 million of Council Initiatives that the Mayor’s Office of Management and Budget classifies as agency expenditures as agreed upon by the Council and Mayor to be funded on a one-year basis.
[8] About $10 million of the $75 million in early childhood education funding added during Adoption to FY 2025 is currently allocated to a fringe holding code in the DOE budget. It will likely to be moved to the Pre-K budget codes in a future financial plan update.
[9] The addition for the City’s Shelter to Housing Action Plan include $9 million budgeted to DSS and $1 million budgeted to the Department of Homeless Services.
[10] FPL detailed-guidelines-2024.pdf (hhs.gov)
[11] Older Adult Programs See Budget Boost—But Not Enough to Keep Up With Aging Population, Providers Say (citylimits.org)
[12] The April Plan PEG also included $62 million in PEG increased costs in FY 2025 due to debt service re-estimates, because this increases costs. It is excluded here.
[13] This includes $1 million for a cut to a Small Business Services workforce program restored through a City Council Initiative.
[14] There are about $43 million in Council Initiatives that the Mayor’s Office of Management and Budget is classifying as agency expenditures as agreed upon by the Council and Mayor to be funded on a one-year basis. https://council.nyc.gov/budget/wp-content/uploads/sites/54/2024/07/Fiscal-2025-Schedule-C-MERGE-FINAL-1.pdf. In FY 2024’s Adopted Budget the Council provided $528 million through its initiatives.
[15] The City can only use excess RHBT balance for budget relief up to the amount of pay-as-you-go retiree health benefits in any year.
[16] These costs include all rental assistance programs included in the DSS budget. Spending is primarily for the CityFHEPS program, but also includes legacy programs and the Federal HOME Tenant-Based Rental Assistance Program.
[17] Budgeted amounts for FY 2025 include $598 million in City funds, $94 million in Federal funds, and $14 million in State funds.
[18] NYC judge blocks measures to expand rental assistance eligibility, siding with Mayor Adams – Gothamist
[19] Homeless Advocates Lend Support in Suit Over City’s Refusal to Expand Housing Vouchers (citylimits.org)
[20] The assumptions made for the additional cost of MTA subsidies are based on the budgeted amounts in the MTA 2024 Adopted Budget-February Financial Plan, released in February 2024.
[21] The Health Insurance Stabilization Fund was created in the mid 1980’s to pay the difference between the GHI and HIP health insurance premiums. For several fiscal years, the GHI premium was lower than the HIP premium leading to a higher than anticipated balance in the fund. Over time, the City and unions were able to draw from the fund balance to offset wage increases and other benefits for employees. In recent years, however, GHI health insurance premiums have been about equal or higher than HIP premiums, leading to a reduction in the balance of the fund. The implementation of the Medicare Advantage Plan for NYC retirees was expected to lower the City’s health care costs by approximately $600 million annually, funds that would have been deposited into the Health Stabilization Fund. The New York State Supreme Court Appellate Division recently upheld the court’s previous ruling of a permanent injunction stopping the City from switching Medicare-eligible retirees to a Medicare Advantage Plan. In response, the City has petitioned the Court of Appeals requesting permission to appeal the decision. Citing a low balance in the Health Insurance Stabilization Fund, the City and Municipal Labor Committee, an organization of labor unions that controls the fund, agreed to forgo $112 million budgeted payments from the fund to the City’s general fund beginning FY 2023.