Comments on New York City’s Preliminary Budget for Fiscal Year 2019 and Financial Plan for Fiscal Years 2018 – 2022
Executive Summary
Economic Outlook
Both the U.S. and NYC economies are currently in the ninth consecutive year of expansion. All signs point to the expansion continuing through 2020, propelled by consumer spending as a result of higher wages and lower taxes, business investments fueled by tax incentives and corporate tax cuts, and increases in government spending. However, this growth is unlikely to be sustained as any boost from procyclical federal policy at this point in the expansion is likely to be short-lived, particularly if the Federal Reserve were to prematurely raise interest rates to avoid accelerating inflation.
The same factors that impact the national economy could also lead to a tailing off in local economic growth. As such, the Comptroller’s Office projects that growth in both the national and local economies will decelerate in 2019 through 2020 before picking up again slightly in 2022.
The FY 2019 Preliminary Budget
The FY 2019 Preliminary Budget totals $88.67 billion and closes a $3.18 billion gap projected in November. The gap is closed primarily with a planned prepayment of $2.58 billion of FY 2019 debt service. This prepayment will be paid out of the FY 2018 Budget Stabilization Account which is funded by a projected budget surplus in FY 2018.
Almost 60 percent of the FY 2018 budget surplus is funded by budgetary adjustments to the current fiscal year budget that are typically made during the Preliminary Budget cycle. These include the takedown of the General Reserve, elimination of the Capital Stabilization Reserve, and the recognition of savings as a result of a net reduction in estimated prior-year payables and receivables. Altogether, these adjustments result in $1.55 billion of additional resources in FY 2018. Additional City-funds revenues of almost $900 million, and FY 2018 savings of $432 million rounds out the remaining additional resources in the current modification, some of which are used to fund additional FY 2018 City-funds expenditures of $347 million.
The remaining resources used to close the FY 2019 gap are an additional $469 million in projected FY 2019 revenues and a new round of the Citywide Savings Program which is estimated to generate FY 2019 savings of $469 million. Part of these additional resources are used to fund additional City-funds expenditures of $346 million. The increase in expenditures reflects a $154 million increase in the budget for the Department of Homeless Services, primarily to increase funding for homeless shelters by $150 million, which is carried through each year of the Financial Plan.
Comptroller’s Risks and Offsets
The Comptroller’s Office’s analysis indicates that there could be additional resources of $417 million in FY 2018, and a modest gap of $510 million in FY 2019. The Comptroller’s Office projects larger gaps than the Mayor of $3.06 billion in FY 2020 and $2.38 billion in FY 2021 and a smaller gap of $1.54 billion in FY 2022. The additional resources in FY 2018 are driven by the Comptroller’s Office’s revenue forecast which is $527 million higher than the City’s. Offsetting part of the higher revenue forecast is the Office’s estimate that expenditures will be $110 million above Plan for FY 2018.
The Comptroller’s Office’s tax revenue forecasts are consistently higher than the City’s projections over the Plan period. However, beginning in FY 2019, the Plan assumption of revenues from the sale of taxi medallions results in net risks to the City’s non-tax revenue projections of $76 million in FY 2019, $228 million in FY 2020, $338 million in FY 2021, and $169 million in FY 2022. As a result, despite the higher tax revenue forecast, the Comptroller’s Office’s overall revenue projections are below the Plan’s in FY 2020 and FY 2021.
Overall, the Comptroller’s Office’s expenditure estimates are higher than the Plan’s in each year of the Plan period. However, the expenditure risks identified by the Office have decreased since the November Plan due primarily to increased funding for homeless shelters in the current Plan. In November, the Comptroller’s Office had identified risks of $126 million in each of FY 2018 through FY 2020. Other substantial risks identified in November remain unchanged. These include $150 million in overtime spending and $165 million in H + H support in each year of the Plan period.
Table 1. FY 2018 – FY 2021 Financial Plan
| ($ in millions) | FY 2018 | FY 2019 | FY 2020 | FY 2021 | FY 2022 | Change FYs 2018 –2022 Dollar Percent |
|
| Revenues | |||||||
| Taxes: | |||||||
| General Property Tax | $26,269 | $27,859 | $29,336 | $30,618 | $30,899 | $4,630 | 17.6% |
| Other Taxes | 29,726 | 31,084 | 32,166 | 33,243 | 34,003 | 4,277 | 14.4% |
| Tax Audit Revenues | 1,299 | 1,056 | 721 | 721 | 721 | (578) | (44.5%) |
| Subtotal: Taxes | $57,294 | $59,999 | $62,223 | $64,582 | $65,623 | $8,329 | 14.5% |
| Miscellaneous Revenues | 6,995 | 6,712 | 6,932 | 6,964 | 6,793 | (202) | (2.9%) |
| Less: Intra-City Revenues | (2,132) | (1,757) | (1,749) | (1,754) | (1,754) | 378 | (17.7%) |
| Disallowances Against Categorical Grants | 85 | (15) | (15) | (15) | (15) | (100) | (117.6%) |
| Subtotal: City-Funds | $62,242 | $64,939 | $67,391 | $69,777 | $70,647 | $8,405 | 13.5% |
| Other Categorical Grants | 1,098 | 870 | 860 | 855 | 855 | (243) | (22.1%) |
| Inter-Fund Revenues | 674 | 670 | 606 | 605 | 605 | (69) | (10.2%) |
| Federal Categorical Grants | 8,650 | 7,219 | 6,973 | 6,955 | 6,939 | (1,711) | (19.8%) |
| State Categorical Grants | 14,776 | 14,968 | 15,463 | 15,838 | 16,251 | 1,475 | 10.0% |
| Total Revenues | $87,440 | $88,666 | $91,293 | $94,030 | $95,297 | $7,857 | 9.0% |
| Expenditures | |||||||
| Personal Service | |||||||
| Salaries and Wages | $27,273 | $28,571 | $29,394 | $30,037 | $29,677 | $2,404 | 8.8% |
| Pensions | 9,590 | 9,802 | 9,764 | 9,678 | 9,882 | 292 | 3.0% |
| Fringe Benefits | 9,972 | 10,678 | 11,556 | 12,318 | 12,999 | 3,027 | 30.4% |
| Subtotal-PS | $46,835 | $49,051 | $50,714 | $52,033 | $52,558 | $5,723 | 12.2% |
| Other Than Personal Service | |||||||
| Medical Assistance | $5,915 | $5,915 | $5,915 | $5,915 | $5,915 | $0 | 0.0% |
| Public Assistance | 1,594 | 1,605 | 1,617 | 1,617 | 1,617 | 23 | 1.4% |
| All Other | 30,112 | 28,097 | 28,067 | 28,310 | 28,641 | (1,471) | (4.9%) |
| Subtotal-OTPS | $37,621 | $35,617 | $35,599 | $35,842 | $36,173 | ($1,448) | (3.8%) |
| Debt Service | |||||||
| Principal | $3,175 | $3,428 | $3,596 | $3,589 | $3,717 | $542 | 17.1% |
| Interest & Offsets | 3,237 | 3,661 | 4,068 | 4,537 | 5,098 | 1,861 | 57.5% |
| Subtotal Debt Service | $6,412 | $7,089 | $7,664 | $8,127 | $8,815 | $2,403 | 37.5% |
| FY 2017 BSA and Discretionary Transfers | (4,180) | 0 | 0 | 0 | 0 | 4,180 | (100.0%) |
| FY 2018 BSA | 2,584 | (2,584) | 0 | 0 | 0 | (2,584) | (100.0%) |
| Capital Stabilization Reserve | 0 | 250 | 250 | 250 | 250 | 250 | NA |
| General Reserve | 300 | 1,000 | 1,000 | 1,000 | 1,000 | 700 | 233.3% |
| Subtotal | $89,572 | $90,423 | $95,227 | $97,252 | $98,796 | $9,224 | 10.3% |
| Less: Intra-City Expenses | (2,132) | (1,757) | (1,749) | (1,754) | (1,754) | 378 | (17.7%) |
| Total Expenditures | $87,440 | $88,666 | $93,478 | $95,498 | $97,042 | $9,602 | 11.0% |
| Gap To Be Closed | $0 | $0 | ($2,185) | ($1,468) | ($1,745) | ($1,745) | NA |
Table 2. Plan-to-Plan Changes February 2018 Plan vs. November 2017 Plan
($ in millions) |
FY 2018 | FY 2019 | FY 2020 | FY 2021 |
| Revenues | ||||
| Taxes: | ||||
| General Property Tax | $255 | $211 | $328 | $492 |
| Other Taxes | (3) | (53) | (190) | (347) |
| Tax Audit Revenues | 449 | 335 | 0 | 0 |
| Subtotal: Taxes | $701 | $493 | $138 | $145 |
| Miscellaneous Revenues | 238 | 53 | 55 | 100 |
| Less: Intra-City Revenues | (79) | (12) | (4) | (4) |
| Disallowances Against Categorical Grants | 100 | 0 | 0 | 0 |
| Subtotal: City-Funds | $960 | $534 | $189 | $241 |
| Other Categorical Grants | 75 | 1 | 0 | 0 |
| Inter-Fund Revenues | 2 | 2 | 2 | 1 |
| Federal Categorical Grants | 308 | 132 | 46 | 40 |
| State Categorical Grants | 109 | 74 | 56 | 49 |
| Total Revenues | $1,454 | $743 | $293 | $331 |
| Expenditures | ||||
| Personal Service | ||||
| Salaries and Wages | ($104) | ($170) | ($132) | ($127) |
| Pensions | 3 | 54 | 77 | 68 |
| Fringe Benefits | 10 | 20 | 29 | 31 |
| Subtotal-PS | ($91) | ($96) | ($26) | ($28) |
| Other Than Personal Service | ||||
| Medical Assistance | $0 | $0 | $0 | $0 |
| Public Assistance | 0 | 0 | 0 | 0 |
| All Other | 279 | 326 | 283 | 262 |
| Subtotal-OTPS | $279 | $326 | $283 | $262 |
| Debt Service | ||||
| Principal | $1 | ($42) | ($43) | ($44) |
| Interest & Offsets | (90) | (25) | (5) | (3) |
| Subtotal Debt Service | ($89) | ($67) | ($48) | ($47) |
| FY 2017 BSA and Discretionary Transfers | 0 | 0 | 0 | 0 |
| FY 2018 BSA | 2,584 | (2,584) | 0 | 0 |
| Capital Stabilization Reserve | (250) | 0 | 0 | 0 |
| General Reserve | (900) | 0 | 0 | 0 |
| Subtotal | $1,533 | ($2,421) | $209 | $187 |
| Less: Intra-City Expenses | (79) | (12) | (4) | (4) |
| Total Expenditures | $1,454 | ($2,433) | $205 | $183 |
| Gap To Be Closed | $0 | $3,176 | $88 | $148 |
Table 3. Plan-to-Plan Changes February 2018 Plan vs. June 2017 Plan
($ in millions) |
FY 2018 | FY 2019 | FY 2020 | FY 2021 |
| Revenues | ||||
| Taxes: | ||||
| General Property Tax | $255 | $120 | $233 | $394 |
| Other Taxes | (210) | 38 | (95) | (249) |
| Tax Audit Revenues | 449 | 335 | 0 | 0 |
| Subtotal: Taxes | $494 | $493 | $138 | $145 |
| Miscellaneous Revenues | 507 | 64 | 69 | 114 |
| Less: Intra-City Revenues | (317) | (20) | (10) | (10) |
| Disallowances Against Categorical Grants | 100 | 0 | 0 | 0 |
| Subtotal: City-Funds | $784 | $537 | $197 | $249 |
| Other Categorical Grants | 218 | 2 | 1 | (1) |
| Inter-Fund Revenues | 3 | 6 | 4 | 3 |
| Federal Categorical Grants | 839 | 205 | 58 | 54 |
| State Categorical Grants | 357 | 96 | 92 | 111 |
| Total Revenues | $2,201 | $846 | $352 | $416 |
| Expenditures | ||||
| Personal Service | ||||
| Salaries and Wages | $23 | ($54) | ($32) | ($28) |
| Pensions | 18 | (69) | (179) | (327) |
| Fringe Benefits | (139) | (138) | (159) | (187) |
| Subtotal-PS | ($98) | ($261) | ($370) | ($542) |
| Other Than Personal Service | ||||
| Medical Assistance | $0 | $0 | $0 | $0 |
| Public Assistance | 0 | 0 | 0 | 0 |
| All Other | 1,309 | 374 | 307 | 310 |
| Subtotal-OTPS | $1,309 | $374 | $307 | $310 |
| Debt Service | ||||
| Principal | $1 | ($64) | ($2) | ($2) |
| Interest & Offsets | (117) | (72) | (196) | (203) |
| Subtotal Debt Service | ($116) | ($136) | ($198) | ($204) |
| FY 2017 BSA and Discretionary Transfers | (11) | 0 | 0 | 0 |
| FY 2018 BSA | 2,584 | (2,584) | 0 | 0 |
| Capital Stabilization Reserve | (250) | 0 | 0 | 0 |
| General Reserve | (900) | 0 | 0 | 0 |
| Subtotal | $2,518 | ($2,607) | ($261) | ($436) |
| Less: Intra-City Expenses | (317) | (20) | (10) | (10) |
| Total Expenditures | $2,201 | ($2,627) | ($271) | ($446) |
| Gap To Be Closed | $0 | $3,473 | $623 | $862 |
Table 4. Risks and Offsets to the February 2018 Financial Plan ($ in millions, positive numbers decrease the gap and negative numbers increase the gap)
| FY 2018 | FY 2019 | FY 2020 | FY 2021 | FY 2022 | |
| City Stated Gap | $0 | $0 | ($2,185) | ($1,468) | ($1,745) |
| Tax Revenues | |||||
| Property Tax | $0 | $172 | $405 | $871 | $1,806 |
| Personal Income Tax | 496 | 198 | 96 | (70) | (244) |
| Business Taxes | (32) | (29) | 21 | 150 | 235 |
| Sales Tax | 10 | (66) | (241) | (365) | (300) |
| State Sales Tax Intercept | 0 | (150) | 0 | 0 | 0 |
| Real Estate-Related Taxes | 43 | (23) | (456) | (511) | (257) |
| Audit | 0 | 0 | 200 | 200 | 200 |
| Subtotal Tax Revenues | $517 | $102 | $25 | $275 | $1,440 |
| Non-Tax Revenues | |||||
| ECB Fines | $10 | $20 | $20 | $20 | $20 |
| Late Filing/No Permit Penalties | 0 | 4 | 4 | 4 | 4 |
| Motor Vehicle Fines | 0 | 7 | 5 | 5 | 5 |
| Taxi Medallion Sales | 0 | (107) | (257) | (367) | (198) |
| Subtotal Non-Tax Revenues | $10 | ($76) | ($228) | ($338) | ($169) |
| Total Revenues | $527 | $26 | ($203) | ($63) | $1,271 |
| Expenditures | |||||
| Overtime | ($150) | ($150) | ($150) | ($150) | ($150) |
| Charter School Tuition | 0 | (101) | (240) | (417) | (633) |
| DOE Medicaid Reimbursement | (70) | (70) | (70) | (70) | (70) |
| Carter Cases | (80) | (80) | (80) | (80) | (80) |
| Homeless Shelters | (20) | (20) | (20) | (20) | (20) |
| NYC Health + Hospitals | (165) | (165) | (165) | (165) | (165) |
| VRDB Interest Savings | 75 | 50 | 50 | 50 | 50 |
| General Reserve | 300 | 0 | 0 | 0 | 0 |
| Total Expenditures | ($110) | ($536) | ($675) | ($852) | ($1,068) |
| Total (Risks)/Offsets | $417 | ($510) | ($878) | ($915) | $203 |
| Restated (Gap)/Surplus | $417 | ($510) | ($3,063) | ($2,383) | ($1,542) |
State of the City’s Economy
Economic growth accelerated in 2017 compared to 2016, taking us into the ninth year of economic expansion. Highlights of 2017 include the passage of a major federal tax overhaul; three interest rate increases by the Federal Reserve; record highs in the stock markets; and robust job growth and low unemployment with continuing low inflation. As 2018 started, however, signs of rising wages and fears of accelerating inflation spooked markets and signaled that the end may be in sight for the third-longest post-war expansion.
U.S. ECONOMIC OUTLOOK
The U.S. economy entered into the ninth year of an expansion notable not only for its duration but also for being the slowest recovery in the modern era. Since the end of the recession, economic growth has averaged just 2.1 percent per year. All signs point to the expansion continuing through 2020, which would make it the longest expansion since records have been kept. GDP grew 2.3 percent in 2017, fueled in part by private investment, which grew 5.3 percent for structures and 4.8 percent for equipment in 2017. Both were the highest since 2014, signaling that companies are preparing to meet higher demand.
Labor markets also performed well nationally in 2017. Total jobs were up by over 2.2 million in 2017, the seventh consecutive year of growth. The unemployment rate fell to an average of 4.4 percent in 2017, the lowest rate since the 4.0 percent registered in 2000.
Tight labor markets led to higher average hourly earnings, which grew 2.7 percent in 2017, the highest growth since 2009. Higher earnings usually precede higher prices and there are signs that inflationary pressure, as measured by the consumer price index (CPI), are building. The CPI breached the 2.0 percent target set by the Federal Reserve as its desired inflation rate in 2017, rising 2.1 percent. The Fed responded by raising the federal funds rate (the rate banks pay to borrow from their regional Federal Reserve banks) three times over the course of the year.
Given this backdrop, the Comptroller’s Office expects the U.S. economy to continue to grow through 2020. Growth will be buoyed by a combination of consumer consumption resulting from wage increases and lower taxes, business investment from tax incentives and corporate rate cuts under the new tax law, increases in government spending, and a lower trade deficit as the result of a weaker dollar.
Economic growth is unlikely to be sustained, however. Procyclical federal fiscal policy at this point in the economic cycle is likely to have short-lived effects. Indeed, it is likely to contain the seeds of its own destruction, with the primary risk to continued growth being a policy response by the Federal Reserve to prematurely raise interest rates to avoid accelerating inflation.
NEW YORK CITY’S ECONOMIC CONDITION AND OUTLOOK
Continued Strong Performance in 2017
The City’s economy, as measured by real (inflation-adjusted) gross city product (GCP), grew 2.4 percent in 2017, slightly below 2016 but higher than the nation’s GDP growth of 2.3 percent. As of 2017, the City has outperformed the nation for nine consecutive years.
Chart 1. NYC Growth Continues to Outpace U.S.
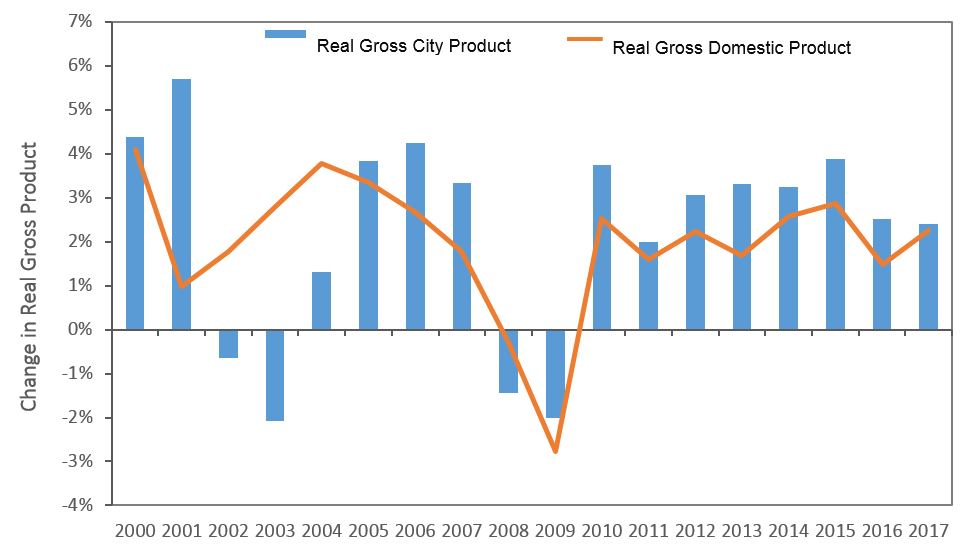
Source: Bureau of Economic Analysis and NYC Comptroller’s Office.
The City’s private sector added 71,400 new jobs, with government adding another 1,300. This is the eighth consecutive year of job gains, matching the length of the recovery in 1992-2000. In terms of total job gains, this recovery has been the largest ever, with 716,000 new jobs created. More recently, job growth has been moderating from the record growth of more than 130,000 jobs in 2014, but has remained well above the long-term average annual growth rate of 33,000 jobs.
Chart 2. Current Expansion Most Robust in Recent History
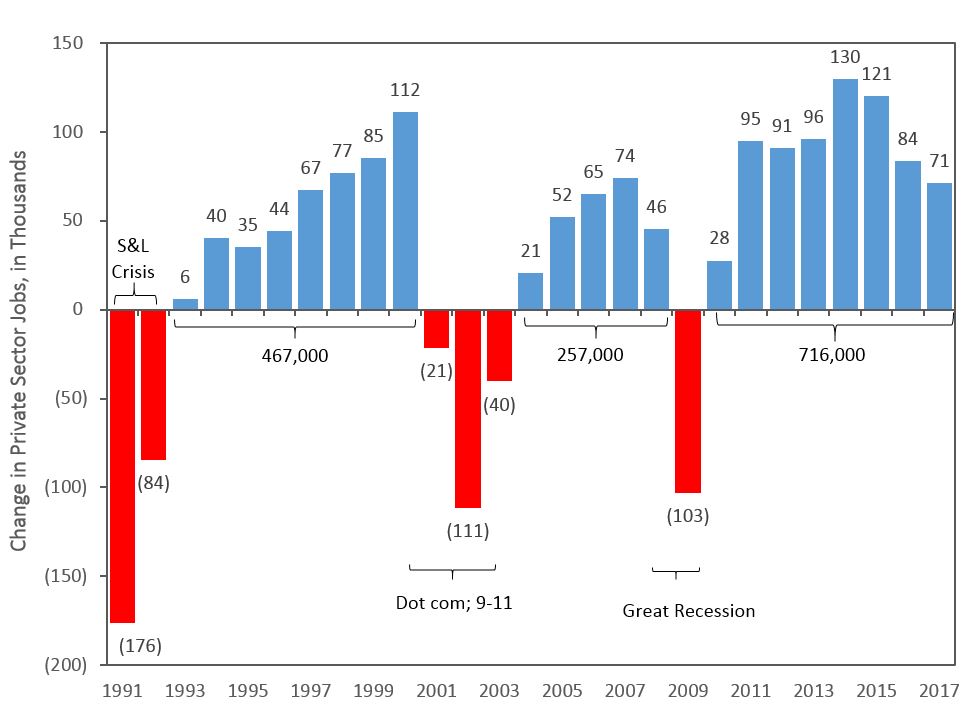
Source: NYS Department of Labor and Bureau of Labor Statistics.
Note: Jobs are based on average of monthly data.
The job creation boom has shattered employment records for City residents. The unemployment rate fell to 4.5 percent in 2017, the lowest unemployment rate in reported history. The labor force grew by 75,000 to a record high of over 4.2 million. As a result, labor force participation rose to a record high of 61.1 percent. Similarly, the number of city residents employed increased by 99,300 to a record high of 4.0 million, bringing the employment-to-population ratio up to 58.4 percent in 2017, also the highest on record.
Despite the City’s impressive job-creation performance, job growth has been characterized by a preponderance of lower-paying jobs, and disproportionate wage gains for higher-paying positions. More than half of new private-sector jobs created (55.5 percent) were in industries paying less than $60,000 on average. The remainder of the growth was distributed between medium- ($60,000 to $119,000) and high-wage (greater than $119,000) industries with shares of 25.5 percent and 19 percent, respectively. As a result, compared with the previous peak in private-sector jobs in 2008, the share of high- and medium-wage jobs has declined, while the share of low-wage jobs has increased. The current composition of new jobs across wage categories puts 18 percent more new workers in the low wage category than there were in 2008.
Chart 3. More New Jobs Pay Less than $60,000 on Average
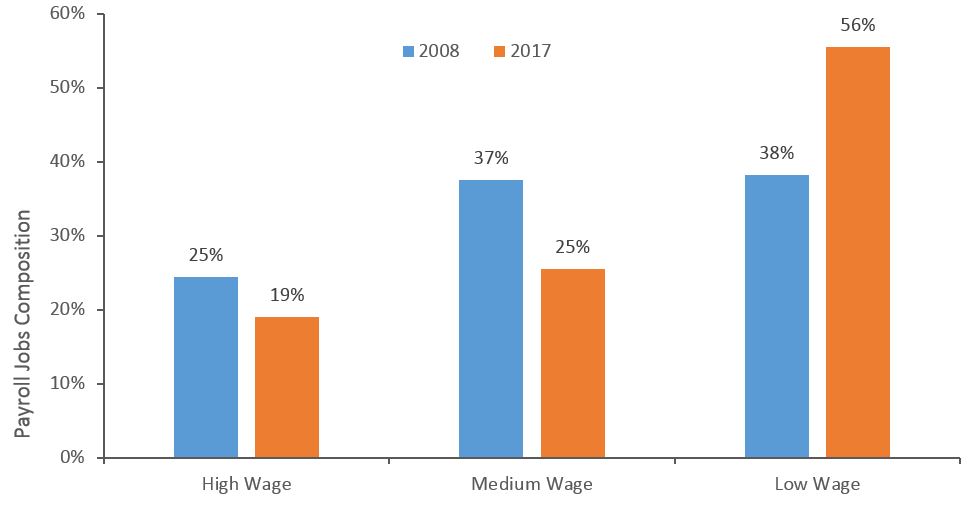
Source: NYS Department of Labor.
Note: Low wage is defined as paying on average annual wage of less than $60,000; medium-wage between $60,000 and $119,000, and high wage over $119,000.
Additionally, the wage gap between low, medium, and high earners grew between 2009 and 2016, with real average salaries for the high-wage sector growing 7.2 percent; the medium-wage sector 9.0 percent; and for the low-wage sector just 1.4 percent.
As in the U.S. as a whole, the City’s metro area is showing some signs of wage and consumer price inflation. The tight labor market led to an increase in private-sector average hourly earnings of 3.6 percent in 2017, the highest since 2008. The NY Metro-area inflation rate, as measured by the change in the consumer price index, was 2.0 percent in 2017, the highest since 2012.
Venture capital (VC) investment in the New York metro area surpassed $11.5 billion in 2017, the highest since $12.4 billion in 2000. The largest single investment was Softbank’s $3.0 billion direct investment in WeWork. Even without this investment, however, NY metro area VC activity was still higher than the $8.2 billion level of 2016.
The housing market in Manhattan slowed in 2017. According to Douglas Elliman, the average sales price fell slightly, to $2.05 million in 2017 from $2.07 million in 2016.[1] The number of transactions rose modestly from 11,463 in 2016 to 11,927 in 2017. In Brooklyn and Queens, both average sales prices and the number of sales increased in 2017 over 2016.
New commercial leasing activity was robust in Manhattan in 2017. According to Cushman and Wakefield, new leasing activity in Manhattan reached over 30.5 million square feet (msf) in 2017, 16.0 percent higher than in 2016. Total inventory in Manhattan increased by over 2.0 msf, but total available space fell by 1.3 msf in the fourth quarter of 2017 from a year ago. As a result, Manhattan’s overall office vacancy rate, including sublease space, fell to 8.9 percent in the last quarter of 2017 from 9.3 percent a year ago.
As of the last quarter of 2017, the City’s leading economic indicators implied continued expansion. An assessment of business conditions among firms in the New York City area is provided by ISM-New York, Inc. The report shows that the business conditions in the New York City metro area improved. The current business condition index (which measures the current state of the economy from the perspective of business procurement professionals) was 55.3 percent in the fourth quarter of 2017. A reading greater than 50 percent indicates continued growth. The ISM six-month outlook (which measures where procurement professionals expect the economy to be in six months) rose to 72.7 percent in the fourth quarter of 2017 from 59.0 percent in the third quarter of 2017. Additionally, according to the U.S. Department of Housing and Urban Development, total residential building permits in the City rose 12.7 percent to 5,672 in the fourth quarter of 2017.
The Outlook: Short-Term Acceleration Followed by Slowdown
The same factors affecting the national economy should lead national and local economic growth to pick up steam in 2018 and 2019, and we expect the City’s economy to surpass the nation again in both 2018 and 2019. But these same factors could contain the seeds of a slowdown beginning in 2020 – even, potentially, a contraction in growth, although at this point we do not expect that a recession would be deep or prolonged.
In the short run, the new federal tax law, a potential federal infrastructure bill, and the scaling back of financial sector regulatory reforms should spell good news for the City’s financial sector and growth more generally. But growth can be expected to tail off as a result of rising interest rates as the Federal Reserve responds to a tightening labor market and inflationary pressures.
Table 5 shows the Comptroller’s and the Mayor’s forecast of five economic indicators for 2018 to 2022.
Table 5. Selected Economic Indicators, Comptroller’s and Mayor’s Forecasts, 2018-2022
Source: Comptroller=February 2018 forecast by the NYC Comptroller’s Office. GCP=Gross City Product. Mayor= forecast by the NYC Office of Management and Budget in February 2018 Financial Plan. NA=not available.
The FY 2019 Preliminary Budget
The FY 2019 Preliminary Budget released on February 1 shows a balanced budget of $88.67 billion. Revenues in the Preliminary Budget are $743 million higher than projected in the November Plan. Expenditures are $2.43 billion lower due to a planned $2.58 billion prepayment of FY 2019 debt service. The combination of higher revenues and lower expenditures closes a $3.18 billion gap projected in November.
More than three-quarters of the revenue increase result from revisions to City-funds revenues, which added $534 million to the November Plan projection. The increase in revenues include $65 million of additional revenues estimated in the current round of the Citywide Savings Program (CSP). Net of the CSP revenues, tax revenues show an increase of $440 million and non-tax City-funds revenues an increase of $29 million. The additional tax revenues reflect increases of $211 million and $335 million in property tax and tax audit revenues, respectively, and a net reduction of $53 million in other non-property tax revenues.
The remaining $209 million revenue increase is due to increases in categorical grants driven almost entirely by revisions to Federal and State categorical grants which are $132 million and $74 million more than projected in November. An upward revision of $73 million in disaster recovery community development block grants and the expectation of $22 million in additional fringe benefits reimbursements for the Departments of Social Services (DSS), Homeless Services (DHS), and the Administration for Children’s Services (ACS) account for the bulk of the Federal categorical grants increase. The Financial Plan also projects additional State reimbursements for fringe benefits in these agencies, accounting for $33 million of the increase in State categorical grants. The additional Federal and State fringe benefits reimbursements are credited as savings in the CSP.
Excluding the increase in categorical expenditures resulting from revisions to categorical grants, FY 2019 City-funds expenditures are $2.64 billion lower than in the November Plan. This reduction results primarily from the planned FY 2018 prepayment of $2.58 billion of FY 2019 debt service. Baseline expenditures are $346 million above the November Plan driven by a $421 million increase in agency expenses, partially offset by a $75 million downward revision to the labor reserve. As Table 6 shows, the baseline expenditure increase is more than offset by the current round of CSP which is expected to reduce expenditures by $404 million.
Table 6. Changes to FY 2019 City-Funds Estimates from the November Plan ($ in millions)
| Revenues | Expenses | ||
| Tax Revenues | $440 | Agency Expenses | $344 |
| Non-Tax Revenues | 29 | Miscellaneous Budget | 23 |
| Subtotal | $469 | Pension | 54 |
| Labor | (75) | ||
| Citywide Savings Program | $65 | Subtotal | $346 |
| Total | $534 | ||
| Citywide Savings Program | ($404) | ||
| Prepayment | ($2,584) | ||
| Total | ($2,642) | ||
The largest increase in City-funds agency spending is in DHS, which saw an increase of $154 million, including an additional $150 million in funding for shelters. The Preliminary Budget also increases funding for pension contributions by $54 million primarily to pre-fund tax deferred annuities in the Teachers’ Retirement System (TRS) and the Board of Education Retirement System (BERS) as discussed in greater detail in “Pensions” beginning on page 40. Other significant increases include:
- an additional $27 million in the Police Department primarily to fund improvements to the body-worn camera program and expansion of the taser program.
- $24 million in new needs in the Department of Correction (DOC), $14 million of which is to fund additional active supervision posts in specific housing areas. The new needs are funded with part of the $55 million savings in the DOC from the proposed closing of the George Motchan Detention Center.
FY 2018 Budget Stabilization Account (BSA)
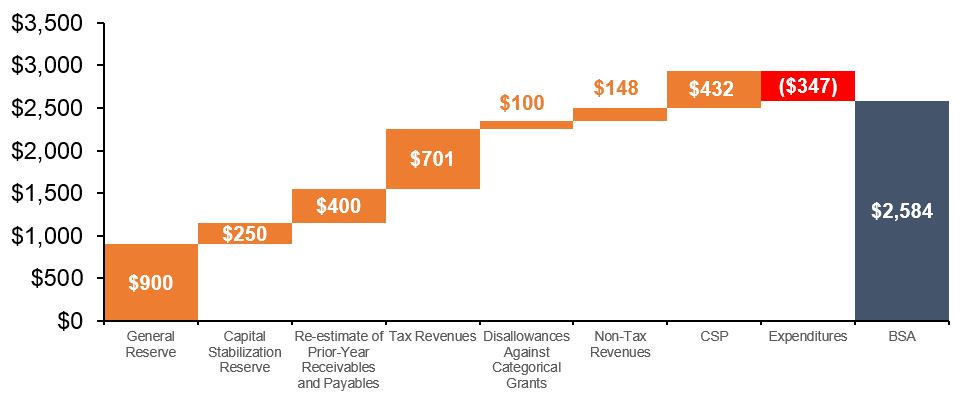
Since the November Plan, the City has recognized a net $2.58 billion of additional resources in the FY 2018 budget. Because these resources are not required for budget balance in the current fiscal year, they are used to establish a FY 2018 BSA to prepay $2 billion of FY 2019 Transitional Finance Authority (TFA) and $584 million of general obligation (G.O.) debt service. As shown in Chart 4, these additional resources are the result of:
- A reduction of $900 million in the FY 2018 General Reserve;
- The elimination of the $250 million Capital Stabilization Reserve;
- A net savings of $400 million from adjustments to prior-year receivables and payables estimates;
- An increase of $701 million in tax revenues;
- The release of $100 million from the reserve for disallowances against categorical grants;
- An increase of $148 million in non-tax City-funds revenues; and
- A new round of the Citywide Savings Program with projected FY 2018 savings of $432 million.
These resources are offset by a net increase of $347 million in City-funds spending.
Chart 4. Funding the BSA and Discretionary Transfers ($ in millions)
The takedown of the General Reserve, the elimination of the Capital Stabilization Reserve and the recognition of savings from adjustments to prior-year estimates of payables and receivables are budget adjustments that are typically made in the January/February plans.
The reserve for categorical disallowances is a set-aside for potential rejections of City claims against federal and state categorical aid. The release of $100 million from the reserve reflects the City’s belief that this amount is not needed to meet expected disallowances. Because the reserve is against disallowances of prior-year claims already recorded as revenues, the released funds are treated as City-funds revenues in the fiscal year in which they are released. This is the second fiscal year in which revenues have been increased by the release of reserves for disallowances. Prior to FY 2017, the last release of reserve of disallowances against categorical grants was in FY 2012 in the amount of $180 million.
Similar to the revisions in FY 2019, the FY 2018 tax revenue increase stems from upward revisions to property tax and tax audit revenue estimates. Property tax and tax audit revenues are, respectively, $255 million and $449 million above the November estimates. In total, non-property tax revenues remain essentially unchanged with a modest reduction of $3 million. Reductions of $255 million in business tax revenues and $6 million in cigarette tax revenues are almost completely offset by increases in other non-property tax revenues. Tax revenues are discussed in greater detail in “Tax Revenues” beginning on page 25.
The net increase in City-funds expenditures is driven by new needs of $370 million. The biggest increase is $150 million in additional funding for shelters in DHS. Funding for shelters in the November Plan was well below FY 2017 spending despite a higher census count at the start of the year compared to FY 2017. The February Plan addresses this shortfall by increasing shelter funding in each year of the Financial Plan.
Citywide Savings Program
The February Financial Plan contains another round of CSP that is expected to provide budget relief totaling $432 million in FY 2018, $469 million in FY 2019, $339 million in FY 2020, $341 million in FY 2021, and $296 million in FY 2022. Taken together with the November Plan CSP, the current round of CSP provides estimated budget relief over the Plan period of $3.31 billion.
Slightly more than a quarter of the 142 initiatives beginning in FY 2018 have recurring benefits that extend to the end of the Plan period. However, the savings associated with these initiatives account for about 55 percent, or $364 million, of the FY 2018 savings. The savings from these initiatives grow to $459 million in FY 2019, $571 million in FY 2020, and $608 million in FY 2021 before falling to $492 million in FY 2022. As Table 7 shows, FY 2020 through FY 2022 savings are the result of recurring savings from FY 2018 and FY 2019 initiatives.
Table 7. Recurring and Non-Recurring Savings
| ($ in millions) | FY 2018 | FY 2019 | FY 2020 | FY 2021 | FY 2022 | TOTAL |
| Recurring Savings | ||||||
| FY 2018 Initiatives | $364 | $459 | $572 | $608 | $492 | $2,495 |
| FY 2019 Initiatives | 0 | 83 | 85 | 88 | 90 | 346 |
| FY 2020 Initiatives | 0 | 0 | 1 | 1 | 1 | 3 |
| Subtotal Recurring Savings | $364 | $542 | $658 | 697 | $583 | $2844 |
| Non-Recurring Savings | $302 | $165 | $1 | $1 | $0 | $469 |
| Total | $666 | $707 | $659 | $698 | $583 | $3,313 |
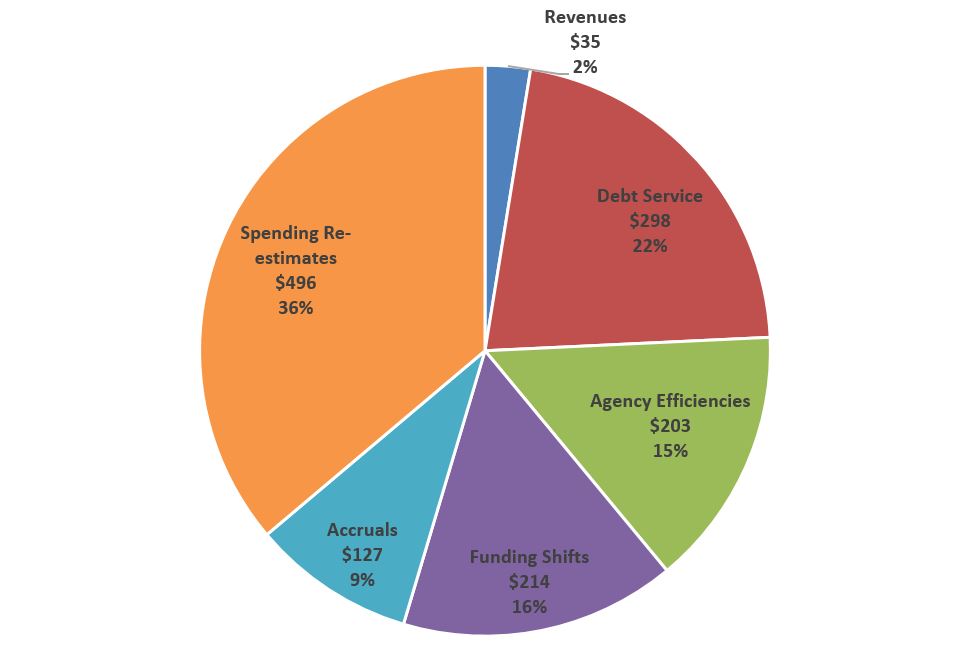
Efficiency initiatives by their very nature are more likely to generate recurring savings. Close to 70 percent of the 19 efficiency initiatives in FY 2018 have recurring benefits that extend throughout the Plan period. These initiatives, with FY 2018 savings totaling $36 million, are estimated to generate recurring savings of $93 million in FY 2019 and $94 million in each of the outyears of the Plan. In contrast, only one-fifth of the remaining initiatives have recurring benefits. Thus, the City should seek to increase the share of efficiency initiatives to maximize outyear savings. In the current Plan, efficiency initiatives account for about 16 percent of the combined FY 2018 and FY 2019 initiatives and 15 percent of the combined savings, while re-estimates, funding shifts, and debt service account for 74 percent of the savings, as shown in Chart 5.
Chart 5. Combined FY 2018 and FY 2019 Citywide Savings Program ($ in millions)
Risks and Offsets
The Comptroller’s Office’s analysis of the February Plan has identified additional resources of $417 million in FY 2018 and $203 million in FY 2022 and net risks of $510 million in FY 2019, $878 million in FY 2020, and $915 million in FY 2021. As a result, the Comptroller’s Office projects a budget surplus of $417 million in FY 2018, a slight gap of $510 million in FY 2019, larger gaps of $3.06 billion in FY 2020 and $2.38 billion in FY 2021 and a smaller gap of $1.54 billion in FY 2022 as compared to the Administration’s projections, as shown in Table 8.
With the exception of variable-rate demand bond (VRDB) savings and the expected takedown of the General Reserve, the Comptroller’s Office’s estimates of expenditures are consistently higher than the City’s over the Plan period. The Office’s revenue forecasts, on the other hand, are above the City’s for FY 2018, FY 2019 and FY 2022, which partially mitigate the expenditure risks in these fiscal years. However, the Comptroller’s revenue estimates are below the City’s in FY 2020 and FY 2021, adding to the expenditure risks. The Comptroller’s revenue projections are discussed in greater detail in “Tax Revenues” beginning on page 25 and “Miscellaneous Revenues” beginning on page 31.
Table 8. Risks and Offsets to the February 2018 Financial Plan ($ in millions, positive numbers decrease the gap and negative numbers increase the gap)
| FY 2018 | FY 2019 | FY 2020 | FY 2021 | FY 2022 | |
| City Stated Gap | $0 | $0 | ($2,185) | ($1,468) | ($1,745) |
| Tax Revenues | |||||
| Property Tax | $0 | $172 | $405 | $871 | $1,806 |
| Personal Income Tax | 496 | 198 | 96 | (70) | (244) |
| Business Taxes | (32) | (29) | 21 | 150 | 235 |
| Sales Tax | 10 | (66) | (241) | (365) | (300) |
| State Sales Tax Intercept | 0 | (150) | 0 | 0 | 0 |
| Real Estate-Related Taxes | 43 | (23) | (456) | (511) | (257) |
| Audit | 0 | 0 | 200 | 200 | 200 |
| Subtotal Tax Revenues | $517 | $102 | $25 | $275 | $1,440 |
| Non-Tax Revenues | |||||
| ECB Fines | $10 | $20 | $20 | $20 | $20 |
| Late Filing/No Permit Penalties | 0 | 4 | 4 | 4 | 4 |
| Motor Vehicle Fines | 0 | 7 | 5 | 5 | 5 |
| Taxi Medallion Sales | 0 | (107) | (257) | (367) | (198) |
| Subtotal Non-Tax Revenues | $10 | ($76) | ($228) | ($338) | ($169) |
| Total Revenues | $527 | $26 | ($203) | ($63) | $1,271 |
| Expenditures | |||||
| Overtime | ($150) | ($150) | ($150) | ($150) | ($150) |
| Charter School Tuition | 0 | (101) | (240) | (417) | (633) |
| DOE Medicaid Reimbursement | (70) | (70) | (70) | (70) | (70) |
| Carter Cases | (80) | (80) | (80) | (80) | (80) |
| Homeless Shelters | (20) | (20) | (20) | (20) | (20) |
| NYC Health + Hospitals | (165) | (165) | (165) | (165) | (165) |
| VRDB Interest Savings | 75 | 50 | 50 | 50 | 50 |
| General Reserve | 300 | 0 | 0 | 0 | 0 |
| Total Expenditures | ($110) | ($536) | ($675) | ($852) | ($1,068) |
| Total (Risks)/Offsets | $417 | ($510) | ($878) | ($915) | $203 |
| Restated (Gap)/Surplus | $417 | ($510) | ($3,063) | ($2,383) | ($1,542) |
The Comptroller’s Office’s expenditure risks have decreased slightly since the November Plan, due mainly to the City’s increased funding for homeless shelters. The Office had identified risks of $126 million annually for shelter support in November. Even with the increase in funding in the February Plan, residual risks of $20 million per year remain, as discussed in “Homeless Services” beginning on page 42. The Comptroller’s Office has also lowered the risk associated with Carter cases as discussed in the “Department of Education” beginning on page 41.
Other substantial risks over the Plan period remain unchanged. These include risks of $150 million for overtime spending, $70 million for Medicaid reimbursements for special education-related services, and $165 million for H+H reimbursements that are unlikely to materialize.
Revenue Analysis
The FY 2019 Preliminary Budget and Financial Plan projects total revenues to grow by $7.86 billion over the Financial Plan period, from $87.44 billion in FY 2018 to $95.30 billion in FY 2022. City-fund revenues are projected to grow from $62.24 billion in FY 2018 to $70.65 billion in FY 2022, based on the assumption of continued moderate economic growth throughout the Plan period. Tax revenue growth in FYs 2018-2022 is driven by growth in both property and non-property tax revenues. Property tax revenues are forecast to rise 17.6 percent from $26.27 billion in FY 2018 to $30.90 billion in FY 2022, while non-property tax revenues are expected to increase by 12 percent during the same period, from $31.03 billion in FY 2018 to $34.72 billion in FY 2022.
Miscellaneous revenues, excluding intra-City revenues, are projected to decline 3.2 percent in FY 2018 to $4.9 billion. This projection reflects the City’s anticipation of declines in both recurring revenues such as fees and fines and non-recurring revenues such as proceeds from asset sales and refunds and restitutions. Miscellaneous revenue is projected to increase slightly in FY 2019 to $5 billion and remain steady over the Financial Plan period.
The February Plan projects total Federal and State aid of $23.43 billion for FY 2018, an increase of $417 million over the November Plan. The majority of the new Federal and State support reflected in the February Plan is in the areas of Sandy-related reimbursement, social services and education. Over the remainder of the Plan period, Federal and State aid are projected to grow from $22.19 billion in FY 2019 to $23.19 billion in FY 2022, driven mainly by expected increases in State education aid.
Tax Revenues
Changes to City Forecast
As Table 9 shows, the City increased its tax revenue projections from FY 2018 through FY 2021 by a total of $1.5 billion. The upturn in revenue projections results for the most part from increases in audit revenues in FYs 2018-2019 and property tax revenues throughout the Plan period. Partially offsetting these increases are downward revisions to business tax revenues over the five-year financial plan. The significant increase in audit revenues is due to a twofold increase in anticipated collections from audits of the former banking corporation tax and reflects a continuing trend of upward revisions of audit revenues.[2] The revision to property taxes in FY 2018 is due to downward re-estimates of reserves, while the outyears revisions are based on higher property values reflected in the tentative roll released in January.
Table 9. Revisions to the City’s Tax Revenue Assumptions November 2017 vs. February 2018
| ($ in millions) | FY 2018 | FY 2019 | FY 2020 | FY 2021 | FY 2022 |
| November 2017 Financial Plan – Total | $56,593 | $59,506 | $62,085 | $64,437 | $65,623 |
| Revisions: | |||||
| Property Tax | $255 | $211 | $328 | $492 | $381 |
| Personal Income (PIT) | 16 | 111 | 132 | 104 | 0 |
| Business | (255) | (245) | (276) | (389) | (300) |
| Sales | 81 | 25 | (18) | (15) | 0 |
| Real-Estate Transactions | 66 | 38 | (31) | (45) | (85) |
| All Other | 89 | 18 | 3 | (2) | 4 |
| Tax Audit | 449 | 335 | 0 | 0 | 0 |
| Revisions-Total | $701 | $493 | $138 | $145 | $0 |
| February 2018 Financial Plan – Total | $57,294 | $59,999 | $62,223 | $64,582 | $65,623 |
Comparison of Projected Tax Revenue Growth
The Comptroller expects slightly higher overall growth in tax revenues over the Five Year Plan period averaging 3.8 percent versus 3.5 percent projected by the City. As shown in Table 10, the higher growth is largely due to stronger projected growth in real property taxes, 5.6 percent compared to 4.1 percent projected by the City. While the Comptroller expects slower economic growth in the outyears compared to the City, the impact on property tax revenue occurs largely outside of the Plan period due to the lagged nature of property taxes. Instead for most other non-property taxes, lower assumptions on economic growth in the outyears result in lower growth over the five year period compared to the City. In particular, personal income tax (PIT) and sales tax revenues are expected to average growth of more than a percentage point lower compared to the City. A more detailed discussion of our projections and differences from the City’s forecast follows, including the impact of the recently enacted federal Tax Cuts and Jobs Act.
Table 10. Tax Revenue Forecast, Growth Rates
| FY 2018 | FY 2019 | FY 2020 | FY 2021 | FY 2022 | FYs 2018 –22 Average Annual Growth | |
| Property | ||||||
| Mayor | 6.4% | 6.1% | 5.3% | 4.4% | 0.9% | 4.1% |
| Comptroller | 6.4% | 6.7% | 6.1% | 5.9% | 3.9% | 5.6% |
| PIT | ||||||
| Mayor | 5.6% | 2.8% | 4.7% | 4.0% | 3.3% | 3.7% |
| Comptroller | 10.0% | 0.2% | 3.8% | 2.7% | 2.0% | 2.2% |
| Business | ||||||
| Mayor | 1.5% | 8.1% | 2.0% | 2.1% | 1.0% | 3.3% |
| Comptroller | 0.9% | 8.2% | 2.9% | 4.2% | 2.3% | 4.4% |
| Sales | ||||||
| Mayor | 4.6% | 7.7% | 4.1% | 4.3% | 1.6% | 4.4% |
| Comptroller | 4.7% | 4.6% | 3.8% | 2.8% | 2.4% | 3.4% |
| Real Estate Transactions | ||||||
| Mayor | (6.7%) | 1.4% | 1.4% | 1.4% | 2.3% | 1.6% |
| Comptroller | (5.0%) | (1.4%) | (16.8%) | (1.1%) | 15.9% | (1.5%) |
| All Other | ||||||
| Mayor | 7.2% | (0.6%) | 1.3% | 2.0% | 2.6% | 1.3% |
| Comptroller | 7.2% | (0.6%) | 1.3% | 2.0% | 2.6% | 1.3% |
| Total Tax with Audit | ||||||
| Mayor | 4.8% | 4.7% | 3.7% | 3.8% | 1.6% | 3.5% |
| Comptroller | 5.8% | 4.0% | 3.6% | 4.2% | 3.4% | 3.8% |
Summary of Revenue Risks and Offsets
As shown in Table 11, the differences in projections result in net offsets of $517 million in FY 2018, $102 million in FY 2019, $25 million in FY 2020, $275 million in FY 2021 and $1.4 billion in FY 2022. Although the Comptroller’s Office anticipates shortfalls in non-property tax revenues in the outyears of the Plan period starting in FY 2019, collections for the real property tax are expected to be higher than the City’s forecast in every year of the Plan period, more than offsetting the projected shortfalls in non-property taxes.
Table 11. Comptroller’s Office Risks and Offsets to the City’s Tax Revenue Projections
| ($ in millions) | FY 2018 | FY 2019 | FY 2020 | FY 2021 | FY 2022 |
| Property | $0 | $172 | $405 | $871 | $1,806 |
| PIT | 496 | 198 | 96 | (70) | (244) |
| Business | (32) | (29) | 21 | 150 | 235 |
| Sales | 10 | (66) | (241) | (365) | (300) |
| State Sales Intercept | 0 | (150) | 0 | 0 | 0 |
| Real Estate Transaction | 43 | (23) | (456) | (511) | (257) |
| Audit | 0 | 0 | 200 | 200 | 200 |
| Total | $517 | $102 | $25 | $275 | $1,440 |
*Totals may not add due to rounding.
Property Taxes
Real Property Tax collections are determined by a complex formula governed by real property values, caps and phase-ins. Increases in assessed values of 1-3 family homes are capped at 6 percent per year and 20 percent over five years, while increases in assessed values on smaller apartment buildings are capped at 8 percent annually and 30 percent over 5 years. Assessed value increases are not capped for larger apartment buildings or for commercial buildings, but rather phased-in by 20 percent annually over 5 years.
The Comptroller’s Office expects the local economy to be stronger than the City’s projections in FY 2018 and FY 2019 and weaker over the remainder of the Plan. Despite the projection of an economy slowing through 2021, property tax assessment phase-ins allow property tax revenues to grow even through economic downturns as steep as the Great Recession, providing a valuable source of revenue at times when other tax revenue sources such as income and real-estate transactions taxes may be declining sharply. However, the Comptroller’s Office expects that ultimately higher interest rates and weaker employment growth will dampen property tax revenues.
The Comptroller’s Office projects property tax offsets of $172 million in FY 2019 resulting from reduction in total assessments from the tentative to final property tax roll that are smaller than those anticipated by the City. Although both the City and the Comptroller’s Office project slowing property tax growth, the Comptroller’s Office projects this growth will taper off more gradually, resulting in widening offsets in the outyears of $405 million in FY 2020, $871 million in FY 2021 and $1.8 billion in FY 2022.
Personal Income Taxes
Since the 2016 presidential election, tax reform proposals and the subsequent enactment of the Tax Cuts and Jobs Act (TCJA) have contributed to considerable volatility and uncertainty in personal income tax collections. These uncertainties revolve around three main issues: conformity issues relating to linkages between New York State and City personal income tax law and Federal law; the timing pattern of collections; and underlying tax liability. The Comptroller’s assumptions regarding each of these, and differences compared to the City, are discussed below.
Conformity issues: Many provisions of New York State and New York City personal income tax codes are linked to Federal tax law. As a result, some of the provisions of the TCJA would flow through to New York State and New York City income tax liability. Among key provisions that would impact New York City liabilities are the limitation on State and Local taxes (SALT) deductions, the definition of the standard deduction for single individuals, the doubling of the federal child credit, and the elimination of miscellaneous itemized deductions. According to estimates provided by the NYS Department of Taxation and Finance, New York State filers would see their State taxes increase by an estimated $1.0 billion in the absence of any decoupling actions.[3]
The Governor included decoupling provisions as part of the 30-day Executive budget amendments. Decoupling seems likely to occur and this is the baseline assumption for both the City and the Comptroller’s forecast of PIT revenues.[4] The Comptroller’s Office estimates that in the absence of decoupling New York City filers would face an annual tax increase of approximately $365 million on their New York City taxes and $430 million on their New York State tax liability.
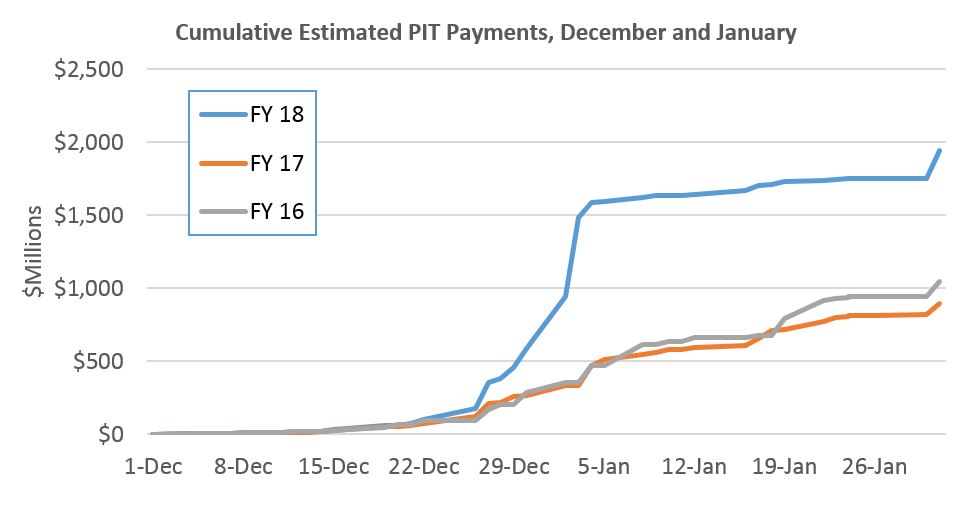
Timing of Collections: Provisions in the TCJA have created numerous incentives for tax filers to change their payment patterns and to shift income across tax years.
Notably, as shown in Chart 6, estimated payments jumped in December of 2017 and the first week of January 2018, as taxpayers rushed to claim full deductibility of SALT before limitations took hold in tax year 2018. Similar to the City, we project that a large part of these payments represent anticipated tax payments for filers who typically would have made extension payments after April.[5]
Conversely, last year’s collections in December and January were likely lower than they would otherwise have been, as the potential for tax cuts likely caused taxpayers to shift income from tax year 2016 to tax year 2017. [6] Further shifting is likely to have occurred this year from pass-through business owners who will benefit from a new 20 percent deduction in tax year 2018, providing an incentive to shift income from tax year 2017 to 2018. Timing and income shifting strategies should dissipate in the outyears as differences in tax rates and deductions among tax years cease.
Chart 6. Estimated Cumulative Tax Payments Much Higher Than Normal
Underlying Tax Liability and PIT Forecast: The City’s and the Comptroller’s near term forecasts for overall wage income are similar, both showing increasing wage pressures as the economy nears full employment. The forecasts for withholding revenues are therefore also similar, growing by 7.6 percent on average in FY 2018 and FY 2019.
The Comptroller’s forecast for non-withholding revenue however is significantly higher particularly in FY 2018. The City expects non-withholding revenue (including offset adjustments from the State) to decline by 4.0 percent. The Comptroller anticipates much higher growth, of over 10 percent with numerous factors contributing to this strong growth. The stock market’s recent strong performance, income shifting that likely occurred from tax year 2016 into tax year 2017, and share buybacks and dividend distributions that are expected to result from the repatriation of profits, should all boost non-withheld income tax revenues in FY 2018 and FY 2019. Estimates released by the Joint Committee on Taxation imply an increase of almost $300 billion in capital gains and dividend income in Federal FYs 2018 and 2019, largely driven by repatriated profits. Cisco’s recent announcement that it would repatriate more than $67 billion of profits and initiate a $44 billion stock buyback are indicative of the large windfall in capital gains realizations that is likely to occur.[7] As a result, the Comptroller estimates that PIT revenues could be almost $500 million higher in FY 2018 and $200 million higher in FY 2019 compared to the City’s projections.
For the outyears FY 2020 – 2022, differences in the City’s and the Comptroller’s forecast are instead due almost entirely to assumptions on growth in the economy and withheld income taxes. The City anticipates that wage income growth will moderate only slightly from 5.6 percent in FY 2018 to 4.1 percent in FY 2022. The Comptroller’s forecast anticipates a much sharper downturn in growth, and that overall wage income growth will slow from 5.0 percent in FY 2018 to only 2.6 percent in FY 2022. This sharper downward trajectory in the economy could cause PIT revenues to fall considerably lower than those forecast by the City, by almost $250 million at the end of the forecast period in FY 2022.
As noted previously, a high degree of uncertainty is associated with the PIT forecast. The full ramifications of the federal income tax reform and the tax planning responses to the law are very complex and their timing is still very difficult to determine at this time.
Business Taxes
The same uncertainties and considerations regarding conformity, timing and underlying liability that have been triggered by the TCJA on personal income taxes also impact business taxes.
Conformity Issues: The linkages of the New York State and New York City business tax laws with federal law are more limited, as both are already largely decoupled on several key provisions regarding depreciation, interest expenses and net operating loss carryforwards. According to estimates provided by the New York State Department of Taxation and Finance, in the absence of decoupling, the State could collect $200 million more in corporate taxes. However, conformity issues with respect to taxation of overseas profits and base erosion measures aimed at taxing intangible assets (referred to as GILTI) are very complex and still being reviewed. As with the individual income tax, the City’s and Comptroller’s baseline assumption is that decoupling will occur.
Timing of Collections: Timing issues related to business tax collections in many ways work in the opposite direction of the individual income tax. Because businesses retain deductibility of SALT, businesses did not have the same incentive to pay these taxes and shift income by December 31, 2017 as was the case for individuals. In fact, large cuts to corporate tax rates going forward from 35 percent in tax year 2017 to 21 percent in tax year 2018 provide a strong incentive to defer income into tax year 2018. One provision that does impact the current year is the tax on overseas profits which has resulted in companies reporting large after tax losses at the federal level.
Underlying Tax Liability and Business Income Tax Forecast: Economic strength nationally and in the City and robust profits among Wall Street firms would typically portend solid growth for business tax revenues in the City. FY 2018 tax revenues however are expected to be suppressed as income and expense shifting likely occurred from 2017 into 2018. As a result, near term growth in overall business taxes in FY 2018 is expected to be below 1 percent and then rebound strongly in FY 2019 with projected growth of 8.2 percent. These growth rates are similar to the City’s and the overall differences between the Comptroller’s and the City’s forecast for businesses tax forecast are minor, $32 million and $29 million lower in FY 2018 and FY 2019.
In the outyears from FY 2020 – FY 2022, as timing issues and income shifting patterns dissipate, the trajectory of corporate tax growth is driven largely by growth in the economy. The Comptroller anticipates economic growth to slow in 2020 and 2021 and business tax growth to also slow to an average of just over 3 percent. Even though the City expects considerably higher economic growth in the outyears, the City’s forecast for business taxes is lower than the Comptroller’s, resulting in an even lower trajectory in business tax revenue. By FY 2022, the City anticipates business tax revenues will be more than $200 million lower than the Comptroller’s estimate.
Sales Tax
The February Plan reflects sales tax revenue growth of 4.6 percent in FY 2018, to $7.3 billion. The forecast is net of $200 million in payments to the State related to the City’s refinancing of STARC bonds. The City anticipates growth in sales tax collections of 7.7 percent in FY 2019; however, the City has not yet recognized the anticipated State intercept of $150 million in sales tax revenue.[8] Even accounting for this, however, the City’s underlying assumption of steady growth in local employment and wages yields growth in sales tax revenues of 5.7 percent in FY 2019, followed by 6.1 percent in FY 2020, before beginning to slow in the final two years of the Plan.
The Comptroller’s Office expects growth in sales tax revenue of 4.7 percent in FY 2018, slightly above the City’s projection, resulting in an offset of $10 million in the current fiscal year. For FY 2019, the Comptroller also expects that growth in wage income will support sales tax revenue grow of 4.6 percent, a slower pace than the City’s forecast. For the remainder of the Plan, the Comptroller projects a deceleration in sales tax revenue growth, reflecting the Comptroller’s anticipated downturn in the local economy in the outyears. The resulting baseline sales tax revenue forecast creates risks ranging from $66 million to $365 million during the Plan period.
Real Estate Transaction Taxes
The Comptroller’s Office expects real estate transaction tax revenues to decline over the Plan period due to a combination of higher interest rates and an expected slowdown in the local economy. Higher interest rates have the combined effect of lowering the value of commercial properties through the capitalization rate and by making money more expensive, thereby raising the interest payments lenders expect to collect from mortgage loans. The higher carrying charges make the cost of owning a property more expensive, lowering its market value. In addition, the Comptroller’s Office is expecting a normal cyclical downturn in the local economy all translating to lower demand in both the commercial and residential markets, for purchase related taxes, and in mortgage refinancing for the refinancing portion of the mortgage recording tax.
Both the Comptroller and the City are projecting declines in real estate transaction tax revenues in FY 2018. In FY 2019 – FY 2022, the Comptroller’s forecast is direr, consistent with our projection of a sharper slowdown in growth in the 2020-2021 timeframe.
The Comptroller’s Office projects an offset of $43 million to the City’s forecast in FY 2018. However, in the outyears, the Comptroller’s Office projects risks of $23 million in FY 2019, $456 million in FY 2020, $511 million in FY 2021, and $257 million in FY 2022.
Audit Revenue
The City increased its estimate of audit collections by $449 million in FY 2018 and $335 million in FY 2019, attributing these increases to strong audit efforts. The City anticipates a steep decline of more than 30 percent in audit revenue in FY 2020, and audit revenues to fall to $721 million through the remainder of the Plan, a departure from historical trend. Over the past decade audit revenues have remained in a fairly stable range, as a percent of total revenues and business tax revenues, and the Comptroller’s Office expects this to continue in the outyears. As result, we project that the City could collect at least $200 million more from audits in FY 2020 – FY 2022.
Miscellaneous Revenues
In the February 2018 Financial Plan the City raised its FY 2018 miscellaneous revenue projection by a net $159 million, to $4.86 billion. Approximately $11 million of this increase reflects revenue initiatives included in the Citywide Savings Plan. The revised forecast, however, represents a $160 million decline in miscellaneous revenue compared to the previous fiscal year. This is mostly due to lower revenue projections for “other miscellaneous” revenue category, including asset sales, restitution and other non-recurring revenues in FY 2018.[9]
Table 12 shows the changes in the FY 2018 miscellaneous revenue projections since the November 2017 Plan. The February Plan increased FY 2018 revenues from licenses and franchises by $35 million. This revision includes higher projected revenues from building permits, construction, and utility permits. Projected revenues from charges for services increased by $24 million (mostly from higher fee revenues from fire inspection and affordable housing programs). Projected fine revenues increased by $53 million primarily to account for additional building fines, motor vehicle fines and Environmental Control Board (ECB) fines. The increase in the “other miscellaneous” category is driven mainly by a projected $23 million repayment of Housing Preservation and Development (HPD) loans.
Table 12. Changes in FY 2018 Estimates November 2017 vs. February 2018
| ($ in millions) | November | February | Change |
| Licenses, Franchises, Etc. | $694 | $729 | $35 |
| Interest Income | 110 | 110 | 0 |
| Charges for Services | 982 | 1,006 | 24 |
| Water and Sewer Charges* | 1,410 | 1,424 | 14 |
| Rental Income | 251 | 258 | 7 |
| Fines and Forfeitures | 914 | 967 | 53 |
| Other Miscellaneous | 343 | 369 | 26 |
| Total | $4,704 | $4,863 | $159 |
*Water and sewer revenues collected by the Water Board from dedicated water and sewer charges represent reimbursements for operation and maintenance of the water delivery and sewer systems and therefore are not available for operating purposes.
The February Plan projects total miscellaneous revenue to increase slightly in FY 2019 to $4.96 billion, $92 million above the FY 2018 projection. Projected non-recurring revenues increases by $166 million, including $100 million in anticipated revenues from HPD mortgage sales and $107 million in proceeds from the sales of taxi medallions. Projected revenues from the remaining categories of miscellaneous revenue are expected to drop by a combined $74 million in FY 2019.
Miscellaneous revenue projections for the remainder of the Plan period reflect minor changes from the November Plan, averaging $5.1 million annually in FYs 2020 – 2022. The City’s outyear projections continue to include significant revenues from the sale of taxi medallions, $929 million over FY 2019 – FY 2022. The proliferation of ride sharing services has put sharp downward pressure on medallion prices. According to data from the Taxi and Limousine Commission (TLC), 61 medallions were transferred for an average of $188,000 in January. The City’s Financial Plan assumes an average price of $728,000 per medallion.
Although the February Plan increases fine revenue estimates throughout the Plan period, based on the recent collection trend, the Comptroller’s Office expects revenues from fines to be above the City’s forecast by $10 million in FY 2018, $31 million in FY 2019, and $29 million in each of FY 2020 – FY 2022.
The Comptroller believes revenues from Environmental Control Board (ECB) fines could generate an additional $10 million in FY 2018 and another $20 million annually in each of FY 2019 – FY 2022. Motor vehicle fines could be higher by $7 million in FY 2019 and $5 million in each of FY 2020 – FY 2022, while penalties from the Department of Buildings (DOB) are likely to exceed the City’s current forecast by $4 million annually in FY 2019 through FY 2022.
Federal and State Aid
The February Financial Plan projects total Federal and State aid of $23.43 billion in FY 2018, supporting nearly 27 percent of the City’s expenditure budget. Compared with the November Plan, the City has incorporated an increase of $417 million in intergovernmental aid for the current year, comprised of $308 million in Federal aid and $109 million in State grants. About half of the Federal aid increase stems from additional Community Development Block Grant for Disaster Recovery and other Sandy-related reimbursement, totaling $151 million. These revisions bring the total for Sandy-related reimbursement to $1.07 billion in the current year. The FY 2018 budget also reflects greater Federal and State support of $114 million for social services, including $87 million for enhanced fringe benefits reimbursement and $20 million in homeless shelter grants. In addition, the City has recognized an increase of $90 million in education aid consisting of $38 million in Federal school food revenue and $52 million in State aid revisions for the current year.
In the FY 2019 Preliminary Budget, the City assumes $22.19 billion in Federal and State assistance, reflecting an increase of $206 million since the November Plan. About 82 percent of this total is expected to support education and social services spending. The decline in Federal and State support in FY 2019 is mainly attributable to a slowdown in the pace of Sandy-related reimbursement and more conservative estimates of certain Federal grants.
Over the remainder of the Plan, Federal and State grants are projected to rise to $22.44 billion in FY 2020, $22.79 billion in FY 2021 and $23.19 billion in FY 2022. These projections represent average annual growth of about 1.5 percent, driven primarily by the City’s expectation of State education aid increases of more than 3 percent annually. If these assumptions hold true, the level of Federal and State support for the City’s expense budget would decline modestly from 25 percent in FY 2019 to about 23.9 percent by FY 2022.
Federal Aid
Net of Sandy-related funding, the City anticipates about $7 billion in Federal assistance for FY 2019, which does not reflect the potential impact from the Federal Budget. However, the recent budget agreement in Washington has somewhat alleviated concerns that the City will have to absorb significant cuts in its Federal aid assumptions. While Congress still needs to develop a spending plan in the coming weeks, the budget deal is expected to raise Federal spending by about $300 billion over the next two years, about half of which is earmarked for domestic programs.
State Aid
The City expects State grants to total $15 billion in FY 2019, including $11.1 billion for education. These projections will be impacted by negotiations between the Governor and the Legislature over the State’s budget for the State fiscal year beginning April 1. While the City assumes 4.7 percent growth in State school aid, the Governor’s proposed Executive Budget included a far lower 2.4 percent increase from FY 2018 to FY 2019. Typically, the Legislature increases funds for education in the State Enacted Budget. In total, the City’s projection for State education aid in FY 2019 is $210 million higher than the proposed allocation in the State Executive Budget. The proposed State budget would also shift funding responsibilities from the State to the City for a portion of charter school tuition and rental payments, special education summer school, and child welfare. The proposed budget would further eliminate $30 million in annual State funding for the City’s Close to Home program.
The State’s Executive Budget also includes sweeping transit funding proposals that would increase the City’s contribution to the MTA. First, the Governor has proposed requiring a 1:1 City match for the capital portion of the State’s appropriation for the $836 million emergency subway action plan. Second, the State would require the City to fund 100 percent of the New York City Transit Authority’s capital needs, a stark departure from recent decades. In the most recent 2015 – 2019 capital plan, the City has committed to funding just $2.5 billion of the total $16.3 billion plan. Lastly, the Governor has proposed allowing the MTA to finance major capital projects with a share of City property tax revenue growth within one mile of the project. As proposed, the City’s only means of negotiation would be through the ability to veto the relevant capital project.
In the 30-day amendments to the State Executive Budget, the Governor also proposed allowing a demonstration program in the City to enforce “block the box” traffic laws in Manhattan below 60th Street with the use of cameras, as well as decoupling from federal tax provisions that would automatically increase New York City and State personal income tax revenue, due to recent changes in federal tax law.
The City has also not yet reflected certain provisions in last year’s adopted State budget. As previously noted, the Financial Plan does not reflect the full final year of a planned State intercept of sales tax revenue to recoup City savings from refinancing STAR-C bonds, posing a risk of $150 million in FY 2019. The City has also not yet reflected a modified formula for tuition payments to charter schools. If the State does not increase its reimbursement to the City, or change the formula, the new tuition formula could pose risks of $101 million in FY 2019, $240 million in FY 2020, $417 million in FY 2021, and $633 million in FY 2022.
The Raise the Age legislation adopted in last year’s State budget also poses some fiscal uncertainty for the City. Under the State law, New York City cannot detain youth under age 18 on Rikers Island as of October 1, 2018. Instead, the City must establish specialized secure juvenile detention facilities for youths aged 16 and 17. The City has several requests pending before the State, including use of a state-owned youth facility, regulation waivers, and state funding. The ultimate financial impact to the City is not yet clear.
The City could also face additional State aid reductions under a proposed extension and expansion of Executive budgetary powers. First, the State Executive Budget proposes to extend a provision adopted last year that provides the State Division of Budget with broad authority to respond to federal budget cuts. If federal Medicaid receipts to New York State are reduced by $850 million, or if all other federal receipts are reduced by $850 million, in State Fiscal Years 2018 – 19 through 2019- 20, the Division of Budget could present a plan to the Legislature to uniformly reduce related local aid disbursements. If the Legislature did not adopt an alternative plan within 90 days, the Governor’s proposal would become law. Second, the Executive Budget proposes a new provision to permit automatic local aid reductions if the State tax receipt estimate for State Fiscal Year 2018 – 19 is reduced by $500 million or more, as compared to projections in the Executive Budget. The local aid reductions could not exceed 3 percent and certain local aid payments would be exempt, including school aid, public assistance, CUNY senior colleges, and Medicaid. Approximately $2.3 billion of the City’s expected $15.0 billion in State Aid would be subject to this provision.[10]
Expenditures Analysis
Total Funds FY 2019 expenditures in the February Financial Plan are projected to grow by 1.4 percent from $87.44 billion in FY 2018 to $88.67 billion in FY 2019. However, both FY 2017 and FY 2018 include prepayments which lower debt service expenditures in these fiscal years. In addition, expenditures in FY 2018 are further reduced by the takedown of the general reserve and re-estimates of prior-year payables and receivables. After adjusting for prepayments and other prior-year actions, and excluding re-estimates of prior-year receivables and payables and reserves, expenditures are projected to grow from $89.14 billion in FY 2018 to $90.0 billion in 2019, a growth of 1.0 percent, as shown in Table 13.
Expenditure growth over the Plan period is driven by spending on wages and salaries, debt service, health insurance, and other fringe benefits, excluding pensions. The combined spending in these areas is projected to grow by 18.1 percent over the Plan period, averaging 4.3 percent growth annually. All other expenditures, net of the General Reserve, Capital Stabilization reserve, and prior-year re-estimates, are projected to decline slightly by 2.6 percent over the same period, with a projected annual average decline of 0.6 percent.
Table 13. FY 2018 – FY 2022 Expenditure Growth Adjusted for Prepayments and Prior-Year Actions
| ($ in millions) | FY 2018 | FY 2019 | FY 2020 | FY 2021 | FY 2022 | Growth FYs 18-22 | Annual Growth |
| Salaries and Wages | $26,881 | $28,198 | $29,021 | $29,664 | $29,304 | 9.0% | 2.2% |
| Debt Service | 6,412 | 7,089 | 7,664 | 8,127 | 8,815 | 37.5% | 8.3% |
| Health Insurance | 6,225 | 6,749 | 7,289 | 7,943 | 8,532 | 37.1% | 8.2% |
| Other Fringe Benefits | 3,653 | 3,829 | 4,160 | 4,264 | 4,354 | 19.2% | 4.5% |
| Subtotal | $43,171 | $45,865 | $48,135 | $49,997 | $51,006 | 18.1% | 4.3% |
| Pensions | $9,478 | $9,690 | $9,651 | $9,566 | $9,770 | 3.1% | 0.8% |
| Medicaid | 5,915 | 5,915 | 5,915 | 5,915 | 5,915 | 0.0% | 0.0% |
| Public Assistance | 1,594 | 1,605 | 1,617 | 1,617 | 1,617 | 1.4% | 0.3% |
| Judgments and Claims | 692 | 707 | 725 | 740 | 755 | 9.2% | 2.2% |
| Contractual Services | 16,748 | 15,434 | 15,182 | 15,347 | 15,493 | (7.5%) | (1.9%) |
| Other OTPS | 11,538 | 10,785 | 11,003 | 11,067 | 11,236 | (2.6%) | (0.7%) |
| Subtotal | $45,965 | $44,135 | $44,093 | $44,252 | $44,785 | (2.6%) | (0.6%) |
| Expenditures Before Reserves and Prior-Year Re-estimates | $89,136 | $90,000 | $92,228 | $94,248 | $95,791 | 7.5% | 1.8% |
| Prior-Year Receivables and Payables Re-estimate | ($400) | $0 | $0 | $0 | $0 | (100.0%) | (100.0%) |
| General Reserve | $300 | $1,000 | $1,000 | $1,000 | $1,000 | 233.3% | 35.1% |
| Capital Stabilization Reserve | $0 | $250 | $250 | $250 | $250 | ||
| Total | $89,036 | $91,250 | $93,478 | $95,498 | $97,041 | 9.0% | 2.2% |
Headcount
The February 2018 Financial Plan projects All Funds full-time headcount of 303,831 for fiscal year-end 2018, an increase of 1,734 from the Adopted FY 2018 Plan projection of 302,097. Planned headcount remains stable for FY 2019 and FY 2020, with increases in FY 2021 and FY 2022 to 305,654 and 308,610, respectively, as shown in Table 14.
Table 14. Total Funded Full-Time Year-End Headcount Projections – February 2018 Financial Plan
| FY 2018 | FY 2019 | FY 2020 | FY 2021 | FY 2022 | |
| Pedagogical | |||||
| Dept. of Education | 119,613 | 120,626 | 120,926 | 122,368 | 125,053 |
| City University | 4,441 | 4,441 | 4,441 | 4,441 | 4,441 |
| Subtotal | 124,054 | 125,067 | 125,367 | 126,809 | 129,494 |
| Uniformed | |||||
| Police | 35,918 | 35,941 | 35,941 | 35,941 | 35,941 |
| Fire | 10,914 | 10,946 | 10,946 | 10,946 | 10,946 |
| Correction | 10,427 | 9,967 | 9,983 | 9,983 | 9,983 |
| Sanitation | 7,543 | 7,634 | 7,647 | 7,647 | 7,647 |
| Subtotal | 64,802 | 64,488 | 64,517 | 64,517 | 64,517 |
| Civilian | |||||
| Dept. of Education | 12,259 | 12,395 | 12,413 | 13,080 | 13,356 |
| City University | 1,927 | 1,942 | 1,946 | 1,946 | 1,946 |
| Police | 16,065 | 15,815 | 15,827 | 15,827 | 15,827 |
| Fire | 6,230 | 6,224 | 6,224 | 6,223 | 6,223 |
| Correction | 2,195 | 2,202 | 2,202 | 2,202 | 2,202 |
| Sanitation | 2,268 | 2,302 | 2,302 | 2,302 | 2,302 |
| Admin. for Children’s Services | 7,157 | 6,972 | 6,971 | 6,971 | 6,971 |
| Social Services | 14,713 | 14,714 | 14,723 | 14,723 | 14,723 |
| Homeless Services | 2,613 | 2,577 | 2,577 | 2,577 | 2,577 |
| Health and Mental Hygiene | 5,721 | 5,493 | 5,480 | 5,480 | 5,480 |
| Finance | 2,230 | 2,242 | 2,254 | 2,254 | 2,254 |
| Transportation | 5,358 | 5,205 | 5,202 | 5,199 | 5,199 |
| Parks and Recreation | 4,401 | 4,321 | 4,310 | 4,307 | 4,307 |
| All Other Civilians | 31,838 | 31,447 | 31,209 | 31,237 | 31,232 |
| Subtotal | 114,975 | 113,851 | 113,640 | 114,328 | 114,599 |
| Total | 303,831 | 303,406 | 303,524 | 305,654 | 308,610 |
The February 2018 headcount plan, as shown in Table 15, shows a net increase of 764 in FY 2018 year-end headcount as compared to the November 2017 Financial Plan with lesser increases for FYs 2019 through 2021.
Table 15. Full-time Headcount Plan-to-Plan Comparison November 2017 Financial Plan vs. February 2018 Financial Plan
| FY 2018 | FY 2019 | FY 2020 | FY 2021 | |
| Pedagogical | ||||
| Dept. of Education | 1 | 1 | 195 | 247 |
| City University | 0 | 0 | 0 | 0 |
| Subtotal | 1 | 1 | 195 | 247 |
| Uniformed | ||||
| Police | 4 | 27 | 27 | 27 |
| Fire | 0 | 0 | 0 | 0 |
| Correction | 7 | (492) | (492) | (492) |
| Sanitation | 40 | 40 | 40 | 40 |
| Subtotal | 51 | (425) | (425) | (425) |
| Civilian | ||||
| Dept. of Education | 19 | 20 | 20 | 20 |
| City University | 0 | 0 | 0 | 0 |
| Police | (12) | (12) | 0 | 0 |
| Fire | 63 | 64 | 64 | 64 |
| Correction | 23 | 30 | 30 | 30 |
| Sanitation | 17 | 23 | 23 | 23 |
| Admin. for Children’s Services | 2 | 0 | 0 | 0 |
| Social Services | 23 | 23 | 23 | 23 |
| Homeless Services | 14 | 14 | 14 | 14 |
| Health and Mental Hygiene | 270 | 78 | 74 | 74 |
| Finance | 11 | 23 | 35 | 35 |
| Transportation | 85 | 39 | 44 | 44 |
| Parks and Recreation | 26 | 34 | 35 | 35 |
| All Other Civilians | 171 | 436 | 360 | 357 |
| Subtotal | 712 | 772 | 722 | 719 |
| Total | 764 | 348 | 492 | 541 |
Not all of these headcount increases, however, are accompanied by a net budgetary impact. In the February 2018 Financial Plan, for FY 2018, only 456 positions of the planned 764 headcount increase require additional funding. The remaining increase is due to headcount alignment to reflect funding already allocated for these positions.
The planned FY 2018 year-end headcount represents a net increase of 8,376 full-time employees compared to actual headcount as of June 30, 2017. As of December 31, 2017, halfway through the fiscal year, Citywide headcount has shown a net increase of 2,080 full-time positions, 25 percent of the planned increase. Table 16 compares actual headcount at June 30, 2017 and December 31, 2017 to the February Plan’s headcount projection for June 30, 2018.
Table 16. Actual and Planned Headcount
| 6/30/2017 Actual | 12/31/2017 Actual | 6/30/2018 February 2018 Plan | Change 6/30/2017 Actuals to 12/31/2017 Actuals | Planned Change 6/30/2017 to 6/30/2018 | |
| Pedagogical | |||||
| Dept. of Education | 118,671 | 119,689 | 119,613 | 1,018 | 942 |
| City University | 4,449 | 4,486 | 4,441 | 37 | (8) |
| Subtotal | 123,120 | 124,175 | 124,054 | 1,055 | 934 |
| Uniformed | |||||
| Police | 36,254 | 36,375 | 35,918 | 121 | (336) |
| Fire | 11,090 | 11,202 | 10,914 | 112 | (176) |
| Correction | 10,862 | 10,372 | 10,427 | (490) | (435) |
| Sanitation | 7,544 | 7,708 | 7,543 | 164 | (1) |
| Subtotal | 65,750 | 65,657 | 64,802 | (93) | (948) |
| Civilian | |||||
| Dept. of Education | 12,528 | 12,719 | 12,259 | 191 | (269) |
| City University | 1,904 | 1,891 | 1,927 | (13) | 23 |
| Police | 14,802 | 15,141 | 16,065 | 339 | 1,263 |
| Fire | 6,289 | 5,972 | 6,230 | (317) | (59) |
| Correction | 1,729 | 1,771 | 2,195 | 42 | 466 |
| Sanitation | 2,137 | 2,117 | 2,268 | (20) | 131 |
| Admin. for Children’s Services | 6,343 | 6,432 | 7,157 | 89 | 814 |
| Social Services | 13,244 | 13,021 | 14,713 | (223) | 1,469 |
| Homeless Services | 2,341 | 2,381 | 2,613 | 40 | 272 |
| Health and Mental Hygiene | 5,176 | 5,400 | 5,721 | 224 | 545 |
| Finance | 1,931 | 1,902 | 2,230 | (29) | 299 |
| Transportation | 4,773 | 4,885 | 5,358 | 112 | 585 |
| Parks and Recreation | 4,124 | 4,125 | 4,401 | 1 | 277 |
| All Other Civilians | 29,264 | 29,946 | 31,838 | 682 | 2,574 |
| Subtotal | 106,585 | 107,703 | 114,975 | 1,118 | 8,390 |
| Total | 295,455 | 297,535 | 303,831 | 2,080 | 8,376 |
Overtime (OT)
FY 2018 overtime expenditures in the February Plan total $1.41 billion, relatively unchanged from the November Plan budget of $1.40 billion. Based on the current spending pattern, the Comptroller’s Office estimates that overtime spending for the current fiscal year will total $1.56 billion, representing a $150 million risk to the February Plan estimate.
Civilian overtime spending accounts for more than half of the risk, as shown in Table 17. The City’s overtime cost for civilian employees has increased on average by 10.9 percent annually from $341 million in FY 2012 to $572 million in FY 2017. In an effort to curb this growth, the City implemented two major cost-saving initiatives at several agencies in FY 2018 to reduce overtime spending by $14 million:
- The City has begun capping and monitoring overtime waivers for employees with incomes at or above the overtime cap of $81,788.
- Reducing the number of overtime hours worked by skilled-trades employees.
Overtime spending is projected to decline by 5.4 percent to $1.33 billion in FY 2019. The FY 2019 budgeted overtime spending is $150 million below the Comptroller’s Office’s estimate of $1.48 billion. Civilian overtime risk of $98 million accounts for nearly two-thirds of the FY 2019 overtime risk. Uniformed overtime cost is expected to be about $52 million higher than budgeted. Increased uniformed headcount levels, particularly at the Police Department (NYPD), the Fire Department (FDNY) and the Department of Correction (DOC), have reduced the reliance on overtime to meet day to day operations at uniformed agencies. The risks stem mainly from expected overtime spending at the DOC. It is expected that overtime cost at the department will be higher than budgeted as DOC continues to work on programs to better conditions at correctional facilities.
Table 17. Projected Overtime Spending, FY 2018 and FY 2019
| ($ in millions) | City Planned Overtime FY 2018 |
Comptroller’s Projected Overtime FY 2018 |
FY 2018 Risk | City Planned Overtime FY 2019 |
Comptroller’s Projected Overtime FY 2019 |
FY 2019 Risk |
| Uniformed | ||||||
| Police | $544 | $560 | ($17) | $548 | $560 | ($12) |
| Fire | 246 | 246 | 0 | 212 | 212 | 0 |
| Correction | 165 | 220 | (55) | 150 | 190 | (40) |
| Sanitation | 103 | 103 | 0 | 101 | 101 | 0 |
| Subtotal | $1,058 | $1,129 | ($72) | $1,011 | $1,063 | ($52) |
| Civilian | ||||||
| Police | $86 | $100 | ($15) | $84 | $100 | ($16) |
| Admin for Child Svcs | 17 | 40 | (13) | 17 | 30 | (13) |
| Environmental Protection | 22 | 35 | (12) | 23 | 35 | (12) |
| Transportation | 52 | 55 | (3) | 49 | 55 | (6) |
| All Other Agencies | 174 | 200 | (35) | 155 | 200 | (45) |
| Citywide OT Savings | n/a | n/a | n/a | (6) | 0 | (6) |
| Subtotal | $351 | $430 | ($78) | $322 | $420 | ($98) |
| Total | $1,409 | $1,559 | ($150) | $1,333 | $1,483 | ($150) |
Health Insurance
The FY 2019 Preliminary Budget includes $6.749 billion for employees’ and retirees’ pay-as-you-go health insurance, an increase of $524 million over the adjusted health insurance cost for FY 2018.[11] The increase from FY 2018 reflects projected premium rate increases of 6.8 percent for active employees and pre-Medicare retirees, and 5 percent for the senior care rate.[12] As shown in Table 18, health insurance costs are then projected to increase to $7.289 billion in FY 2020, $7.943 billion in FY 2021, and $8.532 billion by FY 2022. The outyear projections assume annual increases in health insurance premium rates of 6.5 percent in FY 2020, 6.0 percent in FY 2021 and 5.5 percent in FY 2022. Senior care rates are projected to increase by 5 percent annually. These projections include expected savings of $1.3 billion in FY 2018 and beyond from the implementation of healthcare initiatives agreed upon in the Health Reform Agreement between the City and the Municipal Labor Committee (MLC).
Table 18. Pay-As-You-Go Health Expenditures
| ($ in millions) | FY 2018 | FY 2019 | FY 2020 | FY 2021 | FY 2022 |
| Department of Education | $2,302 | $2,472 | $2,715 | $3,038 | $3,307 |
| CUNY | 97 | 106 | 116 | 126 | 156 |
| All Other | 3,427 | 4,171 | 4,459 | 4,778 | 5,069 |
| Subtotal | $5,825 | $6,749 | $7,289 | $7,943 | $8,532 |
| FY 2018 Prepayment | 400 | 0 | 0 | 0 | 0 |
| Adjusted Pay-As-You-Go Health Insurance Costs | $6,225 | $6,749 | $7,289 | $7,943 | $8,532 |
Between FY 2014 and FY 2018, health insurance premiums increased at an annual rate of 4.12 percent for active employees and pre-Medicare retirees and 1.83 percent for Medicare eligible retirees. As shown in Table 19, monthly premiums for Medicare eligible retirees are expected to increase from $172 in FY 2018 to $210 in FY 2022, an annual growth of 5 percent. For individual employees and individual pre-Medicare retirees monthly rates are projected to increase from $681 in FY 2018 to $866 by FY 2022, an annual growth of 6.2 percent. Should premiums follow the same growth rates in recent years, it is likely that health insurance costs will be reduced in subsequent plans, with the reductions credited as savings in the Health Reform Agreement.
Table 19. Monthly Health Insurance Premiums
| Active/Pre-Medicare Individual | Active/ Pre-Medicare Family | Senior Care | |
| FY 2022* | $865.97 | $2,121.61 | $209.58 |
| FY 2021* | $820.82 | $2,011.01 | $199.60 |
| FY 2020* | $774.36 | $1,897.18 | $190.09 |
| FY 2019* | $727.10 | $1,781.39 | $181.04 |
| FY 2018 | $680.55 | $1,667.34 | $172.42 |
| FY 2017 | $632.45 | $1,549.50 | $168.35 |
| FY 2016 | $603.02 | $1,477.41 | $160.75 |
| FY 2015 | $586.10 | $1,435.95 | $160.86 |
| FY 2014 | $579.04 | $1,418.66 | $159.69 |
| FY 2013 | $550.50 | $1,348.75 | $159.69 |
* Plan projections
Pensions
Pension contributions are projected to remain relatively flat over the Financial Plan period, increasing by 3.1 percent from $9.48 billion in FY 2018 to $9.77 billion by FY 2022. As shown in Table 20, pension contributions are projected to increase to $9.69 billion in FY 2019, $212 million more than FY 2018. Projected contributions are then expected to decline in FYs 2020 and 2021 before increasing by 2 percent to the projected amount of FY 2022. The net pension projections reflect the financial impact of the FY 2017 actual investment gains. Pension projections in the February Plan increased over the November Plan by $3 million in FY 2018, $54 million in FY 2019, $76 million in FY 2020, and by $68 million in each of FYs 2021 and 2022. The increase resulted mainly from an annual deposit of $50 million beginning in FY 2019 to pre-fund the Tax Deferred Annuity (TDA) 403(b) plan for employees belonging to the Teachers’ Retirement System of the City of New York (TRS) and the Board of Education Retirement System of the City of New York (BERS).
Employees belonging to TRS and BERS may contribute to a TDA plan with different investment options, including a fixed rate fund with guaranteed interest rates of either 7 percent or 8.25 percent, depending on member eligibility. About 15 percent of the TRS TDA fixed rate fund and 63 percent of the BERS TDA fixed rate fund are in the 8.25 percent category. This rate is higher than the Actuarial Interest Rate Assumption (AIRA) of 7 percent. Currently, the difference between the 8.25 percent and the AIRA is recognized as an actuarial loss and amortized over 15 years. The February Plan includes $50 million annually beginning in FY 2019 to fund the difference on an annual basis.
Table 20. FY 2018 – FY 2022 City Pension Contributions
| ($ in millions) | FY 2018 | FY 2019 | FY 2020 | FY 2021 | FY 2022 |
| Five Actuarial Systems | $9,457 | $9,715 | $9,772 | $9,838 | $10,398 |
| Reserve for Expected Adjustments* | 39 | (9) | (107) | (261) | (619) |
| Non-Actuarial Systems | 0 | 0 | 0 | 0 | 0 |
| Non-City Systems | 94 | 96 | 98 | 101 | 103 |
| Less: Intra City-Expense | (112) | (112) | (112) | (112) | (112) |
| Net Pension Expense February Plan | $9,478 | $9,690 | $9,651 | $9,566 | $9,770 |
| Net Pension Expense November Plan | $9,475 | $9,636 | $9,575 | $9,498 | $9,702 |
| Net Change | $3 | $54 | $76 | $68 | $68 |
*The reserve is being held to accommodate expected changes in headcount, valuation refinements, and salary adjustments.
**Totals may not add up due to rounding.
Public Assistance
Through January 2018, the City’s public assistance caseload has averaged 367,190 recipients per month, representing a decline of slightly more than one percent, or 4,563 recipients from the monthly average during the same period in FY 2017. The number of public assistance recipients remains mostly range-bound between 362,000 and 368,000 over the past twelve months, well below the historic peak of 1,160,593 in March 1995. Although there have been no major caseload movements in FY 2018, public assistance grants spending has increased significantly in recent months. Compared with the monthly average of $117 million in FY 2017, the FY 2018 monthly average spending has thus far jumped by more than four percent to about $123 million. The City indicates that rent arrears payments, made as part of its homelessness prevention efforts, are among the main factors contributing to the rise in spending.
The City maintains its FY 2018 public assistance caseload projection at a monthly average of 388,600 over the entire plan period, unchanged since the November Plan. Net baseline grants expenditures are projected at about $1.53 billion to $1.55 billion in each year of the Plan. While actual caseloads are currently below projections in FY 2018, baseline grants spending appears to be in line with the City’s expectation.
Department of Education
The February Modification shows a net increase of $23 million in the Department of Education’s (DOE) FY 2018 budget. The DOE budget now totals $24.35 billion in the current year, an increase of nearly 4 percent or $886 million above actual FY 2017 spending of $23.46 billion.
The funding increase in the February Modification for the current year is primarily driven by new needs and recognition of Federal and State support, offset partly by anticipated savings from the CSP. Foremost among the $35 million of new needs in the February Modification is $30 million for the New York City School Support Services custodial reform initiative, $2 million for anti-bullying initiatives, and $1 million for school rat control measures. In addition, the City recognizes a $52 million increase in State education aid based on the latest estimates of formula-based aids and $38 million in school food revenue from participation in the Federal Community Eligibility Provision.
The FY 2018 Budget also includes about $105 million in new savings as part of the CSP unveiled in the February Plan. Aside from the City funds offset from the Federal school revenue, the major components of the DOE savings program are $19 million from the Absent Teachers Reserve (ATR) through departures and permanent placements, $16 million from changes in teacher classroom coverage, $22 million from various personnel savings and hiring delays, and $9 million in enrollment-based budget adjustments.
The FY 2019 Preliminary Budget projects DOE funding of $25.59 billion, an increase of $1.24 billion or 5.1 percent from the FY 2018 Budget. Compared to the November Plan, the Preliminary Budget shows a net decline of $94 million, as the City reflects new needs of only $11 million offset by a savings program totaling $106 million in FY 2019. Over the remainder of the Plan, the DOE budget is projected to rise to $26.32 billion in FY 2020 and $27.05 billion in FY 2021, before reaching $27.7 billion in FY 2022. The highlight of the February Plan outyear changes is new funding provided for expansion of 3K for All to include additional school districts beginning in FY 2020, adding about $38 million to $46 million annually in FYs 2020 – 2022. These additional funds are more than offset by CSP savings of $100 million each year over the same span, including $38.0 million annually in Central Administration PS and OTPS savings. Compared to the FY 2018 projections, the Department’s budget would grow roughly 14 percent, or $3.35 billion, over the outyears of the Plan. Additional State support is expected to comprise about $1.58 billion of the total growth over this period, with City funds primarily making up the remainder of the increase.
The State Executive Budget, released in January, proposes to increase formula-based school aids by $248 million to the City in the upcoming school year, including $186 million in Foundation Aid. The proposed school aids would fall short of the City’s education aid assumptions by $210 million in FY 2019, though the legislature has traditionally provided school aid increases to school districts during budget adoption.
The State budget also contains a number of education proposals that could shift over $200 million in charter school and special education costs to the City if enacted by the legislature. The most prominent of these actions is the elimination of $1,000 per capita supplemental charter school tuition reimbursement that exclusively targets the City, and comes on top of an approved plan last year to unfreeze the City’s charter school tuition rate without providing additional State assistance beyond FY 2018. The City indicates a negative impact of $120 million could materialize from this new proposal. In addition, reimbursement changes for charter school rentals/leases and summer special education costs could increase the City’s burden by more than $80 million.
The Department will likely continue to face risks from its assumptions of Federal Medicaid reimbursement in the February Plan. The DOE anticipates $97 million annually in Medicaid reimbursement for special education related services costs. While FY 2017 collection has improved to $26 million thus far, actual collections over the past five years have averaged only $13 million annually. Given the ambitious targets in the February Plan, the Comptroller’s Office projects DOE Medicaid reimbursement risks of $70 million in each year of the current plan. Also, the DOE budget has not reflected the potential costs from increased charter school tuition rates approved by the State in the outyears. As mentioned earlier, beginning in FY 2019, charter school tuition would grow at the same rate as public school spending. The State, thus far, has not dedicated funding to support the increased charter school tuition costs beyond the current school year. Unless the State provides additional funding in future legislative sessions, the DOE budget could face risks of $101 million in FY 2019, $240 million in FY 2020, $417 million in FY 2021, and $633 million in FY 2022.
Further, the DOE could face risks of at least $80 million annually from under-budgeting the costs of special education Carter cases. These costs represent payments to parents who legally seek reimbursement for placing their special needs children in non-public schools. Given the growth of these costs, which spiked from $312 million in FY 2016 to an estimated $417 million in FY 2017, at least $80 million will be needed each year if spending continues at a similar pace.
Homeless Services
Spending on adult and family shelter in the Department of Homeless Services (DHS) is the primary driver of the City’s homelessness expenses. However, funding for homeless assistance is also, and increasingly, drawn from the budgets of other agencies, including the Department of Social Services, the Department of Youth and Community Development, the Department of Health and Mental Hygiene, and the Department of Veterans Services. Table 21 below details funding for seven major categories of homeless services across these agencies.
Table 21. Citywide Homeless Services Expenditures
| ($ in millions) | FY 2014 | FY 2018 | FY 2019 | FY 2020 | FY 2021 |
| Adult Shelter Operations | $326 | $558 | $535 | $527 | $527 |
| Family Shelter Operations | 505 | 973 | 985 | 999 | 999 |
| Rental Assistance | 23 | 281 | 347 | 386 | 379 |
| Prevention, Diversion, Anti-Eviction & Aftercare | 82 | 382 | 314 | 271 | 271 |
| Domestic Violence, Youth & Emergency Shelters | 88 | 134 | 153 | 153 | 153 |
| Homeless Administration & Support | 151 | 237 | 268 | 280 | 286 |
| Total Citywide Homeless Spending | $1,175 | $2,565 | $2,602 | $2,617 | $2,615 |
FY 2019 Citywide homeless services expenditures are set to rise to $2.6 billion, up 121 percent from FY 2014, a remarkable surge over half of which has been driven by historic increases in the shelter population since that time. In FY 2014, the City’s average shelter census was 51,770 adults and children. Since that time, the shelter census peaked at an all-time high of more than 61,000 individuals on January 31, 2018, an increase of approximately 18 percent from the FY 2014 average.
Spending on rental assistance and prevention, diversion, anti-eviction and aftercare categories have increased by 530 percent since FY 2014, due to the introduction of several prominent programs aimed at transitioning shelter residents into permanent housing situations and preventing households on the brink of homelessness from entering shelter. Nonetheless, some programs in the prevention and aftercare category are slated for modest reductions in FY 2019, including $23 million less for anti-eviction legal services, $17 million less for housing for homeless veterans and $5 million less for subsidized jobs for homeless clients. The FY 2019 Preliminary Budget includes increases of $56 million for supportive housing, $26 million for general administrative expenditures at the Department of Homeless Services and an increase of $21 million for runaway and homeless youth services. Spending for runaway and homeless youth was substantially reduced following adoption in FY 2018 and the same pattern could repeat itself, barring the introduction of new policies or programs targeted to runaway youth. Each of the changes detailed in this paragraph are based on currently budgeted amounts for FY 2018.
Planned city expenses for adult shelter operations have increased substantially over the course of the last fiscal year. The FY 2019 Preliminary Budget calls for an expenditure of $535.3 million, a 4.1 percent reduction in spending from the total of $558.3 million that was budgeted for FY 2018 following the November modification. Based on an estimated average annual cost of approximately $34,000 per single adult in shelter, the average adult shelter census would have to be reduced by approximately 672 single adults in order for the preliminary FY 2019 amount to be sufficient. Considering the steady upward trajectory of the single adult shelter census in recent years and barring any major shifts in homelessness policy that could reduce the single adult shelter census, the preliminary FY 2019 Budget for adult shelter operations appears to be insufficient. If the City is able to keep its adult shelter census flat in FY 2019 and if City funding accounts for 85 percent of the adult shelter services budget, it is anticipated that an additional $19.6 million in City funds will be necessary.
Capital Budget and Financing Program
The FYs 2018 – 2022 February 2018 Capital Plan authorizes commitments totaling $79.62 billion, of which $71.95 billion are City-funds commitments. After adjusting for the reserve for unattained commitments, all-funds planned commitments drop to $74.11 billion, as shown in Table 22. The City-funds commitments after adjusting for the reserve for unattained commitments drop to $66.44 billion. The Plan is somewhat front-loaded with 27 percent or $21.73 billion of the all-funds authorized commitments scheduled for FY 2018. Estimated commitments decrease in the out-years of the Plan to $20.67 billion in FY 2019, $15.69 billion in FY 2020, $11.50 billion in FY 2021, and $10.03 billion in FY 2022.
Table 22. February 2018 Capital Commitment Plan All-Funds FYs 2018 – 2022
| ($ in millions) | FY 2018 February Plan |
Change from November 2017 | Percent of February Plan Total |
| Education & CUNY | $14,546 | $223 | 18.3% |
| Environmental Protection | 13,760 | 153 | 17.3% |
| Dept. of Transportation & Mass Transit | 14,018 | (315) | 17.6% |
| Housing and Economic Development | 11,723 | 1,073 | 14.7% |
| Administration of Justice | 5,333 | 46 | 6.7% |
| Technology and Citywide Equipment | 4,229 | (91) | 5.3% |
| Parks Department | 4,074 | 138 | 5.1% |
| Hospitals | 3,050 | (200) | 3.8% |
| Other City Operations and Facilities | 8,883 | (74) | 11.2% |
| Total | $79,616 | $953 | 100.0% |
| Reserve for Unattained Commitments | ($5,506) | ($220) | N/A |
| Adjusted Total | $74,110 | $733 | N/A |
Source: Office of Management and Budget, February 2018 Capital Commitment Plan, Changes from November for FYs 2018-2021 only.
The February 2018 Capital Commitment Plan shows an increase of $1.1 billion over FYs 2018 – 2021 in City-funds authorized commitments from the Adopted FY 2018 Capital Plan.[13] All-funds commitments over this period are $953 million more than in November.[14] Major changes by project type over FYs 2018-2021 include:
- An increase of $862 million in housing for HPD ($600 million) and Housing Authority ($262 million), $200 million of the new Housing Authority commitments are related to new boilers at select NYCHA buildings
- An increase of $258 million for Highways related projects
- An increase of $223 million for Dept. of Education projects
- $554 million decrease in FY 2018 to the H + H capital plan; projects delayed to FYs 2019-2022
There is no change to the NYC Transit’s Capital Plan, which remains at $642 million over this period. Planned commitments for DHS’ capital plan also remained relatively unchanged with a slight decrease of $17,000 to $490 million over FYs 2018-2021.
Estimated commitments for capital projects in DOE and the City University of New York (CUNY), account for $14.55 billion or 18.3 percent of planned all-funds commitments ($13.96 billion of which is DOE). Other major components of the Plan are capital projects in the Department of Environmental Protection (DEP) which comprise 17.3 percent of the planned all-funds commitments, Department of Transportation (DOT) and Mass Transit projects which account for 17.6 percent, and Housing and Economic Development projects which account for 14.7 percent of the Plan.[15] Consistent with prior plans, these four major program areas constitute a majority of the Commitment Plan, accounting for $54.05 billion, or 68 percent of the Plan.
Compared to the previous Plan, the February Plan reduces FY 2018 commitments by $2.71 billion and increases outyear commitments by $2.23 billion in FY 2019, $919 million in FY 2020, and $518 million in FY 2021. The primary driver of the decrease in FY 2018 are re-estimates reflecting the pushing of projects into FYs 2019 and 2020.
Financing Program
The February 2018 Financial Plan for FYs 2018–2022 contains $52.86 billion of planned borrowing in FYs 2018 – 2022 as shown below in Table 23. The borrowing is comprised of $20.21 billion of GO bonds, $21.55 billion of TFA borrowing, $9.47 billion of NYC Municipal Water Finance Authority (NYW) borrowing and $1.63 billion of Transitional Finance Authority Building Aid Revenue Bond (TFA BARBs) borrowing which are supported by State building aid revenues.
Table 23. February 2018 Plan – Financing Program
| ($ in millions) | Estimated Borrowing and Funding Sources FYs 2018 – 2022 | Percent of Total |
| General Obligation Bonds | $20,210 | 38.2% |
| TFA – PIT Bonds | 21,550 | 40.8 |
| NYC Water Finance Authority | 9,470 | 17.9 |
| TFA – BARBs | 1,633 | 3.1 |
| Total | $52,863 | 100.0% |
Source: NYC Office of Management and Budget, February 2018 Financial Plan.
Total projected borrowing in the February Plan for FYs 2018 through 2021 is $302 million less than the November 2017 Financial Plan estimate for the same period.[16] This is due entirely to a reduction in planned NYW borrowing. There are no changes in the other categories of borrowing. The Office of Management and Budget (OMB) will revisit these assumptions during the FY 2019 Executive Budget and Financial Plan process in April 2018.[17]
Debt Service
As shown in Table 24, debt service, net of prepayments, in the February 2018 Plan totals $6.48 billion in FY 2018, $7.16 billion in FY 2019, $7.75 billion in FY 2020, $8.21 billion in FY 2021 and $8.89 billion in FY 2022.[18] These amounts represent decreases from the November 2017 Financial Plan of $89 million in FY 2018, $67 million in FY 2019, $48 million in FY 2020, and $48 million in FY 2021.[19] Between FY 2018 and FY 2022, total debt service is expected to increase by $2.41 billion, or by 37.1 percent. These projections do not include debt service of the NYW, which is backed by water and sewer user fees, and that of the TFA BARBs debt, which is supported by New York State building aid.
Table 24. February 2018 Financial Plan Debt Service Estimates
| ($ in millions) | FY 2018 | FY 2019 | FY 2020 | FY 2021 |
FY 2022 |
Change from FYs 2018 – 22 |
| GOa | $3,946 | $3,989 | $4,299 | $4,482 | $4,825 | $879 |
| TFAb | 2,224 | 2,864 | 3,128 | 3,408 | 3,754 | 1,530 |
| Lease-Purchase Debt | 241 | 235 | 237 | 237 | 236 | (5) |
| TSASC, Inc. | 73 | 72 | 82 | 82 | 76 | 3 |
| Total | $6,484 | $7,160 | $7,746 | $8,209 | $8,891 | $2,407 |
Source: February 2018 Financial Plan.
Note: Debt service is adjusted for prepayments.
a Includes long-term GO debt service.
b Amounts do not include TFA BARBs.
The $89 million decrease in FY 2018 is due to GO savings of $73 million, and TFA savings of $15 million. Both GO and TFA savings stem primarily from a reduction in estimated variable-rate interest costs of $53 million and $30 million, respectively. The balance of the savings comes from a GO refunding action in December 2017 with savings of $21 million in FY 2018 and $48 million in each of FYs 2019 – 2021. TFA debt service is increased by $15 million in FY 2018 and reduced by $19.5 million from re-estimates of retention of excess building aid used to reduce TFA debt service.
In recent years, variable-rate interest rates on the City’s debt have been low. The Comptroller’s Office estimates additional variable-rate savings of $75 million in FY 2018 and an estimated $50 million in each of FYs 2019-2022.
Debt Affordability
Debt service as a percent of local tax revenues and as a percent of total revenues are measures that are commonly used to gauge debt affordability.[20] In FY 2017, the City’s debt service was 11.1 percent of local tax revenues. The February 2018 Plan projects debt service will consume 11.3 percent of local tax revenues in FY 2018, 11.9 percent in FY 2019, 12.4 percent in FY 2020, 12.7 percent in FY 2021, and 13.5 percent in FY 2022, as shown in Chart 7.
Chart 7. NYC Debt Service as a Percent of Tax Revenues
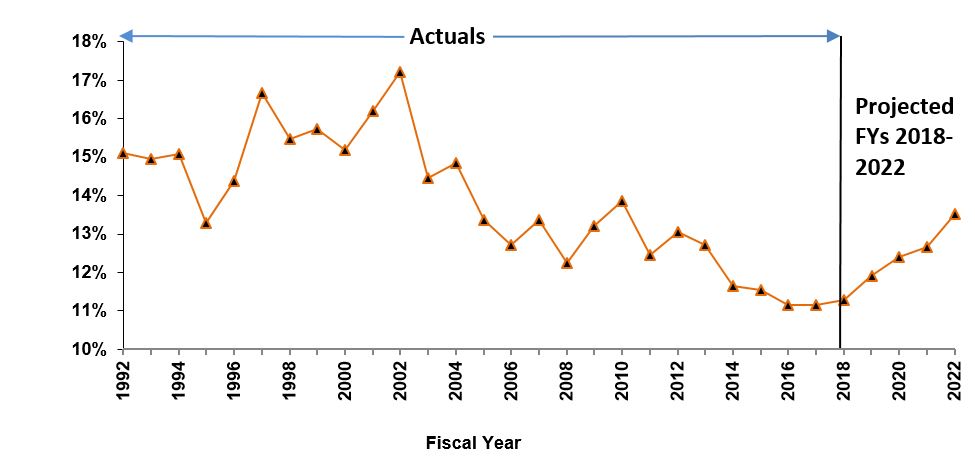
Source: Office of the NYC Comptroller, Comprehensive Annual Financial Reports, FYs 1992 – 2017, and NYC Office of Management and Budget, February 2018 Financial Plan.
The upward trend in the debt service to tax revenue ratio reflects the disparity between debt service and tax revenue growth over the Plan period. Debt service is projected to grow at an average annual rate of 8.2 percent from FYs 2018 to 2022 while tax revenue during this period is projected to grow 3.5 percent annually.
Over the Plan period, debt service is projected to grow at a faster rate than overall revenues. As such, debt service is projected to consume an increasing share of the budget. As shown in Chart 8 the City’s debt service as a percent of all-funds revenues is estimated to be 7.3 percent in FY 2018, 8.0 percent in FY 2019, 8.4 percent in FY 2020, 8.6 percent in FY 2021, and 9.3 percent in FY 2022.
Chart 8. NYC Debt Service as a Percent of Total Revenues
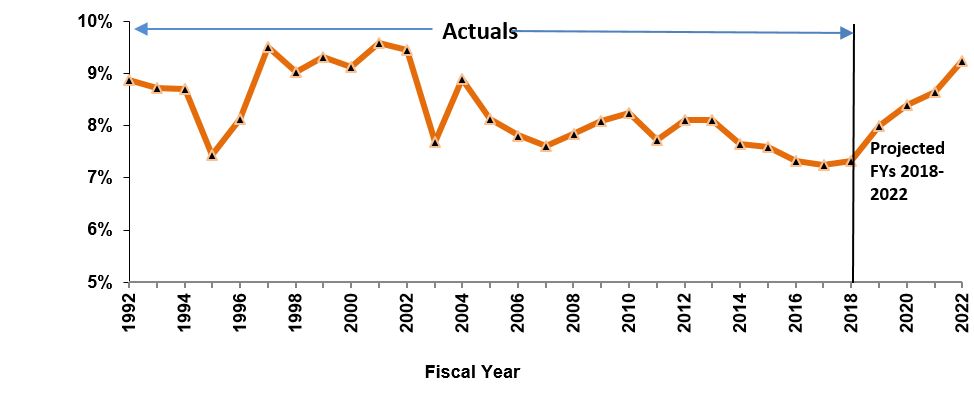
Source: Office of the NYC Comptroller, Comprehensive Annual Financial Reports, FYs 1992 – 2017, and NYC Office of Management and Budget, February 2018 Financial Plan.
Appendix
Table A1. February 2018 Financial Plan Revenue Detail
| ($ in millions) | FY 2018 | FY 2019 | FY 2020 | FY 2021 | FY 2022 | Change FYs 2018 – 2022 Dollars Percent |
Annual Percent Change | |
| Taxes: | ||||||||
| Real Property | $26,269 | $27,859 | $29,336 | $30,618 | $30,899 | $4,630 | 17.6% | 4.1% |
| Personal Income Tax | $11,857 | $12,184 | $12,756 | $13,270 | $13,706 | $1,849 | 15.6% | 3.7% |
| General Corporation Tax | $3,410 | $3,714 | $3,719 | $3,736 | $3,767 | $357 | 10.5% | 2.5% |
| Unincorporated Business Tax | $2,122 | $2,265 | $2,380 | $2,490 | $2,523 | $401 | 18.9% | 4.4% |
| Sale and Use Tax | $7,340 | $7,906 | $8,227 | $8,577 | $8,712 | $1,372 | 18.7% | 4.4% |
| Real Property Transfer | $1,398 | $1,469 | $1,488 | $1,511 | $1,547 | $149 | 10.7% | 2.6% |
| Mortgage Recording Tax | $966 | $928 | $943 | $954 | $974 | $8 | 0.8% | 0.2% |
| Commercial Rent | $848 | $852 | $875 | $905 | $942 | $94 | 11.1% | 2.7% |
| Utility | $381 | $390 | $399 | $412 | $424 | $43 | 11.3% | 2.7% |
| Hotel | $589 | $591 | $595 | $605 | $620 | $31 | 5.3% | 1.3% |
| Cigarette | $36 | $35 | $34 | $33 | $32 | ($4) | (11.1%) | (2.9%) |
| All Other | $779 | $750 | $750 | $750 | $756 | ($23) | (3.0%) | (0.7%) |
| Tax Audit Revenue | $1,299 | $1,056 | $721 | $721 | $721 | ($578) | (44.5%) | (13.7%) |
| Total Taxes | $57,293 | $59,999 | $62,223 | $64,582 | $65,623 | $8,330 | 14.5% | 3.5% |
| Miscellaneous Revenue: | ||||||||
| Licenses, Franchises, Etc. | $729 | $679 | $695 | $689 | $692 | ($37) | (5.1%) | (1.3%) |
| Interest Income | $110 | $179 | $232 | $274 | $284 | $174 | 158.2% | 26.8% |
| Charges for Services | $1,006 | $985 | $984 | $984 | $984 | ($22) | (2.2%) | (0.6%) |
| Water and Sewer Charges | $1,424 | $1,393 | $1,400 | $1,392 | $1,389 | ($35) | (2.5%) | (0.6%) |
| Rental Income | $258 | $254 | $250 | $250 | $250 | ($8) | (3.1%) | (0.8%) |
| Fines and Forfeitures | $967 | $930 | $921 | $911 | $901 | ($66) | (6.8%) | (1.8%) |
| Miscellaneous | $369 | $535 | $701 | $710 | $539 | $170 | 46.1% | 9.9% |
| Intra-City Revenue | $2,132 | $1,757 | $1,749 | $1,754 | $1,754 | ($378) | (17.7%) | (4.8%) |
| Total Miscellaneous Revenue | $6,995 | $6,712 | $6,932 | $6,964 | $6,793 | ($202) | (2.9%) | (0.7%) |
| Reserve for Disallowance of Categorical Grants | $85 | ($15) | ($15) | ($15) | ($15) | ($100) | (117.6%) | NA |
| Less: Intra-City Revenue | ($2,132) | ($1,757) | ($1,749) | ($1,754) | ($1,754) | $378 | (17.7%) | (4.8%) |
| TOTAL CITY-FUNDS | $62,241 | $64,939 | $67,391 | $69,777 | $70,647 | $8,406 | 13.5% | 3.2% |
| Other Categorical Grants | $1,098 | $870 | $860 | $855 | $855 | ($243) | (22.1%) | (6.1%) |
| Inter-Fund Agreements | $674 | $670 | $606 | $605 | $605 | ($69) | (10.2%) | (2.7%) |
| Federal Categorical Grants: | ||||||||
| Community Development | $1,340 | $439 | $262 | $241 | $235 | ($1,105) | (82.5%) | (35.3%) |
| Welfare | $3,649 | $3,342 | $3,359 | $3,366 | $3,366 | ($283) | (7.8%) | (2.0%) |
| Education | $1,825 | $2,038 | $2,042 | $2,044 | $2,044 | $219 | 12.0% | 2.9% |
| Other | $1,836 | $1,400 | $1,310 | $1,304 | $1,294 | ($542) | (29.5%) | (8.4%) |
| Total Federal Grants | $8,650 | $7,219 | $6,973 | $6,955 | $6,939 | ($1,711) | (19.8%) | (5.4%) |
| State Categorical Grants | ||||||||
| Social Services | $1,800 | $1,784 | $1,797 | $1,800 | $1,792 | ($8) | (0.4%) | (0.1%) |
| Education | $10,748 | $11,119 | $11,589 | $11,939 | $12,325 | $1,577 | 14.7% | 3.5% |
| Higher Education | $297 | $297 | $297 | $297 | $297 | $0 | 0.0% | 0.0% |
| Department of Health and Mental Hygiene |
$560 | $540 | $540 | $524 | $524 | ($36) | (6.4%) | (1.6%) |
| Other | $1,371 | $1,228 | $1,240 | $1,278 | $1,313 | ($58) | (4.2%) | (1.1%) |
| Total State Grants | $14,776 | $14,968 | $15,463 | $15,838 | $16,251 | $1,475 | 10.0% | 2.4% |
| TOTAL REVENUES | $87,439 | $88,666 | $91,293 | $94,030 | $95,297 | $7,858 | 9.0% | 2.2% |
Table A2. February 2018 Financial Plan Expenditure Detail
| ($ in millions) | FY 2018 | FY 2019 | FY 2020 | FY 2021 | FY 2022 | Change FYs 2018 – 2022 Dollars Percent |
Annual Percent Change |
|
| Mayoralty | $134 | $130 | $123 | $121 | $121 | ($13) | (9.7%) | (2.5%) |
| Board of Elections | $143 | $95 | $97 | $94 | $94 | ($49) | (34.0%) | (9.9%) |
| Campaign Finance Board | $44 | $14 | $14 | $14 | $14 | ($30) | (67.9%) | (24.7%) |
| Office of the Actuary | $8 | $7 | $7 | $7 | $7 | ($0) | (6.4%) | (1.6%) |
| President, Borough of Manhattan | $5 | $5 | $5 | $5 | $5 | ($0) | (8.6%) | (2.2%) |
| President, Borough of Bronx | $6 | $5 | $5 | $5 | $5 | ($1) | (9.3%) | (2.4%) |
| President, Borough of Brooklyn | $7 | $6 | $6 | $6 | $6 | ($1) | (14.8%) | (3.9%) |
| President, Borough of Queens | $6 | $5 | $5 | $5 | $5 | ($1) | (15.0%) | (4.0%) |
| President, Borough of Staten Island | $5 | $4 | $4 | $4 | $4 | ($0) | (6.7%) | (1.7%) |
| Office of the Comptroller | $105 | $105 | $105 | $105 | $105 | $0 | 0.0% | 0.0% |
| Dept. of Emergency Management | $72 | $49 | $27 | $28 | $28 | ($44) | (61.0%) | (21.0%) |
| Office of Administrative Tax Appeals | $5 | $5 | $5 | $5 | $5 | $0 | 2.4% | 0.6% |
| Law Dept. | $216 | $196 | $204 | $204 | $204 | ($12) | (5.8%) | (1.5%) |
| Dept. of City Planning | $48 | $46 | $41 | $41 | $41 | ($7) | (15.2%) | (4.0%) |
| Dept. of Investigation | $49 | $35 | $33 | $33 | $33 | ($16) | (32.4%) | (9.3%) |
| NY Public Library — Research | $28 | $28 | $28 | $28 | $28 | ($0) | (0.2%) | (0.0%) |
| New York Public Library | $138 | $137 | $137 | $137 | $137 | ($1) | (0.4%) | (0.1%) |
| Brooklyn Public Library | $103 | $102 | $102 | $102 | $102 | ($1) | (0.5%) | (0.1%) |
| Queens Borough Public Library | $105 | $105 | $105 | $105 | $105 | ($0) | (0.2%) | (0.1%) |
| Dept. of Education | $24,349 | $25,586 | $26,325 | $27,046 | $27,700 | $3,351 | 13.8% | 3.3% |
| City University | $1,154 | $1,157 | $1,169 | $1,185 | $1,200 | $46 | 4.0% | 1.0% |
| Civilian Complaint Review Board | $16 | $17 | $17 | $17 | $17 | $1 | 4.3% | 1.1% |
| Police Dept. | $5,484 | $5,309 | $5,269 | $5,236 | $5,236 | ($249) | (4.5%) | (1.2%) |
| Fire Dept. | $2,089 | $2,012 | $2,029 | $2,027 | $2,021 | ($68) | (3.3%) | (0.8%) |
| Dept. of Veterans’ Services | $4 | $5 | $5 | $5 | $5 | $0 | 3.2% | 0.8% |
| Admin. for Children Services | $3,075 | $2,564 | $2,578 | $2,585 | $2,577 | ($498) | (16.2%) | (4.3%) |
| Dept. of Social Services | $9,898 | $9,876 | $9,933 | $9,944 | $9,936 | $38 | 0.4% | 0.1% |
| Dept. of Homeless Services | $1,822 | $1,819 | $1,835 | $1,841 | $1,841 | $19 | 1.0% | 0.3% |
| Dept. of Correction | $1,449 | $1,404 | $1,417 | $1,428 | $1,428 | ($21) | (1.5%) | (0.4%) |
| Board of Correction | $3 | $3 | $3 | $3 | $3 | $0 | 9.7% | 2.3% |
| Citywide Pension Contribution | $9,478 | $9,690 | $9,651 | $9,566 | $9,770 | $292 | 3.1% | 0.8% |
| Miscellaneous | $9,675 | $11,339 | $12,119 | $13,068 | $12,961 | $3,286 | 34.0% | 7.6% |
| Debt Service | $4,188 | $4,224 | $4,536 | $4,719 | $5,061 | $873 | 20.9% | 4.8% |
| T.F.A. Debt Service | $2,224 | $2,864 | $3,128 | $3,408 | $3,754 | $1,530 | 68.8% | 14.0% |
| FY 2017 BSA and Discretionary Transfers | ($4,180) | $0 | $0 | $0 | $0 | $4,180 | (100.0%) | (100.0%) |
| FY 2018 BSA | $2,584 | ($2,584) | $0 | $0 | $0 | ($2,584) | (100.0%) | (100.0%) |
| Public Advocate | $4 | $4 | $4 | $4 | $4 | $0 | 0.0% | 0.0% |
| City Council | $65 | $54 | $54 | $54 | $54 | ($11) | (16.7%) | (4.5%) |
| City Clerk | $5 | $5 | $6 | $6 | $6 | ($0) | 1.6% | 0.4% |
| Dept. for the Aging | $370 | $344 | $350 | $351 | $351 | ($19) | (5.2%) | (1.3%) |
| Dept. of Cultural Affairs | $188 | $144 | $142 | $142 | $142 | ($46) | (24.7%) | (6.8%) |
| Financial Info. Serv. Agency | $108 | $114 | $115 | $112 | $112 | $4 | 3.4% | 0.8% |
| Office of Payroll Admin. | $17 | $17 | $17 | $17 | $17 | $0 | 1.9% | 0.5% |
| Independent Budget Office | $6 | $5 | $5 | $5 | $5 | ($0) | (8.1%) | (2.1%) |
| Equal Employment Practices | $1 | $1 | $1 | $1 | $1 | $0 | 7.1% | 1.7% |
| Civil Service Commission | $1 | $1 | $1 | $1 | $1 | $0 | 8.5% | 2.1% |
| Landmarks Preservation Commission | $6 | $7 | $7 | $7 | $7 | $0 | 5.2% | 1.3% |
| Taxi & Limousine Commission | $57 | $61 | $60 | $60 | $60 | $2 | 4.0% | 1.0% |
| Commission on Human Rights | $15 | $14 | $14 | $14 | $14 | ($1) | (4.8%) | (1.2%) |
| Youth & Community Development | $674 | $522 | $540 | $543 | $543 | ($132) | (19.5%) | (5.3%) |
| Conflicts of Interest Board | $3 | $3 | $3 | $3 | $3 | $0 | 0.0% | 0.0% |
| Office of Collective Bargaining | $2 | $2 | $2 | $2 | $2 | ($0) | (5.5%) | (1.4%) |
| Community Boards (All) | $18 | $17 | $17 | $17 | $17 | ($1) | (3.3%) | (0.8%) |
| Dept. of Probation | $94 | $95 | $95 | $95 | $95 | $1 | 1.4% | 0.3% |
| Dept. Small Business Services | $305 | $172 | $164 | $153 | $133 | ($172) | (56.3%) | (18.7%) |
| Housing Preservation & Development | $1,327 | $869 | $786 | $783 | $791 | ($536) | (40.4%) | (12.1%) |
| Dept. of Buildings | $191 | $183 | $187 | $178 | $179 | ($13) | (6.7%) | (1.7%) |
| Dept. of Health & Mental Hygiene | $1,659 | $1,607 | $1,633 | $1,634 | $1,634 | ($25) | (1.5%) | (0.4%) |
| NYC Health + Hospitals | $796 | $814 | $918 | $818 | $818 | $22 | 2.8% | 0.7% |
| Office of Administrative Trials & Hearings | $47 | $49 | $50 | $50 | $50 | $3 | 5.4% | 1.3% |
| Dept. of Environmental Protection | $1,501 | $1,306 | $1,233 | $1,222 | $1,219 | ($282) | (18.8%) | (5.1%) |
| Dept. of Sanitation | $1,678 | $1,702 | $1,715 | $1,713 | $1,714 | $36 | 2.1% | 0.5% |
| Business Integrity Commission | $9 | $9 | $9 | $9 | $9 | ($0) | (4.1%) | (1.0%) |
| Dept. of Finance | $296 | $302 | $301 | $300 | $300 | $4 | 1.2% | 0.3% |
| Dept. of Transportation | $997 | $962 | $925 | $925 | $926 | ($71) | (7.1%) | (1.8%) |
| Dept. of Parks and Recreation | $509 | $447 | $447 | $446 | $446 | ($63) | (12.5%) | (3.3%) |
| Dept. of Design & Construction | $507 | $155 | $159 | $146 | $146 | ($361) | (71.1%) | (26.7%) |
| Dept. of Citywide Admin. Services | $493 | $423 | $422 | $422 | $422 | ($71) | (14.4%) | (3.8%) |
| D.O.I.T.T. | $598 | $466 | $452 | $451 | $450 | ($148) | (24.7%) | (6.9%) |
| Dept. of Record & Info. Services | $8 | $9 | $9 | $9 | $9 | $1 | 9.7% | 2.3% |
| Dept. of Consumer Affairs | $40 | $39 | $39 | $39 | $39 | ($1) | (1.7%) | (0.4%) |
| District Attorney – N.Y. | $124 | $103 | $103 | $103 | $103 | ($20) | (16.5%) | (4.4%) |
| District Attorney – Bronx | $74 | $72 | $72 | $72 | $72 | ($2) | (3.2%) | (0.8%) |
| District Attorney – Kings | $100 | $97 | $97 | $97 | $97 | ($3) | (2.9%) | (0.7%) |
| District Attorney –Queens | $65 | $64 | $64 | $64 | $64 | ($1) | (2.2%) | (0.6%) |
| District Attorney – Richmond | $15 | $14 | $14 | $14 | $14 | ($1) | (5.2%) | (1.3%) |
| Office of Prosec. & Special Narc. | $22 | $22 | $22 | $22 | $22 | $0 | 0.5% | 0.1% |
| Public Administrator – N.Y. | $3 | $3 | $3 | $3 | $3 | ($0) | (1.6%) | (0.4%) |
| Public Administrator – Bronx | $1 | $1 | $1 | $1 | $1 | ($0) | (2.8%) | (0.7%) |
| Public Administrator – Brooklyn | $1 | $1 | $1 | $1 | $1 | $0 | 0.5% | 0.1% |
| Public Administrator – Queens | $1 | $1 | $1 | $1 | $1 | $0 | 1.9% | 0.5% |
| Public Administrator – Richmond | $1 | $1 | $1 | $1 | $1 | $0 | 1.1% | 0.3% |
| Prior Payable Adjustment | ($400) | $0 | $0 | $0 | $0 | $400 | (100.0%) | (100.0%) |
| General Reserve | $300 | $1,000 | $1,000 | $1,000 | $1,000 | $700 | 233.3% | 35.1% |
| Citywide Savings Initiatives | $0 | ($56) | ($86) | ($114) | ($115) | ($115) | NA | NA |
| Energy Adjustment | $0 | $22 | $58 | $101 | $137 | $137 | NA | NA |
| Lease Adjustment | $0 | $35 | $70 | $107 | $145 | $145 | NA | NA |
| OTPS Inflation Adjustment | $0 | $0 | $111 | $167 | $222 | $222 | NA | NA |
| TOTAL EXPENDITURES | $87,440 | $88,666 | $93,478 | $95,498 | $97,041 | $9,601 | 11.0% | 2.6% |
[2] On April 13, 2015, the Governor signed into law a corporate income tax reform for New York City, which combined the taxation of all New York City C-corporations formally paid under the banking corporation tax and the general corporation tax. These corporations now pay under the new Business Corporation Tax.
[3] Preliminary Report on the Federal Tax Cuts and Jobs Act. https://www.tax.ny.gov/pdf/stats/stat_pit/pit/preliminary-report-tcja-2017.pdf
[4] In addition to decoupling provisions, the Governor also proposed legislation that would help mitigate the impact of SALT limitations through the establishment of a payroll tax and the expanded use of charitable deductions. The impact of these proposals have not been incorporated in the forecast since these are primarily designed to lower federal tax liability and they still face considerable legal and implementation challenges.
[5] While the tax law provides an incentive for filers to prepay their current year tax liability, the Conference Committee language explicitly warned taxpayers not to prepay future years. Therefore, even with the large jump in payments seen in December and January, we think that extension filers will likely make some payments in April, so as to not incur penalties for prepaying tax year 2018 liability.
[6] Repeal of the 3.8 percent surcharge on investment income was discussed as part of the failed attempt to repeal the Affordable Care Act.
[7] http://fortune.com/2018/02/15/cisco-tax-repatriation-windfall/
[8] In FY 2016, the State began to intercept the City’s sale tax revenues to recoup savings associated with the Sales Tax Asset Receivable Corporation (STARC) bonds refinancing, from which the City generated $650 million in savings. The State intercepted $50 million in FY 2016, $200 million in FY 2017, and is expected to collect another $200 million in FY 2018 and $150 million in FY 2019. The City’s Financial Plan recognizes $200 million in sales tax intercept in FY 2018 but does not recognize the remaining $150 million payment in FY 2019.
[9] Miscellaneous revenue analysis excludes private grants and intra-City revenues.
[10] This estimate excludes exemptions for payments associated with debt service, court orders or judgments, and community project funds which could not be accurately estimated. However, the impact from these exemptions is expected to be small.
[11] The FY 2018 health insurance cost reflects a reduction of $400 million from an FY 2017 prepayment.
[12] The senior care rate is the premium the City pays to supplement shortfalls in Medicare benefits so that Medicare eligible retirees can maintain a similar level of benefits as active employees.
[13] The FY 2018 Adopted Capital Plan contained information from FYs 2018-2021 only.
[14] After netting out the reserve for unattained commitments, the increase in all-funds commitments drops to $733 million.
[15] DEP capital commitments are primarily funded through the issuance of NY Water Finance Authority Debt.
[16] The changes described are from FYs 2018-2021 only, as the November Plan did not contain FY 2022 data.
[17] Although the Commitment Plan increased in February 2018, OMB chose not to change its borrowing assumptions for GO and TFA as of this Plan. OMB will seek to “‘true-up” its figures in the Executive Budget process.
[18] Includes GO Conduit debt, TFA PIT bonds, and TSASC.
[19] Changes are from FYs 2018-2021 alone as the November 2017 Plan did not include FY 2022 data.
[20] Debt service in this discussion is adjusted to exclude prepayments.