Comments on New York City’s Preliminary Budget for Fiscal Year 2020 and Financial Plan for Fiscal Years 2019 – 2023
Executive Summary
The U.S. economy reached its ninth year of expansion in 2018, with GDP growing by 2.9 percent in 2018 — the fastest rate since 2015. However, the risks to continued economic expansion also grew in the last year. These included protectionist trade policies, contractionary monetary policy, instability in the government (notably the risk of government shutdowns), and high levels of volatility in the financial markets. We believe that economic growth will begin slowing in 2019, but the risk of a recession this year appears to be waning as tensions with China are being resolved and the Federal Reserve is on the record to exercise restraint in raising interest rates. Nonetheless, the Comptroller’s Office expects growth to slow beginning this year through the remainder of the Financial Plan period.
Against this backdrop of a looming economic slowdown, it is important that the City take adequate measures to avoid cuts to essential services. The growth of accumulated prior year surpluses, which rose by $1.60 billion in FY 2015, have been sharply lower since then, with additions of $514 million in FY 2016, $142 million in FY 2017 and $396 million in FY 2018. Similarly, deposits into the Retiree Health Benefit Trust (RHBT) in excess of what is needed for pay-as-you-go health benefits for current retirees, dropped from $955 million in FY 2015 to $500 million in FY 2016 and $100 million each year thereafter. Consistent with past financial plans released with the preliminary budgets, the February 2018 Financial Plan anticipates using part of the accumulated surplus — $1.41 billion — to balance the current fiscal budget, leaving $3.17 billion to roll into FY 2020. The City will need to identify almost $2 billion in combined additional resources and savings before the end of the current fiscal year to match last fiscal year’s addition to the accumulated surplus and additional deposit into RHBT.
The FY 2020 Preliminary Budget released on February 7 shows a balanced budget of $92.2 billion. Revenues in the Preliminary Budget are $763 million higher than projected in the November Plan. Expenditures are $2.42 billion lower, driven by an increase of $2.65 billion in planned prepayment of FY 2020 debt service. The combination of higher revenues and lower expenditures closes a $3.18 billion gap projected in November.
Included in the February Plan is a new round of the Citywide Savings Program (CSP) which is expected to provide budget relief totaling $1.85 billion over the Plan period. More than 40 percent of the benefits are expected to occur in FY 2019 with estimated savings of $770 million. Almost half of this savings is due to a $371 million reimbursements from Heath + Hospitals primarily for debt service, tort claim and retiree health benefits payments made on its behalf in FY 2015 and FY 2016.
With the exception of FY 2020, the Comptroller’s Office’s analysis of the February Plan has identified net additional resources in each year of the Financial Plan ranging from a low of $117 million in FY 2023 to a high of $285 million in FY 2022. For FY 2020, the Comptroller’s Office’s higher expenditure estimates are almost completely offset by a higher revenue forecast. As a result the Comptroller’s Office projects a budget surplus of $160 million in FY 2019, a nominal gap of $1 million in FY 2020, and somewhat smaller gaps of $3.27 billion, $2.65 billion, and $3.18 billion in FY 2021 through FY 2023, respectively, than those projected in the Financial Plan. A new risk identified by the Comptroller’s Office in the current plan is the absence of funding for the Fair Fare program. Despite initial opposition by the Administration, the February Plan extends the program into FY 2020 without a dedicated source of revenue to support it. It becomes increasingly unlikely that the program will be discontinued in the outyears, once it has taken root in FY 2019 and FY 2020, and we therefore anticipate that full funding of at least $212 million will need to be included annually for the program beginning in FY 2021.
The City’s Draft Ten-Year Capital Strategy envisions $104 billion in capital investment over the decade of 2020 through 2029, 94 percent funded with City debt. Over half the total, $56.6 billion, is for State of Good Repair projects, with the rest split between Program Expansion ($26.4 billion) and Programmatic Replacement ($21.1 billion). Debt service is projected to rise to over 13 percent of City tax revenues by FY 2023. Slower than projected revenue growth, however, could drive the ratio up toward the 15 percent benchmark threshold.
The Comptroller urges the Mayor and Council to set more ambitious targets for increasing annual surpluses to bolster the financial cushion available in the event of an economic downturn or other contingency, including through a more rigorous examination of agency spending and effectiveness. Such steps are needed now to avoid more painful measures in the future.
Table 1. FY 2019 – FY 2023 Financial Plan
| ($ in millions) | FY 2019 | FY 2020 | FY 2021 | FY 2022 | FY 2023 | Change FYs 2019 –2023 Dollar Percent |
|
| Revenues | |||||||
| Taxes: | |||||||
| General Property Tax | $28,046 | $29,711 | $31,089 | $32,328 | $33,286 | $5,240 | 18.7% |
| Other Taxes | 31,578 | 32,207 | 32,958 | 33,881 | 34,888 | 3,310 | 10.5% |
| Tax Audit Revenues | 1,057 | 998 | 721 | 721 | 721 | (336) | (31.8%) |
| Subtotal: Taxes | $60,681 | $62,916 | $64,768 | $66,930 | $68,895 | $8,214 | 13.5% |
| Miscellaneous Revenues | $7,633 | $6,799 | $6,772 | $6,747 | $6,735 | ($898) | (11.8%) |
| Unrestricted Intergovernmental Aid | $151 | $0 | $0 | $0 | $0 | ($151) | (100.0%) |
| Less: Intra-City Revenues | ($2,154) | ($1,794) | ($1,796) | ($1,794) | ($1,792) | $362 | (16.8%) |
| Disallowances Against Categorical Grants | $91 | ($15) | ($15) | ($15) | ($15) | ($106) | (116.5%) |
| Subtotal: City-Funds | $66,402 | $67,906 | $69,729 | $71,868 | $73,823 | $7,421 | 11.2% |
| Other Categorical Grants | 1,198 | 926 | 868 | 862 | 862 | (336) | (28.0%) |
| Inter-Fund Revenues | 690 | 661 | 662 | 661 | 661 | (29) | (4.2%) |
| Federal Categorical Grants | 8,471 | 7,327 | 7,205 | 7,133 | 7,120 | (1,351) | (15.9%) |
| State Categorical Grants | 15,258 | 15,390 | 15,837 | 16,305 | 16,353 | 1,095 | 7.2% |
| Total Revenues | $92,019 | $92,210 | $94,301 | $96,829 | $98,819 | $6,800 | 7.4% |
| Expenditures | |||||||
| Personal Service | |||||||
| Salaries and Wages | $29,016 | $30,240 | $31,258 | $31,115 | $31,642 | $2,626 | 9.1% |
| Pensions | 9,850 | 9,951 | 10,418 | 10,864 | 11,070 | 1,220 | 12.4% |
| Fringe Benefits | 10,643 | 11,536 | 12,028 | 12,705 | 13,385 | 2,742 | 25.8% |
| Subtotal-PS | $49,509 | $51,727 | $53,704 | $54,684 | $56,097 | $6,588 | 13.3% |
| Other Than Personal Service | |||||||
| Medical Assistance | $5,915 | $5,915 | $5,915 | $5,915 | $5,915 | $0 | 0.0% |
| Public Assistance | 1,595 | 1,617 | 1,617 | 1,617 | 1,617 | 22 | 1.4% |
| All Other | 31,524 | 29,319 | 29,469 | 29,759 | 29,942 | (1,582) | (5.0%) |
| Subtotal-OTPS | $39,034 | $36,851 | $37,001 | $37,291 | $37,474 | ($1,560) | (4.0%) |
| Debt Service | |||||||
| Principal | $3,411 | $3,637 | $3,719 | $3,849 | $3,958 | $547 | 16.0% |
| Interest & Offsets | 3,326 | 3,708 | 3,939 | 4,488 | 5,128 | 1,802 | 54.2% |
| Subtotal Debt Service | $6,737 | $7,345 | $7,658 | $8,337 | $9,086 | $2,349 | 34.9% |
| FY 2018 BSA and Discretionary Transfers | ($4,576) | $0 | $0 | $0 | $0 | $4,576 | (100.0%) |
| FY 2019 BSA | $3,169 | ($3,169) | $0 | $0 | $0 | ($3,169) | (100.0%) |
| Capital Stabilization Reserve | 0 | 250 | 250 | 250 | 250 | 250 | NA |
| General Reserve | 300 | 1,000 | 1,000 | 1,000 | 1,000 | 700 | 233.3% |
| Subtotal | $94,173 | $94,004 | $99,613 | $101,562 | $103,907 | $9,734 | 10.3% |
| Less: Intra-City Expenses | (2,154) | (1,794) | (1,796) | (1,794) | (1,792) | 362 | (16.8%) |
| Total Expenditures | $92,019 | $92,210 | $97,817 | $99,768 | $102,115 | $10,096 | 11.0% |
| Gap To Be Closed | $0 | $0 | ($3,516) | ($2,939) | ($3,296) | ($3,296) | NA |
Table 2. Plan-to-Plan Changes February 2019 Plan vs. November 2018 Plan
($ in millions) |
FY 2019 | FY 2020 | FY 2021 | FY 2022 |
| Revenues | ||||
| Taxes: | ||||
| General Property Tax | $72 | $234 | $198 | $448 |
| Other Taxes | 155 | 56 | (192) | (13) |
| Tax Audit Revenues | 1 | 277 | 0 | 0 |
| Subtotal: Taxes | $228 | $567 | $6 | $435 |
| Miscellaneous Revenues | 524 | 13 | (1) | (2) |
| Unrestricted Intergovernmental Aid | 90 | 0 | 0 | 0 |
| Less: Intra-City Revenues | (80) | 10 | 9 | 9 |
| Disallowances Against Categorical Grants | 106 | 0 | 0 | 0 |
| Subtotal: City-Funds | $868 | $590 | $14 | $442 |
| Other Categorical Grants | 216 | 51 | 1 | 1 |
| Inter-Fund Revenues | 0 | 6 | 8 | 6 |
| Federal Categorical Grants | 256 | 62 | 56 | 8 |
| State Categorical Grants | 122 | 54 | 47 | 46 |
| Total Revenues | $1,462 | $763 | $126 | $503 |
| Expenditures | ||||
| Personal Service | ||||
| Salaries and Wages | ($16) | ($128) | ($172) | ($216) |
| Pensions | 0 | 0 | 0 | 0 |
| Fringe Benefits | 18 | 116 | 127 | 150 |
| Subtotal-PS | $2 | ($12) | ($45) | ($66) |
| Other Than Personal Service | ||||
| Medical Assistance | $0 | $0 | $0 | $0 |
| Public Assistance | (10) | 0 | 0 | 0 |
| All Other | 58 | 245 | 165 | 187 |
| Subtotal-OTPS | $48 | $245 | $165 | $187 |
| Debt Service | ||||
| Principal | $0 | $0 | $22 | $21 |
| Interest & Offsets | ($82) | ($10) | ($44) | ($70) |
| Subtotal Debt Service | (82) | (10) | (22) | (49) |
| FY 2018 BSA and Discretionary Transfers | $0 | $0 | $0 | $0 |
| FY 2020BSA | $2,649 | ($2,649) | $0 | $0 |
| Capital Stabilization Reserve | ($250) | $0 | $0 | $0 |
| General Reserve | ($825) | $0 | $0 | $0 |
| Subtotal | $1,542 | ($2,426) | $98 | $72 |
| Less: Intra-City Expenses | (80) | 10 | 9 | 9 |
| Total Expenditures | $1,462 | ($2,416) | $107 | $81 |
| Gap To Be Closed | $0 | $3,179 | $19 | $422 |
Note: The November Financial Plan only covers the period FY 2019 to FY 2022
Table 3. Plan-to-Plan Changes February 2019 Plan vs. June 2018 Plan
($ in millions) |
FY 2019 | FY 2020 | FY 2021 | FY 2022 |
| Revenues | ||||
| Taxes: | ||||
| General Property Tax | $72 | $234 | $198 | $448 |
| Other Taxes | 532 | 56 | (192) | (13) |
| Tax Audit Revenues | 1 | 277 | 0 | 0 |
| Subtotal: Taxes | $605 | $567 | $6 | $435 |
| Unrestricted Intergovernmental Aid | 841 | 68 | 35 | 31 |
| Miscellaneous Revenues | 151 | 0 | 0 | 0 |
| Less: Intra-City Revenues | (329) | (23) | (20) | (18) |
| Disallowances Against Categorical Grants | 106 | 0 | 0 | 0 |
| Subtotal: City-Funds | $1,374 | $612 | $21 | $448 |
| Other Categorical Grants | 318 | 54 | 1 | 1 |
| Inter-Fund Revenues | 8 | 20 | 24 | 23 |
| Federal Categorical Grants | 879 | 198 | 97 | 41 |
| State Categorical Grants | 282 | 88 | 74 | 59 |
| Total Revenues | $2,861 | $972 | $217 | $572 |
| Expenditures | ||||
| Personal Service | ||||
| Salaries and Wages | $270 | $620 | $890 | $1,046 |
| Pensions | (2) | 48 | 256 | 497 |
| Fringe Benefits | (94) | (107) | (386) | (389) |
| Subtotal-PS | $174 | $561 | $760 | $1,154 |
| Other Than Personal Service | ||||
| Medical Assistance | $0 | $0 | $0 | $0 |
| Public Assistance | (10) | 0 | 0 | 0 |
| All Other | 1,182 | 471 | 302 | 313 |
| Subtotal-OTPS | $1,172 | $471 | $302 | $313 |
| Debt Service | ||||
| Principal | ($18) | $1 | $87 | $88 |
| Interest & Offsets | (232) | (130) | (285) | (311) |
| Subtotal Debt Service | ($250) | ($129) | ($198) | ($223) |
| FY 2018 BSA and Discretionary Transfers | $0 | $0 | $0 | $0 |
| FY 2019 BSA | $3,169 | ($3,169) | $0 | $0 |
| Capital Stabilization Reserve | ($250) | $0 | $0 | $0 |
| General Reserve | ($825) | $0 | $0 | $0 |
| Subtotal | $3,190 | ($2,266) | $864 | $1,244 |
| Less: Intra-City Expenses | (329) | (23) | (20) | (18) |
| Total Expenditures | $2,861 | ($2,289) | $844 | $1,226 |
| Gap To Be Closed | $0 | $3,260 | ($627) | ($654) |
Table 4. Risks and Offsets to the February 2019 Financial Plan)
($ in millions, positive numbers decrease the gap and negative numbers increase the gap
| FY 2019 | FY 2020 | FY 2021 | FY 2022 | FY 2023 | |
| City Stated Gap | $0 | $0 | ($3,516) | ($2,939) | ($3,296) |
| Tax Revenues | |||||
| Property Tax | $0 | $200 | $387 | $735 | $1,085 |
| Personal Income Tax | (103) | 49 | 88 | 46 | (59) |
| Business Taxes | 145 | (81) | (11) | 9 | 31 |
| Sales Tax | 77 | 158 | 165 | 150 | 107 |
| Real Estate-Related Taxes | (84) | 108 | 166 | 82 | (30) |
| Audit | 0 | 0 | 179 | 179 | 179 |
| Subtotal Tax Revenues | $35 | $434 | $974 | $1,201 | $1,313 |
| Non-Tax Revenues | |||||
| ECB Fines | $4 | $13 | $13 | $19 | $19 |
| Late Filing/No Permit Penalties | 4 | 4 | 10 | 10 | 10 |
| Motor Vehicle Fines | 2 | 2 | 2 | 2 | 2 |
| Parking Violations Fines | 8 | 5 | 5 | 5 | 5 |
| Subtotal Non-Tax Revenues | $18 | $24 | $30 | $36 | $36 |
| Total Revenues | $53 | $458 | $1,004 | $1,237 | $1,349 |
| Expenditures | |||||
| Overtime | ($193) | ($122) | ($150) | ($150) | ($150) |
| Charter School Tuition | 0 | (119) | (281) | (478) | (758) |
| DOE Medicaid Reimbursement | (20) | (20) | (20) | (20) | (20) |
| Carter Cases | (80) | (80) | (80) | (80) | (80) |
| Fair Fares | 50 | (106) | (212) | (212) | (212) |
| Homeless Shelters | 0 | (12) | (12) | (12) | (12) |
| VRDB Interest Savings | 50 | 0 | 0 | 0 | 0 |
| General Reserve | 300 | 0 | 0 | 0 | 0 |
| Total Expenditures | $107 | ($459) | ($755) | ($952) | ($1,232) |
| Total (Risks)/Offsets | $160 | ($1) | $249 | $285 | $117 |
| Restated (Gap)/Surplus | $160 | ($1) | ($3,267) | ($2,654) | ($3,179) |
State of the City’s Economy
The economy has entered its tenth year of expansion and is on track to be the longest expansion since the U.S. government started collecting statistics in the mid-1800s. The U.S. economy is exhibiting strong late cycle growth in employment, consumption, production, and, most recently, in wages. Highlights of 2018 included four increases in the Fed Funds rate, record low unemployment rates, strong job growth and higher average hourly earnings. The Federal Tax Cuts and Jobs Act (TCJA) reduced corporate and personal income tax rates, and combined with a 13 percent increase in Federal spending, provided a boost to the economy. Despite record low unemployment, rising inflation, which would typically be consistent with low unemployment and rising wages, has been noticeably subdued.
The City’s economy continued to grow in 2018 and, like the economy of the U.S. in general, accelerated despite the long expansion, contractionary monetary policy, and volatile financial markets. As in the nation as a whole, inflation remained subdued.
The much talked about risks to continued growth: protectionist trade policies, contractionary monetary policy, instability in the government (notably the risk of government shutdowns), and high levels of volatility in the financial markets, continue to exist albeit are mitigated by reports of the U.S. and China reaching agreement on trade and promised restraint by the Federal Reserve’s FOMC. The biggest remaining risk to sustained growth is likely the reported inability of businesses to find the qualified workers they need to meet their demand. A smaller, but still important risk, is the contagion of recessions in some of our major trading partners notably the European Union and China.
U.S. Economic Outlook
The U.S. economy ended its ninth year of expansion in 2018 making it the second longest expansion on record. GDP grew by 2.9 percent in 2018, the fastest since 2015 despite the trade tensions with China, the Federal Reserve’s contractionary monetary policy, and the government’s partial shutdown. Consumer spending grew 2.6 percent in 2018, slightly higher than 2.5 percent in 2017. Private investment, spurred by corporate tax cuts, grew surprisingly strong at 6.0 percent, the highest since 6.9 percent in 2013. The largest component of investment growth was in nonresidential fixed investment which includes business structures, equipment, and intellectual property.
We believe that economic growth will begin slowing in 2019, however the risk of a recession this year appears to be waning as tensions with China are being resolved and the Federal Reserve is on the record to exhibit restraint in raising interest rates until economic data indicate that there is a real risk of inflation from an overheated economy.
The nation’s labor market performed well in 2018. U.S. businesses added over 2.4 million jobs (a gain of 1.7 percent), marking the eighth consecutive year of job growth. The unemployment rate fell to 3.9 percent, the lowest rate since 1969. A tight labor market led to a rise in earnings. Average hourly earnings of U.S. private employees rose 3.0 percent — close to the record growth rate seen in 2008. Despite healthy wage increases, the core inflation rate (excluding the volatile food and energy sectors) rose only 2.1 percent, close to the Federal Reserve’s target rate of 2 percent.
Our economic forecast is for continued growth, but at a slower pace. The reasons for continued growth are a healthy consumer sector, low oil prices, and accommodative monetary policy by the Federal Reserve. Consumer spending — fueled by a strong labor market and wage gains, healthy household balance sheet, and low oil prices — should remain strong in 2019. Payroll jobs grew by 304,000 in January 2019, 36 percent higher than the 223,000 average monthly job gain in 2018.
The unemployment rate was essentially flat at 4.0 percent in January. There was a small uptick from December 2018 which could be the result of the partial federal government shutdown that has since ended.
Average hourly earnings grew 3.2 percent in January 2019, lower than 4.1 percent in the previous month, but higher than the 2.1 percent a year ago. The inflation rate, as measured by the change in consumer price index for the urban consumer (CPI-U), was 2.4 percent in 2018, the highest since 3.2 percent in 2011.
Consumer financials are strong. Household debt service payments and financial obligations as a percentage of disposable personal income are hovering around their historical lows. Chart 1 shows household financial obligation and debt service ratios as a percent of disposable income. Consumer net worth is at its historical high as shown in Chart 2.
Chart 1. Household Debt Service Obligations, 1980Q1 to 2018Q3
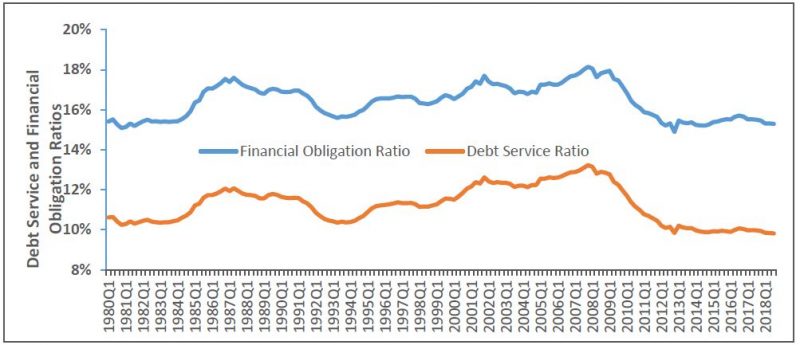
Source: Federal Reserve Board of Governors
Chart 2. Household and Nonprofit Organizations Net Worth 1952Q1 to 2018Q3
($ in trillions)
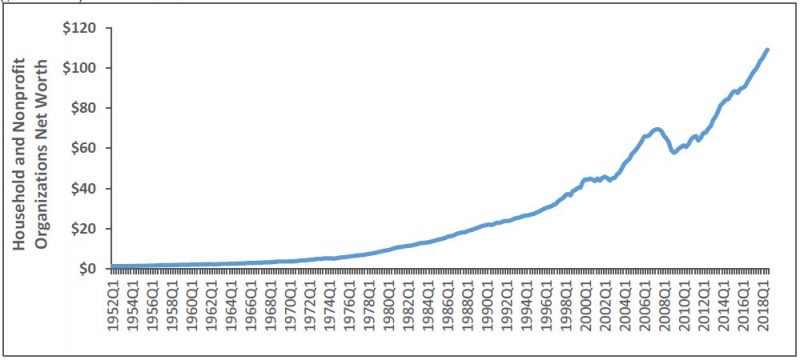
Source: Federal Reserve Board of Governors
Finally, oil prices are low. Oil prices, as measured by the West Texas Intermediary spot prices, were $51.38 per barrel in January 2019, lower than the $64.94 monthly average in 2018 and the $72.89 monthly average during the past decade (Chart 3). Oil prices are expected to be between $50 and $60 in 2019. Oil prices are depressed mostly as a result of the slower economy in China and the U.S. re-entering the global petroleum market as a net exporter as a result of changes in extraction technology.
Chart 3. West Texas Intermediary (WTI) Spot Prices, 1986 to 2019
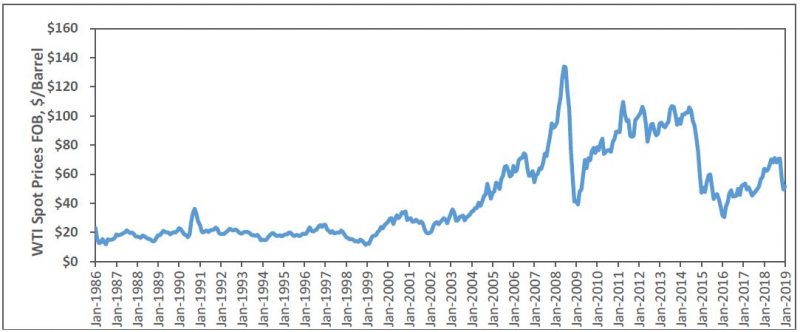
Source: U.S. Energy Information Administration
Generally, lower oil prices keep price increases of manufactured products at bay (Chart 4), which leads to lower inflation rate and encourage consumer spending. Additionally, lower inflation should keep the pressure off the Fed to raise the interest rates.
Chart 4. Change in WTI vs. Inflation Rate, 1987 to 2019
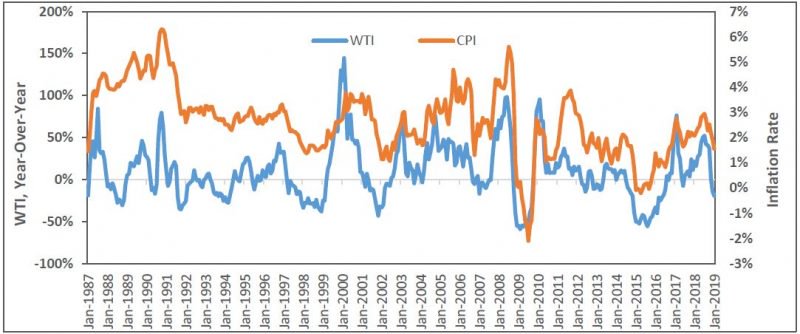
Source: U.S. Energy Information Administration and Bureau of Labor Statistics.
The biggest reform of the U.S. tax codes in more than 30 years was enacted in December of 2017 and came into effect in January 2018. This boost in fiscal policy contributed to 2018 economic growth. It is expected to have less economic impact on consumer spending and private investment in 2019. In fact, the Congressional Budget Office estimates a drop in GDP growth to 2.3 percent this year from 2.9 percent last year as the effects of President Donald Trump’s tax cut on business investment begin to fade.[1] Furthermore, tax revenues are expected to decline, raising the U.S. budget deficit to $897 billion in 2019.
The primary risk to our forecast is that business growth will be constrained by an inability to staff open positions with qualified workers. Other risks include recessions in the European Union and China, the breakdown of trade negotiations with major trading partners leading to higher tariffs on imported goods and the retaliation by those partners, and instability in the federal government’s ability to keep the government functioning past September. China’s share of total world imports increased from 6.9 percent in 2007 to 11.4 percent in 2017 while the U.S. share of the world imports rose from 14.5 percent to 14.9 percent during the same period.[2] This means that China’s economic slowdown could lower its imports and thus, significantly impact the global economy. According to the latest IMF World Economic Outlook report, the global economy is expected to grow 3.7 percent in 2018, 3.5 percent in 2019, and 3.6 percent in 2020.[3] There is much anecdotal evidence to show the adverse economic impact of the trade war with China on U.S. companies.[4]
New York City’s Economic Condition and Outlook
The City’s economy grew 3.0 percent in 2018, the fastest growth since 3.9 percent in 2015, and higher than the nation’s 2.9 percent. As of 2018, the City has outperformed the nation for the tenth consecutive year.
Chart 5. Change in Real GDP and GCP, 2000 to 2018
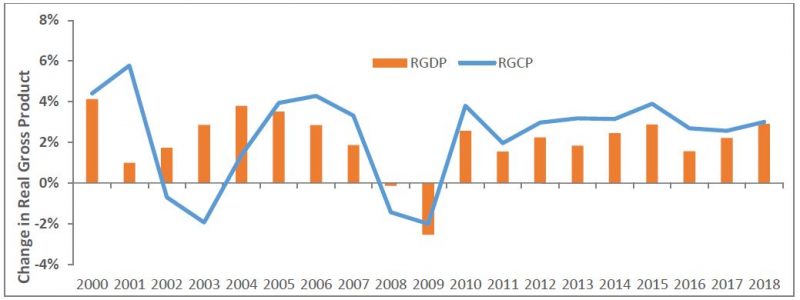
Source: Bureau of Economic Analysis and NYC Comptroller’s Office.
Private-sector jobs in the City were up by 74,200 or 1.9 percent, the same rate of growth as in the nation. This is the City’s ninth consecutive year of job creation, making it the longest sequence of job gains on record. Since the City’s recovery from the recession began in 2010, private-sector jobs in the City have increased by 804,100 or 25.6 percent to a record high of almost four million workers. Although private-sector job growth has been slowing since 2014 when it added a record high of 130,100 jobs, it is still above the historical average of about 35,000 per year.
Chart 6. Change in NYC Private Sector Jobs: Three Cycles
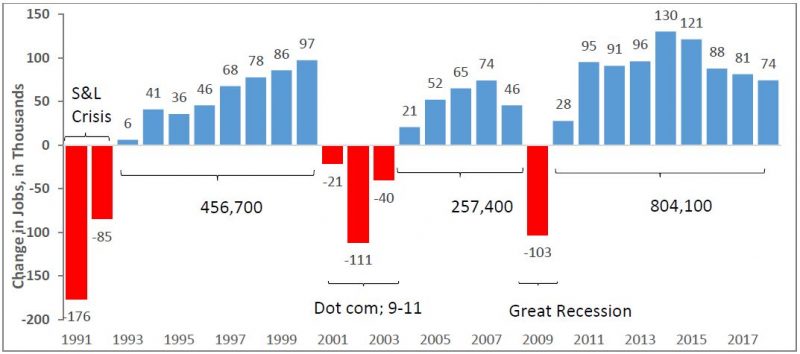
Source: NYS Department of Labor and Bureau of Labor Statistics
Note: Jobs are based on average of monthly data.
The unemployment rate fell to a record low of 4.1 percent in 2018. The labor force grew by 2,900 to a record high of over 4.2 million. The labor force participation rate held steady at 60.8 percent in 2018, after a record high of 60.9 percent in 2017. Similarly, the number of city residents employed increased by 21,700 to its record high of about 4.1 million, and the employment-to-population ratio rose to a record high of 58.3 percent in 2018.
Despite these generally impressive statistics, job growth has been disappointing for two reasons: poor job composition and uneven wage gains. First, the composition of jobs has been deteriorating in terms of income. Well over half of new private-sector jobs created in 2018 (62.5 percent) were in low-wage industries such as restaurants and bars. Medium wage industries made up 22.5 percent of new private-sector jobs, while the remaining 15.0 percent were in high-wage industries such as the securities industry. [5]
Comparing 2018 job growth distribution among the three wage categories to the previous cycle’s peak in private-sector job growth in 2008, the shares of new high and medium wage jobs have declined, while the share of new low-wage jobs has increased. The trend of creating jobs in the low wage category seems to be continuing. The shares of new high, medium, and low wage jobs in the private-sector during these two peak periods are shown in Chart 7.
Chart 7. NYC Payroll Jobs Composition, Percent of Total Private,2008 vs. 2018
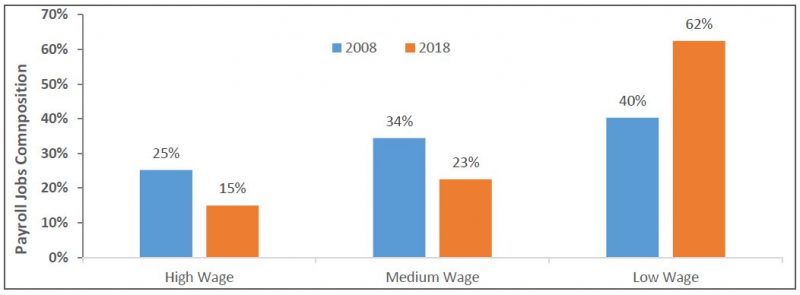
Source: NYS Department of Labor.
Additionally, the wage gaps between low, medium, and high earners continue to be large: from 2009 to 2017, the real average salary for the high-wage sector grew 10.1 percent; in the medium-wage sector 7.0 percent; and in the low-wage sector just 0.5 percent.
Like the U.S., the New York metro area is showing some signs of wage growth both in real and nominal terms. The tight labor market is leading to higher average hourly earnings, augmented by the increase in the City’s minimum wage to $13 an hour in 2018 (and $15 per hour as of December 31, 2018). Average hourly earnings of all employees in the private sector rose 3.1 percent in 2018, lower than the 3.6 percent in 2017, but above the 2.3 percent average growth since 2007. The NY Metro area inflation rate, as measured by the change in consumer price index, was 1.9 percent in 2018 and 2.0 percent in 2017, indicating that New Yorkers are seeing real gains in the purchasing power of their earnings.
Venture capital investment in the New York metro area rose to a record high of $13.3 billion in 2018. Highlights include investments in WeWork of $1 billion, Peloton of $550 million, and Letgo of $500 million.
According to Cushman and Wakefield (C&W), total new commercial leasing activity in Manhattan rose 17.7 percent to over 35.9 million square feet (msf) in 2018, the highest on record. Based on C&W, Manhattan’s newly constructed office space is expected to increase by 9.6 msf, the biggest increase in 47 years. This should soften the commercial real estate market by increasing the vacancy rate and holding rents down.
According to Douglas Elliman, the number of residential units sold fell in Manhattan, Brooklyn, and Queens in 2018.[6] The reasons are believed to be the anticipation of the new tax laws that limits the mortgage interest tax deduction and property taxes, and a rise in mortgage rates. The average sales price fell in Manhattan, but increased in Brooklyn and Queens.
We expect the City’s economic growth to continue through the forecast period without a recession. However, the pace of that growth is expected to slow, consistent with the late stage in the business cycle, but remain above the national growth rate until 2023.
The latest leading economic indicators for the City point to continued expansion. An assessment of business conditions among firms in the New York City area is provided by ISM-New York, Inc. The most recent report shows that current business conditions (which measure the current state of the economy from the perspective of business procurement professionals) index was 67.7 in Q4 2018, lower than the record high of 74.7 in Q3 2018 but, any number above 50 percent indicates the expectation of continued expansion. The ISM six-month outlook (which measures where procurement professionals expect the economy to be in six months) was 67.1 in Q4 2018, lower than 79.7 in Q3 2018 but still above the 50 threshold. The NY-BCI (which measures the cumulative change in business activity) rose to a record high of 840.4 in Q4 2018 from 810.1 in Q3 2018.
Initial unemployment claims, which show the number of applicants for unemployment insurance, declined for the fourth consecutive quarter. According to the NYS Department of Labor, average initial unemployment claims fell 5.8 percent, on a year-over-year basis, to 25,966 in Q4 2018, the lowest on record.
Finally, according to NYC & Company, the number of visitors to the city rose to a record 65.2 million in 2018, the ninth straight annual increase and it is expected to reach 67 million in 2019.[7]
Table 5 shows the Comptroller’s and the Mayor’s forecast of five economic indicators for 2019 to 2023.
Table 5. Selected NYC Economic Indicators, Annual Averages, Comptroller and Mayor’s Forecasts, 2019-2023
Source: Comptroller=forecast by the NYC Comptroller’s Office. GCP=Gross City Product. The NYC Office of Management and Budget in the February 2019 Financial Plan. NA=not available.
The FY 2020 Preliminary Budget
The FY 2020 Preliminary Budget released on February 7 shows a balanced budget of $92.2 billion. Revenues in the Preliminary Budget are $763 million higher than projected in the November Plan. Expenditures are $2.42 billion lower, driven by an increase of $2.65 billion in planned prepayment of FY 2020 debt service. The combination of higher revenues and lower expenditures closes a $3.18 billion gap projected in November.
More than three-quarters of the revenue increase result from revisions to City-funds revenues which are increased by $590 million from the November Plan projection, as shown in Table 6. The increase in revenues include $32 million of additional revenues attributed to the current round of the Citywide Savings Program (CSP). Net of the CSP revenues, tax revenues show an increase of $564 million and non-tax City-funds revenues a decrease of $6 million. Upward revisions of $277 million and $234 million to tax audit and property tax revenue forecasts, respectively, account for the bulk of the increase in tax revenues.
Table 6. Changes to FY 2020 City-Funds Estimates from the November Plan
| ($ in millions) | |
| Gap to be Closed – November Plan | $440 |
| Tax Revenues | $564 |
| Non-Tax Revenues | ($6) |
| Revenues From Citywide Savings Program | $32 |
| Total Revenue Changes | $590 |
| Agency Expenditures | $293 |
| Miscellaneous Budget | $4 |
| Collective Bargaining Adjustment | $2 |
| Savings From Citywide Savings Program | ($239) |
| Total Expenditure Changes | $61 |
| Gap To Be Closed Before Prepayments | ($2,650) |
| FY 2019 Prepayment of FY 2020 Debt Service | $2,650 |
| Gap to be Closed – February 2019 Financial Plan | $0 |
The remaining $173 million increase in revenues is due to increases in categorical grants driven by revisions to Federal, State and other categorical grants, which, respectively, are $62 million, $54 million, and $51 million more than projected in November. Upward revisions of $38 million and $14 million in revenues from expanded participation in the federal Community Eligibility Provision (CEP) school food program, and Community Development Block Grants (CDBG), respectively, account for the bulk of the Federal categorical grants increase. The additional State grants in FY 2020 are driven primarily by a $41 million increase in State funding for school connectivity and technology while the increase in other categorical grants reflects a $50 million reimbursement from the joint Health Stabilization Fund for the second of two $100 per member lump sum payments into the welfare funds.[8]
FY 2020 City-funds expenditures are $2.59 billion lower than in the November Plan. This reduction reflects a $2.65 billion increase in the planned FY 2019 prepayment of FY 2020 debt service, bringing the total planned prepayment of FY 2020 debt service to $3.17 billion. Baseline expenditures are $299 million above the November Plan driven by a $293 million increase in agency expenses. As shown in Table 6, all but $61 million of the City-fund spending increases are offset by spending reductions in the Citywide Savings Program (CSP).
More than a third of the increase in City-funds agency spending is to fund the Fair Fares program in FY 2020. The November Plan had included $106 million to fund Fair Fares for the second half of FY 2019 only. The current plan adds $106 million to FY 2020 for Fair Fares. As discussed in “Risks and Offsets” beginning on page 26, the funding for only half a year of Fair Fare expenditures poses a risk to the City’s spending assumptions.
Other significant increases include:
- $25 million to create 1,900 new 3-K seats, bringing the projected FY 2020 pre-K for three-year-olds to $171 million. The spending on pre-K for three-year-olds is projected to increase to $242 million by FY 2023.
- $31 million in new needs in the Department of Youth and Community Development (DYCD) to expand the Summer Youth Employment Program, bringing the City-funded FY 2020 budget for SYEP to $125 million, approximately $21 million less than budgeted for FY 2019.
- $25 million in new needs in the Health + Hospitals (H+H) to fund the NYC Care initiative. The funding is projected to increase by $25 million annually over the next two fiscal years to $100 million by FY 2022 and remain at $100 million in FY 2023.
FY 2019 Budget Stabilization Account (BSA)
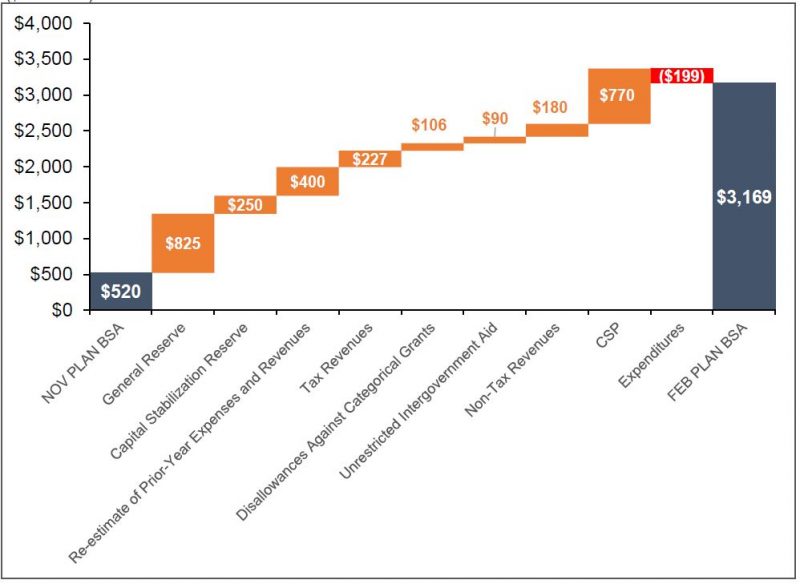
Since the November Plan, the City has recognized a net $2.65 billion of additional resources in the FY 2019 budget. Because these resources are not required to balance the current fiscal year’s budget, they are used to increase the FY 2019 Budget Stabilization Account, bringing the total FY 2019 BSA to $3.17 billion. The BSA will be used to prepay $2.32 billion of Transitional Finance Authority (TFA) and $850 million of general obligation (G.O.) debt service. As shown in Chart 8, these additional resources are the result of:
- A reduction of $825 million in the FY 2019 General Reserve;
- The elimination of the $250 million FY 2019 Capital Stabilization Reserve;
- A net savings of $400 million from adjustments to prior-year receivables and payables estimates;
- An increase of $227 million in tax revenues;
- The release of $106 million from the reserve of disallowances against categorical grants;
- An increase of $90 million in unrestricted intergovernmental aid;
- An increase of $180 million in non-tax City-funds revenues;
- A new round of CSP with projected FY 2019 savings of $770 million; less
- Additional City-funds spending of $199 million
Chart 8. Funding the FY 2019 BSA
($ in millions)
The takedown of the General Reserve, the elimination of the Capital Stabilization Reserve and the recognition of savings from adjustments to prior-year estimates of payables and receivables are budget adjustments that are typically made in the January/February plans.
The reserve for categorical disallowances is a set-aside for potential rejection of City claims against federal and state categorical aid. The release of $106 million from the reserve reflects the City’s belief that this amount is not needed to meet expected disallowances. Because the reserve is against disallowances of prior-year claims already recorded as revenues, the released funds are treated as City-funds revenues in the fiscal year in which they are released.
With the exception of personal income tax (PIT) and commercial rent tax (CRT) revenues, all other tax-revenues were revised upwards, resulting in a net increase of $227 million in tax revenues. The drop in PIT revenues reflects a larger decline than previously anticipated because of the shifting of income from tax year 2018 to tax year 2017 by City tax filers to take advantage of the last year of State and Local Tax (SALT) deduction. Tax revenues are discussed in greater detail in “Tax Revenues” beginning on page 28.
A number of non-recurring actions — some of which were included as part of the Citywide Savings Plan, while others were not — contributed to the FY 2019 surplus. Among these are the release of funds from the reserve for categorical aid disallowances ($106 million; discussed above), reimbursements from H+H ($371 million; discussed below), the sale of City assets, and $77.7 million in restitution as part of a legal settlement with French bank Société Générale.
Citywide Savings Program
The February Financial Plan contains another round of CSP that is expected to provide budget relief totaling $770 million in FY 2019, $271 million in FY 2020, $264 million in each of FY 2021 and FY 2022, and $281 million in FY 2023. Nearly half of the FY 2019 savings is due to a reimbursement from H+H primarily for debt service, tort claim and retiree health benefits payments made on its behalf in FY 2015 and FY 2016. These reimbursements account for $371 million of the FY 2019 savings. In the outyears, a reduction in the City’s budget for “other than personal services” (OTPS) inflation accounts for $111 million of the recurring savings.
With the current round of CSP, estimated budget relief over the Plan period now totals $3.16 billion — $2.72 billion in reduced expenditures and $440 million in additional revenues. Only about 29 percent of the FY 2019 initiatives have recurring benefits that extend to the end of the Plan period. As shown in Table 7, these initiatives account for $243 million of the savings in FY 2019, $169 million in FY 2020, $232 million in FY 2021, $259 million in FY 2022, and $179 million in FY 2023.
In contrast to the FY 2019 initiatives, more than 80 percent of the FY 2020 initiatives have recurring savings in each of the outyear of the Plan, with savings ranging in a narrow band between $232 million and $243 million as shown in Table 7. Two initiatives account for about two thirds of these savings. As discussed above, a reduction in the OTPS inflation budget accounts for $111 million of the recurring outyear savings. In addition, the extension of the elimination of FY 2019 vacant positions to the outyears is expected to generate between $49 million and $52 million of annual savings in FY 2020 through FY 2023.
Table 7. Recurring and Non-Recurring Savings
| ($ in millions) | FY 2019 | FY 2020 | FY 2021 | FY 2022 | FY 2023 |
| Recurring Savings | |||||
| FY 2019 Initiatives | $243 | $169 | $232 | $259 | $179 |
| FY 2020 Initiatives | 0 | 234 | 241 | 243 | 232 |
| Subtotal Recurring Savings | $243 | $403 | $473 | 502 | $412 |
| Non-Recurring Savings | $856 | $132 | $65 | $38 | $31 |
| Total | $1,099 | $535 | $538 | $540 | $443 |
Risks and Offsets
With the exception of FY 2020, the Comptroller’s Offices analysis of the February Plan has identified net additional resources in each year of the Financial Plan, ranging from a low of $117 million in FY 2023 to a high of $285 million in FY 2022, as shown in Table 8. For FY 2020, the Comptroller’s Office’s higher expenditures estimates are almost completely offset by the Office’s higher revenue forecast. As a result the Comptroller’s Office projects a budget surplus of $160 million in FY 2019, a nominal gap of $1 million in FY 2020, and smaller gaps of $3.27 billion, $2.65 billion, and $3.18 billion in FY 2021 through FY 2023, respectively.
Excluding estimated VRDB savings, the expected take down of the General Reserve, and underspending for the Fair Fare program in FY 2019, the Comptroller’s Office’s estimates of expenditures are consistently higher than the City’s over the Plan period. The Office’s revenue forecast, on the other hand, are above the City’s in each year of the Plan period, and offsets the expenditure risks in these fiscal years. The Comptroller’s revenue projections are discussed in greater detail in Tax Revenues beginning on page 28 and Miscellaneous Revenues beginning on page 33.
Table 8. Risks and Offsets to the February 2018 Financial Plan
($ in millions, positive numbers decrease the gap and negative numbers increase the gap)
| FY 2019 | FY 2020 | FY 2021 | FY 2022 | FY 2023 | |
| City Stated Gap | $0 | $0 | ($3,516) | ($2,939) | ($3,296) |
| Tax Revenues | |||||
| Property Tax | $0 | $200 | $387 | $735 | $1,085 |
| Personal Income Tax | (103) | 49 | 88 | 46 | (59) |
| Business Taxes | 145 | (81) | (11) | 9 | 31 |
| Sales Tax | 77 | 158 | 165 | 150 | 107 |
| Real Estate-Related Taxes | (84) | 108 | 166 | 82 | (30) |
| Audit | 0 | 0 | 179 | 179 | 179 |
| Subtotal Tax Revenues | $35 | $434 | $974 | $1,201 | $1,313 |
| Non-Tax Revenues | |||||
| ECB Fines | $4 | $13 | $13 | $19 | $19 |
| Late Filing/No Permit Penalties | 4 | 4 | 10 | 10 | 10 |
| Motor Vehicle Fines | 2 | 2 | 2 | 2 | 2 |
| Parking Violations Fines | 8 | 5 | 5 | 5 | 5 |
| Subtotal Non-Tax Revenues | $18 | $24 | $30 | $36 | $36 |
| Total Revenues | $53 | $458 | $1,004 | $1,237 | $1,349 |
| Expenditures | |||||
| Overtime | ($193) | ($122) | ($150) | ($150) | ($150) |
| Charter School Tuition | 0 | (119) | (281) | (478) | (758) |
| DOE Medicaid Reimbursement | (20) | (20) | (20) | (20) | (20) |
| Carter Cases | (80) | (80) | (80) | (80) | (80) |
| Fair Fares | 50 | (106) | (212) | (212) | (212) |
| Homeless Shelters | 0 | (12) | (12) | (12) | (12) |
| VRDB Interest Savings | 50 | 0 | 0 | 0 | 0 |
| General Reserve | 300 | 0 | 0 | 0 | 0 |
| Total Expenditures | $107 | ($459) | ($755) | ($952) | ($1,232) |
| Total (Risks)/Offsets | $160 | ($1) | $249 | $285 | $117 |
| Restated (Gap)/Surplus | $160 | ($1) | ($3,267) | ($2,654) | ($3,179) |
The Comptroller’s Office’s expenditure risks in the outyears of the Plan have increased since the November Plan, driven primarily by the absence of funding for the Fair Fares program in the outyears. Previously, the City had included funding to support the program for half a year, with the program scheduled to begin in the second half of FY 2019. The Administration was opposed to using City funds to support the program and had insisted that beyond the initial launch, the program would continue only if there were a dedicated source of revenue. However, the February Plan extends the program into FY 2020 without a dedicated source of revenue to support it. It appears unlikely that the program would be discontinued in the outyears, once it has taken root in FY 2019 and FY 2020. Based on the City’s estimates, a full-year funding for the program would total $212 million. However, the program is off to a slow start and thus far only about $14 million of the $106 million budget have been spent. If participation does not pick up, it is likely that there will be about $56 million of unused Fair Fares funds in FY 2019.
Other substantial risks over the Plan period include risks of $193 million in FY 2019, $122 million in FY 2020 and $150 million in each of the remaining outyears for overtime spending; charter school tuition risks of $119 million in FY 2020 growing to $758 million by FY 2023; risks of $80 million annually in FY 2019 – FY 2023 for reimbursements to families for the cost of placing special-needs children in non-public schools; risks of $20 million annually from shortfall against projection of Medicaid reimbursements for special education related services; and risks of $12 million annually beginning in FY 2020 from shortfall in DHS adult shelter service funding.
Revenue Analysis
Tax Revenues
In the February Plan, total revenues are estimated to grow by $6.8 billion over the forecast period, from $92.02 billion in FY 2019 to $98.82 billion in FY 2023. City-funds revenues are projected to increase from $66.40 billion in FY 2019 to $73.82 billion in FY 2023. These projections reflect the City’s assumptions that both the local and national economies will continue to expand over the four-year Financial Plan. Tax revenue is projected to grow by only 2.7 percent in FY 2019, following last’s year growth of 8.1 percent. The projected slowdown in the current fiscal year largely reflects a one-time boost related to Federal tax reform which contributed to a 19 percent increase in Personal Income Tax revenue in FY 2018 that is not expected to recur. In the outyears, from FY 2020 – FY 2023, the City projects growth in overall tax revenues to average 3.2 percent. This result is driven by growth in the City’s largest tax, the property tax, of 4.4 percent on average in FY 2020 – FY 2023. This compares to average projected growth in non-property tax revenue of only 2.2 percent over the period.
The February Plan reflects $23.73 billion of Federal and State aid for FY 2019, representing about 26 percent of the City’s overall revenue projections. Over the outyears of the Plan, Federal and State grants are projected to decline to $22.72 billion in FY 2020 and gradually recover over the remainder of the Plan to reach $23.47 billion by FY 2023. Federal support is projected to fall from $8.47 billion in FY 2019 to a range of $7.1 billion – $7.3 billion in each of FY 2020 – 2023 mainly due to declining Sandy-related reimbursements and the inclusion of rollover Federal funds in FY 2019. Meanwhile, State aid is projected to grow from $15.26 billion in FY 2019 to $16.35 billion by FY 2023, driven primarily by the expectation of school aid increases.
Revisions since the November Modification, FY 2019 – FY 2023
In the February Plan, the City projects total tax revenues of $60.7 billion in FY 2019, an increase of $228 million over the November Financial Plan. The outyears were also revised upwards by $567 million, $6 million, $436 million, $35 million, respectively, in FY 2020 – FY 2023.
Table 9. Revisions to the City’s Tax Revenue Assumptions November 2018 vs. February 2019
| ($ in millions) | FY 2019 | FY 2020 | FY 2021 | FY 2022 | FY 2023 |
| November 2018 Financial Plan Total | $60.453 | $62.349 | $64,762 | $66,495 | $68,860 |
| Revisions: | |||||
| Real Property | 76 | 234 | 198 | 448 | 199 |
| Personal Income (PIT) | (177) | 24 | (81) | 12 | 7 |
| Business | 104 | 3 | (21) | 76 | (9) |
| Sales | 23 | 2 | (52) | (39) | (64) |
| Real-Estate Transactions | 162 | 15 | (33) | (51) | (69) |
| All Other | 39 | 12 | (5) | (11) | (29) |
| Tax Audit | 1 | 277 | 0 | 0 | 0 |
| Total, Revisions | $228 | $567 | $6 | $435 | $35 |
| February 2019 Financial Plan Total | $60,681 | $62,916 | $64,768 | $66,930 | $68,895 |
As Table 9 shows, the largest upward revisions in FY 2019 were in the real property and property transfer taxes and in the general corporation tax. These were offset by significant downward revisions to the personal income tax and the unincorporated business tax. Most of the upward revision to the outyear forecast was in the real property tax and reflects the new tentative roll released in January. Audit revenue was also revised significantly higher, but only in FY 2020.
Comptroller Projections, FYs 2019 – 2023
The Comptroller’s forecast anticipates revenue to grow by only 2.7 percent in the current fiscal year due to a significant decline in PIT revenue that followed last year’s tax reform-related surge. The outyear forecast is predicated on the outlook for the local economy and its main indicators, employment and wages, which continue to grow but at moderating rates as labor supply constraints and the effects of higher interest rates take hold. Reflective of these underlying fundamentals, overall tax revenue growth slows over the forecast period as shown below, particularly for the income-sensitive taxes. Property tax revenue also slows, but the continued phase-in of prior year pipeline of assessment changes sustains growth above 4.0 over the Plan period.
This pattern of slowing revenue growth is similar to the City’s forecast. The main difference is that the higher near-term projections for property taxes cause revenues to remain higher throughout the forecast period. The Comptroller’s forecast of average annual growth in property taxes from FY 2020 to FY 2023 of 5.2 percent compared to 4.4 percent for the City explains most of the resulting $1.3 billion difference in revenues by FY 2023 (Table 10). A more detailed discussion of our projections and differences from the City’s forecast follows.
Table 10. Tax Revenue Forecast, Growth Rates
| FY 2019 | FY 2020 | FY 2021 | FY 2022 | FY 2023 | Average Annual Growth | |||||
| Property | ||||||||||
| Mayor | 6.1% | 5.9% | 4.6% | 4.0% | 3.0% | 4.4% | ||||
| Comptroller | 6.1% | 6.6% | 5.2% | 5.0% | 4.0% | 5.2% | ||||
| PIT | ||||||||||
| Mayor | (7.0%) | 4.4% | 2.4% | 3.2% | 3.5% | 0.6% | ||||
| Comptroller | (7.8%) | 5.7% | 2.7% | 2.9% | 2.7% | 0.6% | ||||
| Business | ||||||||||
| Mayor | 6.0% | 0.5% | 1.8% | 1.4% | 2.1% | 2.0% | ||||
| Comptroller | 8.5% | (3.3%) | 3.0% | 1.7% | 2.4% | 2.3% | ||||
| Sales | ||||||||||
| Mayor | 4.9% | 4.6% | 3.3% | 3.6% | 3.2% | 4.2% | ||||
| Comptroller | 5.9% | 5.6% | 3.3% | 3.3% | 2.7% | 4.5% | ||||
| Real Estate Transactions | ||||||||||
| Mayor | 7.7% | (9.6%) | 1.3% | 2.3% | 2.8% | (0.9%) | ||||
| Comptroller | 4.3% | (2.3%) | 3.5% | (1.1%) | (1.7%) | (0.4%) | ||||
| Other | ||||||||||
| Mayor | 12.4% | (2.0%) | 1.1% | 2.1% | 1.8% | 0.7% | ||||
| Comptroller | 12.4% | (2.0%) | 1.1% | 2.1% | 1.8% | 0.7% | ||||
| Audit | ||||||||||
| Mayor | (20.9%) | (5.6%) | (27.8%) | 0.0% | 0.0% | (9.1%) | ||||
| Comptroller | (20.9%) | (5.6%) | (9.8%) | 0.0% | 0.0% | (3.9%) | ||||
| Total Tax | ||||||||||
| Mayor | 2.7% | 3.7% | 2.9% | 3.3% | 2.9% | 3.2% | ||||
| Comptroller | 2.7% | 4.3% | 3.8% | 3.6% | 3.0% | 3.7% | ||||
Table 11. Comptroller’s Office Risks and Offsets to the City’s Tax Revenue Projections
| ($ in millions) | FY 2019 | FY 2020 | FY 2021 | FY 2022 | FY 2023 |
| Property | $0 | $200 | $387 | $735 | $1,085 |
| PIT | (103) | 49 | 88 | 46 | (59) |
| Business | 145 | (81) | (11) | 9 | 31 |
| Sales | 77 | 158 | 165 | 150 | 107 |
| Real Estate Transaction | (84) | 108 | 166 | 82 | (30) |
| Audit | 0 | 0 | 179 | 179 | 179 |
| Total | $35 | $434 | $974 | $1,201 | $1,312 |
*Totals may not add due to rounding.
A more detailed discussion of our projections and differences from the City’s forecast follows.
Property Taxes
The forecast for the City’s largest revenue source shows slowing but continued growth throughout the Plan Period. Property tax revenue is estimated to grow on average by 5.2 percent annually from FY 2020 to FY 2023. This compares to recent growth of 7.2 percent in FY 2018, 6.1 percent in FY 2019, and 6.6 percent in FY 2020 based on the tentative roll released in January 2019.
In the near term, property tax revenue continues to be supported by the strong pipeline of past market value assessments that are phased in over 5 years for Class 2 and Class 4 properties. Over the long term however, there are indications of weakness in some key property sectors.
On the residential side, the median sales price for Manhattan apartments declined by 5.8 percent in 2018 and average rents were flat during the same period.[9] Growth for residential property values in some of the previously booming neighborhoods outside Manhattan also subsided.
Turning to the commercial real estate market, the baseline economic forecast assumes that increases in office-using employment will continue to provide support for office space demand. One area of concern, however, is whether demand will keep up with supply. In recent weeks there have been announcements of speculative new office development occurring without advance leasing by an anchor tenant.[10] The last time that the City saw substantial amounts of speculative space hit the market was in the late 1980s and early 1990s. Coupled with the protracted recession that ensued, the office market suffered one of its longest and most severe downturns in recent history. The other area of concern and weakness is the retail sector, which continues to be plagued by high vacancies and falling rents, particularly in Manhattan.
While our baseline assumption does not anticipate a downturn, slowing economic growth and weakening fundamentals will result in property tax revenue growth declining from 6.6 percent in FY 2020 percent to only 4 percent by the end of the Plan period in FY 2023. The City projects even lower growth. Part of the difference is due to the fact that the Comptroller’s higher assumptions for near-term growth propagate throughout the forecast period because of the pipeline effect. The other difference is the forecast for reserves. The City’s projections show reserves jumping to over 6.5 percent of the levy in FY 2020 – FY 2023 from only 5.8 percent in FY 2019. Assuming a more steady reserve-to-levy ratio results in a forecast for reserves that is likely to be $200 million – $300 million lower than the City’s estimate. The combined effects of lower reserves and slightly higher assumptions on property tax growth, results in property tax revenue exceeding the City’s projections by $1.1 billion by the end of the Plan period.
Factors that could affect future property tax revenues include the Tax Equity Now lawsuit, and the Advisory Commission convened by the Mayor and Speaker Johnson, which is expected to release its report and recommendations by the end of calendar year 2019.
Mortgage Recording and Real Estate Transfer Taxes
Year-to-date collections data indicates that the City’s real estate transfer taxes have rebounded from last year’s 3.8 decline, and for the year as a whole are estimated to grow by 4.3 percent. Part of the rebound is likely due to the enactment of tax provisions under the TCJA which generally provided for favorable treatment of commercial real estate properties by allowing for more generous and comprehensive deprecation. In spite of this recent rebound, we anticipate revenues from transaction taxes to be essentially flat over the plan period from FY 2020 – FY 2023. As noted above, the housing market has cooled and even though the Fed has recently taken a more dovish approach to increasing interest rates, we still expect that higher interest rates, with the ten-year treasury yield reaching almost 4 percent by 2023, will act as drag on both commercial and residential transactions. The City’s forecast is also for overall moderate declines in transaction taxes, although with slightly different timing.
Personal Income Taxes
Personal income tax collections continue to be significantly impacted by recent changes to federal tax law. Collections data for December and January showed a 61.7 percent year-over-year decline in the non-withheld components of income taxes.[11] While both the City and the Comptroller’s Office had anticipated large declines following last year’s surge due to tax reform and the repatriation of offshore profits, the drop was higher than anticipated, particularly in December. The reasons for this larger than expected decline are hard to gauge at this time. The stock market’s tumble in the 4th quarter may have added to the anticipated drag on revenues from tax reform. Another possibility is that taxpayers may have overpaid their taxes last year to take advantage of the full deductibility of State and Local taxes and are using prior year credits to offset this year’s payments.[12] At this time we do not have data to verify whether filers are drawing down credits from prior years, and last year in particular.
Looking ahead, such weakness in non-withheld collections would normally foreshadow further declines when final payments are due in April.[13] The extensive impact of tax reform makes for a very difficult interpretation of the collections data. Both the IRS and NYS Tax Department continue to issue guidelines and technical memorandums on some of the more complex provisions of the tax law.[14] This will likely result in a higher than usual amount of amended returns. The difficulty in explaining recent collections is not unique to New York City. Many states and localities were also caught by surprise by the weakness in 4th quarter collections and there is increased uncertainty around upcoming collections for PIT in the crucial month of April, when final returns are due.
Some analysts have looked to the federal forecast by the Congressional Budget Office which anticipates relatively strong collections at the federal level as a measure of reassurance that collections in the coming months could still provide upside to the current downward trend.[15] Even assuming that the federal projections are correct, NYC collections would still deviate significantly from federal trends for several reasons. First, the repatriation of offshore tax deferrals from hedge funds that occurred last year should have a larger impact on City collections compared to the federal government, both in terms of last year’s surge and this year’s offsetting decline.[16] Similarly, the shifting of income that occurred because of the newly imposed limitation on state and local tax deductibility would also have had a much larger impact on City collections. The final cause for concern is that even if federal income tax receipts were to hold up in April, New York State taxpayers may have shifted their liability to other states. There has been a lot of speculation that the loss of state and local deductibility may have caused wealthy New Yorkers to shift their residence to more tax friendly states. It is important to note that at this point there is no data to confirm whether tax migration has occurred, but the impact of the increase it tax differentials among New York State and other States warrants close monitoring.[17]
While there is still the possibility that collections may recover in April, our assessment is that the risks remain tilted to the downside. The City, while lowering its estimate for PIT revenues in FY 2019 by $177 million, assumes a moderate pickup in collections through the remainder of year. The Comptroller’s office is slightly less optimistic and assumes a small but continued deterioration in this trend. As a result, in FY 2019, collections could be about $100 million lower compared to the City’s forecast. The outyear forecast are more aligned and show revenue growth in PIT slowing from FY 2021 to FY 2023, consistent with the underlying projections for growth in the local economy.
Business Income Taxes
Business tax collections also continue to be significantly impacted by the sweeping changes to Federal tax law, although the pattern is somewhat different compared to PIT. For the General Corporation Tax (GCT), a lower federal tax rate for Tax Year 2018 likely caused a one-time shift of income into the current year as evidenced by the more than 20 percent jump in year to date collections through December 2018.[18] For the Unincorporated Business Tax (UBT), the impact of income shifting is less straightforward. The two main provisions of the TCJA, the limitation on SALT deductions and the allowance of a 20 percent deduction on qualified business income, counteract each other in terms of the timing of the incentive to shift income.
Overall business tax revenue is projected to jump by 8.5 percent in FY 2019, primarily as a result of the shifting of GCT income into the current tax year. This one time boost to revenues is followed by a decline of 3.3 percent in FY 2020. The City shows a similar pattern but the amplitude of the one-time increase and the slowing that follows is not as pronounced. Compared to the City’s projections, the Comptroller anticipates higher revenues in FY 2019 and then lower revenues in FY 2020. As the impact of these one-time effects related to tax reform dissipate, both out-year forecasts resume a similar pattern of moderating growth consistent with the overall slowing in the economy.
As with personal income collections the complexity of federal tax reform could entail significant revisions to returns, and impact revenues in unpredictable ways.
Sales Taxes
Strong fundamentals in the City’s labor market and tourism sector have contributed to support robust growth in the City’s sales tax collections, which are up almost 5 percent through fiscal month January. This momentum is expected to be sustained in the near term. Sales tax growth is further boosted by the June 2018 Supremes Court decision to allow the imposition of sales tax on remote sellers, and the expiration of the STAR-C interceptor, a state action that reduced City sales tax revenue in State fiscal years from 2017-2019. The impact of these policy actions and the underlying economic fundamentals result in above average growth in sales tax revenue of just below 6 percent in both FY 2019 and FY 2020. As slower economic growth sets in beginning in FY 2021, sales tax revenue growth also moderates to about 3 percent on average. Compared to the City’s forecast, the Comptroller’s office anticipates slightly higher near term growth and the resulting difference of about $100 million carries throughout the Plan period.
The above estimates do not incorporate the impact of proposed legislation to tax recreational cannabis and marketplace sellers. These effects will be included when legislation is enacted.
Audit Revenue
The City significantly revised audit collections for FY 2020, increasing the forecast of these by $277 million and bringing total expected revenues from audits to roughly $1 billion. The upward revision was not, however, baselined in the out-years, which continue to show audit revenue dropping to $721 million. While recognizing the volatility of single revenue sources within audit collections, overall audit revenue has consistently hovered in the $1 billion range in recent years. We anticipate therefore that audit revenue could exceed the City projections by about $180 million in each year from FY 2021 through FY 2023.
PILOT Revenue
The City’s collects Payments in Lieu of Real Estate Taxes (PILOTs) mainly from local development entities that would otherwise be exempt from paying local property taxes, such as the NYC Industrial Development Agency and the Battery Park City Authority. The City estimates that in FY 2020, it will collect just over $500 million from PILOTs. Thereafter the City projects that PILOTs will decline to $444 million. The underlying projections of some of the PILOT revenue sources such as those from the Hudson Yards development area show real property taxes flat in the out-years. This seems unlikely given existing growth in this market and that new development will likely come on line. As such, combined PILOT revenue from all sources could be higher than the City’s estimates by $50 million to $100 million in FY 2020 to FY 2023.
Miscellaneous Revenues
In the February 2019 Financial Plan the City raised its FY 2019 miscellaneous revenue projection by a net $444 million, to $5.48 billion. [19] Approximately $173 million of this increase reflects revenue initiatives included in the Citywide Savings Plan. The revised FY 2019 miscellaneous revenue forecast is over $500 million higher than the $4.97 billion realized in the previous fiscal year. This is mostly due to higher revenue projections for “other miscellaneous”, including asset sales, restitution and other non-recurring revenues in FY 2019. Table 12 shows the changes in the FY 2019 miscellaneous revenue projections since the November 2019 Plan. Except for rental income, the February Plan increased FY 2019 projections for all other categories of miscellaneous revenue.
Anticipated revenues from licenses and franchises increased by $13 million. This reflects mainly higher projected revenues from building permits, street opening permits and fees from sidewalk cafes. Projected interest income increased by $3 million to account for re-estimates of overnight investment and debt service interest income. Projected revenues from charges for services increased by $15 million mostly due to higher anticipated filling fee revenues from the Affordable NY housing program (formerly the 421-A program). Revenue forecast for fines and forfeitures increased by a net $20 million. This includes primarily $25 million in additional revenues from Environmental Control Board (ECB) fines and $9.6 million in additional Department of Buildings (DOB) late filing/no permit penalties. These increases were partly offset by a $17.5 million decrease in projected revenues from bus lane and red light camera fines, reflecting lower than expected collections.
Table 12. Changes in FY 2019 Estimates November 2018 vs. February 2019
| ($ in millions) | November | February | Change |
| Licenses, Franchises, Etc. | $715 | $728 | $13 |
| Interest Income | 190 | 193 | 3 |
| Charges for Services | 1,010 | 1,025 | 15 |
| Water and Sewer Charges* | 1,450 | 1,464 | 14 |
| Rental Income | 259 | 259 | 0 |
| Fines and Forfeitures | 960 | 980 | 20 |
| Other Miscellaneous | 451 | 830 | 379 |
| Total | $5,035 | $5,479 | $444 |
*Water and sewer revenues collected by the Water Board from dedicated water and sewer charges represent reimbursements for operation and maintenance of the water delivery and sewer systems and therefore are not available for general operating purposes.
The category “other miscellaneous” incurred the largest increase ($379 million) since the November Plan. This is mainly driven by non-recurring revenues in FY 2019 such as $152.3 million in H+H reimbursement primarily for debt service, $117.6 million in proceeds related to the sale of land underneath a City-owned property at 101 Barclay Street and $77.7 million in restitution resulting from a deferred prosecution agreement involving the French bank Société Générale for illegal transactions made on behalf of entities in countries subject to U.S economic sanctions. Other one-time revenue sources in FY 2019 include $8 million in HPD debt service balance, $8 million in additional settlement payments, and a combined $5.9 million in additional asset sales and savings associated with lowering the costs of insurance policy claims.
Miscellaneous revenues are projected to decline 8.7 percent in FY 2020 because of non-recurring revenues reflected in the current year, falling to around $5 billion and remaining at similar levels in FY’s 2021-2023.
Based on recent collection trends, the Comptroller’s Office expects revenues from fines to be above the City’s forecast by $18 million in FY 2019, $24 million in FY 2020, $30 million in FY 2021 and $36 million in FY’s 2022-2023. These offsets result from the Comptroller’s Office slightly higher revenue projections for Environmental Control Board (ECB) fines, Department of Buildings (DOB) penalties, and fines from motor vehicle and parking violations.
Federal and State Aid
The February Financial Plan projects total Federal and State aid of $23.73 billion in FY 2019, supporting nearly 26 percent of the City’s expenditure budget. Compared with the November Plan, the City has recognized an increase of $378 million in the current year comprised of $256 million in Federal aid and $122 million in State grants. A significant portion of the increase is reflected in social services grants totaling about $142 million, including $28 million in foster care funding, $19 million in Headstart grants, and $76 million in prior year reimbursement for Medicaid administration and public assistance.[20] The February Modification also recognizes $83 million in additional Community Development Block Grant for Disaster Recovery and other Sandy-related reimbursements, bringing the new total to $486 million in the current year. The remainder of the FY 2019 increase is comprised mostly of $63 million in asset forfeitures and $46 million in education aid revisions.
In the FY 2020 Preliminary Budget, the City assumes $22.72 billion in Federal and State assistance, reflecting a modest increase of $116 million since the November Plan. About 83 percent of this total is expected to support education and social services spending. The decline in Federal and State support in FY 2020 is mainly attributable to declining Sandy-related reimbursement and more conservative estimates of certain Federal grants. The City expects State aid to total $15.4 billion in FY 2020, of which $11.5 billion would fund education expenses, including $8.2 billion through Foundation Aid. Over the financial plan, the City assumes that total State aid would grow at an average rate of 2.0 percent.
Over the remainder of the Plan, Federal and State grants are projected to rise to $23.04 billion in FY 2021, $23.44 billion in FY 2022 and $23.47 billion in FY 2023. These projections represent average annual growth of about 1.1 percent from the FY 2020 Preliminary Budget, driven primarily by expectation of State education aid increases of about 2.5 percent annually. Assuming these assumptions hold true, Federal and State support for the City’s expense budget would decline from about 25 percent in FY 2020 to 23 percent by FY 2023.
New York State Executive Budget
Governor Andrew Cuomo unveiled his proposed Executive Budget for State fiscal year 2019 – 2020 on January 15, 2019. Three weeks later, the Governor and the State Comptroller reported that a larger than expected drop in personal income tax collections in December and January had produced a $2.3 billion tax revenue shortfall in the State’s financial plan. On February 15, the State released the 30-Day Amendments to the Executive Budget, detailing a projected $3.8 billion personal income tax shortfall over State fiscal years 2018 – 2019 and 2019 – 2020. The revised state budget proposed $550 million in cuts against planned growth in Medicaid spending, transfers of excess fund balances, and drawing down reserves, among other measures to balance the 2019 – 2020 State budget.
School Aid
Under the Governor’s proposal, school aid to New York City would increase by 2.6 percent next year. However, the City’s Financial Plan assumes that school aid would rise by 4.0 percent, a difference of $148 million in FY 2020. The Executive Budget would also require the City to allocate 75 percent of its Foundation Aid increase to schools designated as “high-need” and “under-funded,” based on State definitions of student need and “adequate” spending levels. The City Department of Education has determined that 22 percent of City public schools would meet this definition. If the City were forced to spend 75 percent of the proposed $202 million increase in Foundation Aid, or roughly $150 million, on this smaller subset of schools, the City would have to use its own funding to make up the shortfall at all other schools. Given that the group of schools that would be designated as “high-need” and “under-funded” currently receives about one-quarter of the City’s Fair Student Funding allocation, mandating a far larger increase for these schools would create a system-wide funding gap of about $100 million.
Additionally, absent a change in State law, the City will be required to increase charter basic tuition payments at the same rate as public school spending, while State reimbursement remains frozen. Although the current law was adopted two years ago, the City has not yet reflected the additional costs in its Financial Plan, generating risks of $119 million in FY 2020, $281 million in FY 2021, $478 million in FY 2022 and $758 million in FY 2023. However, the City projects that the FY 2020 cost to the City due to funding shift for Family Assistance would be higher at $125 million.
Cost Shifts to the City
As proposed, the State’s Executive Budget would also reduce reimbursements for certain City health and public assistance expenses. The City would be required to fund 10 percent of the Family Assistance program, which provides cash assistance to needy families, and is currently fully State-funded. State reimbursements above the City’s base grant for non-emergency public health spending, such as communicable disease control and chronic disease prevention, would also be reduced from 36 percent to 20 percent. The State Division of Budget projects that the funding shift for Family Assistance would cost the City $72 million per year, while the public health spending shift would cost $27 million in FY 2020 and $54 million per year when fully annualized. However, the City projects that the FY 2020 cost to the City due to funding shift for Family Assistance could be higher at $125 million.
Revenue Impacts
On the revenue side, the Governor included legislation in the Executive Budget to legalize and tax the sale of cannabis. The Governor proposed a 20 percent State excise tax and a 2 percent local excise tax on sales from wholesalers to retailers. The local tax would be based on the wholesale price and the location of the retailer. The State expects to begin collecting revenue in State fiscal year 2021. However, cannabis sales would be exempt from City and State sales tax. The Comptroller’s Office has estimated that the market for adult-use marijuana in New York City would be about $1.1 billion. Consequently, the legalization of cannabis, without an exemption from the City’s 4.5 percent sales tax, would generate about $51 million in annual sales tax revenue for the City, while the proposed 2 percent local excise tax would produce less than $20 million per year.
City sales tax revenue would also be impacted by proposed legislation in the Executive Budget to tax online Marketplace Vendors – mainly third-party vendors on Amazon’s website. City sales tax revenues are also expected to be impacted by the Supreme Court’s Decision in South Dakota vs Wayfair in June 2018 allowing States to impose taxes on remote sellers. The State estimates that the additional City sales tax revenues from these two actions could sum to about $170 million annually. However, in a joint statement on February 26, 2019, the Governor and Mayor proposed dedicating the new internet sales tax revenue, as well as a percentage of new cannabis excise tax revenue, to the MTA capital budget.
The Governor’s proposed budget would also reinstate and expand the City’s school speed zone camera program, which had lapsed in July 2018 until the Governor issued an Executive Order and the City Council passed legislation to continue enforcement. Under the lapsed state law, the City’s Department of Transportation (DOT) was permitted to operate cameras during school hours in 140 school zones (out of more than 2,300 school zones citywide).[21] The proposal would increase the number of authorized zones to 290 — with a limit of 50 new zones per year — and extend authorization through July 1, 2022. However, as proposed, the additional revenues from these measures would be diverted to the New York City Transit Authority for “capital safety improvements.” Based on the experience of existing cameras, and expected declines in revenue as drivers adjust behavior, revenues from an additional 150 zones could reach roughly $45 million annually after revenues level off, with revenues declining thereafter due to increased compliance.[22] Some of these new revenues would be offset by the cost of installing and operating the cameras. DOT has reported that capital and operating expenses have consumed about 54 percent of speed camera revenue in calendar years 2014 through 2017.[23]
The proposed state budget would also enable an expansion of bus lane enforcement cameras. Under current state law, the City is allowed to operate stationary or mobile cameras on 16 Select Bus Service (SBS) corridors, under the City’s Bus Rapid Transit (BRT) program, between 6:00 AM and 10:00 PM on weekdays.[24] The state budget proposes eliminating the cap on the number of bus routes and increasing the fine for camera-enforced bus lane violations from $115 to $125 on the first offense, with higher fines for repeat offenders.
The City has steadily increased the number of SBS routes with cameras, reaching 12 designated routes in February 2018.[25] Revenues from bus lane camera violations peaked in FY 2015 at $16.6 million and have since fluctuated between $11 million and $12 million per year. The City expects to collect $16.4 million in FY 2019, roughly equivalent to $1.4 million per route. In 2017, DOT and the MTA identified 21 candidate corridors for additional SBS routes.[26] However, in July 2018 the MTA announced a deferral of new SBS routes until 2021.[27]
The proposed state budget would also authorize the City and MTA to use camera enforcement for stopping, standing, parking and turning violations, as well as block-the-box violations, in the congestion toll zone south of 60th Street in Manhattan and designated bus corridors between 6:00 AM and 10:00 PM. Revenue generated from these violations from mobile bus cameras would be allocated to the MTA. This proposal follows a provision in the state fiscal year 2018-19 Adopted Budget that allowed the MTA to operate mobile bus cameras on SBS routes south of 96th Street in Manhattan and keep the revenue.
Two state budget proposals could pose further risks to the City. One proposal would extend the Executive authority granted in the past two years to propose a plan to reduce spending if federal Medicaid revenues are cut by $850 million, or if non-Medicaid federal revenues are cut by $850 million in state fiscal years 2019 – 2020 and 2020 – 2021. The Legislature would have 90 days to propose and adopt an alternative plan.
A second proposal would allow certain local aid payments to be uniformly reduced by up to 3 percent if tax receipts for state fiscal year 2019 – 20 are reduced by more than $500 million from the forecast in the Executive Budget, a scenario which has in fact already occurred since the Governor’s initial submission of the Executive Budget. Exempted aid categories are broad and include public assistance, reductions that would violate federal law, payments of debt service and related expenses for which the state is constitutionally or contractually obligated to pay, payments for CUNY senior colleges, school aid, and Medicaid. Reductions would begin 10 days after the publication of the State’s updated financial plan.
In total, the State budget as proposed would cost the City about $360 million over FY 2019 and FY 2020.
Table 13. Potential Cost of Proposed 2019 – 2020 State Budget
| ($ in millions) | FY 2019 | FY 2020 | Total Two-Year Impact |
| School Aid | |||
| Formula Aid Shortfall | $8 | ($148) | ($140) |
| “Equity Plan” | 0 | (100) | (100) |
| Subtotal School Aid | $8 | (248) | (240) |
| Cost Shifts | |||
| Family Assistance | ($18) | ($72) | ($90) |
| Public Health | 0 | (27) | (27) |
| HIV/AIDS Rent Cap | (1) | (3) | (4) |
| Subtotal Cost Shifts | ($19) | ($102) | ($121) |
| Total Impact | ($11) | ($350) | ($361) |
Note: Impacts on City’s financial plan estimated by the New York State Division of Budget.
Expenditures Analysis
Total-funds FY 2020 expenditures in the February Financial Plan are projected to grow by about two tenths of a percent from $92.0 billion in FY 2019 to $92.2 billion in FY 2020. However, both the FY 2019 and FY 2020 expenditures include prepayments which lower debt service expenditures in these fiscal years. In addition, expenditures in FY 2019 are further reduced by the take-down of the general reserve and the re-estimates of prior-year payables and receivables. After adjusting for prepayments and other prior-year actions, and excluding re-estimates of prior-year receivables and payables and reserves, expenditures are projected to grow from $93.5 billion in FY 2019 to $94.1 billion in 2020, a growth of 0.6 percent, as shown in Table 14.
Expenditure growth over the Plan period is driven by spending on wages and salaries, debt service, health insurance, pensions, and other fringe benefits. The combined spending in these areas is projected to grow by 16.1 percent over the Plan period, averaging 3.8 percent growth annually. All other expenditures, net of the General Reserve, Capital Stabilization reserve, and prior-year re-estimates, are projected to decline by 4.2 percent over the same period, with a projected annual average decline of 1.1 percent.
Table 14. FY 2019 – FY 2023 Expenditure Growth Adjusted for Prepayments and Prior-Year Actions
| ($ in millions) | FY 2019 | FY 2020 | FY 2021 | FY 2022 | FY 2023 | Growth FYs 19-23 | Annual Growth |
| Salaries and Wages | $28,593 | $29,833 | $30,855 | $30,714 | $31,242 | 9.3% | 2.2% |
| Debt Service | $6,737 | 7,345 | 7,658 | 8,337 | 9,086 | 34.9% | 7.8% |
| Health Insurance | $6,502 | 7,076 | 7,474 | 8,035 | 8,593 | 32.2% | 7.2% |
| Pensions | $9,738 | $9,839 | $10,305 | $10,752 | $10,957 | 12.5% | 3.0% |
| Other Fringe Benefits | $4,039 | 4,353 | 4,441 | 4,557 | 4,679 | 15.8% | 3.7% |
| Subtotal | $55,609 | $58,445 | $60,733 | $62,395 | $64,558 | 16.1% | 3.8% |
| Medicaid | $5,915 | $5,915 | $5,915 | $5,915 | $5,915 | 0.0% | 0.0% |
| Public Assistance | $1,595 | $1,617 | $1,617 | $1,617 | $1,617 | 1.3% | 0.3% |
| Judgments and Claims | $697 | $712 | $727 | $742 | $758 | 8.8% | 2.1% |
| Contractual Services | $17,513 | $15,922 | $15,957 | $16,048 | $16,020 | (8.5%) | (2.2%) |
| Other OTPS | $12,197 | $11,518 | $11,619 | $11,801 | $11,998 | (1.6%) | (0.4%) |
| Subtotal | $37,917 | $35,684 | $35,835 | $36,123 | $36,307 | (4.2%) | (1.1%) |
| Expenditures Before Reserves and Prior-Year Re-estimates | $93,526 | $94,129 | $96,568 | $98,518 | $100,865 | 7.8% | 1.9% |
| Prior-Year Receivables and Payables Re-estimate | ($400) | $0 | $0 | $0 | $0 | (100.0%) | (100.0%) |
| General Reserve | $300 | $1,000 | $1,000 | $1,000 | $1,000 | 233.3% | 35.1% |
| Capital Stabilization Reserve | $0 | $250 | $250 | $250 | $250 | ||
| Total | $93,426 | $95,379 | $97,818 | $99,768 | $102,115 | 9.3% | 2.3% |
Headcount
The February 2019 Plan for FY 2020 projects a small decline in full-time headcount for FY 2020, then a slight rise in the following two fiscal years, with a leveling off in FY 2023. Full-time headcount, as shown in Table 15, is projected at 305,955 for FY 2019, falling slightly in FY 2020 to 305,363 then rising in the following two fiscal years to 307,769 and 310,590, respectively, then falling slightly in FY 2023 to 310,540.
Table 15. Total Funded Full-Time Year-End Headcount Projections February 2019 Financial Plan
| FY 2019 | FY 2020 | FY 2021 | FY 2022 | FY 2023 | |
| Pedagogical | |||||
| Dept. of Education | 120,697 | 121,054 | 123,019 | 125,762 | 125,762 |
| City University | 4,441 | 4,441 | 4,441 | 4,441 | 4,441 |
| Subtotal | 125,138 | 125,495 | 127,460 | 130,203 | 130,203 |
| Uniformed | |||||
| Police | 36,113 | 36,118 | 36,118 | 36,118 | 36,118 |
| Fire | 10,951 | 10,951 | 10,951 | 10,951 | 10,951 |
| Correction | 10,226 | 10,063 | 10,063 | 9,904 | 9,904 |
| Sanitation | 7,823 | 7,721 | 7,721 | 7,721 | 7,721 |
| Subtotal | 65,113 | 64,853 | 64,853 | 64,694 | 64,694 |
| Civilian | |||||
| Dept. of Education | 12,337 | 12,399 | 12,593 | 12,869 | 12,869 |
| City University | 1,942 | 1,946 | 1,946 | 1,946 | 1,946 |
| Police | 15,566 | 15,704 | 15,703 | 15,703 | 15,703 |
| Fire | 6,277 | 6,370 | 6,362 | 6,362 | 6,362 |
| Correction | 2,274 | 2,043 | 2,043 | 2,043 | 2,043 |
| Sanitation | 2,308 | 2,308 | 2,308 | 2,308 | 2,308 |
| Admin. for Children’s Services | 7,168 | 7,350 | 7,564 | 7,564 | 7,564 |
| Social Services | 14,684 | 14,640 | 14,640 | 14,640 | 14,640 |
| Homeless Services | 2,659 | 2,623 | 2,623 | 2,623 | 2,623 |
| Health and Mental Hygiene | 5,780 | 5,584 | 5,574 | 5,574 | 5,574 |
| Finance | 2,198 | 2,210 | 2,210 | 2,210 | 2,210 |
| Transportation | 5,491 | 5,439 | 5,436 | 5,435 | 5,435 |
| Parks and Recreation | 4,388 | 4,309 | 4,306 | 4,306 | 4,306 |
| All Other Civilians | 32,632 | 32,090 | 32,148 | 32,110 | 32,060 |
| Subtotal | 115,704 | 115,015 | 115,456 | 115,693 | 115,643 |
| Total | 305,955 | 305,363 | 307,769 | 310,590 | 310,540 |
The February 2019 headcount plan, as shown in Table 16, shows a net increase in year-end headcount of 526 in FY 2019, 232 in FY 2021, and 274 in FY 2022. However, planned FY 2020 year-end headcount is 197 more than the November Plan. Of the projected changes, new needs account for 337 positions in FY 2019, 357 in FY 2020, 401 in FY 2021 and 459 in FY 2022. Agencies projecting significant new needs include
- the Department of Sanitation, projecting new needs of 171 positions, including 115 for an Organics Program,
- the Department of Housing Preservation and Development, projecting new needs of 36 positions,
- the Department of Buildings, projecting new needs of 35 positions, for OATH hearing reps, and
- the Department of Education, projecting new needs of 25 positions, including 15 for 3-K expansion.
Table 16. Full-time Headcount Plan-to-Plan Comparison November 2018 Financial Plan vs. Febraury 2019Financial Plan
| FY 2019 | FY 2020 | FY 2021 | FY 2022 | |
| Pedagogical | ||||
| Dept. of Education | (26) | 86 | 136 | 194 |
| City University | 0 | 0 | 0 | 0 |
| Subtotal | (26) | 86 | 136 | 194 |
| Uniformed | ||||
| Police | 8 | 8 | 8 | 8 |
| Fire | 0 | 0 | 0 | 0 |
| Correction | 0 | (179) | (179) | (179) |
| Sanitation | 166 | 51 | 51 | 51 |
| Subtotal | 174 | (120) | (120) | (120) |
| Civilian | ||||
| Dept. of Education | (85) | 24 | 24 | 24 |
| City University | 0 | 0 | 0 | 0 |
| Police | 62 | 0 | 0 | 0 |
| Fire | 11 | 31 | 23 | 23 |
| Correction | 0 | 0 | 0 | 0 |
| Sanitation | 6 | 6 | 6 | 6 |
| Admin. for Children’s Services | 152 | 0 | 0 | 0 |
| Social Services | (18) | (46) | (46) | (46) |
| Homeless Services | 46 | 46 | 46 | 46 |
| Health and Mental Hygiene | 16 | 14 | 14 | 14 |
| Finance | 0 | 0 | 0 | 0 |
| Transportation | 49 | 14 | 14 | 14 |
| Parks and Recreation | 19 | 8 | 8 | 8 |
| All Other Civilians | 120 | 134 | 127 | 111 |
| Subtotal | 378 | 231 | 216 | 200 |
| Total | 526 | 197 | 232 | 274 |
Table 17 compares actual headcount on December 31, 2018 to the planned February Plan FY 2019 year-end headcount. The headcount plan shows an expected net increase of 7,585 full-time employees Citywide, from June 30, 2018. However, as shown in the table, six months into FY 2019, the City has only met approximately 19.6 percent of its planned increase for the current fiscal year. As such, it is likely that the City will be able to recognize additional accrual savings from shortfall in hiring as the fiscal year progresses.
Table 17. November 30, 2018 Headcount vs. Planned June 30, 2019 Headcount
| 6/30/2018 Actuals | 12/31/2018 Actuals | 6/30/2019 February 2019 Plan | Change 6/30/2018 Actuals to 12/31/2018 Actuals | Planned Change 6/30/2018 to 6/30/2019 | Percent of Planned Change Achieved | |
| Pedagogical | ||||||
| Dept. of Education | 119,900 | 120,206 | 120,697 | 306 | 797 | 38.39% |
| City University | 4,549 | 4,601 | 4,441 | 52 | (108) | (48.15%) |
| Subtotal | 124,449 | 124,807 | 125,138 | 358 | 689 | 51.96% |
| Uniformed | ||||||
| Police | 36,643 | 36,628 | 36,113 | (15) | (530) | 2.83% |
| Fire | 11,244 | 11,192 | 10,951 | (52) | (293) | 17.75% |
| Correction | 10,653 | 10,467 | 10,226 | (186) | (427) | 43.56% |
| Sanitation | 7,558 | 7,987 | 7,823 | 429 | 265 | 161.89% |
| Subtotal | 66,098 | 66,274 | 65,113 | 176 | (985) | (17.87%) |
| Civilian | ||||||
| Dept. of Education | 12,799 | 12,880 | 12,337 | 81 | (462) | (17.53%) |
| City University | 1,880 | 1,848 | 1,942 | (32) | 62 | (51.61%) |
| Police | 15,251 | 15,278 | 15,566 | 27 | 315 | 8.57% |
| Fire | 5,905 | 5,823 | 6,277 | (82) | 372 | (22.04%) |
| Correction | 1,770 | 1,771 | 2,274 | 1 | 504 | 0.20% |
| Sanitation | 2,120 | 2,109 | 2,308 | (11) | 188 | (5.85%) |
| Admin. for Children’s Services | 6,593 | 6,829 | 7,168 | 236 | 575 | 41.04% |
| Social Services | 12,969 | 12,825 | 14,684 | (144) | 1,715 | (8.40%) |
| Homeless Services | 2,368 | 2,374 | 2,659 | 6 | 291 | 2.06% |
| Health and Mental Hygiene | 5,432 | 5,563 | 5,780 | 131 | 348 | 37.64% |
| Finance | 1,882 | 1,876 | 2,198 | (6) | 316 | (1.90%) |
| Transportation | 4,842 | 4,905 | 5,491 | 63 | 649 | 9.71% |
| Parks and Recreation | 4,097 | 4,156 | 4,388 | 59 | 291 | 20.27% |
| All Other Civilians | 29,915 | 30,541 | 32,632 | 626 | 2,717 | 23.04% |
| Subtotal | 107,823 | 108,778 | 115,704 | 955 | 7,881 | 12.12% |
| Total | 298,370 | 299,859 | 305,955 | 1,489 | 7,585 | 19.63% |
Overtime
The FY 2020 Preliminary Budget includes $1.332 billion for overtime expenditures, slightly lower than the budgeted amount of $1.389 billion for FY 2019. Based on year to date spending, the Comptroller’s Office expects FY 2019 overtime spending to be higher than the City’s forecast, at $1.582 billion. The Comptroller’s Office projects that overtime costs will decline for FY 2020 to $1.454 billion as shown in Table 18, posing a risk of $122 million to the budget.
Table 18. Projected Overtime (OT) Spending, FY 2019 and FY 2020
| ($ in millions) | City Planned Overtime FY 2019 | Comptroller’s Projected Overtime FY 2019 | FY 2019 Risk | City Planned Overtime FY 2020 | Comptroller’s Projected Overtime FY 2020 |
FY 2020 Risk |
| Uniformed | ||||||
| Police | $546 | $560 | ($14) | $539 | $560 | ($21) |
| Fire | 219 | 219 | 0 | 208 | 208 | 0 |
| Correction | 150 | 150 | 0 | 151 | 151 | 0 |
| Sanitation | 133 | 133 | 0 | 125 | 125 | 0 |
| Total Uniformed | $1,048 | $1,062 | ($14) | $1,023 | $1,044 | ($21) |
| Civilians | ||||||
| Police-Civilian | $83 | $120 | ($37) | $82 | $100 | ($18) |
| Admin for Child Svcs | 17 | 50 | (33) | 17 | 30 | (13) |
| Environmental Protection | 23 | 40 | (17) | 23 | 35 | (12) |
| Transportation | 49 | 60 | (11) | 44 | 55 | (11) |
| All Other Agencies | 169 | 250 | (81) | 143 | 190 | (47) |
| Total Civilians | $341 | $520 | ($179) | $309 | $410 | ($101) |
| Total City | $1,389 | $1,582 | ($193) | $1,332 | $1,454 | ($122) |
The growth in overtime costs has slowed in recent years and remained relatively flat at $1.8 billion for FYs 2017 and 2018. It is likely that the cost may be lower for FY 2019 and FY 2020. This trend is driven by the cost of uniformed employees’ overtime which has averaged $1.2 billion annually for the last four fiscal years. Increased uniformed headcount levels at the Police Department (NYPD), the Fire Department (FDNY), and the Department of Correction (DOC) have allowed these agencies to rely less on overtime to perform day-to-day operations. The Comptroller’s Office projects a small risk to uniformed overtime spending at the NYPD of $14 million for FY 2019 and $21 million for FY 2020.
In contrast, civilian overtime cost continues to increase substantially, growing at an annual rate of 10.1 percent from $342 million in FY 2012 to $607 million in FY 2018. (See Chart 9). Annual overtime cost at the Administration for Children’s Services (ACS) has almost tripled over this period, from $21.2 million in FY 2012 to $61.1 million in FY 2018. At the Department of Social Services (DSS) and the FDNY, civilian overtime cost has almost doubled between FYs 2012 and 2018 from $18.6 million to $35.6 million for DSS and from $35.8 million to $69.8 million for FDNY. The NYPD has also experienced steady growth in civilian overtime from $85.7 million in FY 2012 to $134.9 million in FY 2018.
Chart 9. Civilian Overtime
($ in millions)
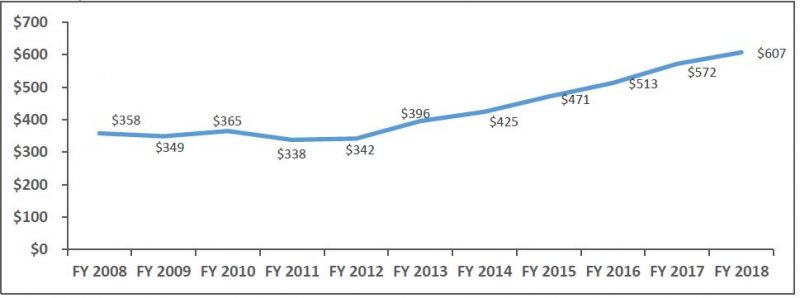
Health Insurance
The FY 2020 Preliminary Budget includes $7.076 billion for employees’ and retirees’ pay-as-you-go health insurance, an increase of $574 million over the adjusted health insurance cost for FY 2019. The increase from FY 2019 reflects projected premium rate increases of 6.5 percent for active employees and pre-Medicare retirees and 5 percent for senior care rate.[28] As shown in Table 19, health insurance costs are projected to increase to $7.474 billion in FY 2021, $8.035 billion in FY 2022 and $8.593 billion by FY 2023, growing at an annual rate of 6.7 percent. The out-year projections assume annual increases in health insurance premium rates of 6.0 percent in FY 2021, 5.5 percent in FY 2022 and 5.0 percent in FY 2023. Senior care rates are projected to increase by 5 percent annually.
Table 19. Pay-As-You-Go Health Expenditures
| ($ in millions) | FY 2019 | FY 2020 | FY 2021 | FY 2022 | FY 2023 |
| Department of Education | $2,422 | $2,629 | $2,851 | $3,110 | $3,386 |
| CUNY | 105 | 113 | 118 | 147 | 151 |
| All Other | 3,676 | 4,334 | 4,504 | 4,777 | 5,056 |
| Subtotal | 6,202 | 7,076 | 7,474 | 8,035 | 8,593 |
| FY 2019 Prepayment | 300 | 0 | 0 | 0 | 0 |
| Adjusted Pay-As-You-Go Health Insurance Costs | $6,502 | $7,076 | $7,474 | $8,035 | $8,593 |
The City’s health insurance costs have steadily increased over the last ten fiscal years, growing at an annual rate of 6.5 percent from $3.301 billion in FY 2008 to $6.209 billion in FY 2018. Even if headcount levels remain stable, the annual increases in health insurance premium rates, particularly for actives and pre-Medicare retirees, will continue to drive health insurance costs upwards. From FY 2008 to FY 2014 annual health insurance premium rate increases for actives and pre-Medicare retirees averaged approximately 9.0 percent. The City was able to work with Emblem Health, whose rate determines the City’s overall health insurance cost, to slow the growth in premium rates. As a result, premium rates for actives and pre-Medicare retirees increased by only 1.2 percent in FY 2015 and 2.9 percent in FY 2016. However, rates rose by 4.9 percent in FY 2017 and spiked to 7.6 percent in FY 2018. The senior care rate, after declining from $166 a month in FY 2012 to about $160 a month in FY 2013 remained at that cost through FY 2016 before rising to $168 in FY 2017 and $172 in FY 2018. However, growth is expected to accelerate to 5 percent annually with projected premiums of $182 in FY 2019, growing to $221 by FY 2023.
Public Assistance
Through January, the City’s public assistance caseload has averaged 349,690 recipients per month in the current fiscal year, representing a decline of 4.8 percent, or 17,500 recipients from the monthly average during the same period in FY 2018. Over the course of the past 12 months, the City’s public assistance caseload has experienced a significant drop of over 22,000 recipients, from 367,321 in January 2018 to 344,972 in January 2019. Monthly public assistance grants spending has also begun to follow this trend. Compared with the monthly average of $124 million in FY 2018, the FY 2019 year-to-date monthly average spending has thus far fallen by more than four percent to about $118 million.
The City currently maintains its FY 2019 public assistance caseload projection at a monthly average of 367,000 over the entire plan period, unchanged since the November Plan. Net baseline grants expenditures are projected at about $1.53 billion to $1.55 billion in each year of the Plan. While actual caseloads are currently running significantly below projections in FY 2019, baseline grants spending appears to be in line with the City’s expectation.
Department of Education
The February Modification reflects a net increase of $758 million in the Department of Education’s (DOE) FY 2019 budget. The DOE budget now totals $26.47 billion in the current year, an increase of 5.5 percent or $1.38 billion above actual FY 2018 spending of $25.08 billion.
The current year increase in the February Modification is driven primarily by collective bargaining transfers from the labor reserve of $919 million. United Federation of Teachers (UFT) contract costs figure prominently in this estimate, constituting about $878 million of the total. This includes $750 million in retroactive lump sum payments for salary increases negotiated in the prior UFT contract, representing the third in a series of five installments that are scheduled to be completed by FY 2021. Offsetting the collective bargaining increases is a transfer of $210 million in Federal and State funds to the Administration of Children’s Services due to delay in the implementation of the EarlyLearn program.
The FY 2020 Preliminary Budget projects DOE spending of $26.88 billion, an increase of $417 million or 1.6 percent from the FY 2019 budget. Compared to the November Plan, the Preliminary Budget shows a net increase of $378 million, with the majority of the additional funding again for collective bargaining transfers totaling $352 million. The Preliminary Budget also reflects new needs of about $36 million, including $25 million for 3-K for All expansion for two additional school districts and $9 million for science curriculum. In addition, the DOE budget also recognizes a $41 million increase in State grants for Smart Schools Technology. The DOE portion of the CSP is expected to generate about $89 million in offsets consisting of $38 million in Federal school food revenue, $25 million in central budget reductions, $18 million from eliminations of the senior teacher salary supplement and certain leadership development funding and $8 million in Renewal School spending re-estimate. The CSP impact is a net expense reduction of $51 million because the school food revenue represents a funding shift between Federal and City funds.
The State Executive Budget released in January proposes to increase formula-based school aids by $282 million to the City in the upcoming school year, including $202 million in Foundation Aid. The proposed school aids would fall short of the City’s education aid assumptions by $148 million in FY 2020, although the legislature has traditionally provided school aid increases during budget adoption. The City indicates that provisions in the State Executive budget would also earmark 75 percent of the Foundation Aid increase for “high-need and underfunded” schools. If approved, the City estimates it may need to provide $152 million to offset needs for schools that would be excluded from the funding enhancement. The redistribution of Foundation Aid under the Governor’s proposal will likely be about $100 million, as discussed in the Federal and State aid section beginning on page 34.
The Department will likely continue to face risks from its assumptions of Federal Medicaid reimbursement in the February Plan. The DOE anticipates $97 million annually in Medicaid reimbursement for special education related services costs. While actual revenues have steadily improved over the past three years, collections in FY 2018 currently remain about $24 million below projections. The DOE will need to demonstrate a consistent track record before these Medicaid reimbursement can be deemed a reliable revenue source, therefore the Comptroller’s Office estimates risks of $20 million in each year of the current plan. The DOE budget also does not reflect the potential outyear costs from increased charter school tuition rates approved by the State. Given that the State still has not provided dedicated funding to support the additional costs in future years, the City estimates it could face risks of $119 million in FY 2020, $281 million in FY 2021, $478 million in FY 2022 and $758 million in FY 2023.
Further, the DOE could face risks of at least $80 million annually from underbudgeting the costs of special education Carter Cases in the February Plan. These costs represent payments to parents who legally seek reimbursement for placing their special needs children in non-public schools. Given the growth of these costs, which spiked to $417 million in FY 2017 and $393 million in FY 2018, current spending projections in the February Plan may be understated by at least $80 million in each year of the plan.
Homeless Services
Spending on adult and family shelter in the Department of Homeless Services (DHS) is the primary driver of the City’s homelessness expenses. However, funding for homeless assistance is also, and increasingly, drawn from the budgets of other agencies, including the Department of Social Services, the Department of Youth and Community Development, the Department of Health and Mental Hygiene and the Department of Veterans Services. The table below details funding for seven major categories of homeless services across these agencies.
Table 20. Citywide Homeless Services Expenditures
| ($ in millions) | FY 2014 | FY 2019 | FY 2020 | FY20 21 | FY 2022 | FY 2023 |
| Adult Shelter Operations | $326 | $652 | $638 | $638 | $637 | $637 |
| Family Shelter Operations | $505 | $1,139 | $1,141 | $1,141 | $1,141 | $1,141 |
| Homeless Administration & Support | $151 | $301 | $311 | $316 | $315 | $315 |
| Rental Assistance | $87 | $330 | $377 | $370 | $363 | $363 |
| Prevention, Diversion, Anti-Eviction & Aftercare | $131 | $346 | $336 | $353 | $352 | $353 |
| DV, Youth & Emergency Shelters | $69 | $110 | $110 | $110 | $110 | $110 |
| Total Citywide Homeless Spending | $1,269 | $2,878 | $2,913 | $2,927 | $2,919 | $2,919 |
Total citywide homeless services expenses have more than doubled, from actual expenses in FY 2014 of $1.269 billion to planned expenses of $2.913 billion in the preliminary FY 2020 budget. The 130 percent increase in homeless services spending during this timeframe coincides with a 16 percent increase in the City’s total shelter census.[29] Family shelter operations are the largest driver of homeless services expenses, increasing by some $636 million from FY 2014 to FY 2020, while rental assistance spending is the fastest growing expense category on a proportional basis. In terms of changes to the FY 2019 budget, the February plan calls for a $17.2 million boost in citywide homeless spending across the six agencies that provide homeless services. Just $1.9 million of that increase is attributable to spending on shelter operations while the remainder reflects rising administrative and programmatic expenses.
The February Plan contains some notable increases and reductions to homeless services spending. The most prominent spending increases are in programs administered by the Department of Social Services. The largest of these escalations will go to the Access to Counsel program, which is a component of the City’s suite of anti-eviction legal services. Funding for Access to Counsel is planned to increase in the outyears, from FY 2020 – FY 2023. Additionally, the February Plan calls for an increase of $6.2 million to be put towards Subsidized Jobs for Homeless Clients in FY 2019. A substantial reduction to the budget for runaway youths in the February Plan will reduce spending across four different budget lines at the Department of Youth and Community Development that serve this population. Runaway youth expenses will be cut by $16.2 million for the remainder of FY 2019 with that same general spending level slated to continue in the out years from FY 2020 – FY 2023.
A familiar pattern of underestimating expenses for adult shelter operations is poised to continue into FY 2020. At the adoption of the FY 2019 budget in June, some $645 million in total funds was designated for DHS adult shelter operations and the February Plan increased that amount by an additional $6.7 million in total funds for FY 2019. However, adult shelter operations expenses in preliminary budget for FY 2020 are planned to decrease by $13.7 million in total funds, due to additional Federal grants added on a yearly basis. This decrease rests on an assumption that the adult shelter population will decrease in FY 2020, despite an increase of approximately 1,300 single adults in city shelters since the start of FY 2019. Considering the steady upward trajectory of the single adult shelter census in recent years and barring any major shifts in homelessness policy that could reduce the single adult shelter census, the preliminary FY 2020 budget for adult shelter operations appears to be insufficient. Even if the City is able to keep its adult shelter census at current levels in FY 2020, and considering that City funding is expected to account for 87.5 percent of the adult shelter services budget in FY 2020, it is anticipated that an additional $12 million in City funds will be necessary to meet adult shelter service expenses.
Health + Hospitals
In its latest financial plan update, H+H projects to end the current fiscal year with a cash balance of $812 million. The revision represents a significant improvement from the previous cash plan update in the FY 2019 Executive Budget that projected an ending cash balance of $625 million for H + H in FY 2019. Part of the improvement stems from a $68 million increase in the current year opening cash balance mainly from Transformation Plan revenues exceeding their FY 2018 targets in the previous plan. H+H has correspondingly raised its Transformation Plan revenue projection by $129 million in the current year. In addition, baseline revenue projection reflects an increase of $688 million mainly from the timing of supplemental Medicaid revenues, enabling H+H to offset a similar increase in expenses. More than half of the cost increase is attributable to a $371 million repayment of prior year obligations to the City, including $146 million for debt service, $123 million for medical malpractice and $75 million for retirees’ health benefits.
For the FY 2020 Preliminary Budget, the City currently projects H+H cash receipts of $7.01 billion, a decline of more than $700 million from FY 2019, against disbursements of $8.36 billion before accounting for revenues and savings from the Transformation Plan. The revenue decline is primarily due to a reduction in supplemental Medicaid revenue, as scheduled cuts in Federal Disproportionate Share Hospital (DSH) reimbursement are slated to begin in October 2019. The Preliminary Budget reflects a baseline deficit of $1.35 billion for H+H in FY 2020, prior to the Transformation Plan. Over the remainder of the Plan, the baseline deficits for H+H are expected to increase to $1.7 billion to $2.0 billion annually as DSH continues to erode its revenue base while expenses are projected to rise by about $500 million over the same period.
H+H anticipates to reduce the majority of the projected deficits through actions from its Transformation Plan, with revenue enhancements making up about two-thirds of the total plan values. In FY 2017 and FY 2018, the Transformation Plan was able to provide $911 million and $1.03 billion in fiscal relief, respectively. These actions are expected to continue at $1.19 billion in the current year before expanding to $1.42 billion in FY 2020 and about $1.6 billion in each of FYs 2021-2023. Achieving these actions would enable H+H to maintain healthy cash balances through most of the Plan period. While H+H has had success with the program over the past two years and current year projections appear to be on track, it remains to be seen if H+H can achieve the larger budget offsets in the outyears of the Plan. The higher Transformation Plan values in the outyears are expected to be realized mainly through greater reimbursements from revenue cycle and managed care contract improvements, as well as headcount savings.
Capital Budget and Financing Program
Capital Commitment Plan, FY 2019-2023
The February 2019 Capital Commitment Plan for the five-year period, FYs 2019 – 2023, contains $83.76 billion in authorized all-funds commitments, as shown in Table 21.[30] City-funds commitments account for $77.48 billion of the total. All-funds commitments decreased by $3.05 billion, or 4.2 percent, from the October 2018 Commitment Plan, largely due to a refinement in estimated commitments leading to a postponement or redistribution of commitments into FY 2023 and beyond.
All-Funds Commitments
All-funds commitments, after adjusting for the $7.35 billion reserve for unattained commitments, total $76.42 billion, or an average of $15.28 billion per year. Approximately 23 percent of all-funds commitments are scheduled for FY 2019, reflecting the City’s attempt to reduce the front loading of the Plan which in the past 26 plans had ranged from 21 to 55 percent (an average of 37 percent) of commitments in the first year.
Similar to past capital commitment plans, commitments for DOE and CUNY, the Department of Environmental Protection (DEP), the Department of Transportation (DOT) and Mass Transit, and Housing and Economic Development account for a majority of total commitments, with 69.0 percent of total commitments.[31]
Table 21. FYs 2019 – 2023 Capital Commitments, All-Funds
($ in millions)
| Project Category | February FY 2019 – FY 2023 Commitment Plan | Percent of Total | Change from October 2018 Plan |
| Education and CUNY | $19,378 | 23.1% | $3,434 |
| Environmental Protection | 13,343 | 15.9 | (1,902) |
| Dept. of Transportation and Mass Transit | 12,101 | 14.5 | (3,006) |
| Housing and Economic Development | 12,982 | 15.5 | (425) |
| Administration of Justice | 5,147 | 6.1 | (251) |
| Resiliency, Technology and Equipment | 5,028 | 6.0 | 335 |
| Parks Department | 4,476 | 5.3 | (386) |
| Hospitals | 2,749 | 3.3 | 50 |
| Other City Operations and Facilities | 8,560 | 10.2 | (903) |
| Total Authorized Commitment | $83,764 | 100.0% | ($3,054) |
| Reserve for Unattained Commitments | ($7,345) | N/A | (79) |
| Total Net of Reserve for Unattained Commitments | $76,419 | N/A | ($3,133) |
Source: NYC Office of Management and Budget, FYS 2019 – 2023 February Capital Commitment Plan, February 2019. Change Figures are based on FYS 2019-2022 ONLY. Numbers may not add due to rounding.
The net decrease of $3.05 billion in authorized commitments from the October 2018 Plan is comprised of decreases of $1.0 billion in FY 2019, $1.72 billion in FY 2020, $836 million in FY 2021, with an increase of $506 million in FY 2022.
A significant portion of the FY 2019 decrease stems from reductions of $169 million in public buildings related projects, $168 million in water pollution control projects, and $137 million for the purchase of citywide equipment.
The decrease of $1.72 billion in FY 2020 is driven by reductions of $735 million in the Parks Department, $635 million in DEP related commitments, $596 million in economic development commitments and $958 million across 30 project types. These reductions are partially offset by an increase of $1.20 billion in DOE capital projects from the incorporation of School Construction Authority (SCA) FY 2020-2024 Capital Plan.
The decrease of $836 million in FY 2021 is driven by a $495 million decrease in highway bridges related commitments, along with decreases of $413 million to water mains related items, $331 million in highways and street construction commitments and a $743 million decrease across 36 different project types. In addition, there is an increase of $1.15 billion for the DOE reflecting its new SCA 2020-2024 Capital Plan.
The increase of $506 million in FY 2022 reflects a $1.26 billion increase in DOE related project commitments, offset by $1.12 billion in lowered highway bridges estimates. Other increases include $374 million in economic development projects, $362 million in Parks project commitments, and $247 million in public building projects. These increases are then offset by $621 million of decreases across 35 project types.
Preliminary Ten-Year Capital Strategy
The City is required by Sections 215 and 234 of the City Charter to issue a Preliminary Ten-Year Capital Strategy (Preliminary Strategy) every odd calendar year. The Preliminary Strategy for FY 2020 – FY 2029 totals $104.09 billion – $98.33 billion in City-funds and $5.77 billion in non-City funds. This is an $8.25 billion, or 8.6 percent, increase from the last Ten-Year Capital Strategy published in April 2017 (the “prior Strategy”), as shown on Table 22.
Table 22. Preliminary Ten-Year Capital Strategy FYs 2020 – 2029 vs April 2017 Ten-Year Capital Strategy
| ($ in millions) | April 2017 Capital Strategy – City-Funds | April 2017 Capital Strategy – All-Funds | February 2019 Capital Strategy – City-Funds | February 2019 Capital Strategy – All-Funds | Change in City-Funds | Change in All-Funds |
| Education (DOE and CUNY) | $18,744 | $20,918 | $22,299 | $23,618 | $3,555 | $2,700 |
| Environmental Protection | 17,863 | 18,073 | 19,304 | 19,667 | 1,441 | 1,594 |
| DOT and Transit | 14,011 | 15,867 | 14,228 | 15,590 | 217 | (276) |
| Housing ( HPD and NYCHA) | 10,617 | 10,944 | 12,633 | 12,953 | 2,016 | 2,009 |
| Business Services | 3,050 | 3,203 | 3,424 | 3,653 | 374 | 450 |
| All Other | 24,638 | 26,840 | 26,440 | 28,614 | 1,801 | 1,773 |
| Total | $88,923 | $95,845 | $98,328 | $104,095 | $9,404 | $8,250 |
Source: Preliminary Ten-Year Capital Strategy, Fiscal Years 2020-2029, and the April 2017 Ten-Year Capital Strategy,
The Preliminary Strategy is front-loaded with 62 percent of estimated commitments over the first four years. Similar to past Ten-Year Strategies, the majority of commitments are for Education, DEP, Housing (including NYCHA), and DOT/Transit, which together constitute 69.0 percent of the current Preliminary Strategy. The categories with the largest changes from the prior capital strategy are Education (DOE) with an increase of $2.50 billion, HPD and NYCHA with a combined increase of $2.01 billion with NYCHA accounting for $1.59 billion of the increase, and water pollution control related projects with an increase of $1.45 billion, and Resiliency, Technology, and Equipment projects with an increase of $1.21 billion.
Commitments in the current capital strategy are also allocated among three “lifecycle” project categories: state of good repair which involves maintaining and repairing facilities and infrastructure, program expansion which involves adding new or expanding current facilities and infrastructure, and programmatic replacement which involves replacing facilities or equipment. More than half of the commitments, $56.57 billion, are allocated for state of good repair followed by $26.38 billion for program expansion, and $21.14 billion for programmatic replacement as shown in Table 23.
Examples of state of good repair projects are $14.24 billion for the reconstruction and rehabilitation of schools; $7.94 billion for East River and other bridge reconstruction; and $7.58 billion housing preservation and stabilization efforts.
Some examples of program expansion projects include $8.8 billion for new school construction and expansion, which includes the construction of new schools at a cost of $6.5 billion, and $2.3 billion for improvements to leased facilities, athletic fields and playgrounds and building additions; $5.4 billion for new and special needs housing; and $2.2 billion for the construction of the third water tunnel, including the Kensico City Tunnel.
Programmatic replacement projects include such items as $5.1 billion of upgrades to water pollution control plants; $2.4 billion for water main replacements and dam safety programs; and $2.4 billion for citywide information systems and equipment.
The Preliminary Strategy continues to be heavily financed by City bonds (GO and TFA), with an estimated $79 billion in anticipated borrowing, or 76 percent of the Preliminary Strategy compared to 74 percent in the prior Strategy as shown on Table 23. The Municipal Water Finance Authority (NYW) is estimated to fund $19.3 billion of the Preliminary Strategy, or 18.5 percent, with the balance of 5.5 percent from Federal, State, and other sources. The Federal, State, and Private support of $5.77 billion represents a decrease of $1.15 billion from the prior Strategy.
Table 23. FY 2020 – FY 2029 Ten-Year Capital Strategy Major Capital Commitments by Programmatic Classification
($ in millions)
| Agency/ Project Type | State of Good Repair | Program Expansion | Programmatic Replacement |
Total |
Percent of Total |
| Department of Education | $14,238 | $8,786 | $0 | $23,024 | 22.1% |
| Department Environmental Protection: | $1,208 | $7,904 | $10,555 | $19,667 | 18.9% |
| Water Pollution Control | 0 | 1,024 | 7,160 | 8,185 | 7.9% |
| Water Mains | 276 | 1,640 | 2,384 | 4,300 | 4.1% |
| Sewers | 886 | 2,986 | 393 | 4,265 | 4.1% |
| Water Supply | 1 | 2,254 | 0 | 2,255 | 2.2% |
| DEP Equipment | 44 | 0 | 618 | 662 | 0.6% |
| Dept. of Transportation: | $14,679 | $0 | $483 | $15,162 | 14.6% |
| Bridges and Highway Bridges
|
7,938 | 0 | 25 | 7,963 | 7.6% |
| Highways | 6,133 | 0 | 0 | 6,133 | 5.9% |
| Traffic | 607 | 0 | 0 | 607 | 0.6% |
| Ferries | 0 | 0 | 382 | 383 | 0.4% |
| Transportation Equipment | 0 | 0 | 76 | 76 | 0.1% |
| Housing Preservation and Development | 4,544 | 5,376 | 0 | 9,920 | 9.5% |
| NYCHA | 3,034 | 0 | 0 | 3,034 | 2.9% |
| Economic Development (SBS) | 0 | 3,653 | 0 | 3,653 | 3.5% |
| Administration of Justice | $1,715 | $91 | $3,443 | $5,249 | 5.0% |
| Police | 958 | 503 | 1,462 | 1.4% | |
| Correction | 757 | 91 | 960 | 1,808 | 1.7% |
| Courts | 0 | 0 | 1,980 | 1,980 | 1.9% |
| Technology and Citywide Equipment | 4,917 | 0 | 2,252 | 7,169 | 6.9% |
| Parks Department | 3,870 | 258 | 0 | 4,129 | 4.0% |
| Hospitals (H +H) | 1,897 | 0 | 661 | 2,558 | 2.5% |
| Other City Operations and Facilities | 6,472 | 314 | 3,744 | 10,530 | 10.2.% |
| Total | $56,574 | $26,382 | $21,139 | 104,095 | 100.0% |
Source: Office of Management and Budget, FY 2019 Ten-Year Capital Strategy, February 2019.
Note: Numbers may not tie due to rounding.
Table 24. Funding of the FY 2020 – 2029 Ten-Year Capital Strategy
($ in millions)
| Agency/Project Type |
Tax- Supported |
Water Authority Funded |
Non-City Funded |
Total Funded |
| Department of Education | $21,710 | $0 | $1,314 | $23,024 |
| Department Environmental Protection: | $0 | $19,304 | $363 | $19,667 |
| Water Pollution Control | 0 | 7,832 | 353 | 8,185 |
| Water Mains | 0 | 4,300 | 0 | 4,300 |
| Sewers | 0 | 4,255 | 10 | 4,265 |
| Water Supply | 0 | 2,255 | 0 | 2,255 |
| DEP Equipment | 0 | 662 | 0 | 662 |
| Dept. of Transportation | $13,800 | 0 | $1,362 | $15,162 |
| Bridges and Highway Bridges | 7,618 | 0 | 345 | 7,963 |
| Highways | 5,498 | 0 | 636 | 6,133 |
| Traffic | 351 | 0 | 256 | 607 |
| Ferries | 258 | 0 | 124 | 383 |
| Transportation Equipment | 75 | 0 | 1 | 76 |
| Housing Preservation and Development | $9,600 | $0 | $320 | $9,920 |
| NYCHA | $3,034 | $0 | $0 | $3,034 |
| Economic Development (SBS) | $3,424 | $0 | $229 | $3,653 |
| Administration of Justice | $5,222 | $0 | $27 | $5,249 |
| Police | 1,445 | 0 | 16 | 1,462 |
| Correction | 1,799 | 0 | 9 | 1,808 |
| Courts- | 1,977 | 0 | 2 | 1,980 |
| Resiliency, Technology and Citywide Equipment | $6,698 | $0 | $472 | $7,169 |
| Parks Department | $3,730 | $0 | $398 | $4,129 |
| Hospitals (H +H) | $1,479 | $0 | $1,078 | $2,558 |
| Other City Operations and Facilities | $10,327 | $0 | $203 | $10,530 |
| Total | $79,024 | $19,304 | $5,767 | $104,095 |
| Percent of Total Funding | 76.0% | 18.5% | 5.5% | 100.0% |
Source: Office of Management and Budget, FY 2019 Ten-Year Capital Strategy, February 2019.
Note: Numbers may not add due to rounding.
Major Programmatic Agencies
Education
The Department of Education (DOE) accounts for $23.02 billion in all-funds, or 22.1 percent, of the Preliminary Strategy This is an increase of $2.50 billion from the prior Strategy. DOE program commitments include:
- $7.64 billion for rehabilitation of school components over the ten-year period. This area of work is focused on keeping major building and playground components in a state of good repair, including roofs, parapets and new windows
- $6.52 billion for system expansion for the creation of 57,000 new seats by FY 2024. This category is $2.0 billion more than the prior Strategy
- $2.27 billion for other system expansion for the renovation of leased space, building additions, new athletic fields and playgrounds.
- $3.83 billion for the category of Emergency, Inspection, and Miscellaneous, which is comprised of administrative costs, emergency projects, research and development, along with funds to complete prior plan projects.
- $2.29 billion for Educational Enhancements. This category is technology driven, with eligible computer purchases, network upgrades, approved software enhancements, along with re-wiring projects to better access the internet. Upgrades and replacements of science labs are part of this category as well.
- $478 million allocated for safety and security projects which include security systems, emergency lighting, and miscellaneous code compliance projects.
Department of Environmental Protection
The Department of Environmental Protection (DEP) capital programs account for $19.67 billion, or 18.9 percent of the total Preliminary Strategy commitments. This is $1.59 billion higher than the prior Strategy. DEP capital projects are divided into five program areas: water pollution control; water mains, sources and treatment; sewer related projects; water supply; and equipment purchases.
Water pollution control projects total $8.18 billion and involve capital work at wastewater treatment plants, including projects to improve storm water capture, and conform to water quality mandates. This is an increase of $1.45 billion from the prior Strategy. Project commitments include:
- $5.08 billion for plant upgrade and reconstruction. The primary focus of plant upgrade and reconstruction is the reconstruction or replacement of components, or related conveyance infrastructure at in-City wastewater treatment plants. Commitments in this area include $549 million for Job Order Contracts (JOC) which address small capital improvements more rapidly, and $732 million for waste water treatment plants to reduce carbon emissions and make plants more energy efficient and resilient.
- $2.04 billion for capital projects related to water quality mandates. The majority of the funding will be used for measures to prevent combined-sewer overflow (CSO) into local harbor waters, including $555 million for CSO storage tanks at the Gowanus Canal in Brooklyn.
- $721 million for the Green Infrastructure program. To assist in reducing CSO issues, this program is employing natural water absorption strategies such as the use of constructed wetlands, bioswales, tree pits, green roofs, and permeable pavement projects throughout the City.
The water mains, sources, and treatment program area, which has been allocated $4.3 billion in the Preliminary Strategy, focuses on the upkeep of the water supply at its source and its related distribution systems. This is an increase of $185 million from the prior Strategy. Project commitments include:
- $1.47 billion for trunk and distribution main replacement, including $973 million for a variety of state-of-good repair projects Citywide, as well as $129 million for water main emergency replacements in conjunction with DOT street reconstruction and Vision Zero coordination initiatives, and $141 million for emergency water main work.
- $1.07 billion for water quality preservation programs. This includes $210 million for the inspection and capital repair of the Catskill Aqueduct pressure tunnels, $135 million for the reconstruction of the New Croton Dam, and $125 million for the continued rehabilitation of the Catskill Aqueduct between the Kensico and Hillview reservoirs in Westchester County.
- $912 million for the dam safety program, the bulk of which, $772 million, is for the rehabilitation of the Ashokan Reservoir in Ulster County upstate.
- $273 million for trunk and distribution main extensions.
- $251 million for filtration avoidance determination (FAD) measures for the continued protection of the watershed region. This includes funding for land acquisition, forestry and stream management.
- $38 million for water main extensions to accommodate new development.
Commitments for sewer related projects throughout the City total $4.27 billion in the Preliminary Strategy. This funding is relatively flat from the prior Strategy, down 1 percent. Included in this program area are:
- $1.68 billion for the replacement or augmentation of existing systems, including $896 million for the continued sewer build-out in Southeast Queens and $262 million for state of good repair projects citywide.
- $1.0 billion for sewer extensions to accommodate new development which plans to construct segments or extensions to underserved areas, and to areas with flooding problems due to the absence of storm sewers.
- $887 million for the replacement of chronically failing components to address malfunctioning or collapsed combined sewers. About $600 million of this allocation is reserved for emergency work citywide.
- Just over $241 million for the Bluebelt program for storm water management plan citywide, largely focused in Staten Island.
The Water Supply program was allocated $2.26 billion over the Preliminary Strategy period. This is a decrease of $125 million from the prior Strategy. Commitments include:
- $342 million for City Water Tunnel No. 3, Stage 1, which will modify critical equipment at the Hillview reservoir.
- $1.28 billion for the Kensico-Eastview connection tunnel. This back-up tunnel will connect the Kensico reservoir with the Catskill/Delaware Ultraviolet light facility, both of which are located in Westchester County.
- $597 million for City Water Tunnel No. 3, Stage 2, which will provide DEP the ability to bypass tunnels 1 and 2 and allow inspection of those tunnels for the first time since they were introduced.
DEP equipment programs sum to $662 million over the FY 2020 – FY 2029 period. This includes utility relocation related sewer and water main projects which along with DEP field operations and select administrative offices comprise the majority of the resources in this category. A projected $172 million is provided to pay for 51 percent of the cost of gas utility work that is impacted by water and sewer projects. Another $163 million is for the reconstruction and rehabilitation of field operations facilities and DEP administrative offices. In addition, there is $161 million for management information system upgrades, including a new centralized security system.
Department of Transportation (DOT) and Mass Transit
The Preliminary Ten-Year Capital Strategy contains $15.59 billion over FYs 2020 – 2029, or 15.0 percent of the all-funds total, for NYC DOT and mass transit projects. DOT projects, which include Bridges, Highways, Traffic, Ferries, and Equipment are allocated $15.16 billion, and $428 million is allocated to New York City Transit infrastructure projects.
The Bridges program area contains both East River crossings and highway bridges citywide. $7.96 billion is allocated in this category. This is a decrease of $268 million from the prior Strategy. This includes commitments of:
- $3.85 billion for the Bridge Life Extension category for approximately 40 bridge structures rated “fair or good”. These projects require upgrades and/or component rehabilitation from their current condition. These projects include $422 million for the Trans-Manhattan Expressway and $133 million for the Grand Street Bridge over Newtown Creek.
- $3.42 billion for reconstruction of about 60 bridge structures rated “fair” and “good”. Two large projects account for about 50 percent of this category with $1.6 billion allocated to the Brooklyn-Queens Expressway Triple Cantilever Bridge and $307 million for the Shore Road Bridge over the Hutchinson River.
- $413 million for East River bridges, with $300 million of the total allocated to the Williamsburg Bridge and $61 million for the Ed Koch Queensboro Bridge.
The Highways program area totals $6.13 billion over the ten-year period and is comprised primarily of $1.44 billion for approximately 6,300 lane-miles of street resurfacing and $2.8 billion for street reconstruction. About $945 million of the street reconstruction allocation is dedicated to Vision Zero projects with another $267 million to improve drainage conditions in Southeast Queens.
The Traffic program area within DOT sums to $607 million over the period and contains $294 million for signal installation and computerization, $123 million for lampposts and luminaries, and $87 million for thermoplastic reflectorized pavement markings.
The program area of Ferries contains $383 million over the period, of which $245 million is for improvements and rehabilitation of terminal buildings, slips, and racks at both St. George and Whitehall terminals, and $137 million for the construction/reconstruction of ferry boats.
The Ten-Year Plan category of transportation equipment contains $76 million over the ten-year period and includes $51 million for data processing equipment and $25 million for automotive and other equipment.
The Ten-Year Plan category of Transit (MTA) contains $429 million with $350 million for the ongoing inter-fund agreements (IFA) Track work projects, and $50 million for miscellaneous improvements and $28.6 million for MTA Bus Company capital purchases.
Housing and Economic Development
This program area includes capital projects for HPD, NYCHA, and Small Business Services agencies. The Preliminary Strategy allocates $16.61 billion, or 16 percent of the total Preliminary Strategy to this area. HPD and NYCHA comprises $12.95 billion of the total amount, with Business Services/EDC at $3.65 billion. The housing component’s primary objective is to support the “Housing New York” program whose goal is to create 300,000 units of affordable housing between FY 2014 and FY 2026. According to the September 2018 Mayor’s Management Report, there have been over 109,000 housing starts from FY 2014 through-FY 2018.
HPD spearheads this program area with $9.92 billion over the FYs 2020 – 2029 period. Three HPD categories comprise 92 percent of the allocation. These estimated commitments are:
- $3.72 billion for preservation, which will address the preservation of the existing affordable housing stock and assist in the creation of long-term affordability.
- $2.97 billion for new construction to finance new affordable housing units as part of the Housing New York’s goal to build 300,000 new units by FY 2026.
- $2.41 billion for special needs housing which provides for both the construction and preservation of housing for seniors, the disabled, and formerly homeless households citywide.
NYCHA with $3.03 billion entirely in City funds over the period, will largely address roof replacements along with elevator rehabilitation, lead abatement projects, pest mitigation, and upgrades to heating components at various NYCHA developments. This is an increase of $1.59 billion from the prior Strategy.
The Department of Small Business Services, in conjunction with NYC Economic Development Corporation, has an allocation of $3.65 billion from FYs 2020 – 2029. The Plan for SBS is heavily front-loaded with 90 percent of estimated commitments in the first four years. Four Ten-Year Plan categories make up 72 percent of the agency total. These include Neighborhood Revitalization, Waterfront Development, Commercial Development, and Industrial Development. These estimated commitments are:
- $1.44 billion for neighborhood revitalization. Specific neighborhood projects are not specified in this particular category. The programmatic emphasis is on public areas, with a focus on street and sidewalk reconstruction, public lighting work, and pedestrian and intermodal improvements.
- $420 million for waterfront development whose primary objectives are the expansion and preservation of public waterfront locations throughout the City for transportation and recreational purposes, as well as ferry infrastructure improvements and/or purchases of boats for the new Citywide ferry system.
- $454 million for industrial development which continues to focus on City-owned or operated industrial real estate at the Brooklyn Navy Yard, the Brooklyn Army Terminal, and Bush Terminal in Brooklyn. Capital project objectives include health and safety infrastructure improvements along with bringing assets to a state-of-good repair.
- $300 million for commercial development of the life sciences industry in the City. Overall, the goals of the category are to foster the growth of new industries and new retail opportunities.
Other
- Resiliency, Energy Efficiency, and Citywide Equipment projects in the amount of $7.17 billion over the ten-year period. This includes such efforts as energy efficiency oriented projects with $3.0 billion, $1.5 billion for electronic data processing and Financial Information Service Agency (FISA) projects, and $1.4 billion for resiliency measures, of which $1.2 billion is for the Eastside Coastal Resiliency project in Manhattan.
- The Department of Parks and Recreation contains $4.13 billion in the Preliminary Strategy with $1.59 billion in the category of Large, Major, and Regional park construction, followed by $1.25 billion for Neighborhood Parks and Playgrounds.
- NYC Health + Hospitals is allocated $2.56 billion, $1.08 billion of which is from Federal support for on-going Sandy related projects.
Financing Program
The February 2018 Financial Plan for FY 2019 – FY 2023 contains $54.64 billion of planned borrowing in FY 2019 – FY 2023, as shown below in Table 25. The borrowing is comprised of $21.77 billion of General Obligation (GO) bonds, $23.37 billion of Transitional Finance Authority (TFA) borrowing, $8.77 billion of New York Water Finance Authority (NYW) borrowing and $737 million of borrowing from TFA Building Aid Revenue Bonds (BARB) that are supported by State building aid revenues.
Table 25. February Plan FY 2019 Financing Program
| ($ in millions) | Estimated Borrowing and Funding Sources FY 2019 – FY 2023 | Percent of Total |
| General Obligation Bonds | $21,770 | 39.8% |
| TFA – PIT Bonds | 23,370 | 42.8 |
| NYC Water Finance Authority | 8,765 | 16.0 |
| TFA – BARBs | 737 | 1.4 |
| Total | $54,642 | 100.0% |
Source: NYC Office of Management and Budget, February 2019 Financial Plan.
Total projected borrowing in the February Plan for FY 2019 through FY 2022 is $580 million less than the November 2018 Financial Plan estimate.[32] This is a result of an increase of $658 million in FY 2019, offset by decreases of $257 million in FY 2020, $603 million in FY 2021 and $378 million in FY 2022. GO borrowing is projected to decrease by $440 million over the period. Planned TFA PIT and TFA BARBs borrowing combined for a decrease of $146 million over the same period. In addition, NYW borrowing in FY 2019 is increased by $558 million, while total borrowing over FY 2020 through FY 2022 was reduced by $552 million, resulting in a net increase of $6 million in borrowing over the Plan period. If fully executed, FY 2023 would represent the highest level of borrowing in the City’s history at $13.02 billion across all four financing sources. This reflects the anticipated commitment levels over FY 2019-2023 as discussed in “Capital Commitment Plan” beginning on page 49.
Debt Service
As shown in Table 26, debt service, net of prepayments, in the February Plan totals $6.81 billion in FY 2019, $7.43 billion in FY 2020, $7.74 billion in FY 2021, $8.41 billion in FY 2022, and $9.16 billion in FY 2023.[33] These amounts represent decreases from the November 2018 Financial Plan of $82 million in FY 2019, $10 million in FY 2020, $23 million in FY 2021, and $49 million in FY 2022.[34] Between FY 2019 and FY 2023, total debt service is expected to increase by $2.35 billion, or 34.6 percent. These projections do not include debt service of the NYW, which is backed by water and sewer user fees, and that of the TFA BARBs, which is supported by New York State building aid.
Table 26. February Plan FY 2019 Financial Plan Debt Service Estimates
| ($ in millions) | FY 2019 | FY 2020 | FY 2021 | FY 2022 | FY 2023 | Change FY 2019 –
FY 2023 |
% Change FY 2019 – FY 2023 |
|
| GO | $3,842 | $4,202 | $4,328 | $4,661 | $5,023 | $1,181 | 30.7% | |
| TFAa | 2,772 | 3,015 | 3,203 | 3,549 | 3,915 | 1,143 | 41.2% | |
| Lease-Purchase | 123 | 128 | 127 | 127 | 148 | 25 | 20.3% | |
| TSASC, Inc. | 72 | 82 | 82 | 76 | 76 | 4 | 5.6% | |
| Total | $6,809 | $7,427 | $7,740 | $8,413 | $9,162 | $2,353 | 34.6% | |
Source: February 2018 Financial Plan.
note: Debt service is adjusted for prepayments.
a Amounts do not include TFA BARBs.
The $82 million decrease in FY 2019 is due to GO savings of $69 million, and TFA savings of $13 million. The GO savings stem primarily from a $44 million reduction in estimated variable-rate interest costs, $14 million in lowered letter of credit and remarketing fees, along with lower than expected borrowing costs of $11 million. The decrease in TFA debt service results primarily from lower variable rate interest costs ($29 million) offset by revised assumptions for excess building aid revenues available for the payment of TFA FTS debt service ($16 million).
In FY 2020 the reduction of $10 million is comprised of estimated GO savings of $24 million primarily from lower than expected costs from GO borrowing year-to-date, partially offset by $14 million in additional TFA debt service, largely from $200 million of additional borrowing in the second half of FY 2019.
The estimated $23 million decrease in FY 2021 stems from GO debt service savings of $31 million from the continued impact of lower than expected costs from FY 2019 borrowing to date, partially offset by $8 million increase in TFA debt service from baseline adjustments. Estimated savings in FY 2022 of $49 million follow a similar pattern to that of FY 2021.
Debt Affordability
Debt service as a percent of local tax revenues and as a percent of total-funds revenues are commonly used measures of debt affordability.[35] In FY 2018, the City’s debt service was 10.3 percent of local tax revenues. The February Plan projects debt service will consume 11.1 percent of local tax revenues in FY 2019, 11.7 percent in FY 2020, 11.8 percent in FY 2021, 12.5 percent in FY 2022 and 13.2 percent in FY 2023, as shown in Chart 10.[36] The upward trend in the debt service to tax revenue ratio reflects the disparity between debt service and tax revenue growth rates over the Plan period. Debt service is projected to grow at an average annual rate of 7.8 percent from FY 2019 to FY 2023 while tax revenue during this period is projected to grow 3.2 percent annually. Based on an assumption of 4 percent annual tax revenue growth in FY 2023 through FY 2029, the City projects this ratio to remain fairly constant at 13.3 percent over this period. If annual tax revenue growth were to drop to 1.4 percent, the ratio would exceed the 15 percent threshold that is considered prudent, by 2028.
Chart 10. NYC Debt Service as a Percent of Tax Revenues
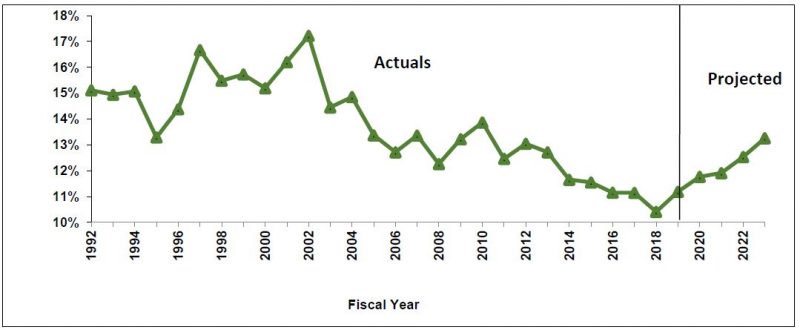
Source: Office of the NYC Comptroller, Comprehensive Annual Financial Reports, FY 1992 – FY 2018, and NYC Office of
Management and Budget, February 2019 Financial Plan.
Debt service is also projected to grow at a faster rate than total revenues (including taxes, non-tax revenues, and Federal, State and other categorical aid) over the plan period. As such, debt service is projected to consume an increasing share of the total budget. As shown in Chart 11, the City’s debt service as a percent of all-funds revenues is estimated to be 7.3 percent in FY 2019, 8.0 percent in FY 2020, 8.1 percent in FY 2021, 8.6 percent in FY 2022, and 9.2 percent in FY 2023. The debt service growth of 7.8 percent over the Financial Plan period mentioned above is significantly higher than the projected total revenue growth of 1.8 percent.
Chart 11. NYC Debt Service as a Percent of Total Revenues
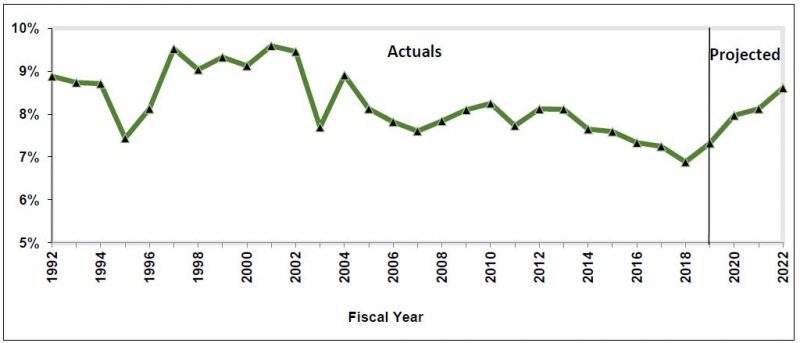
Source: Office of the NYC Comptroller, Comprehensive Annual Financial Reports, FY 1992 – FY 2018, and NYC Office of Management and Budget, February 2019 Financial Plan.
Appendix
Table A1. February 2019 Financial Plan Revenue Detail
| ($ in millions) | FY 2019 | FY 2020 | FY 2021 | FY 2022 | FY 2023 | Change FYs 2019 – 2023 Dollars Percent |
Annual Percent Change | |
| Taxes: | ||||||||
| Real Property | $28,046 | $29,711 | $31,089 | $32,328 | $33,286 | $5,240 | 18.7% | 4.4% |
| Personal Income Tax | $12,445 | $12,993 | $13,309 | $13,734 | $14,209 | $1,764 | 14.2% | 3.4% |
| General Corporation Tax | $3,870 | $3,651 | $3,660 | $3,712 | $3,774 | ($96) | (2.5%) | (0.6%) |
| Banking Corporation Tax | ($71) | $0 | $0 | $0 | $0 | $71 | (100.0%) | (100.0%) |
| Unincorporated Business Tax | $2,155 | $2,330 | $2,427 | $2,458 | $2,525 | $370 | 17.2% | 4.0% |
| Sale and Use Tax | $7,809 | $8,169 | $8,439 | $8,740 | $9,022 | $1,213 | 15.5% | 3.7% |
| Real Property Transfer | $1,528 | $1,441 | $1,460 | $1,496 | $1,541 | $13 | 0.9% | 0.2% |
| Mortgage Recording Tax | $1,097 | $933 | $944 | $964 | $989 | ($108) | (9.8%) | (2.6%) |
| Commercial Rent | $876 | $855 | $878 | $912 | $947 | $71 | 8.1% | 2.0% |
| Utility | $386 | $396 | $410 | $421 | $430 | $44 | 11.4% | 2.7% |
| Hotel | $621 | $636 | $629 | $643 | $651 | $30 | 4.8% | 1.2% |
| Cigarette | $36 | $34 | $33 | $32 | $31 | ($5) | (13.9%) | (3.7%) |
| All Other | $826 | $769 | $769 | $769 | $769 | ($57) | (6.9%) | (1.8%) |
| Tax Audit Revenue | $1,057 | $998 | $721 | $721 | $721 | ($336) | (31.8%) | (9.1%) |
| Total Taxes | $60,681 | $62,916 | $64,768 | $66,930 | $68,895 | $8,214 | 13.5% | 3.2% |
| Miscellaneous Revenue: | ||||||||
| Licenses, Franchises, Etc. | $728 | $755 | $739 | $747 | $751 | $23 | 3.2% | 0.8% |
| Interest Income | $193 | $230 | $256 | $259 | $250 | $57 | 29.5% | 6.7% |
| Charges for Services | $1,025 | $1,009 | $1,008 | $1,008 | $1,007 | ($18) | (1.8%) | (0.4%) |
| Water and Sewer Charges | $1,464 | $1,456 | $1,446 | $1,426 | $1,426 | ($38) | (2.6%) | (0.7%) |
| Rental Income | $259 | $254 | $250 | $250 | $250 | ($9) | (3.5%) | (0.9%) |
| Fines and Forfeitures | $980 | $956 | $933 | $920 | $916 | ($64) | (6.5%) | (1.7%) |
| Miscellaneous | $830 | $345 | $344 | $343 | $343 | ($487) | (58.7%) | (19.8%) |
| Intra-City Revenue | $2,154 | $1,794 | $1,796 | $1,794 | $1,792 | ($362) | (16.8%) | (4.5%) |
| Total Miscellaneous Revenue | $7,633 | $6,799 | $6,772 | $6,747 | $6,735 | ($898) | (11.8%) | (3.1%) |
| Unrestricted Intergovernmental Aid | $151 | $0 | $0 | $0 | $0 | ($151) | 100.0% | 100.0% |
| Reserve for Disallowance of Categorical Grants | $91 | ($15) | ($15) | ($15) | ($15) | ($106) | 100.0% | NA |
| Less: Intra-City Revenue | ($2,154) | ($1,794) | ($1,796) | ($1,794) | ($1,792) | $362 | (16.8%) | (4.5%) |
| TOTAL CITY-FUNDS | $66,402 | $67,906 | $69,729 | $71,868 | $73,823 | $7,421 | 11.2% % | 2.7% |
| Other Categorical Grants | $1,198 | $926 | $868 | $862 | $862 | ($336)) | (28.0%) | (7.9%) |
| Inter-Fund Agreements | $690 | $661 | $662 | $661 | $661 | ($29) | (4.2%) | (1.1%) |
| Federal Categorical Grants: | ||||||||
| Community Development | $973 | $396 | $298 | $280 | $274 | ($699) | (71.8%) | (27.2%) |
| Social Services | $3,855 | $3,491 | $3,498 | $3,498 | $3,498 | ($357) | (9.3%) | (2.4%) |
| Education | $1,848 | $2,080 | $2,082 | $2,044 | $2,044 | $196 | 10.6% | 2.6% |
| Other | $1,795 | $1,360 | $1,327 | $1,311 | $1,304 | ($491) | (27.4%) | (7.7%) |
| Total Federal Grants | $8,471 | $7,327 | $7,205 | $7,133 | $7,120 | ($1,351) | (15.9%) | (4.3%) |
| State Categorical Grants | ||||||||
| Social Services | $1,844 | $1,811 | $1,820 | $1,812 | $1,812 | ($32) | (1.7%) | (0.4%) |
| Education | $11,157 | $11,460 | $11,891 | $12,330 | $12,324 | $1,167 | 10.5% | 2.5% |
| Higher Education | $297 | $297 | $297 | $297 | $297 | $0 | 0.0% | 0.0% |
| Department of Health and Mental Hygiene |
$583 | $558 | $542 | $542 | $542 | ($41) | (7.0%) | (1.8%) |
| Other | $1,377 | $1,264 | $1,287 | $1,324 | $1,378 | $1 | 0.1% | 0.0% |
| Total State Grants | $15,258 | $15,390 | $15,837 | $16,305 | $16,353 | $1,095 | 7.2% | 1.7% |
| TOTAL REVENUES | $92,019 | $92,210 | $94,301 | $96,829 | $98,819 | $6,800 | 7.4% | 1.8% |
Table A2. February 2019 Financial Plan Expenditure Detail
| ($ in millions) | FY 2019 | FY 2020 | FY 2021 | FY 2022 | FY 2023 | Change FYs 2019 – 2023 Dollars Percent |
Annual Percent Change |
|
| Mayoralty | $152 | $150 | $145 | $144 | $141 | ($11) | (7.1%) | (1.8%) |
| Board of Elections | $147 | $98 | $96 | $96 | $96 | ($51) | (34.6%) | (10.1%) |
| Campaign Finance Board | $32 | $14 | $14 | $14 | $14 | ($18) | (55.5%) | (18.3%) |
| Office of the Actuary | $7 | $7 | $7 | $7 | $7 | $0 | 3.0% | 0.7% |
| President, Borough of Manhattan | $5 | $5 | $5 | $5 | $5 | ($0) | (5.8%) | (1.5%) |
| President, Borough of Bronx | $6 | $6 | $6 | $6 | $6 | ($0) | (6.8%) | (1.8%) |
| President, Borough of Brooklyn | $7 | $6 | $6 | $6 | $6 | ($1) | (10.7%) | (2.8%) |
| President, Borough of Queens | $7 | $5 | $5 | $5 | $5 | ($2) | (24.4%) | (6.8%) |
| President, Borough of Staten Island | $5 | $4 | $4 | $4 | $4 | ($0) | (4.2%) | (1.1%) |
| Office of the Comptroller | $110 | $111 | $112 | $112 | $112 | $2 | 1.6% | 0.4% |
| Dept. of Emergency Management | $71 | $31 | $29 | $29 | $29 | ($42) | (58.9%) | (19.9%) |
| Office of Administrative Tax Appeals | $5 | $6 | $6 | $6 | $6 | $0 | 3.2% | 0.8% |
| Law Dept. | $247 | $249 | $249 | $249 | $249 | $3 | 1.0% | 0.3% |
| Dept. of City Planning | $55 | $46 | $45 | $42 | $41 | ($14) | (24.8%) | (6.9%) |
| Dept. of Investigation | $48 | $34 | $35 | $35 | $35 | ($13) | (27.1%) | (7.6%) |
| NY Public Library — Research | $29 | $29 | $29 | $29 | $29 | $0 | 1.6% | 0.4% |
| New York Public Library | $146 | $143 | $144 | $144 | $144 | ($2) | (1.4%) | (0.4%) |
| Brooklyn Public Library | $108 | $107 | $107 | $107 | $107 | ($1) | (1.1%) | (0.3%) |
| Queens Borough Public Library | $112 | $110 | $111 | $111 | $111 | ($2) | (1.4%) | (0.3%) |
| Dept. of Education | $26,466 | $26,884 | $27,793 | $28,707 | $29,066 | $2,599 | 9.8% | 2.4% |
| City University | $1,189 | $1,169 | $1,181 | $1,196 | $1,212 | $23 | 2.0% | 0.5% |
| Civilian Complaint Review Board | $17 | $18 | $18 | $18 | $18 | $1 | 3.1% | 0.8% |
| Police Dept. | $5,531 | $5,312 | $5,270 | $5,256 | $5,256 | ($275) | (5.0%) | (1.3%) |
| Fire Dept. | $2,095 | $2,059 | $2,048 | $2,042 | $2,042 | ($53) | (2.5%) | (0.6%) |
| Dept. of Veterans’ Services | $5 | $5 | $5 | $5 | $5 | ($0) | (2.8%) | (0.7%) |
| Admin. for Children Services | $3,174 | $2,672 | $2,698 | $2,690 | $2,690 | ($484) | (15.2%) | (4.0%) |
| Dept. of Social Services | $10,131 | $10,150 | $10,059 | $10,050 | $10,050 | ($80) | (0.8%) | (0.2%) |
| Dept. of Homeless Services | $2,110 | $2,105 | $2,109 | $2,108 | $2,108 | ($2) | (0.1%) | (0.0%) |
| Dept. of Correction | $1,379 | $1,407 | $1,430 | $1,427 | $1,427 | $48 | 3.5% | 0.9% |
| Board of Correction | $3 | $3 | $3 | $3 | $3 | $0 | 6.7% | 1.6% |
| Citywide Pension Contribution | $9,738 | $9,839 | $10,305 | $10,752 | $10,957 | $1,219 | 12.5% | 3.0% |
| Miscellaneous | $10,511 | $12,232 | $12,967 | $12,800 | $13,721 | $3,210 | 30.5% | 6.9% |
| Debt Service | $3,964 | $4,330 | $4,455 | $4,788 | $5,171 | $1,207 | 30.4% | 6.9% |
| T.F.A. Debt Service | $2,773 | $3,015 | $3,203 | $3,549 | $3,915 | $1,142 | 41.2% | 9.0% |
| FY 2018 BSA and Discretionary Transfers | ($4,576) | $0 | $0 | $0 | $0 | $4,576 | (100.0%) | (100.0%) |
| FY 2019 BSA | $3,169 | ($3,169) | $0 | $0 | $0 | ($3,169) | (100.0%) | (100.0%) |
| Public Advocate | $4 | $4 | $4 | $4 | $4 | $0 | 2.9% | 0.7% |
| City Council | $83 | $56 | $56 | $56 | $56 | ($26) | (31.6%) | (9.1%) |
| City Clerk | $6 | $6 | $6 | $6 | $6 | ($0) | (0.8%) | (0.2%) |
| Dept. for the Aging | $394 | $355 | $357 | $357 | $357 | ($38) | (9.6%) | (2.5%) |
| Dept. of Cultural Affairs | $204 | $152 | $152 | $152 | $152 | ($52) | (25.6%) | (7.1%) |
| Financial Info. Serv. Agency | $114 | $118 | $115 | $115 | $115 | $1 | 0.8% | 0.2% |
| Office of Payroll Admin. | $17 | $17 | $17 | $17 | $17 | $0 | 0.7% | 0.2% |
| Independent Budget Office | $6 | $6 | $6 | $6 | $6 | ($0) | (1.1%) | (0.3%) |
| Equal Employment Practices | $1 | $1 | $1 | $1 | $1 | $0 | 7.6% | 1.9% |
| Civil Service Commission | $1 | $1 | $1 | $1 | $1 | $0 | 0.8% | 0.2% |
| Landmarks Preservation Commission | $7 | $7 | $7 | $7 | $7 | ($0) | 2.1% | 0.5% |
| Taxi & Limousine Commission | $52 | $57 | $59 | $52 | $52 | $0 | 0.8% | 0.2% |
| Commission on Human Rights | $14 | $14 | $14 | $14 | $14 | $0 | 2.1% | 0.5% |
| Youth & Community Development | $731 | $598 | $603 | $605 | $605 | ($126) | (17.2%) | (4.6%) |
| Conflicts of Interest Board | $3 | $3 | $3 | $3 | $3 | $0 | 2.6% | 0.7% |
| Office of Collective Bargaining | $2 | $2 | $2 | $2 | $2 | $0 | 2.6% | 0.7% |
| Community Boards (All) | $21 | $19 | $19 | $19 | $19 | ($2) | (11.3%) | (3.0%) |
| Dept. of Probation | $115 | $110 | $112 | $112 | $112 | ($3) | (3.0%) | (0.8%) |
| Dept. Small Business Services | $309 | $173 | $156 | $135 | $135 | ($174) | (56.4%) | (18.7%) |
| Housing Preservation & Development | $1,257 | $945 | $942 | $958 | $961 | ($297) | (23.6%) | (6.5%) |
| Dept. of Buildings | $204 | $194 | $186 | $186 | $186 | ($18) | (8.7%) | (2.2%) |
| Dept. of Health & Mental Hygiene | $1,760 | $1,692 | $1,694 | $1,695 | $1,695 | ($64) | (3.6%) | (0.9%) |
| NYC Health + Hospitals | $827 | $911 | $948 | $996 | $997 | $170 | 20.6% | 4.8% |
| Office of Administrative Trials & Hearings | $51 | $52 | $53 | $52 | $52 | $1 | 2.1% | 0.5% |
| Dept. of Environmental Protection | $1,457 | $1,316 | $1,295 | $1,274 | $1,273 | ($184) | (12.6%) | (3.3%) |
| Dept. of Sanitation | $1,761 | $1,758 | $1,758 | $1,748 | $1,733 | ($28) | (1.6%) | (0.4%) |
| Business Integrity Commission | $9 | $9 | $9 | $9 | $9 | $0 | 0.5% | 0.1% |
| Dept. of Finance | $306 | $307 | $306 | $306 | $306 | ($0) | (0.1%) | (0.0%) |
| Dept. of Transportation | $1,065 | $1,008 | $1,003 | $1,004 | $1,004 | ($61) | (5.8%) | (1.5%) |
| Dept. of Parks and Recreation | $520 | $481 | $477 | $477 | $477 | ($43) | (8.3%) | (2.2%) |
| Dept. of Design & Construction | $278 | $182 | $159 | $159 | $158 | ($120) | (43.1%) | (13.1%) |
| Dept. of Citywide Admin. Services | $487 | $446 | $447 | $446 | $446 | ($41) | (8.4%) | (2.2%) |
| D.O.I.T.T. | $584 | $538 | $571 | $569 | $569 | ($16) | (2.7%) | (0.7%) |
| Dept. of Record & Info. Services | $10 | $11 | $11 | $11 | $11 | $1 | 5.4% | 1.3% |
| Dept. of Consumer Affairs | $42 | $41 | $42 | $42 | $42 | $0 | 0.6% | 0.2% |
| District Attorney – N.Y. | $128 | $111 | $112 | $112 | $112 | ($16) | (12.5%) | (3.3%) |
| District Attorney – Bronx | $82 | $83 | $84 | $84 | $84 | $2 | 1.9% | 0.5% |
| District Attorney – Kings | $112 | $110 | $111 | $111 | $111 | ($1) | (0.9%) | (0.2%) |
| District Attorney –Queens | $72 | $69 | $70 | $70 | $70 | ($2) | (3.4%) | (0.9%) |
| District Attorney – Richmond | $17 | $16 | $16 | $16 | $16 | ($1) | (4.4%) | (1.1%) |
| Office of Prosec. & Special Narc. | $24 | $24 | $24 | $24 | $24 | $1 | 2.9% | 0.7% |
| Public Administrator – N.Y. | $3 | $3 | $3 | $3 | $3 | $0 | 0.9% | 0.2% |
| Public Administrator – Bronx | $1 | $1 | $1 | $1 | $1 | $0 | 2.4% | 0.6% |
| Public Administrator – Brooklyn | $1 | $1 | $1 | $1 | $1 | $0 | 3.4% | 0.8% |
| Public Administrator – Queens | $1 | $1 | $1 | $1 | $1 | $0 | 4.7% | 1.1% |
| Public Administrator – Richmond | $1 | $1 | $1 | $1 | $1 | $0 | 2.9% | 0.7% |
| Prior Payable Adjustment | ($400) | $0 | $0 | $0 | $0 | $400 | (100.0%) | (100.0%) |
| General Reserve | $300 | $1,000 | $1,000 | $1,000 | $1,000 | $700 | 233.3% | 35.1% |
| Citywide Savings Initiatives | ($1) | ($48) | ($71) | ($82) | ($83) | ($83) | 16,339.6% | 258.1% |
| Energy Adjustment | $0 | $17 | $46 | $67 | $89 | $89 | NA | NA |
| Lease Adjustment | $0 | $36 | $72 | $110 | $149 | $149 | NA | NA |
| OTPS Inflation Adjustment | $0 | $0 | $56 | $111 | $167 | $167 | NA | NA |
| TOTAL EXPENDITURES | $92,019 | $92,210 | $97,818 | $99,768 | $102,115 | $10,096 | 11.0% | 2.6% |
Endnotes
[1]Congressional Budget Office, “An Overview of the Fiscal and Budget Outlook 2019-2029,” January 31, 2019. https://www.cbo.gov/publication/54947?utm_source=feedblitz&utm_medium=FeedBlitzEmail&utm_content=812526&utm_campaign=0
[2] World Bank Group, World Integrated Trade Solution website, accessed Feb. 26, 2019. https://wits.worldbank.org/CountryProfile/en/Country/USA/Year/2017/TradeFlow/EXPIMP
[3] International Monetary Fund, World Economic Outlook Update, January 2019. https://www.imf.org/en/Publications/WEO/Issues/2019/01/11/weo-update-january-2019
[4] Austen Hufford and Theo Francis, “How Bad Is the China Slowdown? U.S. Companies offer Some Answers.” Wall Street Journal, Feb. 11, 2019. https://www.wsj.com/articles/how-bad-is-the-china-slowdown-u-s-companies-offer-some-answers-11549908754?mod=hp_lead_pos5
[5] Low-wage jobs pay less than $62,000 annually, medium-wage jobs pay $62,000 to $124,000 annually, and high-wage jobs pay more than $124,000 annually. In general, the average salary of a private-sector employee in a low-wage sector was $42,000 annually, in a medium-wage sector was $77,000 annually, and in a high-wage sector was about $216,000 as of 2017.
[7] https://business.nycgo.com/press-and-media/press-releases/articles/post/new-global-partnership-between-nyc-company-and-mastercard/
[8] The City and the Municipal Labor Committee reached a health saving agreement covering FY 2019 to FY 2020 to generate savings of $200 million in FY 2019, $300 million in FY 2020, and $600 million in FY 2021 and beyond. The agreement includes two $100 per member lump sum payments effective July 1, 2018 and July 1, 2019, funded by the joint Stabilization Health Fund.
[9] Statistics for the residential market are from the Real Deal 2019 Databook.
[10] The latest announcement came from Brookfield properties which plans to proceed on developing a 2.0 million square foot property in Hudson Yards without having secured a tenant. https://www.bisnow.com/new-york/news/construction-development/brookfield-will-build-2-manhattan-west-on-spec-97212
[11] All numbers in the following sections exclude audit revenues, which are covered separately in a later section of this report.
[12] Even though the report “General Explanation of Public Law 115-97” published by the Joint Committee on Taxation warned taxpayers against doing so it is not clear how the IRS would pursue this.
[13] Filers who pay estimated taxes typically incur significant penalties in April when quarterly payments fall below certain thresholds established by safe harbor provisions.
[14]For instance, on February 8th, 2019, the New York State tax department released a memo providing additional guidance on the treatment of repatriation and global Intangible low-taxed income for individuals and fiduciaries. https://www.tax.ny.gov/pdf/2019/inc/m19-1I.pdf
[15] https://www.cbo.gov/publication/54918
[16] Neither the City nor the State could provide data on how this provision affected tax year 2017 returns, so we are unable to quantify this effect.
[17]Anecdotal reports of an uptick in housing sales to wealthy New Yorkers in tax friendly states like Florida would lend support to this theory. https://therealdeal.com/2019/01/11/florida-resi-brokers-developers-chase-new-york-buyers-affected-by-new-tax-law/
[18] Unlike individuals, the limitation on SALT deductibility imposed under the TCJA was not applied to corporations.
[19] Miscellaneous revenue analysis excludes private (other categorical) grants and intra-City revenues.
[20] Net of transfer of $110 million in Federal and State grants between the Administration for Children’s Services and the DOE due to delayed implementation of the EarlyLearn program.
[21] In the 140 school speed zones, the City operates 40 mobile cameras and 200 cameras in fixed locations. https://www1.nyc.gov/html/dot/downloads/pdf/speed-camera-report-june2018.pdf
[22] DOT reported that the typical school speed zone camera installed in 2014 and 2015 issued an average of 35 violations per day in the camera’s 18th month, https://www1.nyc.gov/html/dot/downloads/pdf/speed-camera-report-june2018.pdf. Based on 35 violations per day, a $50 fine per violation, and 180 school days per year, it is anticipated that each new zone would generate $315,000 per year.
[23] https://www1.nyc.gov/html/dot/downloads/pdf/speed-camera-report-june2018.pdf
[24] https://www1.nyc.gov/html/brt/html/routes/routes.shtml
[25] https://www1.nyc.gov/html/dot/html/pr2018/pr18-008.shtml
[26] https://www1.nyc.gov/html/brt/downloads/pdf/bus-forward.pdf.
[27] http://web.mta.info/news/pdf/MTA-2019-Prelim-Budget-July-Financial-Plan-2019-2022-Vol2.pdf
[28] The senior care rate is the premium the City pays to supplement shortfalls in Medicare benefits so that Medicare eligible retirees can maintain a similar level of benefits as active employees.
[29] NYC Open Data publishes shelter census data dating to August 21, 2013. Our measurement extends from February 13, 2014 to February 13, 2019.
[30] The Commitment Plan is a schedule of anticipated capital contract registrations. Changes from the FY 2019 Adopted Capital Plan published in October 2018 are from FYs 2019-2022 only. Estimates for FY 2023 were not included at that time.
[31] This percentage assumes all DOT project types, not just bridges and highways.
[32] The November 2018 Plan is a four-year Plan covering FY 2019 – FY 2022.
[33] Includes GO, conduit debt, TFA PIT bonds, and TSASC.
[34] The November Plan did not include FY 2023.
[35] Debt service in this discussion is adjusted to exclude prepayments.
[36] TSASC debt service is not included in this discussion as it is supported by dedicated tobacco settlement revenues.