Comments on New York City’s Preliminary Budget for Fiscal Year 2021 and Financial Plan for Fiscal Years 2020 – 2024
I. Executive Summary
The ongoing U.S. economic expansion surpassed the ten-year mark in 2019, with GDP growing by 2.3 percent. The Comptroller’s Office expects the economy to continue growing over the Plan period but at a slower rate, consistent with the mature stage of the current expansion. The risk of a recession is minimal, mitigated by a healthy consumer sector, low oil prices and accommodative monetary policy by the Federal Reserve. With trade tension between the U.S. and China abating, the largest immediate risk to the outlook is the potential of the COVID-19 outbreak turning into a pandemic and its subsequent impact on the global economy.
However, the largest immediate threat to the City’s budget is the potential of significant cuts in State funding and cost shifts from the State to the City, as proposed in the State Executive Budget. The City estimates that in total, the proposals in the State Executive Budget would have a negative impact of more than $1.3 billion on the City over FY 2020 and FY 2021.
The FY 2021 Preliminary Budget released on January 16, before the release of the State Executive Budget, does not reflect the impact of the State Executive Budget. The Preliminary Budget is balanced at $95.3 billion, and closes a $3.02 billion gap projected in November. Revenues in the Preliminary Budget are $705 million higher than projected in the November Plan, driven by a net upward revision of $658 million in tax revenues.
Expenditures are $2.3 billion lower, driven by an increase of $2.17 billion in planned prepayment of FY 2021 debt service. Net of this reduction in debt service from the additional prepayment, City-funds expenditures are $183 million less than estimated in November. This expenditure decrease stems primarily from spending reductions of $253 million from a new round of Citywide Savings Program (CSP), and $173 million from a modification in the methodology for funding guaranteed interest earnings in the tax deferred annuity (TDA) funds of the Teachers Retirement System and the Board of Education Retirement System. These reductions are partially offset by a $162 million increase in City-funds agency spending and smaller adjustments to collective bargaining costs and miscellaneous spending.
The Comptroller’s Office’s analysis of the January Plan has identified net additional resources in each year of the Financial Plan ranging from a low of $29 million in FY 2021 to a high of $707 million in FY 2024. The additional resources in FY 2020 are driven by both the Comptroller’s Office’s tax revenue forecast, which is higher than the City’s projection by $281 million, and the Comptroller’s Office’s assumption that the $300 million in the General Reserve will be available for budget relief in the current fiscal year. In the outyears, the additional resources identified by the Comptroller’s Office stem primarily from higher tax revenue forecasts in each year of the Plan, beginning at $520 million in FY 2021 and growing to $1.83 billion by FY 2024.
Net risks to the City’s expenditure estimates, beginning at $526 million in FY 2021 and growing to $1.17 billion in FY 2024 offset some of the gains from the higher revenue forecast in the outyears. These risks stem primarily from assumptions of overtime spending and shortfalls in funding for charter school tuition, Carter cases, pupil transportation, homeless shelters, and the Fair Fares initiative. Projected underspending for public assistance (PA) due to declining caseloads, pre-K special education savings and lower than projected variable rate demand bond (VRDB) interest provide some offsets against these risks.
Overall, the Comptroller’s Office’s analysis of the Plan indicates that the City could end FY 2020 and FY 2021 with budget surpluses of $459 million and $29 million, respectively. In the outyears, the Comptroller’s Office analysis shows smaller gaps of $2.00 billion, $2.22 billion and $1.95 billion in FY 2022 through FY 2024, respectively.
Table 1. FY 2020 – FY 2024 Financial Plan
| ($ in millions) | FY 2020 | FY 2021 | FY 2022 | FY 2023 | FY 2024 | Change FYs 2020 –2024 |
|
|---|---|---|---|---|---|---|---|
| Dollar | Percent | ||||||
| Revenues | |||||||
| Taxes: | |||||||
| General Property Tax | $29,835 | $31,182 | $32,436 | $33,414 | $34,119 | $4,284 | 14.4% |
| Other Taxes | 33,518 | 33,511 | 34,458 | 35,475 | 36,475 | 2,957 | 8.8% |
| Tax Audit Revenues | 999 | 921 | 721 | 721 | 721 | (278) | (27.8%) |
| Subtotal: Taxes | $64,352 | $65,614 | $67,615 | $69,610 | $71,315 | $6,963 | 10.8% |
| Miscellaneous Revenues | 7,547 | 7,086 | 7,079 | 7,096 | 7,097 | (450) | (6.0%) |
| Unrestricted Intergovernmental Aid | 111 | 0 | 0 | 0 | 0 | (111) | (100.0%) |
| Less: Intra-City Revenues | (2,126) | (1,852) | (1,844) | (1,842) | (1,842) | 284 | (13.4%) |
| Disallowances Against Categorical Grants | (15) | (15) | (15) | (15) | (15) | 0 | 0.0% |
| Subtotal: City-Funds | $69,869 | $70,833 | $72,835 | $74,849 | $76,555 | $6,686 | 9.6% |
| Other Categorical Grants | 1,006 | 874 | 864 | 863 | 861 | (145) | (14.4%) |
| Inter-Fund Revenues | 719 | 676 | 676 | 676 | 676 | (43) | (6.0%) |
| Federal Categorical Grants | 8,158 | 7,113 | 7,010 | 6,976 | 6,971 | (1,187) | (14.6%) |
| State Categorical Grants | 15,674 | 15,803 | 16,263 | 16,720 | 16,769 | 1,095 | 7.0% |
| Total Revenues | $95,426 | $95,299 | $97,648 | $100,084 | $101,832 | $6,406 | 6.7% |
| Expenditures | |||||||
| Personal Service | |||||||
| Salaries and Wages | $30,112 | $30,943 | $30,821 | $31,728 | $32,291 | $2,179 | 7.2% |
| Pensions | 9,832 | 9,939 | 10,422 | 10,458 | 10,112 | 280 | 2.8% |
| Fringe Benefits | 11,362 | 11,802 | 12,607 | 13,416 | 14,227 | 2,865 | 25.2% |
| Subtotal-PS | $51,306 | $52,684 | $53,850 | $55,602 | $56,630 | $5,324 | 10.4% |
| Other Than Personal Service | |||||||
| Medical Assistance | $5,915 | $5,915 | $5,915 | $5,915 | $5,915 | $0 | 0.0% |
| Public Assistance | 1,641 | 1,651 | 1,651 | 1,650 | 1,650 | 9 | 0.5% |
| All Other | 32,904 | 30,874 | 31,101 | 31,289 | 31,522 | (1,382) | (4.2%) |
| Subtotal-OTPS | $40,460 | $38,440 | $38,667 | $38,854 | $39,087 | ($1,373) | (3.4%) |
| Debt Service | |||||||
| Principal | $3,613 | $3,756 | $3,970 | $4,085 | $4,077 | $464 | 12.8% |
| Interest & Offsets | 3,371 | 3,745 | 4,188 | 4,821 | 5,289 | 1,919 | 56.9% |
| Subtotal Debt Service | $6,984 | $7,500 | $8,158 | $8,906 | $9,366 | $2,382 | 34.1% |
| FY 2019 BSA and Discretionary Transfers | ($4,221) | $0 | $0 | $0 | $0 | $4,221 | (100.0%) |
| FY 2020 BSA | $2,723 | ($2,723) | $0 | $0 | $0 | ($2,723) | (100.0%) |
| Capital Stabilization Reserve | $0 | $250 | $250 | $250 | $250 | $250 | NA |
| General Reserve | $300 | $1,000 | $1,000 | $1,000 | $1,000 | $700 | 233.3% |
| Less: Intra-City Expenses | ($2,126) | ($1,852) | ($1,844) | ($1,842) | ($1,842) | $284 | (13.4%) |
| Total Expenditures | $95,426 | $95,299 | $100,081 | $102,770 | $104,491 | $9,065 | 9.5% |
| Gap To Be Closed | $0 | $0 | ($2,433) | ($2,686) | ($2,659) | ($2,659) | NA |
Note: Numbers may not add to totals due to rounding.
Table 2. Plan-to-Plan Changes
January 2020 Plan vs. November 2019 Plan
| ($ in millions) | FY 2020 | FY 2021 | FY 2022 | FY 2023 |
|---|---|---|---|---|
| Revenues | ||||
| Taxes: | ||||
| General Property Tax | $50 | $93 | $108 | $128 |
| Other Taxes | 399 | 300 | 278 | 362 |
| Tax Audit Revenues | 0 | 200 | 0 | 0 |
| Subtotal: Taxes | $449 | $593 | $386 | $490 |
| Miscellaneous Revenues | 149 | 66 | 55 | 54 |
| Unrestricted Intergovernmental Aid | 111 | 0 | 0 | 0 |
| Less: Intra-City Revenues | (31) | (1) | (1) | (1) |
| Disallowances Against Categorical Grants | 0 | 0 | 0 | 0 |
| Subtotal: City-Funds | $678 | $658 | $440 | $543 |
| Other Categorical Grants | 21 | 0 | 0 | 0 |
| Inter-Fund Revenues | 2 | 2 | 3 | 3 |
| Federal Categorical Grants | 145 | 32 | 16 | 14 |
| State Categorical Grants | 186 | 13 | 12 | 13 |
| Total Revenues | $1,032 | $705 | $471 | $573 |
| Expenditures | ||||
| Personal Service | ||||
| Salaries and Wages | $41 | $72 | $91 | $117 |
| Pensions | (134) | (174) | (116) | (117) |
| Fringe Benefits | (54) | (72) | 60 | 167 |
| Subtotal-PS | ($146) | ($174) | $35 | $167 |
| Other Than Personal Service | ||||
| Medical Assistance | $0 | $0 | $0 | $0 |
| Public Assistance | (10) | 0 | 0 | 0 |
| All Other | 279 | 50 | (66) | (68) |
| Subtotal-OTPS | $269 | $50 | ($66) | ($68) |
| Debt Service | ||||
| Principal | $0 | ($3) | $21 | $22 |
| Interest & Offsets | (133) | (8) | (36) | (58) |
| Subtotal Debt Service | ($133) | ($12) | ($15) | ($36) |
| FY 2019 BSA and Discretionary Transfers | $0 | $0 | $0 | $0 |
| FY 2020 BSA | $2,173 | ($2,173) | $0 | $0 |
| Capital Stabilization Reserve | ($250) | $0 | $0 | $0 |
| General Reserve | ($850) | $0 | $0 | $0 |
| Less: Intra-City Expenses | ($31) | ($1) | ($1) | ($1) |
| Total Expenditures | $1,032 | ($2,310) | ($47) | $62 |
| Gap To Be Closed | $0 | $3,015 | $518 | $511 |
Note: Numbers may not add to totals due to rounding.
Table 3. Plan-to-Plan Changes
January 2020 Plan vs. June 2019 Plan
| ($ in millions) | FY 2020 | FY 2021 | FY 2022 | FY 2023 |
|---|---|---|---|---|
| Revenues | ||||
| Taxes: | ||||
| General Property Tax | $50 | $93 | $108 | $128 |
| Other Taxes | 881 | 300 | 278 | 362 |
| Tax Audit Revenues | 0 | 200 | 0 | 0 |
| Subtotal: Taxes | $931 | $593 | $386 | $490 |
| Miscellaneous Revenues | 590 | 177 | 197 | 220 |
| Unrestricted Intergovernmental Aid | 111 | 0 | 0 | 0 |
| Less: Intra-City Revenues | (306) | (35) | (29) | (28) |
| Disallowances Against Categorical Grants | 0 | 0 | 0 | 0 |
| Subtotal: City-Funds | $1,326 | $735 | $554 | $682 |
| Other Categorical Grants | 78 | 4 | 1 | 0 |
| Inter-Fund Revenues | (16) | 4 | 4 | 4 |
| Federal Categorical Grants | 930 | 42 | 12 | 9 |
| State Categorical Grants | 336 | 93 | 85 | 37 |
| Total Revenues | $2,654 | $878 | $656 | $732 |
| Expenditures | ||||
| Personal Service | ||||
| Salaries and Wages | $71 | $8 | $34 | $54 |
| Pensions | (132) | (191) | (154) | (174) |
| Fringe Benefits | 20 | (52) | 80 | 188 |
| Subtotal-PS | ($40) | ($235) | ($40) | $68 |
| Other Than Personal Service | ||||
| Medical Assistance | $0 | $0 | $0 | $0 |
| Public Assistance | (10) | 0 | 0 | 0 |
| All Other | 1,632 | 398 | 314 | 269 |
| Subtotal-OTPS | $1,622 | $398 | $314 | $269 |
| Debt Service | ||||
| Principal | $0 | $30 | $111 | $118 |
| Interest & Offsets | (245) | (77) | (146) | (150) |
| Subtotal Debt Service | ($245) | ($48) | ($35) | ($32) |
| FY 2019 BSA and Discretionary Transfers | $0 | $0 | $0 | $0 |
| FY 2020 BSA | $2,723 | ($2,723) | $0 | $0 |
| Capital Stabilization Reserve | ($250) | $0 | $0 | $0 |
| General Reserve | ($850) | $0 | $0 | $0 |
| Less: Intra-City Expenses | ($306) | ($35) | ($29) | ($28) |
| Total Expenditures | $2,654 | ($2,643) | $210 | $277 |
| Gap To Be Closed | $0 | $3,521 | $446 | $455 |
Note: Numbers may not add to totals due to rounding.
Table 4. Risks and Offsets to the January 2020 Financial Plan
($ in millions, positive numbers decrease the gap and negative numbers increase the gap)
| FY 2020 | FY 2021 | FY 2022 | FY 2023 | FY 2024 | |
|---|---|---|---|---|---|
| City Stated Gap | $0 | $0 | ($2,433) | ($2,686) | ($2,659) |
| Tax Revenues | |||||
| Property Tax | $150 | $232 | $784 | $1,346 | $2,028 |
| Personal Income Tax | 148 | 146 | 60 | (78) | (215) |
| Business Taxes | (54) | (118) | (73) | (25) | (1) |
| Sales Tax | (24) | 17 | (22) | (69) | (144) |
| Real Estate Transaction Taxes | 61 | 243 | 284 | 121 | 10 |
| Audit | 0 | 0 | 154 | 154 | 154 |
| Subtotal Tax Revenues | $281 | $520 | $1,187 | $1,449 | $1,832 |
| Fines | 16 | 35 | 48 | 48 | 48 |
| Total Revenues | $297 | $555 | $1,235 | $1,497 | $1,880 |
| Expenditures | |||||
| Overtime | ($258) | ($262) | ($150) | ($150) | ($150) |
| Charter School Tuition | 0 | (150) | (334) | (562) | (709) |
| Carter Cases | 0 | (125) | (125) | (125) | (125) |
| Pupil Transportation | (50) | (75) | (75) | (75) | (75) |
| Homeless Shelters | 0 | (49) | (49) | (49) | (49) |
| Fair Fares | 50 | 0 | (200) | (200) | (200) |
| DOE Medicaid Reimbursement | (20) | (20) | (20) | (20) | (20) |
| Pre-K Special Education | 50 | 50 | 50 | 50 | 50 |
| Public Assistance | 30 | 30 | 30 | 30 | 30 |
| VRDB Interest Savings | 60 | 75 | 75 | 75 | 75 |
| General Reserve | 300 | 0 | 0 | 0 | 0 |
| Subtotal | $162 | ($526) | ($798) | ($1,026) | ($1,173) |
| Total (Risks)/Offsets | $459 | $29 | $437 | $471 | $707 |
| Restated (Gap)/Surplus | $459 | $29 | ($1,996) | ($2,215) | ($1,952) |
Note: Numbers may not add to totals due to rounding.
II. The City’s Economic Outlook
The Economy in 2019
The U.S. economy continues to chug along in defiance of popular wisdom that a recession is inevitable after more than a decade of uninterrupted growth. Despite record low unemployment, the labor force continues to attract workers who had been out of the workforce, enabling continued growth in employment. Wages are rising, yet inflation is well below the Federal Reserve’s two percent target. Consumer and government spending are keeping the economy growing. As a result, there is little expectation that the Fed will increase interest rates in 2020.
Inextricably linked to U.S. economic growth, the City’s economy also continued to grow in 2019. With a business climate more focused on the service sector and less on manufacturing, the City outperformed the U.S. on a number of measures, including employment growth and growth in average hourly earnings. While growth rates will temper, the Comptroller’s Office is not expecting a downturn in the city during the Financial Plan period.
With the risk of a return of trade tensions abating, the impact of the COVID-19 virus outbreak on China, and the knock-on effects on other major U.S. trading partners poses the largest immediate risk to the outlook.
U.S. Economic Outlook
The U.S. economic expansion surpassed the ten-year mark in 2019, making it the longest U.S. expansion on record. Real gross domestic product (GDP) grew 2.3 percent in 2019, according to preliminary estimates released by the U.S. Bureau of Economic Analysis, equal to average GDP growth thus far since the end of the Great Recession. Consumer spending grew 2.6 percent in 2019, a bit slower than the 3.0 percent in 2018. Growth in private investment (structures, plant equipment, intellectual property, and inventories) slowed to 1.8 percent. The largest contributor to investment growth was a 2.1 percent rise in nonresidential fixed investment, which includes business structures, equipment, and intellectual property. Although business structures declined 4.4 percent, a healthy 7.7 percent increase in intellectual property more than offset the decline.
The nation’s labor market performed well in 2019, with U.S. businesses adding over 2.0 million jobs (a gain of 1.4 percent), marking the ninth consecutive year of job growth. The unemployment rate fell to 3.7 percent on a seasonally adjusted basis during 2019, the lowest rate since 1969. The tight labor market led to a record rise in earnings. Average hourly earnings of U.S. private employees rose 3.3 percent — slightly higher than the previous high of 3.1 percent dating back to 2008. Despite healthy wage increases, the core inflation rate (personal consumption expenditures excluding the food and energy sectors) rose only 1.6 percent, well below the Federal Reserve’s target rate of 2 percent.
The Comptroller believes economic growth will slow in 2020 and will continue growing in the outyears at slower rates consistent with the current mature stage of the expansion. The reasons for expecting continued growth are a healthy consumer sector, low oil prices, and accommodative monetary policy by the Federal Reserve. Consumer spending — fueled by a strong labor market and wage gains, healthy household balance sheets, and low oil prices — should help the economy remain strong in 2020. Monthly payroll jobs grew by 175,000 on average in 2019. While somewhat lower than the 193,000 average monthly job gain in 2018, payroll jobs nonetheless grew by 225,000 in January 2020.
Consumer financials are strong. The household financial obligations ratio (which measures a household’s total financial obligations as a percentage of disposable personal income), debt service ratio (DSR, which measures the amount of payments on outstanding debt by households as a percentage of disposable personal income), and the mortgage component of the DSR are all at historical record lows.[1] This indicates that households can increase their borrowing to finance current consumption from future earnings more easily than in 2008, for example, when these ratios were at or near record highs. Chart 1 shows household financial obligation and debt service ratios, and the mortgage component of the DSR. Consumer net worth is at its historical high of $113.8 trillion and household’s owner’s equity in real estate is at a healthy 64 percent, as shown in Chart 2.
Chart 1. Household Debt Service Obligations, 1980Q1 to 2019Q3

Source: Federal Reserve Board of Governors
Chart 2. Household and Nonprofit Organizations Net Worth, & Owner’s Equity as a Percentage of Household Real Estate 1980Q1 to 2019Q3
($ in trillions)
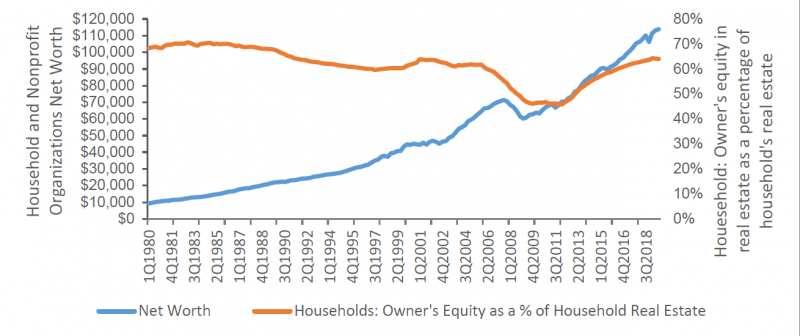
Source: Federal Reserve Board of Governors
Risk of a recession over the planning horizon appears to be negligible as the major risks – including trade tensions with China; stable and accommodative monetary policy; and other global uncertainties including Brexit — have abated. The major immediate risk is the impact of the 2019nCoV virus on consumption and production in China and globally. A secondary risk is that business growth is constrained by an inability to staff open positions with qualified workers. For the past two years there have been more open, unfilled positions in the nation than unemployed workers, as illustrated by Chart 3.
Chart 3. Annual U.S. Job Openings vs Unemployed Workers 2001 – 2019
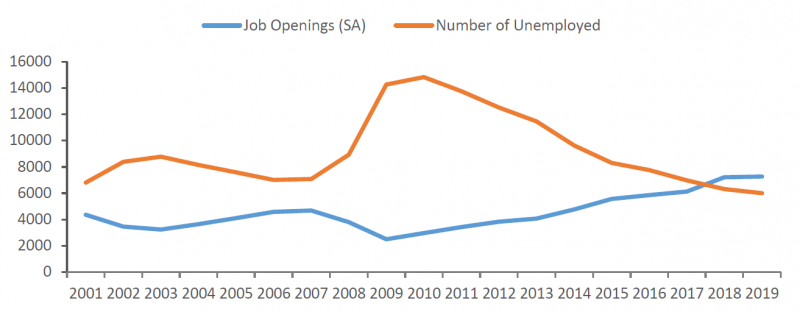
Note: Annual job openings do not include December 2019, hence seasonally adjusted data.
Source: The U.S. Bureau of Labor Statistics
New York City’s Economic Condition and Outlook
The New York City economy grew 2.0 percent in 2019, according to our preliminary estimates, slightly lower than the nation’s 2.3 percent growth. The Comptroller expects the City’s economic growth to continue throughout the forecast period without a recession. However, the pace of that growth is expected to slow, consistent with the late stage of the business cycle. It is our expectation that the City will experience slightly faster growth than the nation in 2020 through 2022 and lower growth rate in the outyears.
Chart 4. Change in Real GDP and GCP, 2001 to 2019
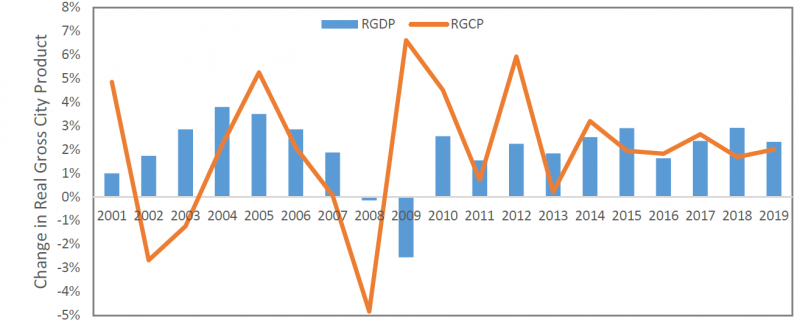
Source: Bureau of Economic Analysis and NYC Comptroller’s Office
Private-sector jobs grew 2.0 percent, or 80,100 jobs, in the City in 2019, above the 1.5 percent growth in the U.S. as a whole. This is the City’s tenth consecutive year of job creation, making it the longest sequence of job gains on record. Since the City’s recovery from the recession began in 2010, private-sector jobs have increased by nearly 900,000, or 28.6 percent, to a record high of 4.04 million workers. Private sector job growth reached a peak of 130,100 jobs in 2014 and has tapered off since then (Chart 5). But growth of more than 80,000 jobs per year is still robust and is above the historical average of about 37,100 per year.
The City’s unemployment rate remains at a record low of 4.1 percent in 2019. The labor force declined by 30,454 and stood at 4.1 million. The labor force participation rate experienced a marginal drop to 60.6 percent in 2019 after reaching 60.8 percent in 2018. Similarly, the number of city residents employed decreased by 28,515 to settle at about 3.9 million, and the employment-to-population ratio marginally dropped to 58.1 percent in 2019, after reaching a record high of 58.3 percent in 2018.
Chart 5. Change in NYC Private Sector Jobs: Three Cycles
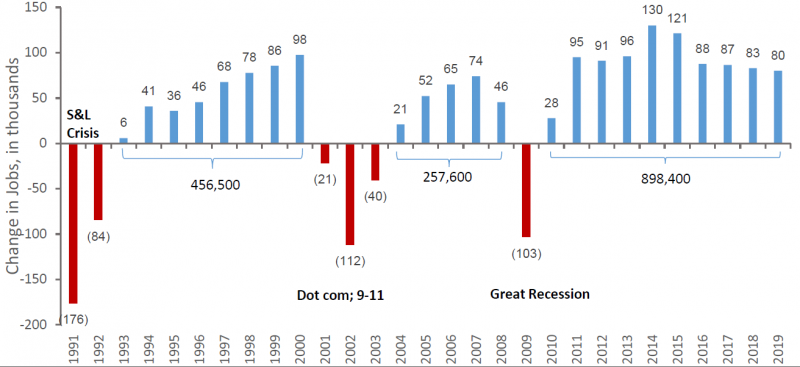
Source: NYS Department of Labor and the Bureau of Labor Statistics
The tightening labor market and an increase in the City’s minimum wage to $15.00 per hour is likely behind an increase in the City’s average hourly earnings. Average hourly earnings of all employees in the private sector rose 4.1 percent in 2019, higher than the 3.1 percent increase in 2018, and well above the 2.5 percent average growth since 2007. The NY Metro area inflation rate, as measured by the change in consumer price index, was 1.7 percent in 2019 and 1.9 percent in 2018, indicating that New Yorkers are seeing real gains in the purchasing power of their earnings.
The income distribution of jobs by sector remained fairly constant from 2018 to 2019 based on the latest data from the NYS Department of Labor. Thirty-seven percent of the City workforce are in sectors in the lowest tier by average income; 25 percent are in the middle tier; and 38 percent are in the highest income tier.[2]
New jobs created were heavily skewed towards the lower income tier with 46.4 percent of new jobs, followed by the highest tier with 29.4 percent of new positions, and the middle tier with 24.3 percent (Chart 6). Job growth in 2019 was strongest among lower-wage sectors, at 3.3 percent. Wages in both low- and medium-tier sectors grew robustly at 4.8 percent 4.7 percent, respectively.
Chart 6. Change and Composition of NYC Employment By Income Category
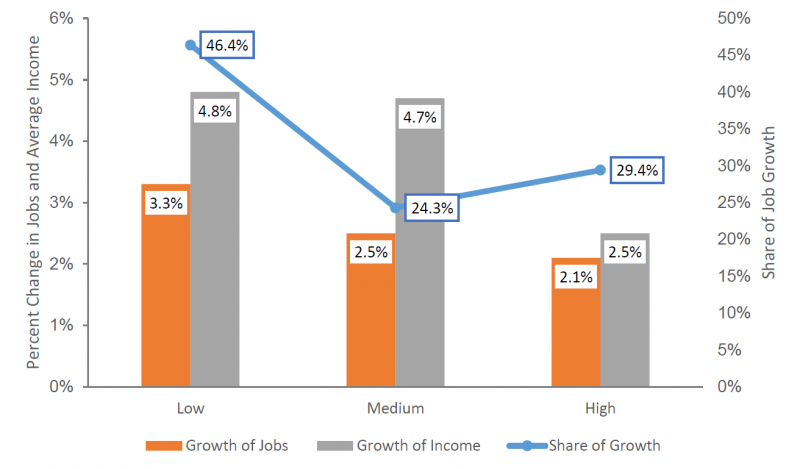
Source: NYS Department of Labor and NYC Comptroller’s Office. See footnote 2 for definitions of income categories.
Wall Street profits, as measured by the pre-tax net income of the NYSE member firms, rose 9.7 percent to $22.6 billion in the first three quarters of 2019, the highest since $49.7 billion generated in the first three quarters of 2009. Wall Street bonuses, a major contributor to City revenues through the income tax and a proxy for firms’ profitability, are expected to be strong next year.
According to PwC/CB Money Tree, venture capital investment in the New York metro area rose to a record high of $17.21 billion in 2019, growing 19.2 percent over 2018, while the nation as a whole experienced an 8.9 percent decline.
Total new commercial leasing activity in Manhattan dropped 3.5 percent to 34.7 million square feet (msf) in 2019, according to Cushman and Wakefield (C&W), after reaching a record 35.9 million square feet (msf) in 2018. Based on C&W’s data, Manhattan’s newly constructed office space entering the market is expected to be robust in 2020 but it will certainly not reach 2018 levels.
Douglas Elliman reports the number of residential units sold fell in Manhattan, Brooklyn, and Queens in 2019 for the second straight year. The average sales price fell in Manhattan and Brooklyn, but increased in Queens. Reasons for the slowdown may include limits on the deductibility of state and local taxes on the Federal income tax as well as possible overbuilding in certain segments of the market and slowing population growth.
The latest leading economic indicators for the City point to a mixed picture. An assessment of business conditions among firms in the New York City area is provided by ISM-New York, Inc. The most recent report shows that current business conditions index (which measure the current state of the economy from the perspective of business procurement professionals) was 45.7 in Q4 2019, lower than the 50 percent threshold that indicates the expectation of continued expansion. However, the ISM six-month outlook (which measures where procurement professionals expect the economy to be in six months) was 60.2 in Q4 2019, about the same as the 59.9 in Q3 2019 and above the 50 threshold.
Initial unemployment claims, which show the number of applicants for unemployment insurance, declined in the City for the ninth consecutive year. According to the NYS Department of Labor, average initial unemployment claims fell 2.0 percent to 27,558 (the lowest on record) in 2019 from 28,112 in 2018. However this statistic bears watching as Q4 2019 initial claims increased 5.2 percent over Q4 2018.
Finally, according to NYC & Company, the number of visitors to the city is expected to have increased to a record 67.1 million in 2019, the tenth straight annual increase. The COVID-19 virus outbreak is expected to significantly reduce Chinese tourism during 2020, which, although representing just 2 percent of total visitors, could modestly slow the expected growth in the number of visitors in 2020.
Table 5 provides summary projections for seven NYC and U.S. economic indicators from 2020 to 2024, comparing NYC OMB January forecast with the Comptroller’s Office forecast.
Table 5. Selected Economic Indicators, Annual Averages, Comptroller and Mayor’s forecast, 2020 to 2024
| 2020 | 2021 | 2022 | 2023 | 2024 | ||
|---|---|---|---|---|---|---|
| Selected US Economic Indicators (Annual Averages) | ||||||
| Real GDP (2012 $, % Change) | Comptroller
Mayor |
1.9
2.1 |
1.6
2.0 |
1.5
1.7 |
1.7
1.5 |
1.7
1.9 |
| Payroll Jobs (Change In Millions) | Comptroller
Mayor |
1.6
1.8 |
1.3
1.1 |
1.0
0.7 |
0.8
0.1 |
0.8
0.3 |
| Fed Funds Rate (Percent) | Comptroller
Mayor |
1.7
1.7 |
2.0
2.1 |
2.4
2.4 |
2.8
2.6 |
2.8
2.6 |
| 10-Year Treasury Notes, (percent) | Comptroller
Mayor |
2.2
2.1 |
2.5
2.7 |
3.0
2.9 |
3.2
3.0 |
3.3
3.0 |
| Selected NYC Economic Indicators (Annual Averages) | ||||||
| Real GCP (2012 $, % Change) | Comptroller
Mayor |
2.0
1.9 |
1.8
0.9 |
1.5
0.6 |
1.2
0.5 |
1.2
0.3 |
| Payroll Jobs (Change In Thousands) | Comptroller
Mayor |
87.5
56.5 |
73.0
41.6 |
57.0
40.4 |
45.0
35.7 |
45.0
30.2 |
| Wage-Rate Growth (Percent) | Comptroller
Mayor |
2.7
2.3 |
2.3
2.9 |
1.7
2.5 |
1.5
2.6 |
1.5
2.2 |
Note: Comptroller=forecast by the NYC Comptroller’s Office. GCP=Gross City Product. Mayor=forecast by the NYC Office of Management and Budget in the January 2020 Financial Plan.
III. The FY 2021 Preliminary Budget
The FY 2021 Preliminary Budget released on January 16 shows a balanced budget of $95.30 billion. Revenues in the Preliminary Budget are $705 million higher than projected in the November Plan. Expenditures are $2.31 billion lower, driven by an increase of $2.17 billion in planned prepayment of FY 2021 debt service. The combination of higher revenues and lower expenditures closes a $3.02 billion gap projected in November.
Nearly all the revenue increases are due to re-estimates of City-funds revenues which are revised upward by $658 million from the November Plan projection, as shown in Table 6.[3] Revisions to tax revenue estimates account for about 90 percent of the increase in City-funds revenues, driven by upward revisions of $383 million in personal income tax (PIT), $200 million in tax audit, and $106 million in property tax revenues. A reduction of $244 million in real estate transaction tax revenues offsets some of these increases. On net, tax revenues are $593 million above the November Plan estimate. Tax revenues are discussed in greater detail in “Tax Revenues” beginning on page 16.
Table 6. Changes to FY 2021 City-Funds Estimates from the November 2019 Plan
| ($ in millions) | |
| Gap to be Closed – November 2019 Plan | ($3,015) |
| Revenues | |
| Tax Revenues | $593 |
| Non-Tax Revenues | 59 |
| Revenues From Citywide Savings Program | 6 |
| Total Revenue Changes | $658 |
| Expenditures | |
| Agency Expenditures | $161 |
| Collective Bargaining Adjustments | 85 |
| Pension Contributions | (174) |
| Miscellaneous Budget | (3) |
| Savings From Citywide Savings Program | (252) |
| Total Expenditure Changes | ($183) |
| Gap To Be Closed Before Prepayments | ($2,174) |
| FY 2020 Prepayment of FY 2021 Debt Service | $2,174 |
| Gap to be Closed – January 2020 Financial Plan | $0 |
FY 2021 City-funds expenditures before accounting for the reduction in debt service from FY 2020 prepayments show a net decrease of $183 million from the November Plan. This reduction stems largely from a $174 million decrease in pension contributions and spending reductions of $252 million in the citywide savings plan (CSP). The reduction in pension contributions reflects a change in the methodology for funding the guaranteed annual returns on the Tax Deferred Annuity (TDA) 403(b) funds of the Teachers’ Retirement System (TRS) and the Board of Education Retirement System (BERS). As discussed in greater detail in “Pensions” beginning on page 32, the guaranteed TDA returns which were previously funded as annual expenses will now be deducted from pension investment earnings of TRS and BERS, resulting in lower pension contributions.
Net of spending reductions in the CSP, agency expenditures are $161 million above the November Plan. The addition of funding for the Fair Fares program in FY 2021 accounts for $106 million of the increase. The November Plan included funding for the Fair Fare program in FY 2020 only. While the January Plan adds $106 million for the Fair Fare program in FY 2021, the program remains unfunded in the outyears. The remaining $56 million increase reflects mainly spending re-estimates spread across different agencies.
In addition, the City has increased its estimates of collective bargaining cost by $85 million to reflect the recent tentative agreements between the City and the Uniformed Officers’ Coalition (UOC) and the Professional Staff Congress (PSC). The City had previously funded wage increases for all City employees based on the District Council 37 (DC 37) agreement. The terms of the tentative agreement reached with the UOC establishes the Uniformed pattern and cost an additional $75 million above the DC 37 pattern. The terms of the PSC contract reflect modifications, which while conforming to the general pattern of the DC 37 contract, result in an additional cost of $10 million in FY 2021.
FY 2020 Budget Stabilization Account (BSA)
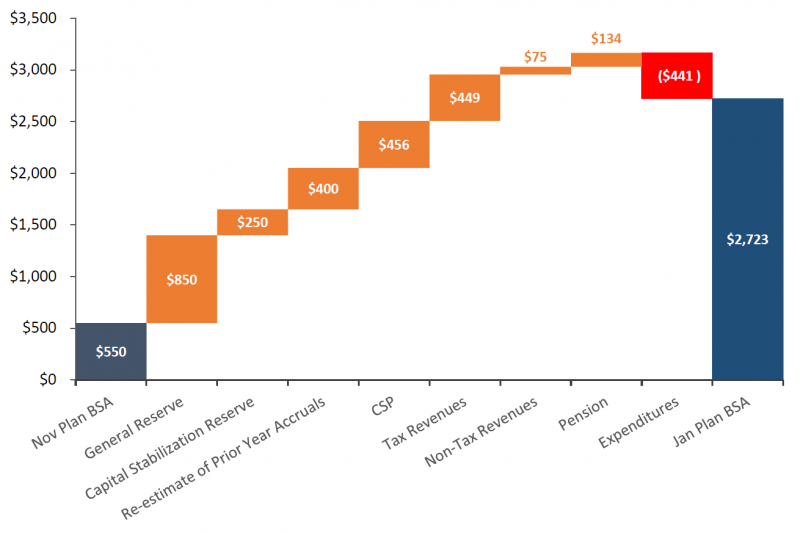
Since the November Plan, the City has recognized a net $2.17 billion of additional resources in the FY 2020 budget. Because these resources are not required to balance the current fiscal year’s budget, they are used to increase the FY 2020 Budget Stabilization Account, bringing the total FY 2020 BSA to $2.72 billion. The BSA will be used to prepay $2.55 billion of Transitional Finance Authority (TFA) and $173 million of general obligation (G.O.) debt service. As shown in Chart 7 on page 13, these additional resources are the result of:
- A reduction of $850 million in the FY 2020 General Reserve
- The elimination of the $250 million FY 2020 Capital Stabilization Reserve
- A net savings of $400 million from adjustments to prior-year receivables and payables estimates
- A new round of CSP with projected FY 2020 savings of $456 million
- An increase of $449 million in tax revenues
- An increase of $75 million in non-tax revenues
- An reduction of $134 million in pension contributions, less
- Additional City-funds spending of $441 million
Chart 7. The January Plan Increases the BSA by $2.17 Billion
($ in millions)
Citywide Savings Program (CSP)
The January 2020 Plan includes another round of CSP that is estimated to provide budget relief of $456 million in FY 2020, $259 million in FY 2021, $183 million in FY 2022, $203 million in FY 2023, and $235 million in FY 2024. Expenditure re-estimates, debt service savings, funding shifts, and additional revenues make up 87 percent of the combined FY 2020 – FY 2021 budget relief. Most of the additional revenues are from Federal reimbursement for prior-year expenditures including $100 million in prior-year Medicaid reimbursement and $11 million in unanticipated reimbursement for police protective services for the United Nations General Assembly. Efficiency initiatives account for about 8 percent of the combined savings, with anticipated personal services (PS) savings from reducing the absent teacher reserve (ATR) pool by permanently placing teachers in schools and other personal services savings accounting for $39 million of the $54 million in efficiency initiatives savings.
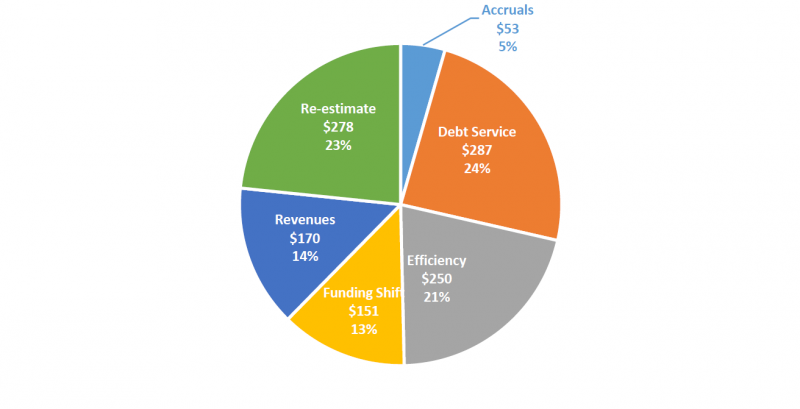
With the current round of CSP, estimated budget relief over the Plan period now totals $2.36 billion. The combined savings in FY 2020 and FY 2021 total $1.19 billon. As shown in Chart 8, debt service savings, re-estimates and efficiency initiatives account for about 68 percent of the combined FY 2020 and FY 2021 savings.
Chart 8. Combined FY 2020 and FY 2021 Citywide Savings Program
($ in millions)
Risks and Offsets
As Table 7 shows, the Comptroller’s Office analysis of the January Plan shows net additional resources in each year of the Plan, ranging from a low of $29 million in FY 2021 to a high of $707 million in FY 2024. The additional resources in FY 2020 are driven by both the Comptroller’s Office’s tax revenue forecast, which is higher than the City’s projection by $281 million, and the Comptroller’s Office’s assumption that the $300 million in the General Reserve will be available for budget relief in the current fiscal year. In the outyears, the additional resources identified by the Comptroller’s Office stem primarily from higher tax revenue forecasts in each year of the Plan, beginning at $520 million in FY 2021 and growing to $1.83 billion by FY 2024. (See “Comptroller Projections, FY 2020 – FY 2024” beginning on page 17).
Net risks to the City’s expenditure estimates offset some of the gains from the higher revenue forecast in the outyears. These risks stem primarily from assumptions of overtime spending and shortfalls in funding for charter school tuition, Carter cases, pupil transportation, homeless shelters and the Fair Fares initiative. Despite increases to the overtime budget in the current Plan, the Plan’s assumptions are still significantly below recent spending patterns. The Comptroller’s Office’s analysis indicates that overtime could be above Plan by $258 million in FY 2020, $262 million in FY 2021, and $150 million in each of the outyears of the Plan.
As discussed in “Department of Education” beginning on page 35, the department faces significant risks from underfunding of State-mandated charter school tuition payments, special education Carter cases, pupil transportation, and optimistic estimates of Medicaid reimbursement for special education services. Together these risks sum to $70 million in FY 2020, $370 million in FY 2021, $554 million in FY 2022, $782 million in FY 2023, and $929 million in FY 2024.
The January Financial Plan adds $106 million to fund the Fair Fares initiative in FY 2021 but leaves the program unfunded in the outyears. Based on participation rate to date, the Comptroller’s Office estimates that spending on the program could be $50 million less than the $106 million funding for the program in FY 2020. However, the Comptroller’s Office expects participation rate to ramp up in response to outreach by the City. As a result, the Office expects the full $106 million for the program to be expended in FY 2021 and projects annual risks of $200 million in FY 2022 through FY 2024 due to the absence of funding for this program.
Funding for shelter operations is projected to drop by almost $50 million in FY 2021. However, as discussed in “Homeless Services” beginning on page 36, there is no evidence to support a reversal in the trend of shelter operations spending. As such, the Comptroller’s Office is projecting risks of $49 million annually beginning in FY 2021 to the shelter operations budget.
Projected underspending for public assistance (PA) due to declining caseloads, pre-K special education savings and lower than projected variable rate demand bond (VRDB) interest provide some offsets against the expenditure risks discussed above. The Comptroller’s Office projects PA savings of $30 million annually over the Plan period, pre-K special education underspending of $50 million in each year of the Plan, and VRDB interest savings of $60 million in FY 2020 and $75 million in each of the outyears of the Plan.
Overall, the Comptroller’s Office’s analysis of the Plan indicates that the City could end FY 2020 and FY 2021 with budget surpluses of $459 million and $29 million, respectively. In the outyears, the Comptroller’s Office analysis shows smaller gaps of $2.00 billion, $2.22 billion and $1.95 billion in FY 2022 through FY 2024, respectively.
Table 7. Risks and Offsets to the January 2020 Financial Plan
($ in millions, positive numbers decrease the gap and negative numbers increase the gap)
| FY 2020 | FY 2021 | FY 2022 | FY 2023 | FY 2024 | |
|---|---|---|---|---|---|
| City Stated Gap | $0 | $0 | ($2,433) | ($2,686) | ($2,659) |
| Tax Revenues | |||||
| Property Tax | $150 | $232 | $784 | $1,346 | $2,028 |
| Personal Income Tax | 148 | 146 | 60 | (78) | (215) |
| Business Taxes | (54) | (118) | (73) | (25) | (1) |
| Sales Tax | (24) | 17 | (22) | (69) | (144) |
| Real Estate Transaction Taxes | 61 | 243 | 284 | 121 | 10 |
| Audit | 0 | 0 | 154 | 154 | 154 |
| Subtotal Tax Revenues | $281 | $520 | $1,187 | $1,449 | $1,832 |
| Fines | 16 | 35 | 48 | 48 | 48 |
| Total Revenues | $297 | $555 | $1,235 | $1,497 | $1,880 |
| Expenditures | |||||
| Overtime | ($258) | ($262) | ($150) | ($150) | ($150) |
| Charter School Tuition | 0 | (150) | (334) | (562) | (709) |
| Carter Cases | 0 | (125) | (125) | (125) | (125) |
| Pupil Transportation | (50) | (75) | (75) | (75) | (75) |
| Homeless Shelters | 0 | (49) | (49) | (49) | (49) |
| Fair Fares | 50 | 0 | (200) | (200) | (200) |
| DOE Medicaid Reimbursement | (20) | (20) | (20) | (20) | (20) |
| Pre-K Special Education | 50 | 50 | 50 | 50 | 50 |
| Public Assistance | 30 | 30 | 30 | 30 | 30 |
| VRDB Interest Savings | 60 | 75 | 75 | 75 | 75 |
| General Reserve | 300 | 0 | 0 | 0 | 0 |
| Subtotal | $162 | ($526) | ($798) | ($1,026) | ($1,173) |
| Total (Risks)/Offsets | $459 | $29 | $437 | $471 | $707 |
| Restated (Gap)/Surplus | $459 | $29 | ($1,996) | ($2,215) | ($1,952) |
Revenue Analysis
Total revenues in the January Plan are estimated to grow by $6.40 billion over the forecast period, from $95.43 billion in FY 2020 to $101.83 billion in FY 2024. City-funds revenues are projected to increase from $69.87 billion in FY 2020 to $76.56 billion in FY 2024. These projections reflect the City’s assumption of moderate and slowing growth in the local and national economies over the Plan period. Overall tax revenue is projected to grow by 4.6 percent in FY 2020, slightly higher than the previous year’s rate of 4.0 percent. Growth is expected to be driven primarily by property tax revenue, which is expected to rise by 7.0 percent, while non property tax revenue is expected to increase only moderately by 2.7 percent. However, the near term boost provided by strong growth in property taxes is expected to dissipate in the outer years of the Plan period as the effects of the strong phase-ins in assessments of market values that occurred in FY 2015 – FY 2019 begin to subside. As a result, overall tax revenues are expected to increase only moderately in FY 2021 – FY 2024, by 2.6 percent on average.
Miscellaneous revenues, excluding intra-City revenues, are projected to drop 9.2 percent in FY 2020 to $5.42 billion. This projection reflects the City’s anticipation of a decline in non-recurring revenues such as proceeds from the City’s asset sales and refunds and restitutions, which boosted FY 2019 revenues. The City projects miscellaneous revenue will decline further to $5.23 billion in FY 2021 and remain at this level through FY 2024. A fuller discussion of miscellaneous revenues begins on page 21.
The January Plan reflects $23.83 billion of Federal and State aid for FY 2020, representing about 25 percent of the City’s overall revenue projections. Over the outyears of the Plan, Federal and State grants are projected to decline to $22.92 billion in FY 2021 and then recover over the latter years of the Plan to reach $23.74 billion by FY 2024. Federal support would fall from $8.16 billion in FY 2020 to $7.11 billion in FY 2021 before stabilizing at about $7 billion annually thereafter, mainly due to the winding down of Sandy-related reimbursements and more conservative assumptions of certain Federal grants in the outyears. Meanwhile, State aid is projected to rise from $15.67 billion in FY 2020 to $16.77 billion by FY 2024, at an average annual growth of 1.7 percent, driven primarily by the City’s expectation of school aid increases. See the section “Federal and State Aid” beginning on page 22.
Tax Revenues
Revisions since the November Financial Plan, FY 2020 – FY 2024
The City increased projections for almost all tax revenue sources throughout the January Plan period as shown on Table 8 on page 17. The most significant upward revision was for the PIT, which was increased in each year of the Plan, with revisions increasing to over half a billion dollars by FY 2024. This revision largely reflects stronger assumptions for the non-withheld components of PIT, while the forecast for wage rate growth and withholding is largely unchanged. In addition to PIT, property and sales taxes estimates were also revised upwards in each year of the Plan based on higher collection data and the release of the FY 2020 – FY 2021 tentative roll. Collectively, the forecast for overall business taxes (GCT, UBT and Banking) was increased, although the underlying trends for the three business taxes differed sharply; large upward revisions in GCT offset lower estimates for the other two business taxes. Significant downward revisions to the real estate transaction tax revenues in each year of the Plan offset some of these increases. Smaller revisions occurred in the remaining taxes.
Table 8. Revisions to the City’s Tax Revenue Assumptions
January 2020 Plan vs. November 2019 Plan
| ($ in millions) | FY 2020 | FY 2021 | FY 2022 | FY 2023 | FY 2024 |
|---|---|---|---|---|---|
| November 2019 Financial Plan | $63,903 | $65,021 | $67,229 | $69,120 | $70,632 |
| Revisions: | |||||
| Property Tax | $50 | $93 | $108 | $128 | $76 |
| Personal Income (PIT) | 118 | 383 | 444 | 517 | 642 |
| Business | 236 | 50 | 41 | 67 | 54 |
| Sales | 63 | 67 | 72 | 74 | 44 |
| Real-Estate Transactions | (76) | (244) | (314) | (316) | (141) |
| All Other | 58 | 44 | 35 | 20 | 8 |
| Tax Audit | 0 | 200 | 0 | 0 | 0 |
| Total | $449 | $593 | $386 | $490 | $683 |
| January 2020 Financial Plan – Total | $64,352 | $65,614 | $67,615 | $69,610 | $71,315 |
Comptroller Projections, FY 2020 – FY 2024
The main differences between the Comptroller’s and the City’s projections for tax revenues are shown in Tables 9 and 10. Overall the Comptroller’s forecast of 3.1 percent average annual growth over the Plan period is slightly higher than the City’s 2.6 percent rate.[4] This difference is driven almost entirely by the Comptroller’s higher forecast for property taxes. Both the Comptroller and the City anticipate a slowdown in the growth rate for this revenue, but the City’s projection for each of the outyears FY 2022-FY 2024 is more than 1.5 percentage points lower compared to the Comptroller’s. As a result, by 2024 property tax revenues could be $2 billion higher than the City projects. The forecasts for the other taxes are relatively similar, with the exception of audit revenue where the City assumes a much steeper decline in FY 2022 compared to the Comptroller’s Office. A more detailed discussion of the individual taxes follows.
Table 9. Risks and Offsets to the City’s Tax Revenue Projections
| ($ in millions) | FY 2020 | FY 2021 | FY 2022 | FY 2023 | FY 2024 |
| Property | $150 | $232 | $784 | $1,346 | $2,028 |
| PIT | 148 | 146 | 60 | (78) | (215) |
| Business | (54) | (118) | (73) | (25) | (1) |
| Sales | (24) | 17 | (22) | (69) | (144) |
| Real Estate Transaction | 61 | 243 | 284 | 121 | 10 |
| Audit | 0 | 0 | 154 | 154 | 154 |
| Total | $281 | $520 | $1,187 | $1,449 | $1,832 |
Table 10. Tax Revenue Forecast, Growth Rates
| FY 2020 | FY 2021 | FY 2022 | FY 2023 | FY 2024 | FYs 2020 – 24 Average Annual Growth |
|
|---|---|---|---|---|---|---|
| Property | ||||||
| Mayor | 7.0% | 4.5% | 4.0% | 3.0% | 2.1% | 3.4% |
| Comptroller | 7.5% | 4.8% | 5.7% | 4.6% | 4.0% | 4.8% |
| PIT | ||||||
| Mayor | 2.9% | 0.6% | 3.5% | 3.6% | 3.5% | 2.8% |
| Comptroller | 4.0% | 0.5% | 2.9% | 2.6% | 2.6% | 2.1% |
| Business | ||||||
| Mayor | 1.4% | (3.9%) | 1.8% | 1.8% | 0.7% | 0.1% |
| Comptroller | 0.5% | (4.9%) | 2.6% | 2.6% | 1.1% | 0.3% |
| Sales | ||||||
| Mayor | 7.0% | 3.2% | 3.5% | 3.2% | 3.4% | 3.3% |
| Comptroller | 6.7% | 3.7% | 3.1% | 2.7% | 2.6% | 3.0% |
| Real Estate Transactions | ||||||
| Mayor | (10.1%) | (6.3%) | (0.3%) | 2.8% | 3.1% | (0.2%) |
| Comptroller | (7.8%) | 1.4% | 1.4% | (4.0%) | (1.7%) | (0.8%) |
| All Other | ||||||
| Mayor | (1.0%) | 1.5% | 1.8% | 1.5% | 1.9% | 1.7% |
| Comptroller | (1.0%) | 1.5% | 1.8% | 1.5% | 1.9% | 1.7% |
| Audit | ||||||
| Mayor | 22.2% | (7.8%) | (21.7%) | 0.0% | 0.0% | (7.8%) |
| Comptroller | 22.2% | (7.8%) | (5.0%) | 0.0% | 0.0% | (3.3%) |
| Total Tax with Audit | ||||||
| Mayor | 4.6% | 2.0% | 3.0% | 3.0% | 2.4% | 2.6% |
| Comptroller | 5.1% | 2.3% | 4.0% | 3.3% | 2.9% | 3.1% |
Property Taxes
The Comptroller’s Office forecasts slowing but continued growth throughout the Plan period. Property tax revenue is estimated to grow on average by 4.8 percent annually from FY 2020 to FY 2024. The slowdown is attributable to a complex mix of changes in forecast increases in assessed values, the phase-in of assessed value increases that have already occurred, and conservative estimates for the construction of new commercial and residential property.
The City projects comparatively slower growth for the real property tax over the Plan period, stemming from a difference in the forecast for reserves, larger predicted decreases in billable values from the tentative to the final roll, and slower growth of billable value. The City’s projections show reserves jumping to almost 7 percent of the levy in FY 2021 – FY 2024 from 6.4 percent last year. The Comptroller’s Office’s assumption of a more steady reserve-to-levy ratio results in a forecast for reserves that is $200 million to $300 million lower than the City’s estimate. The combined effect of lower reserves and slightly higher assumptions for property tax growth results in property tax revenue exceeding the City’s projections by $2.0 billion by the end of the Plan period.
Real Estate Transaction Taxes
The Comptroller’s Office projects a 7.8 percent decline in the combined revenues from real estate-related taxes (the real property transfer tax and mortgage recording tax) in FY 2020, to $2.44 billion, which is still approximately $61 million above the City’s latest forecast of $2.38 billion. In the outyears, the Comptroller’s Office projections are above the City’s by $243 million in FY 2021, $284 million in FY 2022, $121 million in FY 2023, and $10 million in FY 2024. The Comptroller’s Office forecasts real estate-related taxes to stay relatively flat over the plan period with slow growth during the first two fiscal years (1.4 percent annually) and decline afterwards (by 4 percent in FY 2023 followed by 1.7 percent in FY 2024). The City forecasts a decline in FY 2021 and FY 2022 by 6.3 percent and 0.3 percent respectively followed by growth in outyears.
Residential sales including 1- to 3-family homes, co-ops, and condos priced under $2 million, have shown declines in 2019 as a result of the loss of SALT deductions and lowered limits for interest deductions on residential mortgages enacted in the Tax Cuts and Jobs Act of 2017. This downward trend is expected to lower forecasts in FY 2020 compared to FY 2019. For the outyears, continued growth in NYC wages and employment are expected to support growths in both the commercial and residential real estate markets, with expected increases in interest rates in the later years of the Plan period offsetting the growth.
There are potential risks to the forecast of real estate-related taxes. We do not have enough evidence yet on the potential impact on prices and demand for high-end residential properties due to the supplemental tax on the sales of residential real properties priced above $2 million (the “mansion tax”). Finally, sales of residential rental buildings may be impacted by changes in rent control laws that limit owners’ ability to raise rents.
Personal Income Taxes
The City significantly revised its forecast for PIT in the January Plan, primarily a reflection of higher estimates for the non-withheld components of PIT related to capital gains realizations. The Comptroller’s November forecast had anticipated higher non-withheld revenues across the Plan years. As a result, the two forecasts are now very similar. Both forecasts anticipate that slowing job gains will result in moderate PIT growth in the out years of the plan. However, the growth pattern is slightly different with the Comptroller’s Office assuming higher near-term strength and conversely lower growth in the later years, as shown in Table 10.
With the local and national economy showing continued growth momentum, the greatest near term uncertainty for the PIT forecast is likely related to the containment of the outbreak of the COVID-19 virus and the outcome of the presidential election in November and its potential impact on the stock market and capital gains realizations. Long term the upcoming decennial census will provide more robust data on the City’s population and will need to be monitored closely to see if it confirms recent estimates of a decline in the City’s population.
Business Income Taxes
The forecast for the business taxes (General Corporation Tax and Unincorporated Business Tax), is perhaps the most uncertain of all revenues given significant changes that occurred recently in both Federal and local tax law.[5]
GCT tax revenue jumped by more than 23 percent in FY 2019. This increase was likely a response to the lowering of the Federal corporate tax rate which caused firms to shift income into tax year 2018 to take advantage of this lower rate. In addition, GCT revenue may have also been boosted by conversions of unincorporated business to incorporated business that were also triggered by the new tax law.
With all the changes in law that occurred, Federal and local tax departments are still issuing guidance on the newly enacted and complex provisions of these laws. As a result of this uncertainty, firms’ ultimate tax liability for these years could change. While the City raised its estimates for GCT throughout the Plan based on current collections, due to the uncertainty of the tax liability, our assessment is that more caution is warranted in the outyears due to the possibility of recent overpayments.
Sales Tax
The City projects sales tax collections to reach $8.35 billion in FY 2020, a 7.0 percent increase from last fiscal year, and the strongest growth rate in nearly a decade. The Comptroller’s Office forecast of 6.7 percent is very similar, resulting in a minor $24 million difference in FY 2020. Policy factors also are a determinant factor driving this strong growth, in addition to the continued expansion in the local economy and a robust tourism sector.[6] The end of the State mandated STARC intercepts, which reduced City sales tax revenue by $150 million in FY 2019, and $450 million in FY 2016 – FY 2018, provides a one-time boost of nearly 2 percentage points to FY 2020’s growth.[7]
Both the City and the Comptroller’s Office expect growth in sales tax revenue to abate in the outyears of the Plan, in line with a projected slowdown in economic growth and gradual deceleration in employment and wage growth. For FY 2021, the Comptroller forecasts growth in sales tax collection of 3.7 percent, a slightly higher rate than the City’s 3.2 percent projection, resulting in a small offset of $17 million.
The Comptroller’s Office projects sales tax revenue growth to slow further in the outyears, averaging 2.6 percent annually in FY 2022 – FY 2024, compared to a 3.3 percent average growth reflected in the Plan over the same period. In FY 2022 – FY 2024 the Comptroller’s Office forecasts revenues from sales tax to be below OMB’s projection by about $22 million, $69 million and $144 million respectively.
Audit Revenues
The City’s forecast assumes that audit collections will decline by more than 21 percent from $921 million in FY 2021 to only $721 million in FY 2022 and the remainder of the Plan. The Comptroller’s forecast, while recognizing the volatility in individual audit collections, assumes that overall tax revenues should remain more closely in line with the $1 billion long term average of the past 10 years. As a result, the City could collect at least $150 million more in each year from FY 2022 – FY 2024.
Hudson Yards Tax Equivalency Payments (TEPS) and Payment in Lieu of Taxes (PILOT)
Under the Hudson Yards financing structure, the City makes annual tax equivalency payments (TEPS) for property taxes of newly developed residential and hotel properties in Hudson Yards. These TEPS and other revenue sources cover debt and other project costs of the HYIC. In turn, surplus revenues from TEPS and these other sources that exceed project costs can be returned to the general fund via PILOT payments from HYIC to the City.
In the current Financial Plan, the City shows TEP payments flat throughout the Plan years at approximately $150 million. This flat projection for TEP revenues is unlikely for several reasons: 1) The City’s own assumptions on market value growth suggests that TEP related property tax payments will increase over time; 2) expiring abatements for existing residential properties also suggest that TEP payments will increase; and 3) the addition of newly constructed properties coming on line will also result in additional TEP payments. In fact, the City’s own previous projections for TEP revenues indicate TEP revenues growing from $143 million in 2020 to over $220 million by 2024.
If these growing TEP payments do not coincide with increasing HYIC PILOT payments to the City, this would pose a risk to the City’s budget given that TEPs are expenditures in the general fund.
Miscellaneous Revenues
In the January 2020 Financial Plan, the City raised its FY 2020 miscellaneous revenue projection by a net $118 million, to $5.42 billion. About $42 million of this increase reflects revenue initiatives included in the Citywide Savings Plan. The revised miscellaneous revenue forecast nonetheless represents a 9.2 percent decline from FY 2019. This is mostly due to lower projected non-recurring revenues such as asset sales and restitutions in FY 2020.
Table 11 shows changes in the FY 2020 miscellaneous revenue projection totaling $118 million since the November 2019 Plan. Excluding water and sewer revenues which are reimbursements from the Water Board for the operation and maintenance of the water delivery and sewer systems, the January Plan increases the other miscellaneous revenue categories by a combined $66 million in FY 2020.
Table 11 Changes in FY 2020 Estimates
January 2020 Plan vs. November 2019 Plan
| ($ in millions) | November | January | Change |
|---|---|---|---|
| Licenses, Permits & Franchises | $760 | $767 | $7 |
| Interest Income | 155 | 155 | 0 |
| Charges for Services | 1,056 | 1,059 | 3 |
| Water and Sewer Charges | 1,537 | 1,589 | 52 |
| Rental Income | 256 | 258 | 2 |
| Fines and Forfeitures | 1,135 | 1,182 | 47 |
| Other Miscellaneous | 404 | 411 | $7 |
| Total | $5,303 | $5,421 | $118 |
Note: Water and sewer revenues collected by the Water Board from dedicated water and sewer charges represent reimbursements for operation and maintenance of the water delivery and sewer systems and therefore are not available for general operating purposes.
Projected revenues from licenses, permits & franchises increased by $7 million. The Department of Buildings (DOB) is expected to realize an additional $6 million in revenues from building permits due to an increase in the volume of after-hours variance permits. Charges for services increased by $3 million due to a re-estimate of fee revenues including $1.9 million in tax credit fees from the Department of Housing Preservation and Development (HPD), $1.9 million in DOB facades and electric inspection fees, and $2 million in credit card convenience fees. These increases were partially offset by a $4 million decrease in City register fees. The forecast for rental income increased by $2 million mostly due to an increase in projected rental income from the HPD portfolio.
Projections for fines and forfeitures increased by $47 million. This includes a $22.2 million net increase in parking fine revenues resulting from greater than expected year-to-date summonses, slightly offset by a downward revenue adjustment to reflect a delay in the implementation of increased alternate side parking fines. Estimated fine revenues from the DOB increased by $11 million reflecting increases from elevator, work without a permit, and hazardous violations. Revenues from court fines increased by $8.8 million of which $7 million are one-time revenues previously held in escrow accounts for partial payments of court fines from FY 2018 and FY 2019. Revenues from health tribunal summonses and from real property transfer tax (RPTT) late-payment penalties increased by $3.7 million and $1.1 million respectively.
The category “Other Miscellaneous” which includes City asset sales, restitution and other non-recurring revenues, increased by $7 million, including $1.6 million in restitution, $1.8 million in additional employee health contributions, $1.9 million in asset sales and $1 million in additional HPD mortgage revenue.
Changes to the miscellaneous revenue outyear forecasts were minor. Total Miscellaneous revenue is expected to decline by $187 million in FY 2021 to $5.2 billion and remain at this level throughout the remainder of the Plan period.
Although the January Plan increases fine revenue estimates throughout the Plan period, based on recent collection trend, the Comptroller’s Office expects revenues from fines to be above the City’s forecast in each of FYs 2020 – 2024 by $16 million in FY 2020, $35 million in FY 2021 and $48 million in each of FYs 2022 – 2024.
Federal and State Aid
The January Financial Plan projects total Federal and State aid of $23.83 billion in FY 2020, supporting nearly 25 percent of the City’s expenditure budget. Compared with the November Plan, the City has recognized an increase of $331 million in the current year comprised of $145 million in Federal aid and $186 million in State grants. A significant portion of the increase is reflected in education aid totaling about $91 million, mostly from State reimbursement for transportation ($36 million) and special education ($34 million) and certain Federal aid adjustments ($17 million). The January Modification also recognizes $106 million in additional Community Development Block Grant for Disaster Recovery and other Sandy-related reimbursement, bringing the new total to $334 million in the current year. The remainder of the FY 2020 increase is mainly comprised of health and welfare grants totaling $99 million, including $60 million for early intervention and $10 million each for secure detention and the Close to Home initiative.
In the FY 2021 Preliminary Budget, the City assumes $22.92 billion in Federal and State assistance, reflecting a modest increase of $45 million since the November Plan. The increase mainly consists of extension of certain education aid and Sandy-related reimbursements from the current year. Federal and State grants would support about 24 percent of the expense budget in FY 2021, representing a slight decrease from the current year due to a decline in Sandy-related reimbursements and more conservative estimates of certain Federal grants.
Over the remainder of the Plan, Federal and State grants are projected to rise to $23.27 billion in FY 2022, $23.7 billion in FY 2023 and $23.74 billion in FY 2024, averaging annual growth of slightly over 1 percent, driven primarily by expectation of State education aid increases of about 2.5 percent annually. Assuming these assumptions hold true, Federal and State support for the City’s expense budget would decline from about 25 percent in FY 2020 to 23 percent by FY 2024.
State Executive Budget
Governor Andrew Cuomo unveiled his Executive Budget for State fiscal year (SFY) 2020 – 2021 on January 21, 2020. The plan aims to close a projected general fund budget gap of $7.0 billion, including $890 million in savings announced in the November Mid-year Update. About one-third of the gap relates to higher than forecast Medicaid spending in the current year.
The City estimates that in total, the State budget as proposed could have a negative impact on the City’s Financial Plan of more than $1.3 billion over FY 2020 and FY 2021, as shown in Table 12.
Table 12 Potential Impact of Proposed 2020 – 21 State Budget
| ($ in millions) | FY 2020 | FY 2021 | Total Two-Year Impact |
|---|---|---|---|
| School Aid | |||
| Formula Aid Shortfall | $3 | ($136) | ($133) |
| Subtotal School Aid | $3 | ($136) | ($133) |
| Cost Shifts | |||
| Medicaid | ($100) | ($1,005) | ($1,105) |
| Family Assistance | (34) | (68) | (102) |
| Child Welfare | (7) | (14) | (21) |
| Subtotal Cost Shifts | ($141) | ($1,087) | ($1,228) |
| Hudson River Park Tow Pound | – | ($27) | ($27) |
| Total Impact | ($138) | ($1,250) | ($1,388) |
Source: NYC Office of Management and Budget
Medicaid
Under the State’s Global Cap, the State’s share of Medicaid spending is held to the 10-year average of the medical care consumer price index, which currently provides for about 3.0 percent annual growth. However, in SFY 2018–2019, higher than anticipated Medicaid expenses created a structural imbalance in the Global Cap, leading to a $1.7 billion deferral in Medicaid payments from the final days of SFY 2018-19 to the beginning of SFY 2019-20.[8] In November 2019, the State reported that the deferral contributed to a projected $4 billion Medicaid imbalance in the current year and a $3.1 billion imbalance in SFY 2020–2021.
To address the Medicaid imbalance over the State’s financial plan, the Governor reconvened the Medicaid Redesign Team (MRT II), a task force of health care industry experts. The task force has been charged with identifying $2.5 billion in Medicaid savings for SFY 2020–2021 and reducing the long-term Medicaid growth trend to the Global Cap indexed rate.
Governor Cuomo also proposed significant changes to local governments’ contribution to Medicaid funding. Under the proposal, local governments would be required to fund local Medicaid spending growth above 3 percent, however, if local governments do not comply with the State’s 2 percent property tax levy cap, they would be required to fund all local growth in Medicaid. The proposal would apply to New York City, although the City is not subject to the property tax cap. The Governor’s proposal would take effect in SFY 2020–2021 and provide projected annual savings of $150 million.
Under the State’s current local Medicaid growth cap, local governments’ Medicaid contributions have been frozen since calendar year 2015. As of FY 2021, the City’s capped annual contribution is $4.953 billion, net of enhanced Federal Medicaid Assistance Percentage (FMAP). The State projects that the annual savings from the local share growth cap for New York City would grow by $221 million from $1.98 billion in SFY 2019-20 to $2.20 billion in SFY 2020–2021.[9]
Based on recent trends, New York City would be unlikely to meet either the property tax levy cap or the 3 percent growth provision. Over the last five fiscal years, the City’s property tax levy has grown at an average annual rate of 7.0 percent, well above allowable growth under the cap that currently applies outside the City. The State’s property tax levy cap limits annual growth to the lesser of 2 percent or the rate of inflation, plus certain exclusions, including growth attributed to new development. Similarly, in the last two years, the non-Federal share of Medicaid spending in New York City has exceeded 3 percent annual growth. According to State Department of Health data, State and local Medicaid spending in the City grew 7.0 percent in SFY 2018–2019 from $16.2 billion to $17.3 billion.[10]
The City assumes that if Medicaid costs grow at similar rate as in the prior two years, at about 7 percent annually, the State’s proposal would lead to a risk of $518 million for the local share of the spending increase. Further, based on the City’s interpretation of a separate proposal, the State has the option to terminate the provision of enhanced FMAP savings to the City, which would raise the total Medicaid cost impact to $1.1 billion over FY 2020 and FY 2021.
In recent years, the State has assumed greater administrative responsibilities from New York City and the counties, leaving the City with limited control over the program’s costs. While the City maintains a role in determining eligibility for certain categories of enrollees, including managed long-term care recipients, the City cannot control major cost drivers of the program, such as eligibility rules, service levels, and reimbursement rates.
School Aid
As proposed, the State Budget would provide $11.6 billion in formula-based school aid to New York City in FY 2021, a 2.0 percent increase from the current year. Proposed school aid is $136 million less than assumed in the City’s Financial Plan for FY 2021, before accounting for $250 million in statewide funding set aside for additional Foundation Aid for high-need districts and competitive grants. The State indicates that, if distributed, the City would receive an additional $97 million in aid, which could potentially reduce the projected school aid shortfall of $136 million.
The proposed State Budget would also consolidate 10 other formula-based categories of school aid into Foundation Aid. These aid categories, which include special services and library, software and textbook aid, provide $309 million in funding to New York City in the current school year. By combining these categories into Foundation Aid, the City’s share of Foundation Aid would appear to grow from $8.1 billion in the current year to $8.6 billion next year, thereby artificially shrinking the gap between proposed funding and the amount owed to the City if Foundation Aid were fully funded.
In addition, the Executive Budget would cap reimbursements for transportation aid based on enrollment growth and inflation beginning in FY 2022, add a new tier of building aid for projects approved beginning in the 2020-21 school year, and exclude the reissuance of surrendered, revoked, or terminated charters from the New York City charter school cap. In 2015, a similar provision allowed an additional 22 charters to be reissued to charter schools that had lost their charter before July 1, 2015. The Governor’s proposal would enable about 17 charter schools that have closed since July 1, 2015 to reopen without having to raise the cap. As of early 2019, New York City reached the State-imposed limit on charters and therefore no additional charter schools are able to be authorized in the City.
The State-mandated tuition payment from New York City to charter schools is also set to rise steeply in the coming years, posing risks of $150 million in FY 2021, $334 million in FY 2022, and $562 million in FY 2023 (See discussion in “Department of Education” beginning on page 35).
Other Costs to the City
The Governor’s proposed budget would further lower State reimbursement for Family and Emergency Assistance benefits utilizing the Federal Temporary Assistance to Needy Families (TANF) block grant. State reimbursement would fall to 85 percent, following a reduction from 100 percent to 90 percent last year. This proposal would reduce funding to the City by an additional $68 million annually, increasing City costs primarily in the areas of homeless family shelter operations and cash assistance.
The Governor has also proposed raising the statewide child welfare threshold, which requires localities to meet a dollar threshold for child welfare spending before receiving 62 percent State reimbursement for certain services. The current statewide threshold of $342 million, which has not been increased since 2009, would increase to $382 million. Based on the City’s current allocation of the statewide threshold, the proposal could require New York City to spend an additional $23 million before being eligible to receive 62 percent State reimbursement.[11] Therefore, the proposal could cost New York City $14 million annually, beginning in FY 2021.
Another proposal in the State budget would subject the City to a $12 million penalty if the City does not vacate Pier 76 on the Hudson River by the end of calendar year 2020. The pier is currently used as a police tow pound. Beginning February 1, 2021, the City would be obligated to pay $3 million in monthly “rent” to the Hudson River Park Trust until the tow pound is moved, which could result in a total cost of $27 million in FY 2021. As of the beginning of 2020, a location had not yet been identified for the tow pound.
The proposed State budget also includes an extension of two provisions that pose further risks to the City. One proposal would extend Executive authority granted in the past three years to propose a plan to reduce spending if Federal Medicaid revenues are cut by $850 million, or if non-Medicaid Federal revenues are cut by $850 million in SFYs 2020-21 and 2021-22. The Legislature would have 90 days to propose and adopt an alternative plan.
The second provision would extend authority to allow certain local aid payments to be uniformly reduced by up to 1 percent if the State anticipates a year-end general fund shortfall greater than $500 million in SFY 2020-21. Exempted aid categories include public assistance, reductions that would violate federal law, and payments of debt service and related expenses which the State is constitutionally or contractually obligated to pay. The legislature would have 30 days to propose an alternative plan.
Revenues
On the revenue side, for the second consecutive year, the Governor included legislation in the Executive Budget to legalize and tax the sale of cannabis. The Governor proposed a 20 percent State excise tax and a 2 percent local excise tax on sales from wholesalers to retailers. The local tax would be based on the wholesale price and the location of the retailer. However, cannabis sales would be exempt from the City and State sales tax. The State expects to begin collecting $20 million in new revenue in SFY 2020 – 2021. The Comptroller’s Office has estimated that the market for adult-use marijuana in New York City would be about $1.1 billion. Consequently, once the existing underground market transitions to the legal market, the legalization of cannabis could generate approximately $20 million per year in local excise tax for the City.
The State has also proposed reducing taxes on small businesses and farms, including a proposal to increase an existing personal income tax deduction for net business income from 5 percent to 15 percent. Small business is defined as a sole proprietor or farm business that employs one or more persons and has net business income or net farm income of less than $250,000. The City estimates that the increased deduction could reduce City personal income tax revenue by as much as $33 million annually beginning in FY 2021. However, the most recent available data shows that the existing deduction cost the State only $1.5 million in 2016.
Expenditures Analysis
Total-funds FY 2021 expenditures in the January Financial Plan are projected to remain relatively unchanged from FY 2020, declining marginally by $127 million, or about one-tenth of a percent. After adjusting for prepayments, and excluding re-estimates of prior-year accruals and reserves, FY 2021 expenditures are still relatively flat compared to FY 2020, decreasing from $97.02 billion in FY 2020 to $96.77 billion in FY 2021, a modest reduction of 0.3 percent. The drop in expenditures is driven by reductions in contractual and other than personal services expenditures, as shown in Table 13.
Table 13. FY 2020 – FY 2024 Expenditure Growth
Adjusted for Prepayments and Prior-Year Actions
| ($ in millions) | FY 2020 | FY 2021 | FY 2022 | FY 2023 | FY 2024 | Growth FYs 20-24 | Annual Growth |
|---|---|---|---|---|---|---|---|
| Salaries and Wages | $29,677 | $30,519 | $30,398 | $31,307 | $31,869 | 7.4% | 1.8% |
| Debt Service | 6,984 | 7,499 | 8,158 | 8,906 | 9,366 | 34.1% | 7.6% |
| Health Insurance | 6,967 | 7,379 | 8,069 | 8,756 | 9,437 | 35.5% | 7.9% |
| Other Fringe Benefits | 4,286 | 4,308 | 4,423 | 4,545 | 4,676 | 9.1% | 2.2% |
| Subtotal | $47,914 | $49,705 | $51,049 | $53,514 | $55,348 | 15.5% | 3.7% |
| Pensions | $9,719 | $9,827 | $10,310 | $10,346 | $10,000 | 2.9% | 0.7% |
| Medicaid | 5,915 | 5,915 | 5,915 | 5,915 | 5,915 | 0.0% | 0.0% |
| Public Assistance | 1,641 | 1,651 | 1,651 | 1,650 | 1,650 | 0.6% | 0.1% |
| J & C | 733 | 727 | 742 | 758 | 775 | 5.7% | 1.4% |
| Contractual Services | 18,339 | 16,769 | 16,861 | 16,903 | 16,856 | (8.1%) | (2.1%) |
| Other OTPS | 12,763 | 12,179 | 12,304 | 12,433 | 12,697 | (0.5%) | (0.1% ) |
| Subtotal | $49,110 | $47,067 | $47,782 | $48,006 | $47,893 | (2.5%) | (0.6%) |
| Expenditures Before Reserves and Prior-Year Re-estimates | $97,024 | $96,772 | $98,831 | $101,520 | $103,241 | 6.4% | 1.6% |
| Prior-Year Accruals Re-estimate | ($400) | $0 | $0 | $0 | $0 | ||
| General Reserve | $300 | $1,000 | $1,000 | $1,000 | $1,000 | ||
| Capital Stabilization Reserve | $0 | $250 | $250 | $250 | $250 | ||
| Total | $96,924 | $98,022 | $100,081 | $102,770 | $104,491 | 7.8% | 1.9% |
Note: Numbers may not add due to rounding.
Over the Plan period, expenditures net of reserves and prior-year re-estimates are projected to grow by 6.4 percent, driven by spending on salaries and wages, debt service, health insurance, and other fringe benefits excluding pensions. The combined spending in these areas is projected to grow by 15.5 percent over the Plan period, averaging 3.7 percent annually. All other expenditures, net of the reserves and prior-year re-estimates, are projected to decline by 2.5 percent over the same period, with a projected annual average decline of 0.6 percent.
Headcount
The January 2020 Headcount Plan projects significant increases in FY 2021 and FY 2022 full-time headcount, with a very slight decline in FY 2023 and FY 2024. Full-time headcount, as shown in Table 14, is projected at 307,175 for FY 2020, rising to 308,851 in FY 2021, to 311,541 in FY 2022, then falling modestly to 311,471 in FY 2023 and remaining essentially flat in FY 2024.
Table 14. Total Funded Full-Time Year-End Headcount
January 2020 Financial Plan
| FY 2020 | FY 2021 | FY 2022 | FY 2023 | FY 2024 | |
|---|---|---|---|---|---|
| Pedagogical | |||||
| Dept. of Education | 122,004 | 123,968 | 126,711 | 126,711 | 126,711 |
| City University | 4,441 | 4,441 | 4,441 | 4,441 | 4,441 |
| Subtotal | 126,445 | 128,409 | 131,152 | 131,152 | 131,152 |
| Uniformed | |||||
| Police | 36,201 | 36,201 | 36,201 | 36,201 | 36,201 |
| Fire | 10,952 | 10,951 | 10,951 | 10,951 | 10,951 |
| Correction | 8,949 | 8,949 | 8,790 | 8,790 | 8,790 |
| Sanitation | 7,842 | 7,808 | 7,805 | 7,805 | 7,805 |
| Subtotal | 63,944 | 63,909 | 63,747 | 63,747 | 63,747 |
| Civilian | |||||
| Dept. of Education | 12,724 | 12,854 | 13,130 | 13,130 | 13,130 |
| City University | 1,946 | 1,946 | 1,946 | 1,946 | 1,946 |
| Police | 16,040 | 15,798 | 15,798 | 15,798 | 15,798 |
| Fire | 6,394 | 6,631 | 6,630 | 6,621 | 6,620 |
| Correction | 2,028 | 2,027 | 2,027 | 2,027 | 2,027 |
| Sanitation | 2,241 | 2,237 | 2,237 | 2,237 | 2,237 |
| Admin. for Children’s Services | 7,167 | 7,424 | 7,424 | 7,424 | 7,424 |
| Social Services | 14,577 | 14,591 | 14,591 | 14,591 | 14,591 |
| Homeless Services | 2,383 | 2,219 | 2,120 | 2,120 | 2,120 |
| Health and Mental Hygiene | 5,830 | 5,827 | 5,827 | 5,820 | 5,820 |
| Finance | 2,147 | 2,147 | 2,147 | 2,147 | 2,147 |
| Transportation | 5,560 | 5,529 | 5,534 | 5,535 | 5,537 |
| Parks and Recreation | 4,507 | 4,421 | 4,423 | 4,423 | 4,423 |
| All Other Civilians | 33,242 | 32,882 | 32,808 | 32,753 | 32,753 |
| Subtotal | 116,786 | 116,533 | 116,642 | 116,572 | 116,573 |
| Total | 307,175 | 308,851 | 311,541 | 311,471 | 311,472 |
Compared to the November 2019 Plan, the January 2020 Headcount Plan shows a net increase in year-end headcount of 490 in FY 2020, and 202 in each of FY 2021 through FY 2023, as shown in Table 15 on page 28. Of the projected changes, new needs account for 37 positions in FY 2020, 47 in FY 2021, and 44 in each of FY 2022 and FY 2023.
Table 15. Full-time Non-Pedagogical Civilian Headcount Changes
January 2020 Financial Plan vs. November 2019 Financial Plan
| FY 2020 | FY 2021 | FY 2022 | FY 2023 | |
|---|---|---|---|---|
| Uniformed | ||||
| Police | 0 | 0 | 0 | 0 |
| Fire | 0 | 0 | 0 | 0 |
| Correction | 0 | 0 | 0 | 0 |
| Sanitation | 0 | 3 | 0 | 0 |
| Subtotal | 0 | 3 | 0 | 0 |
| Civilian | ||||
| Dept. of Education | 122 | 109 | 109 | 109 |
| City University | 0 | 0 | 0 | 0 |
| Police | 178 | 0 | 0 | 0 |
| Fire | 9 | 8 | 8 | 8 |
| Correction | 0 | 0 | 0 | 0 |
| Sanitation | 2 | 0 | 0 | 0 |
| Admin. for Children’s Services | 0 | 0 | 0 | 0 |
| Social Services | (1) | (1) | (1) | (1) |
| Homeless Services | 0 | (7) | (7) | (7) |
| Health and Mental Hygiene | 69 | 53 | 53 | 53 |
| Finance | 1 | 1 | 1 | 1 |
| Transportation | 31 | (5) | (2) | (2) |
| Parks and Recreation | 24 | 6 | 6 | 6 |
| All Other Civilians | 55 | 35 | 35 | 35 |
| Subtotal | 490 | 199 | 202 | 202 |
| Total | 490 | 202 | 202 | 202 |
Table 16 compares actual headcount on December 31, 2019 to the planned FY 2020 year-end headcount. The headcount plan shows an expected net increase of 6,733 full-time employees Citywide, from June 30, 2019. However, as shown in the table, halfway through FY 2020, the City has less than a quarter of its planned increase for the current fiscal year. It remains to be seen whether the rate of hiring will increase so that the FY 2020 planned headcount figure will be achieved.
Table 16. December 31, 2019 Headcount vs Planned June 30, 2020 Headcount
| 6/30/2019 Actuals | 12/31/2019 Actuals | 6/30/2020 Plan | Change 6/30/2019 to 12/31/2019 |
Planned Change 6/30/2019 to 6/30/2020 |
Percent Planned Change Achieved |
|
|---|---|---|---|---|---|---|
| Pedagogical | ||||||
| Dept. of Education | 120,398 | 120,749 | 122,004 | 351 | 1,606 | 21.9% |
| City University | 4,599 | 4,556 | 4,441 | (43) | (158) | 27.2% |
| Subtotal | 124,997 | 125,305 | 126,445 | 308 | 1,448 | 21.3% |
| Uniformed | ||||||
| Police | 36,461 | 36,486 | 36,201 | 25 | (260) | (9.6%) |
| Fire | 11,244 | 11,295 | 10,952 | 51 | (292) | (17.5%) |
| Correction | 10,189 | 9,745 | 8,949 | (444) | (1,240) | 35.8% |
| Sanitation | 7,893 | 7,978 | 7,842 | 85 | (51) | (166.7%) |
| Subtotal | 65,787 | 65,504 | 63,944 | (283) | (1,843) | 15.4% |
| Civilian | ||||||
| Dept. of Education | 13,218 | 13,591 | 12,724 | 373 | (494) | (75.5%) |
| City University | 1,834 | 1,777 | 1,946 | (57) | 112 | (50.9%) |
| Police | 15,306 | 15,331 | 16,040 | 25 | 734 | 3.4% |
| Fire | 6,093 | 6,161 | 6,394 | 68 | 301 | 22.6% |
| Correction | 1,749 | 1,745 | 2,028 | (4) | 279 | (1.4%) |
| Sanitation | 2,127 | 2,131 | 2,241 | 4 | 114 | 3.5% |
| Admin. for Children’s Svcs | 7,138 | 7,231 | 7,167 | 93 | 29 | 320.7% |
| Social Services | 12,614 | 12,528 | 14,577 | (86) | 1,963 | (4.4%) |
| Homeless Services | 2,318 | 2,257 | 2,383 | (61) | 65 | (93.8%) |
| Health and Mental Hygiene | 5,509 | 5,482 | 5,830 | (27) | 321 | (8.4%) |
| Finance | 1,968 | 2,057 | 2,147 | 89 | 179 | 49.7% |
| Transportation | 4,941 | 5,066 | 5,560 | 125 | 619 | 20.2% |
| Parks and Recreation | 4,064 | 4,228 | 4,507 | 164 | 443 | 37.0% |
| All Other Civilians | 30,779 | 31,546 | 33,242 | 767 | 2,463 | 31.1% |
| Subtotal | 109,658 | 111,131 | 116,786 | 1,473 | 7,128 | 20.7% |
| Total | 300,442 | 301,940 | 307,175 | 1,498 | 6,733 | 22.2% |
Overtime
Overtime expenditures are projected at $1.330 billion in the FY 2021 Preliminary Budget. This is about 6 percent lower than the budgeted amount of $1.415 billion for FY 2020 and 21 percent lower than the Comptroller’s forecast of $1.673 billion for FY 2020. The City’s overtime projections for FYs 2020 and 2021 appear overly optimistic when compared to the average overtime cost of $1.736 billion over the last five fiscal years. The impact of ongoing initiatives to curtail the growth of overtime usage are having some positive impact and the Comptroller’s Office’s overtime estimates for FY 2020 and FY 2021 are below recent years’ overtime spending. However, as shown in Table 17, the Comptroller’s Office’s estimates are significantly higher than the City’s, resulting in risks to the overtime budget of approximately $258 million in FY 2020 and $262 million in FY 2021.
Table 17. Projected Overtime Spending, FY 2020 and FY 2021
| Plan Overtime | FY 2020 Comptroller’s Projection |
Risk | Plan Overtime | FY 2021 Comptroller’s Projection |
Risk | |
|---|---|---|---|---|---|---|
| Uniformed | ||||||
| Police | $544 | $600 | ($56) | $520 | $600 | ($80) |
| Fire | 218 | 245 | (27) | 206 | 225 | (19) |
| Correction | 151 | 151 | 0 | 151 | 151 | 0 |
| Sanitation | 132 | 132 | 0 | 110 | 110 | 0 |
| Total Uniformed | $1,045 | $1,128 | ($83) | $987 | $1,086 | ($99) |
| Civilians | ||||||
| Police-Civilian | $81 | $120 | $(39) | $80 | $110 | $(30) |
| Admin for Child Svcs | 15 | 45 | (30) | 10 | 40 | (30) |
| Environmental Protection | 45 | 45 | 0 | 46 | 46 | 0 |
| Transportation | 49 | 60 | (11) | 48 | 60 | (12) |
| All Other Agencies | 180 | 275 | (95) | 165 | 250 | (85) |
| Citywide OT Savings | 0 | 0 | 0 | (6) | 0 | (6) |
| Total Civilians | $370 | $545 | ($175) | $343 | $506 | ($163) |
| Total City | $1,415 | $1,673 | ($258) | $1,330 | $1,592 | ($262) |
Overtime projections for FY 2020 and FY 2021 in the January Plan are respectively $20 million and $24 million higher than in the November Plan. These changes stem mainly from upward revisions of $15 million and $25 million, respectively to FY 2020 and FY 2021 overtime estimates for the Department of Environmental Protection (DEP). The FY 2020 revision brings DEP’s FY 2020 budget to $45 million, modestly above the $43 million average between FY 2015 and FY 2019. The cost of civilian overtime continues to pose a higher risk to the overtime budget than overtime spending for uniformed employees. Civilian overtime cost has increased on average by 8.8 percent annually over the last five fiscal years from $424 million in FY 2014 to $645 million in FY 2019. The Comptroller’s Office projects risks to the civilian overtime budget of $175 million in FY 2020 and $163 million in FY 2021.
Uniformed overtime cost has remained relatively stable over the last five fiscal years, averaging just under $1.2 billion annually. In fact, uniformed overtime cost declined to $1.14 billion in FY 2019, from $1.19 billion in FY 2018. The Comptroller’s Office estimates that FY 2020 overtime cost will decline modestly to $1.13 billion, posing a risk to the City’s overtime budget of $83 million. This cost is expected to decline further in FY 2021 to $1.09 billion, but still above the City’s projection of $987 million. The City has been able to reduce its reliance on overtime to meet day-to-day operations at uniformed agencies because of increased uniformed headcount levels, particularly at the Police Department (NYPD), the Fire Department (FDNY) and the Department of Correction (DOC).
Health Insurance
The FY 2021 Preliminary Budget includes $7.38 billion for employees’ and retirees’ pay-as-you-go health insurance, an increase of $412 million or 5.9 percent over the adjusted health insurance cost for FY 2020. The increase from FY 2020 reflects projected premium rate increases of 3.0 percent for active employees and pre-Medicare retirees and 4.9 percent for the senior care rate.[12] As shown in Table 18, health insurance costs are then projected to increase to $8.07 billion in FY 2022, $8.76 billion in FY 2023 and $9.44 billion by FY 2024, growing at an annual rate of 8.5 percent. The outyear projections assume annual increases in health insurance premium rates of 6.5 percent in FY 2022, 6.25 percent in FY 2023 and 6.0 percent in FY 2024. Senior care rates are projected to increase by an average of 4.8 percent annually.[13]
Table 18. Pay-As-You-Go Health Expenditures
| ($ in millions) | FY 2020 | FY 2021 | FY 2022 | FY 2023 | FY 2024 |
|---|---|---|---|---|---|
| Department of Education | $2,625 | $2,833 | $3,092 | $3,391 | $3,681 |
| CUNY | 106 | 111 | 140 | 143 | 147 |
| All Other | 4,236 | 4,435 | 4,837 | 5,222 | 5,608 |
| Adjusted Pay-As-You-Go Health Insurance Costs | $6,967 | $7,379 | $8,069 | $8,756 | $9,437 |
Compared to the November Plan, health insurance projections are lower by $75 million in FY 2020 and $85 million in FY 2021. For FY 2022 and FY 2023, the projections increased by $47 million and $154 million, respectively. The revisions to the FY 2020 and FY 2021 projections resulted mainly from lower costs for retiree medical insurance. The City has been experiencing lower retirement rates than projected and accordingly, has lowered health projections by $50 million annually for FY 2020 and FY 2021 to reflect that trend. Additionally, fringe benefit adjustments and re-estimates in the DOE resulted in a downward revision to the department’s health insurance projections of approximately $25 million in FY 2020 and $33 million annually in FY 2021 through FY 2024.
Net increases to health insurance projections in the outyears result primarily from upward revisions to the budgeted health insurance premium rates for actives and pre-retirees. Health insurance premium rates were previously projected to increase by 5.5 percent in FY 2022 and by 5 percent in FY 2023 and beyond. The expected premium increases were revised in this Plan as discussed above, resulting in increased costs of $82 million in FY 2022, $189 million in FY 2023, and $282 million in FY 2024.
The health insurance projections incorporate savings from both the FY 2014 and FY 2018 Health Savings Agreements between the City and the Municipal Labor Coalition (MLC). Savings over the four-year period of the FY 2014 agreement exceeded the targeted savings of $3.4 billion by $86 million. The City and the MLC agreed to apply the additional savings and an additional $41 million of annual recurring savings to the FY 2019 goal of $200 million. Despite this, FY 2019 savings fell short of the FY 2018 Health Savings Agreement target of $193 million by $7 million. It is likely that this shortfall will be met with FY 2020 savings, which are expected to exceed its target.
Health insurance savings for FY 2020 are measured against a previously budgeted rate increase of 6.5 percent for the year. Savings from rate increases below 6.5 percent will be credited as savings against the FY 2020 target of $300 million. The FY 2020 rate increase for active employees and pre-Medicare retirees has been finalized at 3.49 percent. The rate increase for senior care has not been finalized but is budgeted at 4.9 percent. As such, it is likely FY 2020 health insurance savings will exceed its target, and the City would be able to achieve the cumulative savings of $500 million over FY 2019 and FY 2020.
Pensions
The January 2020 Financial Plan projects pension expenditures of $9.83 billion for FY 2021, a net increase of $108 million over the FY 2020 estimate. As shown in Table 19, pension contributions are then projected to increase to $10.35 billion by FY 2023 before declining to $10 billion by FY 2024. When compared to the November Plan, pension projections were lowered in the January Plan by $134 million in FY 2020, $174 million in FY 2021, $116 million in FY 2022 and $117 million in each of FY 2023 and FY 2024. This resulted primarily from a modification to the method used by the Office of the Actuary (OA) in funding the annual earnings of the Tax Deferred Annuity (TDA) 403(b) funds belonging to members of the Teachers’ Retirement System of the City of New York (TRS) and the Board of Education Retirement System of the City of New York (BERS).
The OA previously accounted for the guaranteed interest earnings of the TDA funds in a given fiscal year as an annual expense, similar to the way administrative expenses and benefit payments are accounted for in the respective pension systems. The OA will now deduct the TDA guaranteed earnings from the annual investment earnings of the pension systems, resulting in a reduced effective rate of actual investment return. Currently, pension expenditures are based on the assumption that pension investments will earn the actuarial interest rate assumption (AIRA) of 7 percent, and investment returns above or below the AIRA will, respectively, decrease or increase pension contributions.
Table 19. Changes to City Pension Contributions
| ($ in millions) | FY 2020 | FY 2021 | FY 2022 | FY 2023 | FY 2024 |
|---|---|---|---|---|---|
| Pension Expense November Plan | $9,853 | $10,001 | $10,426 | $10,463 | $10,117 |
| Change in Actuarial Method (TDA) | ($125) | ($125) | ($125) | ($125) | ($125) |
| Reversal of Future Actuarial Audit Reserve | 0 | (59) | 0 | 0 | 0 |
| Police Cadet Buyback/ Fire Presumption | 10 | 10 | 10 | 10 | 10 |
| All Other | (19) | 0 | (1) | (2) | (2) |
| Net Change | ($134) | ($174) | ($116) | ($117) | ($117) |
| Pension Expense January Plan | $9,719 | $9,827 | $10,310 | $10,346 | $10,000 |
Note: Numbers may not add due to rounding
The reductions to annual pension projections were offset by additional funding of $10 million annually to the pension reserve budget to fund the potential impact of recently enacted legislation which includes:
- Allowing New York City police officers who are currently TIER 3 Original, TIER 3 Revised or TIER 3 Enhanced members of the Police Pension Fund (PPF) to buy back pension service credits for years served as NYPD police cadets for purposes of determining initial membership date and tier and plan status.[14] Affected uniformed employees were eligible to join the New York City Employees Retirement System (NYCERS) as cadets but did not become members at that time. The cost to the City of this buyback is the additional employer contributions that will be paid to PPF as a result of these members shifting to an earlier Tier or different plan.
- Expanding the cancer presumption bill to grant accidental disability benefits to firefighters who developed cancer within five years of retirement, and who at the beginning of their career as a firefighter successfully passed physical examinations which showed no indication of any conditions which would have developed into cancer. Unless rebutted by the Fire Pension Fund’s medical board, affected retired firefighters who developed cancer will be granted accidental disability and his/her condition will be presumed to have developed as a result of conditions related to being a firefighter. Previously, the cancer presumption bill only applied to active firefighters.
Labor Settlements
On December 18, 2019, the City and the Uniformed Officers Coalition (UOC) announced a tentative labor agreement applicable to eight unions. The agreement covers a thirty-six-month contract period for each union and includes annual wage increases on the first day of each contract year of 2.25 percent, 2.5 percent, and 3.0 percent. When compared to the labor contract agreed to with DC 37, the UOC agreement is slightly more generous. The civilian pattern is over 43 months and includes annual wage increases of 2 percent on the first day of the contract period, 2.25 percent on the first day of thirteenth month, and 3 percent on the first day of the twenty-sixth month.
The City had previously included funds in the labor reserve for all uniformed contracts patterned after the DC 37 contract. As such, additional funds of $72 million in FY 2020, $75 million in FY 2021, $78 million in FY 2022, $85 million in FY 2023, and $100 million in FY 2024 were added to the labor reserve for uniformed employees based on the agreement with the UOC.
Before the contract agreements for each union represented by the UOC can be finalized and ratified, individual unions will meet with the City to work out a tentative agreement specific to that union while staying within the economic agreement agreed to by the UOC. The Captains Endowment Association (CEA), the Lieutenants Benevolent Association (LBA), and the Correction Officers’ Benevolent Association have announced tentative agreements with the City. The terms of these agreements include pattern conforming modifications which extend the contract periods to thirty-nine months for CEA, and thirty-nine months and fifteen days for LBA, and provide for service based differentials as described below.
CEA secured a 2.25 percent service wage differential for members above the wage increases to be granted within the UOC agreement.[15] Union members will receive two differentials that are pensionable but not added to their base salaries. Effective May 1, 2020, members with at least five years on the job will receive a differential of $1,285 and those in higher ranks will receive $1,379. Effective May 1, 2022, any member with at least twenty-five years of service in the NYPD will further receive another differential of $2,651. In addition, the first and second year salaries for police captains will receive a boost so that by the end of the contract, the starting salary for police captains would reach $142,758 compared to a current starting salary of $128,212.
LBA also secured the 2.25 percent service based differential for all union members in the form of two differential payments for members with at least five years as a lieutenant. The first payment of $1,694 is effective July 1, 2021 and the second payment of $1,355 is effective November 1, 2021. Even though the LBA agreed to extend the contract period, the members will receive their final wage increase on the first day of the final contract year as established within the UOC agreement.
By extending the contracts, the City is able to partially offset the additional costs for these agreements. Furthermore, the CEA members will give up one annual vacation day beginning January 1, 2022 and receive the third wage increase on the first day of the twenty-ninth month instead of the first day of the twenty-fifth month as agreed to within the UOC agreement. LBA, on the other hand, was able to apply a credit the union received for its members for participating in the NYPD’s body-camera program.
Similarly, COBA was able to use members’ credit for agreeing to wear body cameras on duty to partially fund costs associated with the additional 2.25 percent wage increase. The tentative agreement maintains the length of the contract period at thirty-six months as agreed to under the UOC agreement, but delays the second and third wage increases by three months. COBA members will receive their differential payments in the form of longevity improvements of $365 for members with at least five years of service and $1,277 for members with at least twenty years of service.
Labor contracts with five uniformed groups — the Police Benevolent Association (PBA), the Detectives’ Endowment Association (DEA), the Sergeants Benevolent Association (SBA), the Uniformed Firefighters Association (UFA), and the Uniformed Sanitationmen’s Association (USA) — remain unsettled. In the past, several of the PBA’s labor contracts were arbitrated and decided by the New York State Public Employment Relations Board (PERB). PERB has once again declared a bargaining impasse between the City and the PBA and has scheduled hearings to begin in late April.
Professional Staff Congress/CUNY
The tentative contract between the Professional Staff Congress (PSC) and The City University of New York (CUNY) has been approved by CUNY’s Board of Trustees and ratified by the union’s membership. The contract period will be for five years and three months from December 1, 2017, through February 28, 2023. Members will be granted annual wage increases of 2 percent as follows, except where modified for certain titles.
- 10/01/2018 – 2%
- 10/31/2019 – 2% compounded
- 11/15/2020 – 2% compounded
- 11/15/2021 – 2% compounded
- 11/01/2022 – 2% compounded
Adjunct lecturers and professors will receive an average increase of about 45 percent to their pay rates, which includes paid office hours for every course. By the end of the contract, the pay rate for adjunct lecturers at the lowest salary step will have increased by almost 71 percent from the current $3,222 to $5,500 for a three-credit course. Additionally, various lower-paid full-time titles, such as college laboratory technicians, entry-level higher education officer employees, lecturers, and full-time CUNY Start and CUNY Language Immersion Program (CLIP) instructors, will be granted equity raises.
The City, being responsible for funding wage increases at the community colleges, had previously reserved funds for expected wage increases patterned after the DC 37 contract. As noted earlier, the DC 37 contract is for a period of forty-four months and provided for annual wage increases of 2 percent on the first day of the contract, 2.25 percent on the first day of the thirteenth month, and 3 percent on the first day of the twenty-sixth month. PSC’s contract covers a period of 63 months and wage increases are granted towards the end of each contract year. Because of the timing of the wage increases, costs are lower than previously budgeted particularly at the beginning of the contract period and resulted in a reduction to the labor reserve of $15 million for FY 2020. The costs are higher in the outyears due to the longer term contract and the higher pay increases for adjunct professors and lower paid full-time titles. Consequently, the City added funds to the labor reserve of $10 million in FY 2021, $16 million in FY 2022, $35 million in FY 2023, and $41 million in FY 2024.
Public Assistance
Through January, the City’s public assistance caseloads have averaged 330,440 recipients per month in the current fiscal year, representing a decline of 5.5 percent, or 19,250 recipients from the monthly average during the same period in FY 2019. Public assistance caseloads have declined steadily over the past two years, reaching its lowest level of 325,585 in January since the caseload peaked in 1995. Monthly public assistance grants spending has also edged lower, though at a slower pace. Compared with the monthly average of $118 million over the same period in FY 2019, the FY 2020 year-to-date monthly average spending has thus far fallen by 2.4 percent to about $115 million.
The City currently maintains its FY 2020 public assistance caseload projection at a monthly average of 339,421, and 339,000 over the remainder of the Financial Plan, unchanged since the November Plan. Net baseline grants expenditures are projected at about $1.47 billion in FY 2020 and $1.48 billion annually in the outyears. Given that both caseload and spending are below projections, the City could realize underspending of at least $30 million in each year of the Plan.
Department of Education
The January Modification reflects a net increase of $298 million in the Department of Education (DOE) budget in the current year. The DOE budget now totals $28.31 billion in FY 2020, an increase of nearly 5 percent or $1.29 billion above actual FY 2019 spending of $27.02 billion. The current year increase in the January Modification is driven primarily by new needs of $150 million for special education Carter cases and $64 million for pupil transportation costs. In addition, the Department reflects Federal and State aid adjustments totaling $85 million. The highlights include increases of $36 million in State transportation aid, $34 million in State special education High Cost aid and $49 million in Federal Academic Enrichment grants, offset by a decline of $33 million in Federal professional development.
The FY 2021 Preliminary Budget projects DOE spending of $27.99 billion, a decline of $312 million or slightly over one percent from the FY 2020 budget. The decline is due to retroactive collective bargaining payments that have not yet been reflected in FY 2021. Compared to the November Plan, the Preliminary Budget shows a net decrease of $67 million. Only $19 million of the funding increases reflected in FY 2020, from Federal revenue and certain collective bargaining adjustments, has been extended into FY 2021 and beyond. This increase is more than offset by the Department’s CSP, which totals $86 million in revenue and savings. The main actions in the CSP include further reduction of the Absent Teacher Reserve pool through redeployment and future anticipated savings totaling $39 million, reduction of professional development funding of $31 million and various programmatic underspending totaling $16 million.
The State Executive Budget released in January proposes to increase formula-based school aid by $224 million to the City in the upcoming school year, including $223 million in Foundation Aid. Compared with the City’s education aid assumptions, the proposed school aid increase will fall short by $136 million in FY 2021. The State indicates that an additional $250 million in reserved funds mainly targeted for future distribution to high-need school districts, mostly as Foundation Aid, could provide the City with $97 million more in aid. If the State distributes these funds as proposed, the City’s education aid shortfall could be reduced to a smaller impact than the current $136 million estimate. Moreover, the legislature has traditionally provided additional school aid to districts during budget adoption. The State has also proposed to cap pupil transportation reimbursement and create a new tier of building aid for future projects with lower reimbursement rates. The City estimates these actions could lead to reduced transportation reimbursement of at least $30 million annually beginning in FY 2022 and building aid loss of $3 million starting in FY 2021, and would compound annually thereafter. In addition, the City could face significant impacts in the outyears from a proposal to allow openings of new charter schools to replace the same number of schools that no longer operate.
The DOE budget has not yet reflected potential costs from increased charter school tuition rates that will likely be approved by the State in the outyears. Unless the State provides additional reimbursement in future years, the City indicates that DOE could face risks of $150 million in FY 2021, $334 million in FY 2022, $562 million in FY 2023 and $709 million in FY 2024. While the City has addressed the growth of Carter cases spending in FY 2020 with a funding increase of $150 million in the January Plan, the budget for this program remains underfunded in the outyears and will likely require additional funding of $125 million annually. In addition, the DOE budget continues to reflect pupil transportation cost projections significantly below actual spending in FY 2019. The costs for school bus services have been funded by emergency extensions due to expired contracts. Without contracts in place, spending will likely continue at similar level and require additional funding of $50 million FY 2020 and $75 million in each of the outyears. The DOE also will likely face a risk of $20 million in each of FY 2020 – FY 2024 for Medicaid reimbursement for special education services. While the DOE’s Medicaid claiming process has improved over the years, the current assumptions include claims for transportation reimbursement of $20 million annually that have yet to be approved by the State. Finally, the Department may realize about $50 million in underspending annually in the special education pre-kindergarten program, which is budgeted at significantly higher levels than FY 2019 actuals. The City’s enrollment projection actually anticipates a decline in the number of children for this program in the current fiscal year.
Homeless Services
Spending on adult and family shelter in the Department of Homeless Services (DHS) is the primary driver of the City’s homelessness expenses. However, funding for homeless assistance is also, and increasingly, drawn from the budgets of other agencies, including the Department of Social Services, the Department of Youth and Community Development, the Department of Health and Mental Hygiene and the Department of Veterans Services.[16] Table 20 details changes in total funding for seven major categories of homeless services across these agencies, starting with FY 2014, which provides a baseline for homeless services spending at the start of the current mayoral administration, and extending to FY 2020 – FY 2023.
Table 20. Citywide Homeless Services Expenditures
| ($ in millions) | FY 2014 | FY 2020 | FY 2021 | FY 2022 | FY 2023 |
|---|---|---|---|---|---|
| Adult Shelter Operations | $326 | $671 | $644 | $644 | $644 |
| Family Shelter Operations | 505 | 1,176 | 1,149 | 1,149 | 1,149 |
| Rental Assistance | 215 | 556 | 540 | 533 | 533 |
| Prevention, Diversion, Anti-Eviction & Aftercare | 221 | 498 | 470 | 468 | 467 |
| Domestic Violence, Youth & Emergency Shelters | 69 | 112 | 111 | 111 | 111 |
| Homeless Administration & Support | 151 | 293 | 322 | 320 | 320 |
| Total Citywide Homeless Spending | $1,488 | $3,306 | $3,237 | $3,225 | $3,225 |
Note: Numbers may not add due to rounding
The Preliminary FY 2021 Budget has Citywide homeless services expenditures dropping by approximately $69 million compared to current FY 2020 spending amounts. This is the first budget of the current mayoral administration that proposes to reduce homeless services expenses. Since FY 2014, Citywide spending on homeless services has risen by over $1.8 billion while the overall shelter census has grown by nearly 8,500 individuals, increases of 122 percent and 16.5 percent respectively. However, the proposed reduction in homeless services expenditures comes on the heels of nearly 1,400 individuals exiting city shelters during the one year period from January 18, 2019 to January 18, 2020. More than 1,000 of those exits were children. As illustrated in the table above, decreases in the preliminary FY 2021 homeless services budget are planned for every category except for Homeless Administration and Support.
Shelter operations are the largest component of the City’s homeless services expenses, comprising some 59 percent of the homeless services budget in FY 2021. Planned spending reductions in FY 2021 in both shelter operations categories deserve scrutiny.
First, the City will continue a pattern of underestimating the cost of adult shelter operations in the next fiscal year by reducing City funds spending for adult shelter operations by $23 million in FY 2021. This decrease appears to rest on an assumption that the adult shelter population could fall in FY 2021. However, the momentum propelling the adult shelter census upwards over the last several years would need to dramatically turn. As Chart 9 illustrates, there has been a steady upward trajectory in the single adult shelter population. Barring any forthcoming policies to aggressively reduce the single adult shelter census, the Preliminary FY 2021 Budget for adult shelter operations appears to be insufficient. Even if the City is able to keep its adult shelter census at current levels, it is anticipated that at least $23 million in additional City funds will be necessary to meet adult shelter expenses.
Chart 9. Growth in the Single Adult Shelter Census, FY 2014 – FY 2020

Source – Single Adult shelter census on January 18th of each year as published by NYC Open Data.
Second, family shelter operations City-funds expenses are planned to decrease by $26 million in FY 2021. On the surface, this reduction appears plausible given the steady decline in the average number of individuals in families with children in shelter. The average number of total individuals in families with children in shelter dropped by 2.5 percent from FY 2017 to FY 2018, 3.0 percent from FY 2018 to FY 2019 and 2.4 percent from FY 2019 to FY 2020, as of January 18, 2020. However, despite these promising shelter census trends, City-funds spending on family shelter operations increased in these same time spans by 19.8 percent, 13 percent and 6.3 percent respectively — casting doubt on the likelihood of reducing family shelter costs based on population decreases alone. In the absence of new policies to scale down family shelter expenses, the Preliminary FY 2021 Budget for family shelter operations also appears to be insufficient.
Therefore, the Comptroller’s Office is projecting annual risks of $23 million for adult shelter operations and $26 million for family shelter operations beginning in FY 2021.
In the Prevention, Diversion, Anti-eviction, Aftercare and Other category, FY 2021 spending is planned to decrease by a cumulative $28.4 million in total-funds. This cutback is driven by a $40.8 million reduction for anti-eviction services, together with a $5 million drop in funding for the Homebase program. Offsetting factors include a planned increase of $17 million for the access to counsel program and a $1.9 million boost to the housing for homeless vets program in FY 2021, although increased funding for homeless veterans will not be sustained in the outyears.
Overall spending in the Rental Assistance category is set to drop by a total of $15.4 million in FY 2021. Much of this decline can be explained by a $26.3 million reduction in overall City rental assistance programs, however, increased spending for supportive housing is a major offsetting factor. Total expenses for supportive housing programs across the Department of Social Services, the Department of Housing Preservation and Development and the Department of Health and Mental Hygiene are planned to increase by nearly $12 million in FY 2021. A major component of that rise is a plan for the Department of Housing Preservation and Development to substantially boost funding for the NYC 15/15 supportive housing program which serves chronically homeless adults and other populations at risk of homelessness. In FY 2021, funding for this program will increase by $7.3 million, with an additional $10.7 million to be added in FY 2022 – FY 2024.
Changes made since the November Modification to FY 2020 spending levels in the Homeless Administration and Support category help to explain why that segment of the budget appears to increase in FY 2021. The January Plan shifts approximately $31.9 million in FY 2020 from general administration expenses within the Department of Homeless Services to fund shelter intake programming, mostly for adult populations but with some dedicated to families as well. Also within the Homeless Administration and Support category, total spending for outreach, drop-in and reception services at the Department of Homeless Services is slated to drop by 4.1 percent in FY 2021, despite the introduction of new street program initiatives for FY 2021, including new budget lines for drop-in centers, safe havens and other outreach initiatives.
One other notable change to the FY 2021 homeless services budget involves physical shelter conditions. Budget lines in the Department of Homeless Services grouped in the responsibility center for that agency’s maintenance, repair and capital construction needs are set to be reduced by a cumulative $3.8 million in FY 2021, with the steepest cutback planned for shelter compliance spending. In a related cutback, the Department of Social Services plans to eliminate a $2.3 million budget line in FY 2021 that had been dedicated to shelter repair in prior years.
NYC Health + Hospitals
In its latest financial plan update, NYC Health + Hospitals (H+H; formerly the Health and Hospitals Corporation, or HHC) projects ending the current fiscal year with a cash balance of $790 million. The revision represents a modest decline in H+H’s cash position from the previous cash plan update in the FY 2020 Executive Budget. The Financial Plan reflects baseline revenue increase of $707 million primarily from the timing of supplemental Medicaid revenues and delay of Disproportionate Share Hospitals (DSH) payment cut in the current year, enabling H+H to partly offset expense increases totaling $662 million and Transformation Plan reduction of $104 million. The higher expenses largely stem from collective bargaining increases and related fringe benefits and timing of certain non-personal services costs previously reflected in FY 2019. In addition, H+H has reduced the Transformation Plan savings in FY 2020 mainly by trimming its personnel reduction target to be more in line with headcount savings achieved in the prior year.
For the FY 2021 Preliminary Budget, the City currently projects H+H baseline cash receipts of $7.07 billion, a decline of roughly $645 million from FY 2020, against disbursements of $8.6 billion, before accounting for revenues and savings from the Transformation Plan. The revenue decline is primarily due to a reduction in supplemental Medicaid revenue, as scheduled cuts in Federal DSH payments are slated to begin in late May 2020. The Preliminary Budget reflects a baseline deficit of $1.52 billion for H+H in FY 2021, prior to the Transformation Plan. Over the remainder of the Plan, the baseline deficits for H+H are expected to increase to between $1.85 billion and $1.93 billion annually as baseline revenues remain stagnant while expenses are projected to rise by more than $350 million over the same period.
The majority of the projected deficits are expected to be offset by the Transformation Plan, with revenue enhancements making up nearly two-thirds of total plan values. The Transformation Plan provided about $1.08 billion in fiscal relief in FY 2019. These actions are expected to continue at higher levels of $1.32 billion in the current year before expanding to about $1.6 billion in each of FY 2021 – FY 2024. While H+H has had success with the program in the past, and current year projections appear to be on track, it remains to be seen if H+H can achieve the larger offsets in the outyears of the Plan. Adding to the mix of uncertainties is the large Medicaid deficit at the State level. Dealing with a deficit of about $4 billion in its Medicaid budget, the State’s Medicaid Redesign Team (MRT II) is tasked with developing $2.5 billion in savings initiatives before the new State fiscal year begins on April 1. The looming MRT reductions could pose significant cuts to H+H revenue projections. Already, the State has slashed Medicaid provider payment by one percent. H+H estimates the cut will result in a reduction $30 million in revenue for the coming year, which has not yet been reflected in the January Plan assumptions.
IV. Capital Budget and Financing Program
Capital Commitment Plan, FYs 2020-2024
The January 2020 Capital Commitment Plan for the five-year period FYs 2020 through FY 2024 totals $85.53 billion in authorized all-funds commitments, as shown in Table 21.[17] City-funds commitments account for $79.42 billion of the total. All-funds commitments decreased by $6.38 billion, or 8.4 percent, from the October 2019 Commitment Plan, largely due to a refinement in estimated commitments leading to a postponement or redistribution of commitments into FY 2024 and beyond.
All-Funds Commitments
All-funds commitments, after adjusting for the $8.23 billion reserve for unattained commitments, total $77.30 billion, or an average of $15.46 billion per year. Approximately 22 percent of all-funds commitments are scheduled for FY 2020, reflecting a relatively lower level of frontloading of the plan than has been the case in prior years.
Similar to past capital commitment plans, commitments for DOE and CUNY, the Department of Environmental Protection (DEP), the Department of Transportation (DOT) and Mass Transit, and Housing and Economic Development account for a majority of total commitments, with 64.3 percent of total commitments.[18]
Table 21. FYs 2020 – 2024 Capital Commitments, All-Funds
| Project Category | January FY 2020 – FY 2024 Commitment Plan | Percent of Total |
Change from October 2020 Plan |
|---|---|---|---|
| Education and CUNY | $18,984 | 22.2% | ($97) |
| Environmental Protection | 10,458 | 12.2% | (2,411) |
| Dept. of Transportation and Mass Transit | 12,355 | 14.4% | (1,084) |
| Housing and Economic Development | 13,162 | 15.4% | (742) |
| Administration of Justice | 9,965 | 11.7% | (85) |
| Resiliency, Technology and Equipment | 5,292 | 6.2% | (477) |
| Parks Department | 4,344 | 5.1% | (712) |
| Hospitals | 2,514 | 2.9% | 10 |
| Other City Operations and Facilities | 8,453 | 9.9% | (777) |
| Total Authorized Commitments | $85,527 | 100.0% | ($6,376) |
| Reserve for Unattained Commitments | ($8,231) | N/A | 1,209 |
| Total Net of Reserve for Unattained Commitments | $77,296 | N/A | ($5,167) |
Source: NYC Office of Management and Budget, FY 2020 – FY 2024 January Capital Commitment Plan, January 2020.
Note: Changes from October 2020 Plan are based on FY 2020 – FY 2023 only. Numbers may not add due to rounding.
The net decrease of $6.38 billion in authorized commitments from the October 2019 Plan is comprised of decreases of $257 million in FY 2020, $1.37 billion in FY 2021, $2.46 billion in FY 2022, and $2.28 billion in FY 2023.
The decrease of $257 million in estimated commitments in FY 2020 can be explained largely from the deferral of $281 million related to citywide resiliency, energy efficiency, and agency facility protective measure projects to the later part of the Plan, with a modest offset from a $24 million increase across 39 other project types.
The decrease of $1.37 billion is derived mainly from deferrals of $473 million in FY 2021 economic development commitments, $343 million in DEP water main related projects, and $302 million in DEP sewer related commitments.
The decrease of $2.46 billion in FY 2022 is driven by deferrals of $567 million in Parks Department projects, $523 million in highway bridges related commitments, $386 million in sewer related projects and $249 million in highways and street construction commitments, reflecting a more realistic time frame for project execution.
The decrease of $2.28 billion in FY 2023 reflects a decrease of $631 million in highway bridges estimates due largely to the delay in the BQE Cantilever project in Brooklyn. Other reductions include deferrals of $328 million in upstate watershed related projects, $281 million in miscellaneous water pollution control projects, and $200 million in highway construction and reconstruction projects in Queens. About 36 other project types had combined for a net decrease of approximately $845 million.
The January 2020 Capital Plan includes 755 new project IDs with a combined commitment of $2.34 billion. Of these, thirty-one project ID’s account for over 80 percent of the new commitments. Among these projects, the largest commitments are $1.24 billion for New York City Transit projects related to the MTA’s 2015 – 2019 capital program, $72 million for a new office facility for the Taxi and Limousine Commission, and $62 million for Correctional Health Services therapeutic units operated by H + H to be located at Woodhull Hospital in Brooklyn and Bellevue Hospital in Manhattan.
In addition, the City’s January Capital Commitment Plan included an update of the Ten-Year Capital Strategy (TYCS) by broad programmatic categories (Project Types). The updated TYCS sums to $125.7 billion, an increase of $8.8 billion, or 7.6 percent, from April 2019. The revised commitments in the TYCS reflect the rollover of FY 2019 commitments into FY 2020 and FY 2021 as well as the redistribution of commitments from FY 2020 – FY 2023 to FY 2024 – FY 2029. On average, the redistribution to the latter part of the Plan increased commitments in FY 2024 – FY 2029 by $1.57 billion per year. The largest increase was to New York City Transit related projects in the amount of $1.24 billion, followed by an increase of $956 million for Housing Authority related projects and $924 million for economic development related projects.
Financing Program
The January 2020 Financial Plan contains $57.10 billion of planned borrowing in FY 2020 – FY 2024, as shown in Table 22 on page 43. The borrowing is comprised of $24.47 billion of General Obligation (GO) bonds, $23.56 billion of Transitional Finance Authority (TFA-FTS) borrowing, $7.93 billion of New York Water Finance Authority (NYW) borrowing and $1.14 billion of borrowing from TFA Building Aid Revenue Bonds (BARB) that are supported by State school building aid revenues.
Table 22. January Plan FY 2020 Financing Program
| ($ in millions) | Estimated Borrowing and Funding Sources FY 2020 – FY 2024 |
Percent of Total |
|---|---|---|
| General Obligation Bonds | $24,470 | 42.9% |
| TFA – FTS Bonds | 23,560 | 41.3% |
| NYC Water Finance Authority | 7,926 | 13.9% |
| TFA – BARBs | 1,141 | 2.0% |
| Total | $57,097 | 100.0% |
SOURCE: NYC Office of Management and Budget, January 2020 Financial Plan.
Total projected borrowing in the January Plan for FY 2020 – FY 2023 is $1.63 billion less than the November 2019 Financial Plan estimate. This is a result of decreases of $133 million in FY 2020, $551 million in FY 2022 and $945 million in FY 2023. The largest decrease over this period is a drop of $906 million in NYW commitments due to re-forecast of capital commitments in the later fiscal years, followed by a $810 million decrease in TFA-FTS borrowing, and a $210 million decrease in GO borrowing. In contrast, TFA BARBs borrowing is projected to be $297 million higher over the period. These changes in borrowing across the four-major borrowing categories reduce total borrowing by approximately $400 million per year compared to the November 2019 Financing Plan, reflecting the reductions in the Capital Plan over FY 2020 – FY 2023.
Debt Service
As shown in Table 23, debt service, net of prepayments, in the January 2020 Plan totals $7.07 billion in FY 2020, $7.58 billion in FY 2021, $8.23 billion in FY 2022, $8.98 billion in FY 2023, and $9.44 billion in FY 2024. These amounts represent decreases from the November 2019 Financial Plan of $133 million in FY 2020, $12 million in FY 2021, $15 million in FY 2022, and $36 million in FY 2023. Between FY 2020 and FY 2024, total debt service is expected to increase by $2.38 billion, or 33.6 percent. These projections do not include debt service of the NYW, which is backed by water and sewer user fees, and that of the TFA BARBs, which is supported by New York State building aid.
Table 23. January 2020 Financial Plan Debt Service Estimates
| ($ in millions) | FY 2020 | FY 2021 | FY 2022 | FY 2023 | FY 2024 | Change FY 2020 – FY 2024 |
% Change FY 2020 – FY 2024 |
|
|---|---|---|---|---|---|---|---|---|
| GO | $3,951 | $4,126 | $4,460 | $4,813 | $5,153 | $1,202 | 30.4% | |
| TFAa | 2,906 | 3,248 | 3,572 | 3,946 | 4,094 | 1,188 | 40.9% | |
| Lease-Purchase | 126 | 126 | 126 | 147 | 119 | (7) | (5.8%) | |
| TSASC, Inc. | 82 | 82 | 76 | 76 | 76 | (6) | (7.3%) | |
| Total | $7,065 | $7,582 | $8,234 | $8,982 | $9,442 | $2,377 | 33.6% | |
Source: January 2020 Financial Plan.
Note: Debt service is adjusted for prepayments.
a Amounts do not include TFA – BARBs
The $133 million decrease in FY 2020 is due to GO savings of $66 million, and TFA savings of $67 million. The GO savings stem primarily from a $46 million reduction in estimated variable-rate interest costs, and $19 million in lowered letter of credit and remarketing fees. The decrease in TFA debt service results primarily from lower variable rate interest costs of $38 million, along with additional earnings on cash-on-hand and interest earnings on the TFA debt service fund for a combined amount of $19 million.
In FY 2021 the net decrease of $12 million reflects a $26 million reduction in TFA debt service, largely from lower than expected interest rates on borrowings to date and a decrease in its FY 2020 borrowing , offset by a $14 million increase in GO debt service from additional second-half FY 2020 borrowing.
The estimated $15 million decrease in FY 2022 stems from a $36 million decrease in TFA debt service from lowered TFA borrowing in FY 2020 and FY 2022, partially offset by GO debt service costs of $21 million from the continued impact of higher FY 2020 borrowing. Estimated net savings in FY 2023 of $36 million follow a similar pattern to that of FY 2022.
Debt Affordability
Debt service as a percent of local tax revenues and as a percent of total-funds revenues are commonly used measures of debt affordability.[19] In FY 2019, the City’s debt service was 10.5 percent of local tax revenues. The January 2020 Plan projects debt service will consume 10.9 percent of local tax revenues in FY 2020, 11.4 percent in FY 2021, 12.1 percent in FY 2022, 12.8 percent in FY 2023 and 13.1 percent in FY 2024, as shown in Chart 10.[20] The upward trend in the debt service to tax revenue ratio reflects the disparity between debt service and tax revenue growth rates over the Plan period. Debt service is projected to grow at an average annual rate of 7.5 percent from FY 2020 to FY 2024, while tax revenues during this period are projected to grow 2.6 percent annually. Based on an assumption of 4 percent annual tax revenue growth in FY 2025 – FY 2029, this ratio would climb to 13.6 percent, on average, over this period. If annual tax revenue growth over this period were to drop to 1.5 percent, the ratio would exceed the 15 percent threshold that is considered prudent, by FY 2028.
Chart 10. NYC Debt Service as a Percent of Tax Revenues
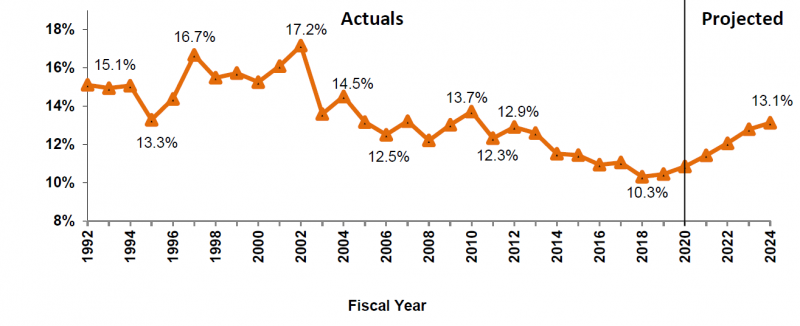
Source: Office of the NYC Comptroller, Comprehensive Annual Financial Reports, FY 1992 – FY 2019, and NYC Office of Management and Budget, January 2020 Financial Plan.
Debt service is also projected to grow at a faster rate than total revenues (including taxes, non-tax revenues, and Federal, State and other categorical aid) over the Plan period. As such, debt service is projected to consume an increasing share of total revenues as well. As shown in Chart 11, the City’s debt service as a percent of all-funds revenues is estimated to be 7.4 percent in FY 2020, 8.0 percent in FY 2021, 8.4 percent in FY 2022, 9.0 percent in FY 2023, and 9.3 percent in FY 2024. The debt service growth of 7.5 percent over the Financial Plan period is significantly higher than the projected total revenue growth of 1.6 percent, resulting in the growth of the ratio.
Chart 11. NYC Debt Service as a Percent of Total Revenues
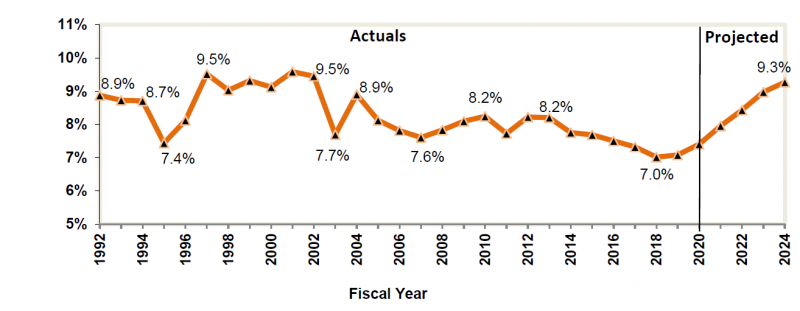
Source: Office of the NYC Comptroller, Comprehensive Annual Financial Reports, FY 1992 – FY 2018, and NYC Office of Management and Budget, January 2020 Financial Plan.
V. Appendix
Table A1. January 2020 Financial Plan Revenue Detail
| ($ in millions) | FY 2020 | FY 2021 | FY 2022 | FY 2023 | FY 2024 |
Change |
Annual Percent Change | |
|---|---|---|---|---|---|---|---|---|
| Dollars | Percent | |||||||
| Taxes: | ||||||||
| Real Property | $29,835 | $31,182 | $32,436 | $33,414 | $34,119 | $4,284 | 14.4% | 3.4% |
| Personal Income Tax | 13,734 | 13,812 | 14,300 | 14,813 | 15,327 | 1,593 | 11.6% | 2.8% |
| General Corporation Tax | 4,341 | 3,998 | 4,054 | 4,104 | 4,080 | (261) | (6.0%) | (1.5%) |
| Banking Corporation Tax | (18) | 0 | 0 | 0 | 0 | 18 | (100.0%) | (100.0%) |
| Unincorporated Business Tax | 1,993 | 2,073 | 2,129 | 2,193 | 2,263 | 270 | 13.5% | 3.2% |
| Sale and Use Tax | 8,354 | 8,620 | 8,924 | 9,208 | 9,521 | 1,167 | 14.0% | 3.3% |
| Real Property Transfer | 1,336 | 1,296 | 1,315 | 1,354 | 1,397 | 61 | 4.6% | 1.1% |
| Mortgage Recording Tax | 1,041 | 932 | 906 | 930 | 958 | (83) | (8.0%) | (2.1%) |
| Commercial Rent | 880 | 897 | 930 | 959 | 990 | 110 | 12.5% | 3.0% |
| Utility | 379 | 400 | 412 | 419 | 434 | 55 | 14.5% | 3.4% |
| Hotel | 638 | 643 | 650 | 658 | 669 | 31 | 4.9% | 1.2% |
| Cigarette | 29 | 28 | 27 | 26 | 25 | (4) | (13.8%) | (3.6%) |
| All Other | 811 | 811 | 811 | 811 | 811 | 0 | 0.0% | 0.0% |
| Tax Audit Revenue | 999 | 921 | 721 | 721 | 721 | (278) | (27.8%) | (7.8%) |
| Total Taxes | $64,352 | $65,613 | $67,615 | $69,610 | $71,315 | $6,963 | 10.8% | 2.6% |
| Miscellaneous Revenue: | ||||||||
| Licenses, Franchises, Etc. | $767 | $742 | $748 | $753 | $755 | ($12) | (1.6%) | (0.4%) |
| Interest Income | 155 | 164 | 203 | 224 | 224 | 69 | 44.5% | 9.6% |
| Charges for Services | 1,059 | 1,042 | 1,040 | 1,040 | 1,040 | (19) | (1.8%) | (0.5%) |
| Water and Sewer Charges | 1,589 | 1,573 | 1,555 | 1,549 | 1,549 | (40) | (2.5%) | (0.6%) |
| Rental Income | 258 | 246 | 243 | 243 | 243 | (15) | (5.8%) | (1.5%) |
| Fines and Forfeitures | 1,182 | 1,120 | 1,103 | 1,103 | 1,103 | (79) | (6.7%) | (1.7%) |
| Miscellaneous | 411 | 347 | 343 | 342 | 341 | (70) | (17.0%) | (4.6%) |
| Intra-City Revenue | 2,126 | 1,852 | 1,844 | 1,842 | 1,842 | (284) | (13.4%) | (3.5%) |
| Total Miscellaneous Revenue | $7,547 | $7,086 | $7,079 | $7,096 | $7,097 | ($450) | (6.0%) | (1.5%) |
| Unrestricted Intergovernmental Aid | $111 | $0 | $0 | $0 | $0 | ($111) | (100.0%) | (100.0%) |
| Reserve for Disallowance of Categorical Grants | ($15) | ($15) | ($15) | ($15) | ($15) | $0 | 0.0% | 0.0% |
| Less: Intra-City Revenue | ($2,126) | ($1,852) | ($1,844) | ($1,842) | ($1,842) | $284 | (13.4%) | (3.5%) |
| TOTAL CITY-FUNDS | $69,869 | $70,832 | $72,835 | $74,849 | $76,555 | $6,686 | 9.6% | 2.3% |
|
|
||||||||
| Other Categorical Grants | $1,006 | $874 | $864 | $863 | $861 | ($145) | (14.4%) | (3.8%) |
| Inter-Fund Agreements | $719 | $676 | $676 | $676 | $676 | ($43) | (6.0%) | (1.5%) |
| Federal Categorical Grants: | ||||||||
| Community Development | $911 | $314 | $282 | $254 | $254 | ($657) | (72.1%) | (27.3%) |
| Welfare | 3,382 | 3,346 | 3,343 | 3,343 | 3,343 | (39) | (1.2%) | (0.3%) |
| Education | 2,123 | 2,125 | 2,087 | 2,087 | 2,087 | (36) | (1.7%) | (0.4%) |
| Other | 1,742 | 1,328 | 1,298 | 1,292 | 1,287 | (455) | (26.1%) | (7.3%) |
| Total Federal Grants | $8,158 | $7,113 | $7,010 | $6,976 | $6,971 | ($1,187) | (14.6%) | (3.9%) |
| State Categorical Grants | ||||||||
| Social Services | $1,886 | $1,840 | $1,825 | $1,825 | $1,824 | ($62) | (3.3%) | (0.8%) |
| Education | 11,469 | 11,824 | 12,262 | 12,715 | 12,715 | 1,246 | 10.9% | 2.6% |
| Higher Education | 288 | 288 | 288 | 288 | 288 | 0 | 0.0% | 0.0% |
| Department of Health and Mental Hygiene | 591 | 500 | 501 | 501 | 501 | (90) | (15.2%) | (4.0%) |
| Other | 1,440 | 1,351 | 1,387 | 1,391 | 1,441 | 1 | 0.1% | 0.0% |
| Total State Grants | $15,674 | $15,803 | $16,263 | $16,720 | $16,769 | $1,095 | 7.0% | 1.7% |
| TOTAL REVENUES | $95,426 | $95,298 | $97,648 | $100,084 | $101,832 | $6,406 | 6.7% | 1.6% |
Note: Numbers may not add due to rounding.
Table A2. January 2020 Financial Plan Expenditure Detail
| ($ in millions) |
FY 2020 |
FY 2021 |
FY 2022 |
FY 2023 |
FY 2024 |
Change |
Annual |
|
|---|---|---|---|---|---|---|---|---|
| Dollars | Percent | |||||||
| Mayoralty | $168 | $155 | $155 | $152 | $152 | ($16) | (9.7%) | (2.5%) |
| Board of Elections | 255 | 131 | 131 | 131 | 131 | (124) | (48.6%) | (15.3%) |
| Campaign Finance Board | 28 | 14 | 14 | 14 | 14 | (14) | (48.6%) | (15.3%) |
| Office of the Actuary | 7 | 7 | 7 | 7 | 7 | 0 | 1.7% | 0.4% |
| President, Borough of Manhattan | 5 | 5 | 5 | 5 | 5 | (0) | (7.6%) | (2.0%) |
| President, Borough of Bronx | 6 | 6 | 6 | 6 | 6 | (1) | (8.7%) | (2.2%) |
| President, Borough of Brooklyn | 8 | 7 | 6 | 6 | 6 | (1) | (17.3%) | (4.6%) |
| President, Borough of Queens | 6 | 6 | 5 | 5 | 5 | (1) | (21.8%) | (6.0%) |
| President, Borough of Staten Island | 5 | 5 | 4 | 4 | 4 | (0) | (6.2%) | (1.6%) |
| Office of the Comptroller | 115 | 113 | 113 | 113 | 113 | (2) | (1.7%) | (0.4%) |
| Dept. of Emergency Management | 73 | 29 | 29 | 29 | 29 | (44) | (60.1%) | (20.5%) |
| Office of Administrative Tax Appeals | 6 | 6 | 6 | 6 | 6 | 0 | 0.8% | 0.2% |
| Law Dept. | 272 | 249 | 249 | 250 | 250 | (22) | (8.2%) | (2.1%) |
| Dept. of City Planning | 52 | 45 | 42 | 41 | 41 | (11) | (20.9%) | (5.7%) |
| Dept. of Investigation | 56 | 54 | 53 | 52 | 52 | (4) | (6.6%) | (1.7%) |
| NY Public Library — Research | 31 | 30 | 30 | 30 | 30 | (1) | (2.8%) | (0.7%) |
| New York Public Library | 155 | 150 | 150 | 150 | 150 | (5) | (3.3%) | (0.8%) |
| Brooklyn Public Library | 117 | 113 | 113 | 113 | 113 | (4) | (3.2%) | (0.8%) |
| Queens Borough Public Library | 122 | 118 | 118 | 118 | 118 | (4) | (3.2%) | (0.8%) |
| Dept. of Education | 28,305 | 27,993 | 28,936 | 29,760 | 30,157 | 1,852 | 6.5% | 1.6% |
| City University | 1,225 | 1,210 | 1,238 | 1,273 | 1,293 | 68 | 5.6% | 1.4% |
| Civilian Complaint Review Board | 20 | 20 | 20 | 20 | 20 | 1 | 3.1% | 0.8% |
| Police Dept. | 5,542 | 5,326 | 5,319 | 5,319 | 5,319 | (223) | (4.0%) | (1.0%) |
| Fire Dept. | 2,134 | 2,091 | 2,068 | 2,066 | 2,066 | (68) | (3.2%) | (0.8%) |
| Dept. of Veterans’ Services | 6 | 7 | 7 | 6 | 6 | 0 | 5.1% | 1.3% |
| Admin. for Children Services | 2,723 | 2,685 | 2,678 | 2,677 | 2,677 | (45) | (1.7%) | (0.4%) |
| Dept. of Social Services | 10,279 | 10,187 | 10,070 | 10,069 | 10,069 | (209) | (2.0%) | (0.5%) |
| Dept. of Homeless Services | 2,150 | 2,126 | 2,124 | 2,124 | 2,124 | (26) | (1.2%) | (0.3%) |
| Dept. of Correction | 1,330 | 1,318 | 1,326 | 1,326 | 1,326 | (4) | (0.3%) | (0.1%) |
| Board of Correction | 3 | 3 | 3 | 3 | 3 | (0) | (4.0%) | (1.0%) |
| Citywide Pension Contribution | 9,719 | 9,827 | 10,310 | 10,346 | 10,000 | 280 | 2.9% | 0.7% |
| Miscellaneous | 11,260 | 13,000 | 12,939 | 13,925 | 14,980 | 3,719 | 33.0% | 7.4% |
| Debt Service | 4,077 | 4,252 | 4,586 | 4,960 | 5,272 | 1,195 | 29.3% | 6.6% |
| T.F.A. Debt Service | 2,906 | 3,248 | 3,572 | 3,946 | 4,094 | 1,188 | 40.9% | 8.9% |
| FY 2019 BSA and Discretionary Transfers | (4,221) | 0 | 0 | 0 | 0 | 4,221 | (100.0%) | (100.0%) |
| FY 2020 BSA | 2,723 | (2,723) | 0 | 0 | 0 | (2,723) | (100.0%) | (100.0%) |
| Public Advocate | 5 | 5 | 4 | 4 | 4 | (0) | (0.7%) | (0.2%) |
| City Council | 88 | 56 | 56 | 56 | 56 | (31) | (35.6%) | (10.4%) |
| City Clerk | 6 | 6 | 6 | 6 | 6 | 0 | 0.6% | 0.2% |
| Dept. for the Aging | 431 | 385 | 384 | 384 | 384 | (47) | (10.9%) | (2.8%) |
| Dept. of Cultural Affairs | 213 | 148 | 151 | 151 | 151 | (62) | (29.0%) | (8.2%) |
| Financial Info. Serv. Agency | 115 | 112 | 112 | 112 | 112 | (3) | (2.5%) | (0.6%) |
| Office of Payroll Admin. | 16 | 16 | 16 | 16 | 16 | (1) | (3.1%) | (0.8%) |
| Independent Budget Office | 6 | 6 | 6 | 6 | 6 | (0) | (3.4%) | (0.9%) |
| Equal Employment Practices | 1 | 1 | 1 | 1 | 1 | 0 | 3.9% | 1.0% |
|
|
||||||||
| Civil Service Commission | 1 | 1 | 1 | 1 | 1 | 0 | 0.7% | 0.2% |
| Landmarks Preservation Commission | 7 | 7 | 7 | 7 | 7 | (0) | (2.9%) | (0.7%) |
| Taxi & Limousine Commission | 54 | 54 | 55 | 55 | 55 | 1 | 1.1% | 0.3% |
| Commission on Human Rights | 14 | 14 | 14 | 14 | 14 | (0) | (0.4%) | (0.1%) |
| Youth & Community Development | 829 | 610 | 611 | 611 | 611 | (219) | (26.4%) | (7.4%) |
| Conflicts of Interest Board | 3 | 3 | 3 | 3 | 3 | 0 | 0.8% | 0.2% |
| Office of Collective Bargaining | 2 | 2 | 2 | 2 | 2 | 0 | 0.7% | 0.2% |
| Community Boards (All) | 22 | 19 | 19 | 19 | 19 | (3) | (13.6%) | (3.6%) |
| Dept. of Probation | 114 | 114 | 116 | 116 | 116 | 2 | 1.6% | 0.4% |
| Dept. Small Business Services | 266 | 162 | 147 | 140 | 140 | (127) | (47.6%) | (14.9%) |
| Housing Preservation & Development | 1,289 | 999 | 1,016 | 998 | 998 | (292) | (22.6%) | (6.2%) |
| Dept. of Buildings | 210 | 200 | 196 | 191 | 191 | (18) | (8.7%) | (2.3%) |
| Dept. of Health & Mental Hygiene | 1,850 | 1,682 | 1,682 | 1,681 | 1,681 | (169) | (9.1%) | (2.4%) |
| NYC Health + Hospitals | 990 | 972 | 1,022 | 1,024 | 1,024 | 34 | 3.5% | 0.9% |
| Office of Administrative Trials & Hearings | 52 | 52 | 52 | 52 | 52 | 0 | 0.1% | 0.0% |
| Dept. of Environmental Protection | 1,488 | 1,398 | 1,383 | 1,373 | 1,373 | (115) | (7.7%) | (2.0%) |
| Dept. of Sanitation | 1,788 | 1,746 | 1,739 | 1,724 | 1,724 | (64) | (3.6%) | (0.9%) |
| Business Integrity Commission | 9 | 10 | 10 | 10 | 10 | 0 | 5.2% | 1.3% |
| Dept. of Finance | 329 | 315 | 315 | 315 | 315 | (14) | (4.3%) | (1.1%) |
| Dept. of Transportation | 1,151 | 1,117 | 1,127 | 1,129 | 1,130 | (21) | (1.9%) | (0.5%) |
| Dept. of Parks and Recreation | 542 | 483 | 488 | 488 | 489 | (54) | (9.9%) | (2.6%) |
| Dept. of Design & Construction | 324 | 168 | 165 | 165 | 165 | (160) | (49.2%) | (15.6%) |
| Dept. of Citywide Admin. Services | 539 | 522 | 539 | 530 | 530 | (8) | (1.6%) | (0.4%) |
| D.O.I.T.T. | 556 | 554 | 553 | 553 | 553 | (2) | (0.4%) | (0.1%) |
| Dept. of Record & Info. Services | 13 | 15 | 16 | 16 | 16 | 4 | 29.4% | 6.7% |
| Dept. of Consumer Affairs | 41 | 43 | 44 | 43 | 43 | 2 | 3.9% | 1.0% |
| District Attorney – N.Y. | 146 | 124 | 124 | 124 | 124 | (22) | (15.2%) | (4.0%) |
| District Attorney – Bronx | 93 | 91 | 91 | 91 | 91 | (2) | (2.0%) | (0.5%) |
| District Attorney – Kings | 124 | 119 | 119 | 119 | 119 | (5) | (3.9%) | (1.0%) |
| District Attorney –Queens | 79 | 76 | 76 | 76 | 76 | (2) | (3.1%) | (0.8%) |
| District Attorney – Richmond | 20 | 19 | 18 | 18 | 18 | (1) | (6.3%) | (1.6%) |
| Office of Prosec. & Special Narc. | 26 | 26 | 25 | 25 | 25 | (0) | (0.4%) | (0.1%) |
| Public Administrator – N.Y. | 1 | 1 | 1 | 1 | 1 | (0) | (13.6%) | (3.6%) |
| Public Administrator – Bronx | 1 | 1 | 1 | 1 | 1 | 0 | 0.5% | 0.1% |
| Public Administrator – Brooklyn | 1 | 1 | 1 | 1 | 1 | 0 | 0.9% | 0.2% |
| Public Administrator – Queens | 1 | 1 | 1 | 1 | 1 | 0 | 2.3% | 0.6% |
| Public Administrator – Richmond | 1 | 1 | 1 | 1 | 1 | 0 | 0.0% | 0.0% |
| Prior Payable Adjustment | (400) | 0 | 0 | 0 | 0 | 400 | (100.0%) | (100.0%) |
| General Reserve | 300 | 1,000 | 1,000 | 1,000 | 1,000 | 700 | 233.3% | 35.1% |
| Citywide Savings Initiatives | 0 | (31) | (45) | (47) | (47) | (47) |
NA |
NA |
| Energy Adjustment | 0 | 25 | 45 | 79 | 118 | 118 |
NA |
NA |
| Lease Adjustment | 0 | 37 | 75 | 114 | 155 | 155 |
NA |
NA |
| OTPS Inflation Adjustment | 0 | 0 | 56 | 111 | 167 | 167 |
NA |
NA |
| TOTAL EXPENDITURES | $95,426 | $95,299 | $100,081 | $102,770 | $104,491 | $9,065 | 9.5% | 2.3% |
Endnotes
[1] The Debt Service Ratio is the ratio of total required household debt payments to total disposable income. The Financial Obligations Ratio is a broader measure that includes rent payments on tenant-occupied property, auto lease payments, homeowners’ insurance, and property tax payments, in addition to debt payments.
[2] The lowest tier for 2019 includes industries where the average annual wage is less than $54,000, with an average wage of $38,969; the middle tier includes industries where the average annual wage ranges from $54,000 to $89,000 with an average of $72,975; and the highest tier includes industries where the average annual wage is greater than $89,000, averaging $188,551. Low income tier industries include much of retail, food and drinking establishments, nursing and residential care facilities, and some manufacturing. Middle income tier industries include apparel manufacturing, electronics and appliance stores; accommodations, administrative support services, and educational services. High income tier industries include hospitals, merchant wholesalers, telecommunications and utilities, professional and technical services, and finance. Source: Q2 2019 Quarterly Census of Employment and Wages (QCEW).
[3] Non-City funds revenues are increased by a total $47 million with increases of $32 million in Federal categorical grants, $13 million in State categorical grants and $2 million in interfund agreement revenues.
[4] At the time of this report, it is still too early to assess the impact of the coronavirus on the local economy and revenues. It is assumed for now that contagion will be contained and limited, although certain sectors like tourism are likely already feeling some impacts.
[5] Local reform to business taxes largely phased out the previous banking corporation tax which was replaced by the GCT.
[6] While there is some concern about the impact of the COVID-19 outbreak on tourism, it is too early to estimate its impact on New York City. Chinese visitors accounted for about 1.5 percent of the 65 million visitors to New York City in 2018.
[7] The 2016-17 Enacted New York State Budget enabled the State to reduce New York City sales tax collections by a combined $600 million in order recoup the saving the City achieved through the refinancing of Sales Tax Asset Receivable Corporation (STARC) bonds.
[8] New York State Department of Health, Medicaid Spending Global Cap Report, April through December 2019 (January 2020), p. 2, https://www.health.ny.gov/health_care/medicaid/regulations/global_cap/monthly/sfy_2018-2019/docs/april-december_2019_report.pdf.
[9] New York State Division of Budget, FY 2021 Executive Budget Financial Plan (January 2020), p. 101, https://www.budget.ny.gov/pubs/archive/fy21/exec/fp/fy21fp-ex.pdf.
[10] New York State Department of Health, March 2019 Regional Global Cap Report, https://www.health.ny.gov/health_care/medicaid/regulations/global_cap/regional/sfy_2018-2019/docs/mar_2019_reports.pdf.
[11] For reference, see New York State Office of Temporary and Disability Assistance, “Administrative Directive Memorandum” (June 18, 2019), http://otda.ny.gov/policy/directives/2019/ADM/19-ADM-06.pdf; and New York State Office of Temporary and Disability Assistance, “2019-2020 Child Welfare Thresholds for FFFS Allocations,” http://otda.ny.gov/policy/directives/2019/ADM/19-ADM-06-Attachment-3.pdf.
[12]The senior care rate is the premium the City pays to supplement shortfalls in Medicare benefits so that Medicare eligible retirees can maintain a similar level of benefits as active employees.
[13] Health Insurance premium rates are budgeted according to the projected increases reported in the Health Care Cost Trend Rate (HCCTR) as published in the City of New York Comprehensive Annual Financial Report of the Comptroller for the Fiscal Year Ended June 30, 2019.
[14] Original TIER 3 members joined the PPF between 7/1/2009 and 3/31/2012; TIER 3 Revised members joined between 4/1/2012 and 3/31/2017; TIER 3 Enhanced members joined on or after 4/1/2017.
[15] CEA members include NYPD officers in the ranks of Captain, Deputy Inspector, Inspector, Deputy Chief, and Surgeon,
[16] The Comptroller’s Office began measuring homeless services expenditures across multiple agencies for the first time during the FY 2016 budget cycle to provide a comprehensive overview of citywide, multi-agency spending on homelessness. As of the FY 2020 Executive Budget, a revision to the Comptroller’s homeless services construct includes new expense categories that have emerged since the original construct was formulated, refines the definition of shelter spending, and accounts for omissions in earlier versions. This updated approach to measuring homeless services spending provides the most comprehensive summary of the City’s homeless services expenditures to date. Therefore, broad changes in homeless services expenses compared to those published in earlier budget cycles should be interpreted with caution.
[17] The Commitment Plan is a schedule of anticipated capital contract registrations. Changes from the FY 2020 Adopted Capital Plan published in October 2019 are from FY 2020 – FY 2023 only. Estimates for FY 2024 were not included at that time.
[18] This percentage assumes all DOT project types, not just bridges and highways.
[19] Debt service in this discussion is adjusted to exclude prepayments.
[20] TSASC debt service is not included in this discussion as it is supported by dedicated tobacco settlement revenues.