Comments on New York City’s Preliminary Budget for Fiscal Year 2022 and Financial Plan for Fiscal Years 2021 – 2025
I. Executive Summary
Since the November Plan, there have been several positive developments which have implications for both the economic recovery and the City’s fiscal outlook. In December, Congress approved a second round of stimulus payments, renewed the Paycheck Protection Program, and extended unemployment insurance programs enacted through the CARES Act for an additional 11 weeks. In addition, the House passed a $1.9 trillion stimulus bill which, among other provisions, includes additional stimulus payments, extends the Pandemic Unemployment Assistance and Pandemic Emergency Unemployment Compensation programs, and provides $350 billion in relief for state and local governments. Finally, vaccination efforts against COVID-19 got underway in mid-December, which should provide a boost to the economy in 2021.
However, challenges to a full economic recovery remain. New York City was hit earlier and harder by the pandemic and has experienced a disproportionate share of the impact. Despite rebounding from April lows, seasonally adjusted December private employment in New York City is more than 600,000 jobs below the pre-pandemic peak and declined by over 31,000 in the last two months of 2020. Bars and restaurants, which had reopened with limited indoor capacity, closed to indoor service in December, and consumers’ willingness to dine outdoors has been dampened by colder temperatures, snow, and more virulent virus strains. Entertainment venues such as concerts, opera, ballet, dance, Broadway, fashion shows and sporting events remain closed, although the Governor authorized the re-opening of sports and entertainment events at reduced capacity in major stadiums and arenas with a capacity of 10,000 or more, beginning February 23rd, and the opening of movie theaters at 25 percent capacity beginning March 5th. At the same time, restaurants which had resumed indoor dining on February 12th were allowed to increase indoor dining capacity by 10 percent to 35 percent on February 26th.
It was against this backdrop of the promise of an improving economy from the second stimulus bill and the rollout of vaccination against the coronavirus that the City released its $92.29 billion Preliminary FY 2022 Budget. The Preliminary Budget is balanced and closes a $3.75 billion gap projected in November. Overall, tax revenues in the FY 2022 Preliminary Budget are $1.58 billion less than projected in the November Plan. Non-property taxes for FY 2022 are projected to be $923 million more in than the November Plan, reflecting stronger income and business tax receipts than previously anticipated. However, the impact of the pandemic on property values was greater than anticipated. The 2022 tentative roll released by the Department of Finance on January 15th showed a decline of 5.2 percent in market values, with Class 2 (multi-family residential) values declining by 8.0 percent on average, and Class 4 (commercial) property values dropping by a sharper 15.8 percent, on average; Class 1 (1- to 3-family homes) property values remained relatively flat with a slight increase of 0.8 percent. As a result, property tax revenues were reduced by about $2.5 billion annually, beginning FY 2022.
A sharper decline of $5.33 billion from the November Plan in City-funds expenditures in the Preliminary FY 2022 budget offsets the drop in tax revenue and balanced the budget. More than half of the reduction in City-funds spending is from an increase of $2.75 billion in the FY 2021 Budget Stabilization Account (BSA) for the prepayment of FY 2022 debt service. The BSA is funded with the anticipated FY 2021 budget surplus, and the increase in the BSA stems primarily from an increase of $1.67 billion in tax revenues and budget relief of $869 million from a new round of the Citywide Savings Program (CSP) in the January Plan.
Net of this reduction in debt service from the additional prepayment, FY 2022 City-funds expenditures are $2.61 billion less than estimated in November, with the new round of CSP accounting for $1.34 billion of the spending reduction. The remaining reduction in spending stem primarily from a reduction of $900 million in the General Reserve, the elimination of the $250 million Capital Stabilization Reserve, and pension contribution savings of $304 million from proposed changes to actuarial assumptions and methodology. These reductions are partially offset by a $181 million increase in City-funds agency spending, including the deferral of an additional $52 million of FY 2021 retroactive and welfare payments into FY 2022 (for a total of $691 million).
The Comptroller’s Office’s analysis of the January Plan has identified additional resources of $396 million in FY 2021 and risks to the budget ranging from $1.43 billion in FY 2022 to $2.61 billion in FY 2025. The additional resources in FY 2021 results from the Comptroller’s Office’s higher tax revenue forecasts which offsets the expenditure risks identified by the Office. Risks to the budget in the outyears of the Plan are driven by the Comptroller’s Office’s higher expenditure estimates, with a modestly higher tax revenue estimate mitigating some of the risks in FY 2022, and lower tax revenues adding to the expenditure risks in FY 2023 through FY 2025. As a result, the Comptroller’s Office projects an additional budget surplus of $396 million in FY 2021, but larger gaps of $1.43 billion in FY 2022, $6.44 billion in FY 2023, $6.48 billion in FY 2024, and $6.89 billion in FY 2025.
The January Plan does not reflect potential Federal budget relief from actions taken by the Biden administration. The January Plan assumes FEMA reimbursement for 75 percent of eligible expenditures; since the release of the January Plan, however, the President has signed an executive order authorizing FEMA to reimburse the entire cost of eligible COVID related spending, retroactive to spending since the onset of the pandemic. The additional reimbursement, which is estimated to provide an additional $1 billion of FEMA funding to the City, will allow the City to rescind or reduce some of the service reductions in the Plan and use the balance towards budget relief. In addition, the House passed a $1.9 trillion stimulus bill which includes $350 billion in relief to states and local governments, including a reported $5.6 billion to New York City. However, the State Executive Budget includes provisions to shift costs to the City, including the use of STAR reimbursement to offset some of the Federal relief. Since many of these cost shifts extend beyond the expiration of Federal COVID relief, the State Executive Budget if adopted as proposed, would have a negative impact on the City in the long run.
Table 1. FY 2021 – FY 2025 Financial Plan
| ($ in millions) | FY 2021 | FY 2022 | FY 2023 | FY 2024 | FY 2025 | Change FYs 2021 –2025 Dollar Percent |
|
| Revenues | |||||||
| Taxes: | |||||||
| General Property Tax | $30,844 | $29,522 | $30,192 | $30,619 | $31,027 | $183 | 0.6% |
| Other Taxes | 29,044 | 31,749 | 33,891 | 35,404 | 36,830 | 7,786 | 26.8% |
| Tax Audit Revenues | 1,171 | 921 | 721 | 721 | 721 | (450) | (38.4%) |
| Subtotal: Taxes | $61,059 | $62,192 | $64,804 | $66,744 | $68,578 | $7,519 | 12.3% |
| Miscellaneous Revenues | 7,265 | 6,790 | 6,777 | 6,777 | 6,775 | (490) | (6.7%) |
| Less: Intra-City Revenues | (2,061) | (1,811) | (1,807) | (1,806) | (1,806) | 255 | (12.4%) |
| Disallowances Against Categorical Grants | (15) | (15) | (15) | (15) | (15) | 0 | 0.0% |
| Subtotal: City-Funds | $66,248 | $67,156 | $69,759 | $71,700 | $73,532 | $7,284 | 11.0% |
| Other Categorical Grants | 1,133 | 1,020 | 988 | 986 | 985 | (148) | (13.1%) |
| Inter-Fund Revenues | 695 | 706 | 656 | 656 | 656 | (39) | (5.6%) |
| Federal Categorical Grants | 11,866 | 7,076 | 6,946 | 6,929 | 6,924 | (4,942) | (41.6%) |
| State Categorical Grants | 15,111 | 16,327 | 16,765 | 16,814 | 16,814 | 1,703 | 11.3% |
| Total Revenues | $95,053 | $92,285 | $95,114 | $97,085 | $98,911 | $3,858 | 4.1% |
| Expenditures | |||||||
| Personal Service | |||||||
| Salaries and Wages | $29,179 | $29,684 | $30,017 | $30,288 | $30,751 | $1,572 | 5.4% |
| Pensions | 9,503 | 10,263 | 10,468 | 10,660 | 10,597 | 1,094 | 11.5% |
| Fringe Benefits | 11,130 | 11,579 | 12,242 | 13,045 | 13,819 | 2,689 | 24.2% |
| Retiree Health Benefits Trust | (1,600) | 0 | 0 | 0 | 0 | 1,600 | (100.0%) |
| Subtotal-PS | $48,212 | $51,526 | $52,727 | $53,993 | $55,167 | $6,955 | 14.4% |
| Other Than Personal Service | |||||||
| Medical Assistance | $5,553 | $5,915 | $5,915 | $5,915 | $5,915 | $362 | 6.5% |
| Public Assistance | $1,611 | $1,651 | $1,650 | $1,650 | $1,650 | $39 | 2.4% |
| All Other | $35,692 | $30,904 | $31,207 | $31,454 | $31,634 | ($4,058) | (11.4%) |
| Subtotal-OTPS | $42,856 | $38,470 | $38,772 | $39,019 | $39,199 | ($3,657) | (8.5%) |
| Debt Service | |||||||
| Principal | $3,263 | $3,765 | $4,225 | $4,110 | $2,398 | ($865) | (26.5%) |
| Interest & Offsets | $3,194 | $3,593 | $4,258 | $4,711 | $6,981 | $3,787 | 118.6% |
| Subtotal Debt Service | $6,457 | $7,358 | $8,483 | $8,822 | $9,379 | $2,922 | 45.3% |
| FY 2020 BSA | ($3,819) | $0 | $0 | $0 | $0 | $3,819 | (100.0%) |
| FY 2021 BSA | $3,358 | ($3,358) | $0 | $0 | $0 | ($3,358) | (100.0%) |
| Capital Stabilization Reserve | $0 | $0 | $250 | $250 | $250 | $250 | NA |
| General Reserve | $50 | $100 | $1,000 | $1,000 | $1,000 | $950 | 1,900.0% |
| Less: Intra-City Expenses | ($2,061) | ($1,811) | ($1,807) | ($1,806) | ($1,806) | $255 | (12.4%) |
| Total Expenditures | $95,053 | $92,285 | $99,425 | $101,278 | $103,189 | $8,136 | 8.6% |
| Gap to be Closed | $0 | $0 | ($4,311) | ($4,193) | ($4,278) | ($4,278) | NA |
Note: Numbers may not add to totals due to rounding.
Table 2. Plan-to-Plan Changes
January 2021 Plan vs. November 2020 Plan
| ($ in millions) | FY 2021 | FY 2022 | FY 2023 | FY 2024 |
| Revenues | ||||
| Taxes: | ||||
| General Property Tax | ($8) | ($2,479) | ($2,671) | ($2,607) |
| Other Taxes | 1,427 | 723 | 812 | 1,409 |
| Tax Audit Revenues | 250 | 200 | 0 | 0 |
| Subtotal: Taxes | $1,669 | ($1,556) | ($1,859) | ($1,198) |
| Miscellaneous Revenues | 240 | (31) | (32) | (33) |
| Less: Intra-City Revenues | (23) | 5 | 5 | 5 |
| Disallowances Against Categorical Grants | 0 | 0 | 0 | 0 |
| Subtotal: City-Funds | $1,886 | ($1,582) | ($1,886) | ($1,226) |
| Other Categorical Grants | 68 | 22 | 0 | 0 |
| Inter-Fund Revenues | (1) | 52 | 0 | 0 |
| Federal Categorical Grants | $909 | $82 | $15 | $4 |
| State Categorical Grants | 169 | 42 | 33 | 33 |
| Total Revenues | $3,031 | ($1,384) | ($1,838) | ($1,189) |
| Expenditures | ||||
| Personal Service | ||||
| Salaries and Wages | ($218) | ($643) | ($487) | ($495) |
| Pensions | (429) | (303) | (70) | 350 |
| Fringe Benefits | (12) | 7 | 5 | 4 |
| Retiree Health Benefits Trust | 0 | 0 | 0 | 0 |
| Subtotal-PS | ($659) | ($939) | ($552) | ($141) |
| Other Than Personal Service | ||||
| Medical Assistance | $315 | $0 | $0 | $0 |
| Public Assistance | (15) | 0 | 0 | 0 |
| All Other | 952 | 0 | 40 | 42 |
| Subtotal-OTPS | $1,252 | $0 | $40 | $42 |
| Debt Service | ||||
| Principal | $0 | ($131) | $39 | $36 |
| Interest & Offsets | ($215) | ($195) | ($25) | ($40) |
| Subtotal Debt Service | ($215) | ($326) | $14 | ($4) |
| FY 2020 BSA | $0 | $0 | $0 | $0 |
| FY 2021 BSA | $2,726 | ($2,726) | $0 | $0 |
| Capital Stabilization Reserve | $0 | ($250) | $0 | $0 |
| General Reserve | ($50) | ($900) | $0 | $0 |
| Less: Intra-City Expenses | ($23) | $5 | $5 | $5 |
| Total Expenditures | $3,031 | ($5,136) | ($493) | ($98) |
| Gap to be Closed | $0 | $3,752 | ($1,345) | ($1,091) |
Table 3. Plan-to-Plan Changes
January 2021 Plan vs. June 2020 Plan
| ($ in millions) | FY 2021 | FY 2022 | FY 2023 | FY 2024 |
| Revenues | ||||
| Taxes: | ||||
| General Property Tax | ($8) | ($2,479) | ($2,671) | ($2,607) |
| Other Taxes | 2,175 | 723 | 812 | 1,409 |
| Tax Audit Revenues | 250 | 200 | 0 | 0 |
| Subtotal: Taxes | $2,417 | ($1,556) | ($1,859) | ($1,198) |
| Miscellaneous Revenues | 305 | (54) | (52) | (52) |
| Less: Intra-City Revenues | (219) | 26 | 27 | 28 |
| Disallowances Against Categorical Grants | 0 | 0 | 0 | 0 |
| Subtotal: City-Funds | $2,503 | ($1,584) | ($1,884) | ($1,222) |
| Other Categorical Grants | 158 | 31 | 0 | 0 |
| Inter-Fund Revenues | 18 | 31 | (19) | (19) |
| Federal Categorical Grants | 4,496 | 110 | 24 | 12 |
| State Categorical Grants | (314) | 43 | 26 | 26 |
| Total Revenues | $6,861 | ($1,369) | ($1,853) | ($1,203) |
| Expenditures | ||||
| Personal Service | ||||
| Salaries and Wages | ($570) | ($288) | ($519) | ($527) |
| Pensions | (429) | (219) | 94 | 590 |
| Fringe Benefits | 565 | 123 | (13) | (15) |
| Retiree Health Benefits Trust | 0 | 0 | 0 | 0 |
| Subtotal-PS | ($434) | ($384) | ($438) | $48 |
| Other Than Personal Service | ||||
| Medical Assistance | $315 | $0 | $0 | $0 |
| Public Assistance | (17) | 0 | 0 | 0 |
| All Other | 4,821 | (35) | 54 | 55 |
| Subtotal-OTPS | $5,119 | ($35) | $54 | $55 |
| Debt Service | ||||
| Principal | ($455) | ($203) | $147 | $43 |
| Interest & Offsets | (458) | (445) | (375) | (367) |
| Subtotal Debt Service | ($913) | ($648) | ($228) | ($323) |
| FY 2020 BSA | $0 | $0 | $0 | $0 |
| FY 2021 BSA | $3,358 | ($3,358) | $0 | $0 |
| Capital Stabilization Reserve | $0 | ($250) | $0 | $0 |
| General Reserve | ($50) | ($900) | $0 | $0 |
| Less: Intra-City Expenses | ($219) | $26 | $27 | $28 |
| Total Expenditures | $6,861 | ($5,549) | ($585) | ($192) |
| Gap To Be Closed | $0 | $4,180 | ($1,268) | ($1,011) |
Note: Numbers may not add to totals due to rounding.
Table 4. Risks and Offsets to the January 2021 Financial Plan
($ in millions, positive numbers decrease the gap and negative numbers increase the gap)
| FY 2021 | FY 2022 | FY 2023 | FY 2024 | FY 2025 | |
| City Stated Gap | $0 | $0 | ($4,311) | ($4,193) | ($4,278) |
| Tax Revenues | |||||
| Personal Income Tax | $495 | $29 | ($237) | ($77) | ($51) |
| Business Taxes | 350 | (40) | (178) | (187) | (173) |
| Sales Tax | 24 | 66 | 89 | 142 | 131 |
| Real Estate Transaction Taxes | (1) | 15 | (274) | (465) | (634) |
| Audit | 0 | 0 | 200 | 200 | 200 |
| Subtotal Tax Revenues | $868 | $70 | ($400) | ($387) | ($527) |
| Expenditures | |||||
| Overtime | ($287) | ($107) | ($130) | ($130) | ($130) |
| Charter School Tuition | 0 | (154) | (282) | (433) | (600) |
| Carter Cases | 0 | (150) | (150) | (150) | (150) |
| Pupil Transportation | 0 | (75) | (75) | (75) | (75) |
| DOE Medicaid Reimbursement | (20) | (20) | (20) | (20) | (20) |
| Pre-K Special Education | 50 | 50 | 50 | 50 | 50 |
| Fair Fares | 0 | (47) | (100) | (100) | (100) |
| Homeless Shelters | 0 | (12) | (12) | (12) | (12) |
| Labor Savings | (290) | (1,000) | (1,000) | (1,000) | (1,000) |
| Paratransit Funding | 0 | (81) | (111) | (130) | (150) |
| VRDB Interest Savings | 25 | 100 | 100 | 100 | 100 |
| General Reserve | 50 | 0 | 0 | 0 | 0 |
| Subtotal | ($472) | ($1,496) | ($1,730) | ($1,900) | ($2,087) |
| Total (Risks)/Offsets | $396 | ($1,426) | ($2,130) | ($2,287) | ($2,614) |
| Restated (Gap)/Surplus | $396 | ($1,426) | ($6,441) | ($6,480) | ($6,892) |
Note: Numbers may not add to totals due to rounding.
II. The City’s Economic Outlook
The Economy in 2020
In response to the onset of the COVID-19 pandemic, governments around the world restricted economic activity and encouraged social distancing in order to slow the spread of the virus and prevent hospitals from being overwhelmed. Large gatherings were restricted, travel and tourism collapsed, sports and entertainment venues closed.
In the U.S., restrictions varied greatly by state and locality, but containment measures brought a decisive end to 10 years of economic expansion as the U.S. economy shrank at an annualized rate of 31.4 percent in the 2nd quarter, the sharpest decline on record. Office workers switched to remote work, and many lower-income service workers lost their jobs, particularly in the nation’s cities, as their workplaces closed and wary consumers stayed home. Seasonally adjusted U.S. employment fell from 152 million in February 2020 to 130 million in April, and the unemployment rate rose from 3.5 percent to 14.8 percent over the same period.
In response, the Federal government passed the $2.2 trillion CARES Act, the largest economic stimulus package in the nation’s history, on March 27th. It included direct stimulus payments to Americans, industry loans, small business loans, and expanded eligibility and benefits for U.S. unemployment insurance programs, and helped millions of Americans endure.
Increased COVID testing capacity, public behavior changes, and warmer weather held infections down over the summer and allowed significant economic reopening in the third quarter, with the U.S. economy rebounding at the annualized rate of 33.4 percent.
But, with the return of colder weather and the pandemic reaching rural areas of the country that earlier had been spared, COVID infections resurged and the economic recovery stalled toward the end of the year with new job losses and rising unemployment insurance claims. December U.S. employment ended the year at 142.6 million, down almost 10 million from February 2020 and down over 200,000 from November.
The year ended on a hopeful note, with the U.S. Food and Drug administration approving new COVID vaccines by Moderna and Pfizer in mid-December. And in the final week of the year, Congress approved a second round of stimulus payments, renewed the Paycheck Protection Program, and extended unemployment insurance programs enacted through the CARES Act for an additional 11 weeks.
U.S. Economic Outlook
Despite falling COVID infections, positive test and hospitalization rates, and deaths, which peaked over the year-end holidays, a full U.S. reopening and economic recovery depends very much upon an effective vaccination program. U.S. vaccination efforts got off to a slow start with widespread logistical and distribution issues, and restrictions on eligibility limiting the number of people getting vaccinated. As of February 10th, the U.S. had distributed 66 million vaccine doses, of which 45 million had been administered.[1]
While many local distribution issues have been addressed, fundamental constraints on the quantity of vaccines available for near-term distribution remain. In the first quarter of 2021 supplies will likely remain inadequate to expand vaccination beyond front-line healthcare workers, first responders and seniors. This shortage of available vaccines will highlight inequities in vaccine distribution that mirror other social and economic inequities in the U.S. economy.
Vaccination of these priority populations should enable infections, positive test rates, hospitalization and deaths to continue falling through the first quarter, although new, and more contagious strains bring the risk of yet another U.S. COVID resurgence, as has been experienced by countries including the U.K and South Africa. Absent widespread outbreaks of new strains, increasing vaccinations and warmer weather should allow a gradual resumption of economic and employment growth later in the first quarter.
In the second quarter of 2021, vaccine availability should increase dramatically, through both expanded manufacturing capacity of already approved vaccines by Moderna and Pfizer, and through the approval of new vaccines, such as those from Johnson & Johnson and AstraZeneca. Johnson and Johnson’s single dose vaccine was submitted for F.D.A. emergency use authorization on February 4th, with approval expected before the end of the month.
Increased vaccine supplies will bring expanded vaccine eligibility and should allow most Americans to be vaccinated by the end of the second quarter. This will bring a dramatically accelerated economic recovery, and a return to a more normal life, albeit in a changed world where remote work and online shopping retain increased importance, and where the economic damage from the pandemic has fallen hardest on those with the least means to bear it.
While the country awaits increased vaccine availability, the Biden administration is currently negotiating with Congress on the scope of a third round of economic stimulus that, together with the possibility of resurgence from new COVID strains, will shape the direction of the first quarter economy.
New York City’s Economic Condition and Outlook
New York City was hit earlier and harder by the pandemic and has experienced a disproportionate share of the impacts. Despite rebounding from April lows, seasonally adjusted December private employment in New York City remains 605,000 below the pre-pandemic peak and declined by over 19,000 from November.
Table 5. New York City Employment Changes as of Decemeber
| (Seasonally Adjusted, thousands) | December Employment | Change from Feb. 2020 Peak | Change from April 2020 Lows | Change from November |
| Total Private Employment | 3,481 | (605) | 269 | (19) |
| Finance and Insurance | 329 | (16) | (10) | 1 |
| Real Estate | 125 | (11) | 5 | 1 |
| Information | 210 | (2) | 11 | 4 |
| Professional, Scientific, and Technical Services | 403 | (35) | (7) | (1) |
| Management of Companies and Enterprises | 70 | (7) | 0 | (0) |
| Administrative Services | 234 | (58) | 19 | 1 |
| Employment Services | 109 | (21) | 9 | 1 |
| Educational Services | 211 | (36) | (5) | (4) |
| Health Care and Social Assistance | 783 | (44) | 58 | 1 |
| Arts, Entertainment, and Recreation | 30 | (60) | (4) | (2) |
| Accommodation and Food Services | 199 | (170) | 69 | (14) |
| Other Services | 161 | (39) | 21 | (2) |
| Retail Trade | 299 | (43) | 45 | (2) |
| Wholesale Trade | 119 | (20) | 2 | 0 |
| Transportation and Warehousing | 106 | (26) | 7 | (1) |
| Utilities | 15 | (1) | 0 | (0) |
| Construction | 135 | (24) | 51 | (2) |
| Manufacturing | 54 | (13) | 6 | 1 |
Source: N.Y. Dept. of Labor, seasonally adjusted by NYC OMB
Job losses were concentrated in industries providing in-person services: accommodation and food services, arts and entertainment, and retail. Industries such as securities, professional services and information avoided shutdowns by transitioning to remote work and were spared large-scale job losses.
This combination has exacerbated existing economic disparities, as the New York City industries spared from closures and job losses pay higher salaries, and industries providing in-person services disproportionately employ people of color at lower wages. New York City’s unemployment rate spiked from 3.4 percent in February 2020 to 20.4 percent in June, falling gradually to 11.0 percent in December. Unemployment rates for black, Hispanic and Asian New Yorkers peaked higher, at over 25 percent for Hispanic residents, and remain elevated. 3-month average unemployment rates in December 2020 were 14.3 percent for black workers, 14.0 percent for Hispanic workers, 11.3 percent for Asian workers, and 9.4 percent for white workers in New York City (Chart 1).
Chart 1. NYC 2020 Employment Rates by Race/Ethnicity
(3-Month Average, Not Seasonally Adjusted)
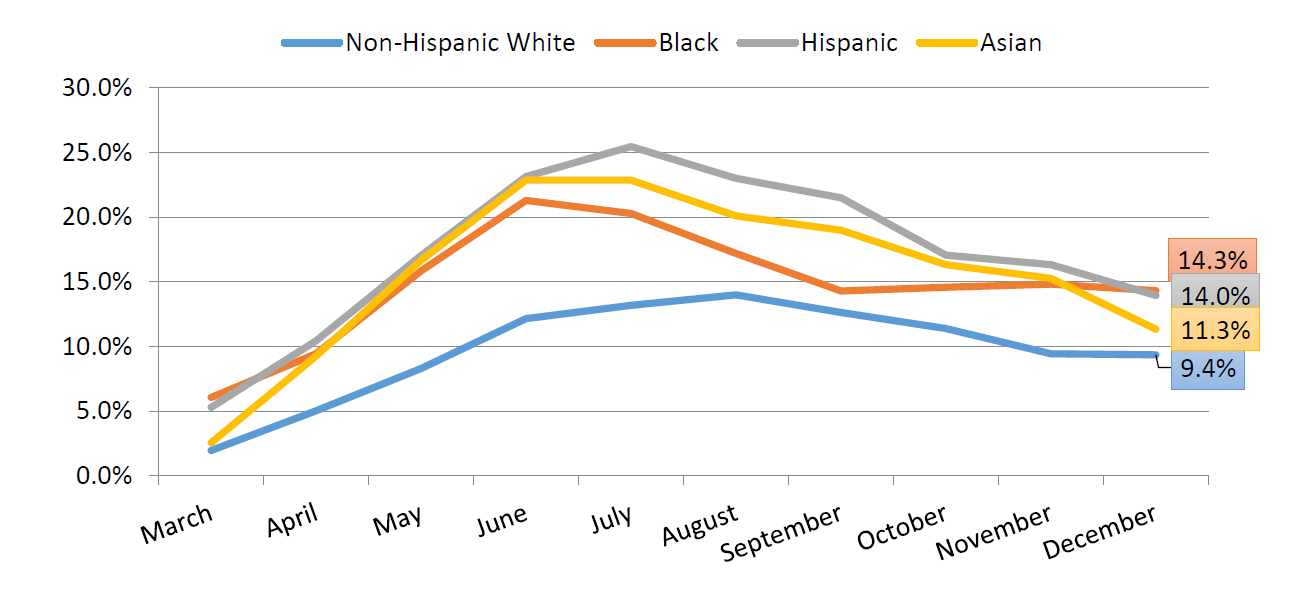
Source: Current Population Survey
Manhattan office buildings remain largely empty, as office workers switched to telecommuting in March, and have yet to return in significant numbers.
Bars and restaurants which had reopening with limited indoor capacity, closed to indoor service in December, and consumer’s willingness to dine outdoors has been dampened by colder temperatures, snow, and more virulent virus strains. Entertainment venues such as concerts, opera, ballet, dance, Broadway, fashion shows and sporting events remain closed. Art galleries and museums are open, but at reduced capacity. In short, most of the amenities that make New York City a desirable place to live, particularly for the wealthy, and a world class destination for people from around the country and around the world, are closed.
With the City’s cultural amenities closed, and the country still closed to most foreign travel, tourists continue to stay home, business travelers meet virtually instead, and New York City hotels remain largely unvisited. New York City retail stores, deprived of the patronage of both commuting office workers and out-of-town visitors, continue to suffer from reduced sales, and many have closed.
But not all is as bleak as it seems. New COVID cases, perhaps the strongest leading indicator of economic activity over the past year, have been falling since early January. New York City’s positive test rate peaked at 9.7 percent on January 3rd, and has since fallen closer to 8 percent. Seven-day average new cases per day peaked at 6,373 on January 8th and have since fallen below 4,000. New hospitalizations, which lag cases, peaked on January 18th and have since fallen steadily; and COVID related deaths, which lag hospitalizations, have leveled off after rising for three months straight.[2]
Despite initial difficulties with the vaccine rollout, and ongoing issues with equitable distribution, New York City has administered more vaccine doses than any other U.S. city, and more per capita than most other U.S. urban areas that publish timely data.
Chart 2. Vaccinations Administered in Selected Jurisdictions

Source: Current data as of 2/11/2021 from state, county and city health departments.
As of early February, New York City had vaccinated almost 70 percent of long-term care residents and nearly 50 percent of staff.[3] On January 11th, New York State expanded vaccine eligibility from first responders, healthcare workers and seniors to include transit workers, correctional facilities, grocery store workers, teachers and homeless shelters. Eligibility was further expanded on February 2nd to include taxi drivers and restaurant workers.
Vaccines administered to these New York City groups will increasingly tamp down transmission rates as vaccination reaches a greater share of the targeted populations. Based on current infection trajectories, Governor Cuomo has scheduled the reopening of New York City bars and restaurants for reduced capacity indoor service on Valentine’s Day.
Vaccine availability should continue to improve with the likely approval of new vaccines from Johnson & Johnson, and AstraZeneca, as well as measures to speed delivery of already approved vaccines. Moderna has plans to increase the number of doses per vial by 50 percent, the current bottleneck on the company’s production capacity. Pfizer recently announced an expanded production target of 2 billion COVID vaccine doses in 2021, up from the prior 1.2 billion.[4]
Although there is a risk of a renewed New York City outbreak from new and more contagious COVID strains, increased vaccine availability should continue to reduce transmission rates. Greater availability will allow a spring expansion of vaccine eligibility to include the public at large. New cases will begin falling more quickly in the spring, aided by warmer weather, and will permit an accelerated return to in-person business.
The risk of having hospitals overwhelmed by COVID patients was the impetus for the initial economic shutdowns of March 2020, and a factor in other economic restrictions imposed since. With increasing rates of vaccination among seniors, hospitalizations and deaths will fall even more quickly than new infections, because seniors account for almost half of COVID hospitalizations[5] and 80 percent of COVID deaths.[6]
Our forecast has no economic and employment growth in New York City through the first quarter of 2021 with vaccine deliveries slowly accelerating, and COVID infection rates slowly declining, but economic and employment growth lagging. Increased vaccination will lead COVID infection rates to begin falling dramatically in the second quarter of 2021, followed quickly by economic reopening and accelerating economic and employment growth. Our forecast has New York City employment rebounding over the course of the next year before growth levels off and returns to pre-pandemic rates in the spring and summer of 2022.
As the pandemic recedes it will leave a changed city where many continue to work remotely on at least a part-time basis and consumers continue to do a larger share of their shopping online. Foreign visitors will take longer to return, as most European and Asian countries lag the U.S. in vaccination. Asian countries that were more successful in containing the virus, but have less access to vaccines may be especially hesitant to allow their citizens to travel to the U.S.
Table 6. Selected Economic Indicators, Annual Averages,
Comptroller and Mayor’s Forecast, 2020 to 2025
| 2020 | 2021 | 2022 | 2023 | 2024 | 2025 | |||
| SELECTED U.S. ECONOMIC INDICATORS (ANNUAL AVERAGES) | ||||||||
| Real GDP (2012 $, % Change) | Comptroller | -3.5 | 4.6 | 3.9 | 4.0 | 2.1 | 2.1 | |
| Mayor | -3.4 | 4.3 | 3.6 | 2.6 | 2.6 | 2.6 | ||
| Payroll Jobs (Change In Millions) | Comptroller | -8.7 | 2.5 | 3.8 | 3.1 | 1.6 | 0.8 | |
| Mayor | -8.7 | 4.1 | 5.0 | 1.9 | 1.6 | 1.3 | ||
| Fed Funds Rate (Percent) | Comptroller | 0.4 | 0.1 | 0.1 | 0.2 | 0.6 | 1.2 | |
| Mayor | 0.4 | 0.1 | 0.1 | 0.1 | 0.1 | 0.1 | ||
| 10-Year Treasury Notes, (percent) | Comptroller | 0.9 | 0.9 | 1.3 | 1.9 | 2.2 | 2.4 | |
| Mayor | 0.9 | 1.0 | 1.3 | 1.5 | 1.6 | 1.9 | ||
| SELECTED NYC ECONOMIC INDICATORS (ANNUAL AVERAGES) | ||||||||
| Real GCP (2012 $, % Change) | Comptroller | -6.3 | 2.4 | 2.7 | 2.9 | 1.8 | 0.9 | |
| Mayor | -0.6 | 5.1 | 5.2 | 3.1 | 2.5 | 2.5 | ||
| Payroll Jobs, (Change In Thousands) | Comptroller | -507 | 216 | 273 | 101 | 105 | 109 | |
| Mayor | -511 | 191 | 253 | 99 | 57 | 65 | ||
| Wage-Rate Growth, (Percent) | Comptroller | 5.8 | 0.0 | 2.1 | 2.1 | 1.4 | 2.2 | |
| Mayor | 4.4 | 2.9 | 2.4 | 2.6 | 2.5 | 2.9 | ||
Note: Comptroller=forecast by the NYC Comptroller’s Office. GCP=Gross City Product. Mayor=forecast by the NYC Office of Management and Budget in the January 2020 Financial Plan.
III. The FY 2022 Preliminary Budget
The FY 2022 Preliminary Budget released on January 14th shows a balanced budget of $92.29 billion. Revenues in the Preliminary Budget are $1.38 billion less than projected in the November Plan. However, a sharper reduction of $5.14 billion in expenditures, driven by an increase of $2.73 billion in planned prepayment of FY 2022 debt service and reductions of $1.15 billion in budgeted reserves, offsets the revenue shortfall and allows the City to close the $3.75 billion gap projected in November.
Nearly all the revenue decreases are due to re-estimates of City-funds revenues which are revised downward by $1.58 billion from the November Plan projection, as shown in Table 7.[7] Revisions to tax revenue estimates account for more than 98 percent of the decline in City-funds revenues, driven by a downward revision of $2.51 billion in property tax revenues.[8] The drop in property tax revenues reflects the drop in property values since the onset of the pandemic. A net increase in non-property tax revenues of $923 million, driven by increases of $637 million in business tax, $531 million in personal income tax (PIT), and $200 million in tax audit revenues, provides some offset against the drop in property tax revenues.
Table 7. Changes to FY 2022 City-Funds Estimates
from the November 2020 Plan
| ($ in millions) | |
| Gap to be Closed – November 2020 Plan | ($3,752) |
| Revenues | |
| Property Tax Revenues | ($2,507) |
| Non-Property Tax Revenues | 723 |
| Tax Audit Revenues | 200 |
| Non-Tax Revenues | (28) |
| Revenues From Citywide Savings Program | 30 |
| Total Revenue Changes | ($1,582) |
| Expenditures | |
| Agency Expenditures | $129 |
| FY 2020 Lump Sum/Retro/Welfare Funds Deferrals | 52 |
| Pension Contributions | (304) |
| Savings From Citywide Savings Program | (1,336) |
| General Reserve | (900) |
| Capital Stabilization Reserve | (250) |
| Total Expenditure Changes | ($2,609) |
| Gap To Be Closed Before Prepayments | ($2,725) |
| FY 2021 Prepayment of FY 2022 Debt Service | $2,725 |
| Gap to be Closed – January 2021 Financial Plan | $0 |
FY 2022 City-funds expenditures, before accounting for the reduction in debt service from FY 2021 prepayments, show a net decrease of $2.61 billion from the November Plan. This reduction stems largely from spending reductions of $1.34 billion in the January Plan Citywide Savings Program (CSP), a $1.15 billion take down of budgeted reserves, and a reduction of $304 million in pension contribution from proposed changes in actuarial assumptions and methods.
Setting aside spending reductions in the CSP, agency expenditures are $129 million above the November Plan. The increase in agency spending reflects funding of $35 million in the Department of Education (DOE) for the new Academic Resiliency program and $53 million in the Department of Social Services (DSS) for the Fair Fares program. The November Plan included funding for the Fair Fares program in FY 2021 only. While the January Plan adds $53 million for the Fair Fares program in FY 2022, the program remains unfunded in the outyears.
In addition, since the release of the November Plan, the City negotiated another $52 million in deferrals of FY 2021 retroactive, lump sum and welfare fund payments. While the deferrals provide budget relief in FY 2021 it pushes these payments into FY 2022.
FY 2021 Budget Stabilization Account (BSA)
Since the November Plan, the City has recognized a net $2.73 billion of additional resources in the FY 2021 budget. Because these resources are not required to balance the current fiscal year’s budget, they are used to increase the FY 2021 Budget Stabilization Account (BSA), bringing the total FY 2021 BSA to $3.36 billion. The BSA will be used to prepay $2.68 billion of Transitional Finance Authority (TFA) Future Tax Secured (FTS) debt service and $676 million of General Obligation (G.O.) debt service. As shown in Chart 3, these additional resources are the result of:
- A reduction of $50 million in the FY 2021 General Reserve;
- A net savings of $421 million from adjustments to prior-year receivables and payables estimates;
- A new round of CSP with projected FY 2021 savings of $869 million;
- An increase of $1.67 billion in City-funds revenues;
- A reduction of $430 million in pension contributions; less
- Additional City-funds spending of $703 million
Chart 3. The January Plan Increases the BSA by $2.17 Billion
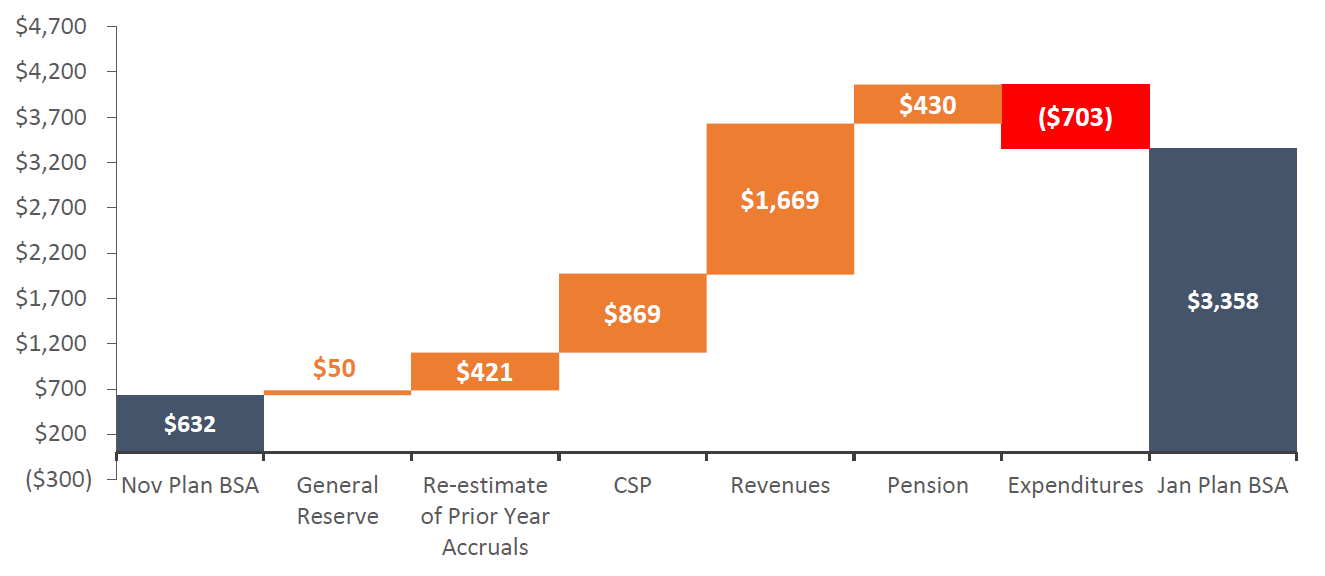
($ in millions)
Citywide Savings Program (CSP)
The January 2022 Plan includes another round of the CSP that is estimated to provide budget relief of $869 million in FY 2021, $1.37 billion in FY 2022, $580 million in FY 2023, $605 million in FY 2024, and $624 million in FY 2025.
Almost a quarter of the budget relief in FY 2021 is from a one-time debt service reimbursement of $212 million from NYC Health + Hospitals (H+H, formerly the Health and Hospitals Corporation, or HHC). An initiative to limit non-essential civilian hiring to one new hire for every three separations is expected to produce $1.44 billion of savings over the Plan period, beginning at $57 million in FY 2021 and growing to $364 million by FY 2025.
With the current round of the CSP, estimated budget relief over the Plan period now totals $6.34 billion. The combined savings in FY 2021 and FY 2022 total $3.56 billon. As shown in Chart 4, debt service and efficiency initiatives make up almost 60 percent of the savings. Service reductions which, with the exception of the cutback on broom service to residential streets to once a week, do not extend beyond FY 2022, account for 8 percent or $286 million of the savings. However, the Mayor has indicated that he will rescind the temporary reduction of Fair Student Funding at DOE, which accounts for $150 million of the service reductions, using additional Federal Emergency Management Agency (FEMA) reimbursements. The Mayor has also indicated that he will rescind the delay of 3K expansion which accounts for $44 million of the savings from re-estimates.
Chart 4. Combined FY 2021 and FY 2022 Citywide Savings Program
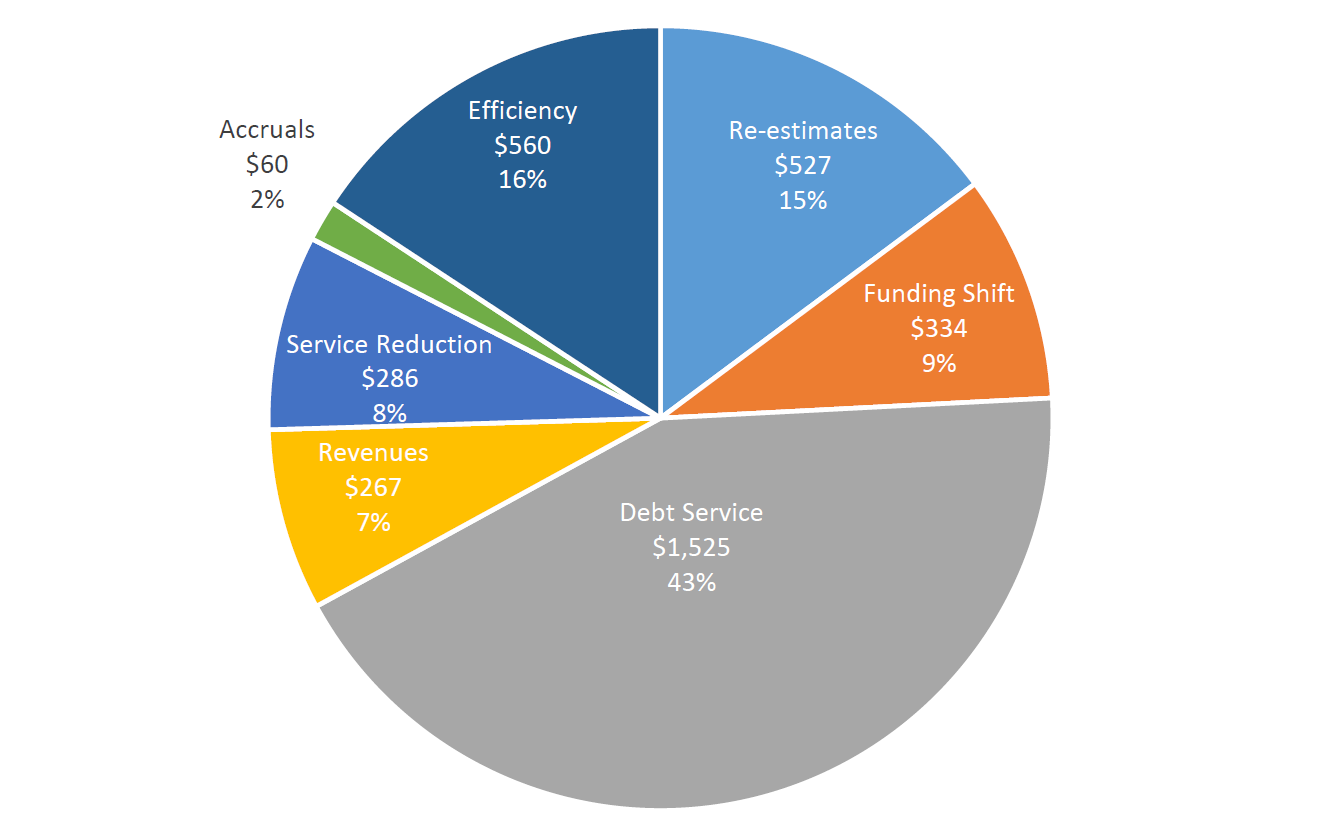
($ in millions)
Risks and Offsets
As Table 8 shows, the Comptroller’s Office’s analysis of the January Plan shows additional resources of $396 million in FY 2021 and risks to the budget ranging from $1.43 billion in FY 2022 to $2.61 billion in FY 2025. The additional resources in FY 2021 result from the Comptroller’s Office’s higher tax revenue forecasts which offset the expenditure risks identified by the Office. Risks to the budget in the outyears of the Plan are driven by the Comptroller’s Office’s higher expenditure estimates, with a modestly higher tax revenue estimate mitigating some of the risks in FY 2022, and lower tax revenues adding to the expenditure risks in FY 2023 through FY 2025. The Comptroller’s Office’s tax revenue forecast is discussed in more detail in “Comptroller’s Office’s Revisions and Projections, FY 2021 – FY 2025” beginning on page 16.
The Comptroller’s Office estimates that expenditures could exceed the Plan projections by $472 million in FY 2021, $1.50 billion in FY 2022, $1.73 billion in FY 2023, $1.90 billion in FY 2024, and $2.09 billion in FY 2025. The biggest risk to expenditures is the assumption of as yet unspecified labor savings in the Plan. The City had assumed annual labor savings $1 billion beginning in FY 2021 in the June Plan. Since then, the City had credited $710 million of deferral and furlough savings to FY 2021, leaving a residual risk of $290 million. However, the Plan continues to assume $1 billion of savings in each of the outyears.
Other expenditure risks include funding for the Fair Fares program, paratransit funding, overtime and expenditure estimates in the DOE and the Department of Homeless Services (DHS). The Preliminary budget added $53 million to the Fair Fares program in FY 2022 but the outyears remain unfunded. The Comptroller’s Office estimates that the program could cost at least $100 million annually beginning in FY 2022 as participation rate picks up, posing risks of $47 million in FY 2022, and $100 million in each of FY 2023 through FY 2025. In addition, the Comptroller’s Office estimates shortfalls in paratransit funding beginning at $81 million in FY 2022 and growing to $150 million by FY 2025. While the State requires the City to increase its funding of the Metropolitan Transportation Authority’s (MTA) net paratransit deficit from 33 percent to 50 percent, funding for paratransit in the Financial Plan does not reflect the increase in funding requirement. Risks to overtime, DOE and DHS are discussed below in the “Expenditure Analysis” section beginning on page 26.
The City’s conservative estimates of interest rates on variable rate debt bonds (VRDB) provide some offset to the Comptroller’s Office’s expenditure risks. In an environment of low variable interest rates and no indication that rates will rise to the level assumed over the Plan period, the Comptroller’s Office estimates that debt service on VRDB could be less than the Plan projections by $25 million in FY 2021 and $100 million annually in FY 2022 through FY 2025.
Overall, the Comptroller’s Office’s analysis of the Plan indicates that the City could end FY 2021 with an additional budget surplus of $396 million, but larger gaps of $1.43 billion in FY 2022, $6.44 billion in FY 2023, $6.48 billion in FY 2024, and $6.89 billion in FY 2025.
The January Plan does not reflect potential Federal budget relief from actions taken by the Biden administration. Since the release of the January Plan, the President has signed an executive order authorizing FEMA to reimburse the entire cost of eligible COVID related spending, retroactive to spending since the onset of the pandemic. The January assumes FEMA reimbursement for 75 percent of eligible expenditures. The additional reimbursement, which is estimated to provide an additional $1 billion of FEMA funding to the City, will allow the City to rescind or reduce some of the service reductions in the Plan and use the balance towards budget relief.
Table 8. Risks and Offsets to the January 2021 Financial Plan
($ in millions, positive numbers decrease the gap and negative numbers increase the gap)
| FY 2021 | FY 2022 | FY 2023 | FY 2024 | FY 2025 | |
| City Stated Gap | $0 | $0 | ($4,311) | ($4,193) | ($4,278) |
| Tax Revenues | |||||
| Personal Income Tax | $495 | $29 | ($237) | ($77) | ($51) |
| Business Taxes | 350 | (40) | (178) | (187) | (173) |
| Sales Tax | 24 | 66 | 89 | 142 | 131 |
| Real Estate Transaction Taxes | (1) | 15 | (274) | (465) | (634) |
| Audit | 0 | 0 | 200 | 200 | 200 |
| Subtotal Tax Revenues | $868 | $70 | ($400) | ($387) | ($527) |
| Expenditures | |||||
| Overtime | ($287) | ($107) | ($130) | ($130) | ($130) |
| Charter School Tuition | 0 | (154) | (282) | (433) | (600) |
| Carter Cases | 0 | (150) | (150) | (150) | (150) |
| Pupil Transportation | 0 | (75) | (75) | (75) | (75) |
| DOE Medicaid Reimbursement | (20) | (20) | (20) | (20) | (20) |
| Pre-K Special Education | 50 | 50 | 50 | 50 | 50 |
| Fair Fares | 0 | (47) | (100) | (100) | (100) |
| Homeless Shelters | 0 | (12) | (12) | (12) | (12) |
| Labor Savings | (290) | (1,000) | (1,000) | (1,000) | (1,000) |
| Paratransit Funding | 0 | (81) | (111) | (130) | (150) |
| VRDB Interest Savings | 25 | 100 | 100 | 100 | 100 |
| General Reserve | 50 | 0 | 0 | 0 | 0 |
| Subtotal | ($472) | ($1,496) | ($1,730) | ($1,900) | ($2,087) |
| Total (Risks)/Offsets | $396 | ($1,426) | ($2,130) | ($2,287) | ($2,614) |
| Restated (Gap)/Surplus | $396 | ($1,426) | ($6,441) | ($6,480) | ($6,892) |
Note: Numbers may not add due to rounding.
Revenue Analysis
Total revenues in the January Plan are estimated to grow by $3.86 billion over the forecast period, from $95.05 billion in FY 2021 to $98.91 billion in FY 2025. Overall tax revenue is projected to grow by $7.52 billion over the same period, averaging 2.3 percent annual growth. The increase in overall tax revenues is driven almost entirely by an expected rebound in non-property tax revenues as the City’s economy begins to recover from the devastating effects of the pandemic. Property tax revenues, on the other hand, are projected to fall significantly in FY 2022, by 4.3 percent — the largest decline since 1996 — and then to stabilize and grow gradually through the remainder of the Plan. In FY 2025 property tax revenues are expected to be essentially unchanged from FY 2021, a significant reversal from previous forecasts.
Miscellaneous revenues are projected to drop by $225 million to $4.98 billion in FY 2022, and to stay relatively flat at about $4.7 billion throughout the rest of the Plan period. The reduction in FY 2022 reflects a one-time reimbursement of $213 million by H+H for debt service in FY 2021.
FY 2021 Federal and State aids total $25.90 billion and account for 28 percent of the City’s overall revenue estimate. Over the outyears of the Plan, Federal and State grants are projected to decline to $23.40 billion in FY 2022 before increasing modestly to $23.71 billion in FY 2023. Over the remainder of the Plan, Federal and State aids are projected to remain essentially flat at $23.7 billion.
Tax Revenues
Revisions since the November Financial Plan, FY 2021 – FY 2025
The January Plan incorporates large changes to almost all revenue sources as shown in Table 9. Property tax revenue was revised significantly downwards to reflect the release of the tentative roll that indicated a sharp drop in market values for most property types.[9] As a result, property tax revenues were lowered by $2.5 billion beginning in FY 2022 and by roughly similar amounts throughout the Plan. Sales tax and all other taxes (which include the hotel occupancy tax) were also revised lower, though by smaller amounts due to a slower forecast recovery in the tourism sector. All other revenue sources were revised upwards. In particular, income and business taxes were revised significantly higher in the current fiscal year. To a large extent the revision to the income sensitive taxes in FY 2021 reflects the fact that forecast revenues losses due to the pandemic so far have been less than originally anticipated.
Table 9. Revisions to the City’s Tax Revenue Assumptions
January 2021 Plan vs. November 2020 Plan
| ($ in millions) | FY 2021 | FY 2022 | FY 2023 | FY 2024 | FY 2025 |
| November 2020 Financial Plan | $59,390 | $63,748 | $66,663 | $67,942 | $67,942 |
| Revisions: | |||||
| Property Tax | (8) | (2,479) | (2,671) | (2,607) | (2,199) |
| Personal Income (PIT) | 822 | 531 | 528 | 506 | 1,063 |
| Business | 653 | 637 | 529 | 613 | 723 |
| Sales | (215) | (441) | (253) | 76 | 535 |
| Real-Estate Transactions | 273 | 336 | 308 | 372 | 533 |
| All Other | (106) | (340) | (300) | (158) | (19) |
| Tax Audit | 250 | 200 | 0 | 0 | 0 |
| Total | $1,669 | ($1,556) | ($1,859) | ($1,198) | $636 |
| January 2021 Financial Plan – Total | $61,059 | $62,192 | $64,804 | $66,744 | $68,578 |
Comptroller’s Office Revisions and Projections, FY 2021 – FY 2025
Similar to the City, the Comptroller’s Office’s projections also reflect significant revisions to property tax revenues that were based on new data provided in the tentative roll. Following the decline in property tax revenue of 4.3 percent in FY 2022, the Comptroller’s Office projects that moderate growth will resume in the outyears. This is predicated on the forecast rebound in the local economy and the assumption that the downward effects on property values have largely already occurred. The Comptroller’s Office’s baseline projections are not significantly different from the City’s forecast. There is, however, a high degree of uncertainty surrounding this forecast as discussed in more detail in the following section.
With regard to non–property tax revenues, the Comptroller’s Office projects higher near term growth in FY 2021 and FY 2022 than the Mayor, and lower growth in the outyears. The projected higher growth in the near term reflects both stronger than anticipated collections data, and a sharper rebound in employment in the near term compared to the City’s projections. The overall differences are shown in Tables 10 and 11.
Table 10. Risks and Offsets to the City’s Tax Revenue Projections
| ($ in millions) | FY 2021 | FY 2022 | FY 2023 | FY 2024 | FY 2025 |
| Property | $0 | $0 | $0 | $0 | $0 |
| PIT | $495 | $29 | ($237) | ($77) | ($51) |
| Business | $350 | ($40) | ($178) | ($187) | ($173) |
| Sales | $24 | $66 | $89 | $142 | $131 |
| Real Estate Transaction | ($1) | $15 | ($274) | ($465) | ($634) |
| Audit | $0 | $0 | $200 | $200 | $200 |
| Total | $868 | $70 | ($400) | ($387) | ($527) |
Table 11. Tax Revenue Forecast, Growth Rates
| FY 2021 | FY 2022 | FY 2023 | FY 2024 | FY 2025 | FYs 2021 – 25 Average Annual Growth | |
| Property | ||||||
| Mayor | 3.4% | (4.3%) | 2.3% | 1.4% | 1.3% | 0.1% |
| Comptroller | 3.4% | (4.3%) | 2.3% | 1.4% | 1.3% | 0.1% |
| PIT | ||||||
| Mayor | (6.0%) | 6.0% | 5.6% | 3.6% | 3.8% | 4.7% |
| Comptroller | (2.3%) | 2.2% | 3.6% | 4.8% | 4.0% | 3.7% |
| Business | ||||||
| Mayor | (9.1%) | 6.4% | 4.0% | 1.0% | 1.7% | 3.3% |
| Comptroller | (3.7%) | (0.2%) | 1.8% | 0.9% | 1.9% | 1.1% |
| Sales | ||||||
| Mayor | (11.1%) | 16.7% | 10.0% | 6.9% | 5.1% | 9.6% |
| Comptroller | (10.8%) | 17.3% | 10.2% | 7.4% | 4.9% | 9.9% |
| Real Estate Transactions | ||||||
| Mayor | (19.1%) | 18.8% | 11.0% | 6.7% | 6.7% | 10.7% |
| Comptroller | (19.2%) | 19.7% | (3.2%) | (2.0%) | (0.4%) | 3.1% |
| All Other | ||||||
| Mayor | (21.2%) | 6.8% | 6.7% | 8.0% | 5.2% | 6.7% |
| Comptroller | (21.2%) | 6.8% | 6.7% | 8.0% | 5.2% | 6.7% |
| Audit | ||||||
| Mayor | 14.2% | -21.3% | -21.7% | 0.0% | 0.0% | -11.4% |
| Comptroller | 14.1% | -21.3% | 0.0% | 0.0% | 0.0% | -5.8% |
| Total Tax with Audit | ||||||
| Mayor | -3.2% | 1.9% | 4.2% | 3.0% | 2.7% | 2.9% |
| Comptroller | -1.8% | 0.5% | 3.4% | 3.0% | 2.6% | 2.4% |
Property Taxes
The 2022 tentative roll released by the Department of Finance on January 15th showed how swift and devastating the impact of the pandemic has been on property values. Overall Class 2 properties, which includes rentals, and coops and condos, declined by 8.0 percent on average. Commercial property values (Class 4) were impacted even harder declining by 15.8 percent on average. Office buildings, the largest source of revenue within Class 4, experienced market value declines of 15.1 percent while values for hotel and retail properties, the most severely impacted by the pandemic, declined by 23.8 percent and 21.0 percent respectively. Class 1 properties which include 1-3 family homes fared better, increasing by a slight 0.8 percent, with growth in the market value of single-family homes of 2.9 percent offsetting declines in other categories.[10]
While the Comptroller’s Office’s forecast in November had anticipated significant declines in property taxes to occur, the magnitude and swiftness of these declines, particularly for office buildings, was unanticipated. The collapse in values meant that the pipeline of accumulated phase-ins in assessments from previous years of growth was quickly depleted. Instead of the more phased and gradual impact that was anticipated, a much more immediate adjustment to taxable assessed values occurred.
The Comptroller’s Office baseline assumption is that the swift and substantial declines in property values that Class 2 and Class 4 in FY 2022 largely incorporate the downside effects of the pandemic. The real estate markets will begin to stabilize and grow moderately in FY 2022 – FY 2025, as the City also projects to occur.
This forecast is highly uncertain and many questions regarding long term structural changes and their impacts on property markets remain unanswered. The extent to which firms and individuals will continue to rely on remote work and the resulting impact on the long term demand for office and residential properties is unknown. Will businesses rely on travel in the same way they did in the pre-pandemic world given that teleconferencing may be a viable and cheaper alternative in the future? To what extent will online sales continue to displace brick and mortar stores?
The answers to these and other questions will ultimately determine whether the downward market adjustments that occurred in 2020 will reverse, as reflected in our baseline forecast, or continue. One important risk to the forecast that should be noted is that almost 60 percent of Class 4 properties have actual assessed values below transitional values. Since property tax rates are applied against the lower of the actual assessed value or the phased-in transitional value, any further deterioration in market values would be reflected immediately, while any positive news would be phased in only gradually.
Real Estate Transaction Taxes
Sales of real estate properties in the City have begun a slow but steady recovery from the lockdown that brought the whole market to a halt in March and caused sales to collapse in the last quarter of FY 2020 (April-June 2020). Class 1 property sales (1-3 family homes) are up by 75 percent ($4.8 billion) during the second quarter of FY 2021 (October to December) compared to the last quarter of FY 2020 ($2.8 billion). Class 2 property sales (residential condos and coops) are up by 23 percent ($6.7 billion compared to $5.5 billion) and Class 4 property sales (commercial buildings) are up by 61 percent ($3.2 billion compared to $2 billion). Nonetheless, compared to the same quarter last year, sales are still lagging. Class 1 sales are flat whereas Class 2 sales are down by 28 percent and Class 4 sales are down by 61 percent.
The Comptroller’s Office’s near term projections for fiscal years 2021 and 2022 from the combined real property transfer and mortgage recording tax are very similar to the City’s forecast. After declining sharply by more than 19 percent in FY 2021, revenue is projected to rebound sharply in FY 2022, by almost 20 percent.
Thereafter, the Comptroller’s and City’s forecasts of the trajectory for the two taxes differ. The Comptroller’s Office projects that transaction taxes will remain below pre-COVID crisis levels throughout the Plan period. Class 1 sales have a better trajectory for recovery compared to Class 2 and Class 4 properties. The latter are likely to continue to face strong headwinds from increased reliance on work from home, while Class 1 could benefit from the remote work trend as homeowners seek more space at home. Mortgage recording taxes are projected to fare better in the short term as people continue to take advantage of low interest rates for refinancing, but as interest rates rise in the outyears this growth reverses. The City, on the other hand shows continued robust growth for these two taxes. Given this different trajectory, the outyear forecasts diverge, with the Comptroller estimating lower revenue compared to the City in each of FY 2023 – FY 2025, as shown in Tables 10 and 11.
Personal Income Tax
Both the Comptroller and the City have significantly revised their forecast for PIT in January, continuing the pattern of upward revisions that has occurred since last year’s Executive Budget forecast. The revisions largely reflect the fact that collections have come in stronger than originally anticipated (or alternatively, the significant losses that were originally projected due to the pandemic have not occurred).
There are several reasons that account for this unexpected strength. After initially dropping sharply at the onset of the pandemic, financial markets recovered quickly and by the end of the year stock market indices had soared to new record highs. The federal government provided an unprecedented fiscal boost to both persons and businesses: significantly increasing unemployment insurance compensation, providing Economic Impact Payments to low- and moderate-income individuals, and by helping businesses retain employees through the Paycheck Protection Program and through other tax credit programs. All these factors contributed to mitigating income tax losses that might otherwise have been much more significant. Rather than the projected double digit declines that were originally forecast for FY 2021, the Comptroller’s Office now anticipates PIT will decline by only 2.3 percent. The City projects a larger decline for FY 2021, in part because the City’s forecast does not incorporate the latest data for January PIT collections which continued to come in stronger than anticipated.
Looking forward, the projected recovery in the economy is expected to boost wage income and related withholding taxes. From FY 2022 to FY 2025 withholding is expected to increase by an average of five percent per year, boosted by a sharp rebound in 2022. The City’s overall forecast for withholding growth over the Plan is similar but the City’s projections are slightly lower in the near term and conversely higher in the outyears due to a more prolonged projected rebound in employment to pre-pandemic levels.
The non-withholding component of personal income, which is related mainly to capital gains and business income, is expected to experience only moderate growth over the Plan. After four years of strong and continued upward movements in the stock market, additional large gains may be harder to achieve with some analysts warning of bubbles[11]. As a result, the non-withholding component of PIT is expected to grow by only 1.3 percent on average. The City also projects moderate growth in non-withholding, but somewhat higher at 2.7 percent on average over the Plan. This forecast difference in non-withholding explains the Comptroller’s Office’s lower projections in the outyears, as shown in Tables 10 and 11.
Business Income Taxes
The forecast for the business taxes (General Corporation Tax and Unincorporated Business Tax) is also revised to reflect greater near-term strength and lower losses for reasons similar to those discussed regarding personal income taxes.[12] In particular, rather than declining as originally anticipated at the onset of the pandemic, Wall Street firm profits likely soared to the second highest level on record in FY 2021, second only to the profits realized in 2009 which were boosted by the Troubled Asset Relief Program (TARP).
In fiscal 2021 business taxes are projected to decline by 3.7 percent, a much lower decline than the losses originally anticipated. The outyear forecast assumes that a broader rebound in the local economy will help to offset lower profitability on Wall Street, and overall growth is expected to be a modest 1.1 percent on average. The Comptroller’s Office’s projections for the outyears is somewhat lower than the City’s, as shown in Table 11. As in the past, the Comptroller assumes higher growth in business taxes will occur in the form of audits rather than current collections, so overall, including audits, the projections for business tax revenue is similar to the City’s.
State, Federal Legislation, and Other Issues Impacting PIT and Business Taxes
The Governor’s proposed budget included a proposal that would potentially raise State PIT if Federal aid is not sufficient to help cover the projected deficits. Income over $5 million would be subject to a series of new brackets, up to 10.82 percent on income over $100 million. These brackets would apply for tax years 2021 through 2023, and taxpayers who prepaid their (estimated) liabilities this year would be eligible for credits against future tax liabilities beginning in 2024.
The State could also face significant impacts to its taxation of non-resident remote workers, from a Supreme Court decision in the case New Hampshire vs Massachusetts. Although the City cannot tax non-residents, the City could be indirectly impacted by this decision if existing City residents were to relocate in response to the decision.
The Governor also proposed a new SALT workaround proposal that would allow individuals to take advantage of the continued deductibility of S-Corp and partnership business taxes from their Federal taxes. In exchange for these newly imposed and deductible State taxes, individuals would receive a credit on their State PIT.[13]
A larger legislative issue that both the State and the City could face is the potential for significant tax reform to occur at the Federal level given that Democrats control both chambers of Congress. President Biden has indicated that he would increase taxes for high income individuals and corporations, while also considering some form of repeal to SALT limitations. The prospect of higher taxes could cause individuals to shift income across tax years, much like that which occurred in response to the Tax Cuts and Jobs Act of 2017. It is still too early to determine these impacts, but some taxpayers may have already hedged against future increases this year following the November election, betting on a Democratic win in Georgia. In other words, some of this year’s increase in PIT may be already due to income shifting.
In addition to these legislative proposals, the impact of remote work on population and residency patterns could also have significant effects on income and business taxes.
Sales Tax
While the forecasts for PIT and business taxes has been revised upwards in the current Plan, sales taxes were revised downwards as the effects of the pandemic on the hospitality sectors continue to drag down sales revenue. Sales tax revenue from hotels was 90 percent lower in the latest quarter compared to 2019 and restaurants reported that sales were 59 percent lower.[14] The recovery of the hospitality and entrainment sector is critical to the rebound in sales taxes and also explains the main difference between the Comptroller’s Office’s and the City’s forecast.
The Comptroller’s Office projects that hospitality employment will recover to 2019 pre-pandemic levels by the end of 2023, with projected annual growth of 22.9 percent and 34.3 percent in FY 2021 and FY 2022, while the City does not anticipate a recovery in the hospitality sectors to occur until after FY 2025. The City projects growth of only 16 percent and 20 percent in FY 2021 and FY2022.[15] As a result, the Comptroller’s Office anticipates higher sales tax growth throughout the Plan period, as shown in Tables 10 and 11.
The Governor’s proposed budget includes legislation to legalize and tax recreational cannabis. The legislation would enable the City to collect sales tax on retail sales of cannabis.[16] (For more detail see “State Executive Budget” beginning on page 22.)
Audit Revenues
The City’s forecast assumes that audit collections will decline from $921 million in FY 2022 to $721 million annually in the remainder of the Plan. The Comptroller’s Office’s forecast, while recognizing the volatility in individual audit collections, assumes that overall tax revenues should remain more closely in line with the $1 billion long term average of the past 10 years. As a result, the City could collect at least $200 million more in each year from FY 2023 – FY 2025.
Miscellaneous Revenues
Miscellaneous revenues in the FY 2022 Preliminary Budget remain relatively unchanged from the November Plan with a net decrease of $27 million to $4.98 billion. The reduction stems from downward revisions of $12 million and $16 million to estimates of sidewalk café fees and parking revenues, respectively.
In contrast, the FY 2021 miscellaneous revenue forecast is increased by a net $217 million, to $5.20 billion. This increase stems from a one-time reimbursement of $212 million by H+H for debt service. The reimbursement is credited as a revenue initiative in the Citywide Savings Program.
Table 12 shows the changes in the FY 2021 miscellaneous revenue projections since the November Plan. Revenue projections for licenses, permits and franchises decreased by a net $31 million. This revision reflects mostly lower projections for building and construction permits, cable television franchises and fees on sidewalk cafes. Projected revenues from charges for services decreased by $7 million. This includes lower projections for City register fees, event fees, and garage and long-term parking fees.
Table 12. Changes in FY 2021 Estimates
January 2021 Plan vs. November 2020 Plan
| ($ in millions) | November | January | Change |
| Licenses, Permits & Franchises | $680 | $649 | ($31) |
| Interest Income | 12 | 14 | 2 |
| Charges for Services | 975 | 968 | ($7) |
| Water and Sewer Charges | 1,720 | 1,720 | 0 |
| Rental Income | 245 | 245 | 0 |
| Fines and Forfeitures | 952 | 953 | 1 |
| Other Miscellaneous | 403 | 655 | $252 |
| Total | $4,987 | $5,204 | $217 |
After reaching $6.0 billion in FY 2019, miscellaneous revenue declined 12.3 percent in FY 2020 following a slowdown in business and social activities caused by the COVID-19 pandemic beginning in March 2020. The current year forecast of $5.2 billion represents a slight decline of 0.7 percent from the FY 2020 level. The City estimates miscellaneous revenue will decline another 4.0 percent in FY 2022 as result of the one-time H+H reimbursement in FY 2021. Net of the H+H reimbursements, miscellaneous revenues are projected to remain relatively flat at around $5 billion through FY 2025.
Federal and State Aid
The January Financial Plan projects total Federal and State aid of $26.98 billion in FY 2021, supporting nearly 28.4 percent of the City’s expenditure budget. Compared with the November Plan, the City has reflected an increase of $1.08 billion in the current year, comprised of $909 million in Federal aid and $169 million in State grants. A significant portion of the increased Federal funding stems from the continued recognition of COVID-related reimbursement totaling $541 million, including $213 million in FEMA reimbursement and $312 million in Epidemiology and Laboratory Capacity grants under the CARES Act. The residual Federal aid increase mainly includes $138 million in Community Development Block Grant funding and $170 million in social services grants. Under State grants, the January Modification reflects increases of $42 million for social services, $32 million for health and mental hygiene and $95 million for other areas mostly in reimbursement for indigent legal services and assigned counsel payments.
In the FY 2022 Preliminary Budget, the City assumes $23.4 billion in Federal and State assistance, reflecting a modest increase of $124 million since the November Plan. The increase primarily consists of $38 million in Federal school food revenue, $27 million in Homeland Security grants and $31 million in State early intervention services reimbursement. Federal and State grants would support about 25 percent of the expense budget in FY 2022, which will ultimately increase once additional COVID-related assistance is reflected. Overall, the January Plan assumes about $3.63 billion in Federal COVID-related reimbursement, including $1.9 billion in CARES Act funds and $1.7 billion in FEMA grants for the reimbursement of 75 percent of eligible COVID-related spending. However, the Plan does not reflect potential grants from actions taken by the Biden administration to provide budget relief to states and localities. Since the release of the January Plan, the President has signed an executive order to ensure full FEMA coverage for eligible COVID-related costs, which is expected to provide about $1 billion in additional reimbursement to the City. In addition, the current Federal aid assumptions have not yet accounted for potential resources stemming from the Biden Administration’s stimulus package proposal, which earmarks $350 billion in support to state and local governments.
Over the remainder of the Plan, Federal and State grants are projected to rise to $23.71 billion in FY 2023 and remain basically flat thereafter, primarily because the City has assumed no State education aid growth beyond FY 2023. Based on these projections, Federal and State support for the City’s expense budget would decline to an average of 23 percent in FY 2023 – FY 2025.
State Executive Budget
Governor Andrew Cuomo unveiled his Executive Budget for State fiscal year (SFY) 2022 on January 19, 2021. The proposal would close a projected $15 billion gap over the current year and next year by adopting temporary tax increases, cutting State spending, using prior allocations of Federal COVID-19 relief, and assuming that more Federal support is on the way.
President Biden has proposed a new $1.9 trillion federal stimulus package, which would include $350 billion in unrestricted aid for states and local governments. However, the timing and actual size of any additional Federal relief is uncertain. Amid this uncertainty, the proposed State budget is premised on receiving at least $6 billion in flexible, emergency Federal aid. The State Division of Budget (DOB) assumes that these funds would be evenly divided between SFYs 2022 and 2023.
If New York State receives less than the budgeted $3 billion in unrestricted Federal COVID-19 relief as of August 31, 2021, the budget proposal would once again authorize the State to implement across-the-board local aid reductions. Certain categories of spending, including school aid and public assistance, would be exempt. Alternatively, if the State receives at least $15 billion in unrestricted Federal aid, then proposed state cuts and tax increases could be rescinded.
Under the assumption that the State receives at least $3 billion in additional relief by next year, the State budget as proposed could have a positive impact on the City’s Financial Plan of $46 million over FY 2021 and FY 2022, as shown in Table 13.
Table 13. Potential Impact of Proposed FY 2022 State Budget
| ($ in millions) | FY 2021 | FY 2022 | Total Two-Year Impact |
| Education Aid | |||
| Formula-based School Aids* | ($93) | $547 | $455 |
| Other Education Aids | ($156) | ($87) | ($243) |
| Subtotal Education Aid | ($249) | $461 | $212 |
| Cost Shifts | |||
| State Share of Federal Public Indigent Care Pool | ($15) | ($61) | ($76) |
| Child and Family Assistance Programs | ($9) | ($35) | ($44) |
| Public Health Reimbursement | ($5) | ($25) | ($30) |
| Transit Operating Aid | ($2) | ($6) | ($8) |
| Mental Hygiene | ($1) | ($4) | ($5) |
| Other Human Services | ($1) | ($3) | ($4) |
| Subtotal Cost Shifts | ($32) | ($133) | ($166) |
| Total Impact | ($281) | $327 | $46 |
*Includes funding from Federal COVID-19 Supplemental Act.
Source: NYS Division of Budget and NYC Office of Management and Budget
School Aid
As proposed in the Executive Budget, total school aid to New York City would be $12.7 billion in FY 2022, an increase of 13 percent, or $1.5 billion, from the current year and $547 million higher than the current assumption in the City’s Financial Plan. The higher-than-expected increase results from the allocation of Federal COVID-19 relief funds, offset by cuts to State education support (Table 14).
Table 14. Variance Between Proposed School Formula Aids
and City January Plan Projections, FY 2022
| ($ in millions) | |
| Proposed State Aid Changes | |
| Foundation Aid | ($857) |
| Expense-based Aid | (569) |
| All Other Formula Aids | (33) |
| Local District Funding Adjustment | (144) |
| Total State Aid Changes | ($1,603) |
| Federal COVID-19 Supplemental Act Funds | $2,150 |
| Net Impact | $547 |
Source: NYS Division of Budget and NYC Office of Management and Budget.
Note: The numbers in the table above represent the difference between proposed state school aid in the State’s Executive Budget and the City’s forecast as of the January 2021 Financial Plan.
As part of the Coronavirus Response and Relief Supplemental Appropriations (CRRSA) Act that was approved in December 2020, New York State received $4.3 billion for elementary and secondary education, including $4.0 billion through the Elementary and Secondary School Emergency Relief (ESSER) Fund and $323 million through the Governor’s Emergency Education Relief (GEER) Fund. At least 90 percent of these ESSER funds must be allocated to school districts based on the distribution of Title I awards. States also cannot reduce the share of state spending dedicated to education below the average of FYs 2017 through 2019.
Under the Governor’s proposal, the State would allocate $3.85 billion of the CRRSA education relief funds to school districts, of which New York City would receive $2.15 billion. However, the additional Federal support would be offset by a “local district funding adjustment” that equals the lesser of the district’s reimbursement for the School Tax Relief (STAR) program or the Federal stimulus payment. The State estimates that New York City’s STAR payment will be $144 million in FY 2022, while the City’s Office of Management and Budget (OMB) has a slightly higher forecast of $152 million. The local district funding adjustment would continue past FY 2022, effectively eliminating the annual state reimbursement for STAR (Chart 5).
Chart 5. Actual and Proposed New York State School Aid
($ in billions)

* Actual
Note Includes actual and projected funding for all school districts in New York State. New York State Division of Budget does not publish outyear school aid projections for individual school districts.
Source: New York State Division of Budget, FY 2022 Executive Budget Financial Plan and prior financial plan updates.
The Executive Budget also proposes to consolidate and reduce 11 expense-based school aid categories, including transportation aid. Compared to the current assumption in the City’s financial plan, expense-based school aid would be $569 million less than projected in FY 2022. Foundation Aid would also be frozen for the second consecutive year in FY 2022 at $8.1 billion, $857 million below the City’s forecast.
Outside of formula-based school aids, the Executive Budget proposes to eliminate charter school facility aid, which OMB forecasts at $64.2 million in FY 2021 and $37.9 million in FY 2022 and beyond. The Executive Budget argues that State rental aid provides a disincentive to co-locating charter schools in under-utilized public school buildings. In addition, the City indicates the State Executive Budget would reduce support for pupil transportation costs during school shutdowns that could result in a loss of $92 million in FY 2021. Other education proposals include the elimination of the City’s fiscal stabilization grant and eliminating prior-year school aid claims.
The State has also proposed a one-time reduction in state-mandated tuition payments from school districts to charter schools in FY 2022. The payment would be reduced by the percent that the proposed “local district funding adjustment” and the expense-based aid reduction collectively reduce total school district expenditures. The savings would be split evenly between the State and school districts. The State estimates that New York City would save $32.7 million in FY 2022. However, because the City has not fully funded charter school tuition increases in the outyears of the January Plan, it is unclear how much savings will materialize.
The State has also proposed for the second consecutive year to exclude the reissuance of surrendered, revoked, or terminated charters from the New York City charter school cap. In 2015, a similar provision allowed an additional 22 charters to be reissued to charter schools that had lost their charter before July 1, 2015.[17] The Governor’s proposal would enable about 20 charter schools that have closed since July 1, 2015 to reopen without having to raise the cap. As of early 2019, New York City reached the State-imposed limit on charters and therefore no additional charter schools can be authorized in the City.
Other Costs to the City
Other cost shifts to New York City would subtract $133 million in State funds from New York City in FY 2022, including the elimination of the state share of the federal Public Indigent Care Pool, a 5 percent reduction in various local aid programs, and a reduction in State reimbursement for public health programs. The Executive Budget would reduce New York City’s General Public Health Work (GPHW) reimbursement rate for core public health services, such as disease prevention, community health assessments, and communicable disease control, from 20 percent to 10 percent above the base grant, resulting in an annual loss of about $25 million. Previously, in the adopted budget for FY 2020, the State lowered the City’s GPHW reimbursement rate from 36 percent to 20 percent at an ongoing cost of $59 million per year.
Revenues
On the revenue side, for the third consecutive year, the Governor included legislation in the Executive Budget to legalize and tax the sale of cannabis for adults over 21 years old. The Governor proposed imposing two taxes: a wholesale tax based on THC content and a State surcharge on retail sales. The first tax would vary by category. The rate would be $0.04 per milligram of THC for edibles; $0.01 per milligram for concentrates; and $0.007 per milligram for cannabis flowers. Sales of cannabis products would also be subject to a 10.25 percent State surcharge on the retail price. Unlike proposals in prior years, cannabis sales would be subject to the City and State sales tax.
The State expects to begin collecting $20 million in new revenue in SFY 2022, rising to $118 million in SFY 2023, $162 million in SFY 2024, $252 million in SFY 2025, $350 million in SFY 2026, and $374 million in SFY 2027. A specified dollar amount would first be distributed to a Cannabis Social Equity Fund — $10 million in SFY 2023, $20 million in SFY 2024, $30 million in SFY 2025, $40 million in SFY 2026, and $50 million in each subsequent year. Additional revenues would be deposited into a Cannabis Revenue Fund and could be used for the following purposes: administration of the regulated cannabis program, data gathering, monitoring and reporting, the Governor’s Traffic Safety Committee, implementation and administration of the initiatives and programs of the social and economic equity plan in the Office of Cannabis Management, substance abuse, harm reduction and mental health treatment and prevention, public health education and intervention, research on cannabis uses and applications, program evaluation and improvements, and any other identified purpose recommended by the executive director of the Office of Cannabis Management and approved by DOB.
The Comptroller’s Office has estimated that the market for adult-use marijuana in New York City would be about $1.1 billion. Consequently, once the existing underground market transitions to the legal market, the legalization of cannabis could generate approximately $50 million per year in local sales tax for the City.
Other revenue proposals in the Governor’s budget are discussed above in “State, Federal Legislation, and Other Issues Impacting PIT and Business Taxes“ on page 20.
Expenditures Analysis
Total-funds FY 2022 expenditures in the January Financial Plan are projected to drop by $2.77 billion from FY 2021. Both FY 2021 and FY 2022 expenditures include prepayments which lower debt service expenditures in these fiscal years. In addition, FY 2021 expenditures are reduced by the use of surplus Retiree Health Benefits Trust (RHBT) funds to defray part of retiree health insurance costs. FY 2021 expenditures are also further reduced by the take-down of the general reserve and the re-estimates of prior-year accruals. After adjusting for prepayments, and excluding re-estimates of prior-year accruals and reserves, expenditures are projected to drop by a smaller $1.94 billion to $95.54 billion, as shown in Table 15. However, the FY 2021 budget includes $3.58 billion of COVID-19 related expenditures which are expected to drop to $14 million in FY2022. Netting out COVID-19 related spending, expenditures are projected to grow by $1.98 billion, or 2.1 percent in FY 2022.
Over the Plan period, adjusted expenditures before reserves are projected to grow by 4.6 percent, as shown in Table 15. This growth is driven primarily by increases in expenditures for debt service, health insurance, other fringe benefits and pensions, which together are estimated to grow by $6.71 billion, or 25.0 percent.
Table 15. FY 2021 – FY 2025 Expenditure Growth
Adjusted for Prepayments and Prior-Year Actions
| ($ in millions) | FY 2021 | FY 2022 | FY 2023 | FY 2024 | FY 2025 | Growth FYs 21-25 | Annual Growth |
| Debt Service | $6,457 | $7,358 | $8,483 | $8,822 | $9,379 | 45.3% | 9.8% |
| Health Insurance | 6,968 | 6,925 | 7,621 | 8,295 | 8,942 | 28.3% | 6.4% |
| Other Fringe Benefits | 4,049 | 4,540 | 4,506 | 4,635 | 4,764 | 17.7% | 4.1% |
| Pensions | 9,390 | 10,150 | 10,357 | 10,548 | 10,485 | 11.7% | 2.8% |
| Subtotal | $26,864 | $28,974 | $30,967 | $32,300 | $33,569 | 25.0% | 5.7% |
| Salaries and Wages | $28,789 | $29,265 | $29,599 | $29,871 | $30,333 | 5.4% | 1.3% |
| Medicaid | 5,553 | 5,915 | 5,915 | 5,915 | 5,915 | 6.5% | 1.6% |
| Public Assistance | 1,611 | 1,651 | 1,650 | 1,650 | 1,650 | 2.4% | 0.6% |
| Judgments and Claims | 727 | 742 | 758 | 775 | 791 | 8.8% | 2.1% |
| Contractual Services | 19,249 | 16,847 | 16,933 | 16,894 | 16,901 | (12.2%) | (3.2%) |
| Other OTPS | 14,691 | 12,150 | 12,352 | 12,623 | 12,779 | (13.0%) | (3.4%) |
| Subtotal | $70,621 | $66,569 | $67,208 | $67,727 | $68,370 | (3.2%) | (0.8%) |
| Expenditures Before Reserves and Prior-Year Re-estimates | $97,485 | $95,543 | $98,175 | $100,027 | $101,939 | 4.6% | 1.1% |
| Retiree Health Benefits Trust | ($1,600) | $0 | $0 | $0 | $0 | ||
| Prior-Year Accruals Re-estimate | ($421) | $0 | $0 | $0 | $0 | ||
| General Reserve | $50 | $100 | $1,000 | $1,000 | $1,000 | ||
| Capital Stabilization Reserve | $0 | $250 | $250 | $250 | $250 | ||
| Total | $95,514 | $95,893 | $99,425 | $101,277 | $103,189 | 8.0% | 2.0% |
Note: Numbers may not add to totals due to rounding.
COVID-19 Expenditures
FY 2021 COVID-19 related expenditures total $3.58 billion in the January Plan, an increase of $834 million from the November Financial Plan. About three-quarter of the increase is due to additional funding of testing and tracing, which is increased by $621 million to $1.19 billion. Table 16 shows the allocation of COVID-19 spending by purpose. As shown in the table, about two-thirds of the spending is allocated for medical, surgical and lab supplies; testing and tracing; and food and forage supplies. Almost 85 percent of the expenditures are expected to be funded with Federal categorical grants, including $1.70 billion in FEMA reimbursements for 75 percent of eligible expenses. However, since the release of the January Plan, the President has signed an executive order authorizing full reimbursement for eligible COVID spending.
Table 16. FY 2021 COVID-19 Budget Allocation by Purpose
| ($ in millions) | Amount | Percent |
| Medical, Surgical and Lab Supplies | $660 | 18.4% |
| Testing and Tracing | 1,187 | 33.1% |
| Food and Forage | 527 | 14.7% |
| Emergency Response | 266 | 7.4% |
| Communicable Disease Prevention and Treatment (DOHMH) | 168 | 4.7% |
| Shelter Intake (DHS) | 329 | 9.2% |
| Remote Learning | 74 | 2.1% |
| 311 Surge Staffing | 13 | 0.4% |
| Other | 360 | 10.0% |
| Total | $3,584 | 100.0% |
Headcount
Compared to the November 2020 Plan, the January 2021 Headcount Plan shows net decreases in year-end full-time headcount of 2,530 in FY 2021, 4,978 in FY 2022, and 4,816 in each of FY 2023 and FY 2024. The reduction in headcount stems primarily from a hiring and attrition management initiative in the January Citywide Savings Program (CSP) which restricts non-essential civilian hiring to one new hire for every three separations. The hiring restriction is expected to reduce year-end full-time civilian headcounts by 2,604 in FY 2021, and 4,937 in each of FY 2022 through FY 2025.[18] In addition, cutbacks in street sweeping frequency are expected to reduce uniformed sanitation headcount by 41 positions in each of FY 2022 through FY 2025. Headcount increases due to new needs and plan adjustments offset some of the reductions, with the addition of 151 full-time staff to support the Mayor’s academic resiliency program in the Department of Education accounting for most of the new needs headcount.
Table 17. Full-time Headcount Changes
January 2021 Financial Plan vs. November 2020 Financial Plan
| FY 2021 | FY 2022 | FY 2023 | FY 2024 | |
| Pedagogical | ||||
| Dept. of Education | 0 | 113 | 113 | 113 |
| City University | 0 | 0 | 0 | 0 |
| Subtotal | 0 | 113 | 113 | 113 |
| Uniformed | ||||
| Police | 0 | 0 | 0 | 0 |
| Fire | 0 | 0 | 0 | 0 |
| Correction | 0 | 0 | 0 | 0 |
| Sanitation | 0 | (41) | (41) | (41) |
| Subtotal | 0 | (41) | (41) | (41) |
| Civilian | ||||
| Dept. of Education | 0 | 38 | 38 | 38 |
| City University | 0 | (175) | 0 | 0 |
| Police | (136) | 0 | 0 | 0 |
| Fire | 33 | 33 | 4 | 4 |
| Correction | (63) | 0 | 0 | 0 |
| Sanitation | (53) | 0 | 0 | 0 |
| Admin. for Children’s Services | (308) | 0 | 0 | 0 |
| Social Services | (723) | 0 | 0 | 0 |
| Homeless Services | (156) | 0 | 0 | 0 |
| Health and Mental Hygiene | (277) | 7 | 7 | 7 |
| Finance | (59) | 0 | 0 | 0 |
| Transportation | (69) | 0 | 0 | 0 |
| Parks and Recreation | (141) | 0 | 0 | 0 |
| All Other Civilians | (578) | (4,953) | (4,937) | (4,937) |
| Subtotal | (2,530) | (5,050) | (4,888) | (4,888) |
| Total | (2,530) | (4,978) | (4,816) | (4,816) |
Year-end full-time headcount is projected to increase by 0.3 percent from 299,472 in FY 2021 to 300,345 in FY 2023, and stay essentially unchanged at 300,342 for the remaining Plan period, as shown in Table 18. The increase stems primarily from a 2.3 percent increase in pedagogical headcount in DOE in FY 2022 to 126,823. Uniformed headcount is relatively flat over the Plan period, while civilian headcount is projected to drop by 1.8 percent by FY 2023.
Table 18. Total Funded Full-Time Year-End Headcount
January 2021 Financial Plan
| FY 2021 | FY 2022 | FY 2023 | FY 2024 | FY 2025 | |
| Pedagogical | |||||
| Dept. of Education | 123,968 | 126,823 | 126,823 | 126,823 | 126,823 |
| City University | 4,441 | 4,441 | 4,441 | 4,441 | 4,441 |
| Subtotal | 128,409 | 131,264 | 131,264 | 131,264 | 131,264 |
| Uniformed | |||||
| Police | 35,007 | 35,030 | 35,030 | 35,030 | 35,030 |
| Fire | 10,945 | 10,945 | 10,952 | 10,952 | 10,952 |
| Correction | 7,219 | 7,060 | 7,060 | 7,060 | 7,060 |
| Sanitation | 7,425 | 7,381 | 7,579 | 7,579 | 7,579 |
| Subtotal | 60,596 | 60,416 | 60,621 | 60,621 | 60,621 |
| Civilian | |||||
| Dept. of Education | 12,790 | 13,104 | 13,104 | 13,104 | 13,104 |
| City University | 1,947 | 1,771 | 1,946 | 1,946 | 1,946 |
| Police | 15,104 | 15,430 | 15,430 | 15,430 | 15,430 |
| Fire | 6,341 | 6,343 | 6,599 | 6,599 | 6,599 |
| Correction | 1,667 | 1,827 | 1,827 | 1,827 | 1,827 |
| Sanitation | 2,071 | 2,122 | 2,122 | 2,122 | 2,122 |
| Admin. for Children’s Services | 6,941 | 7,249 | 7,249 | 7,249 | 7,249 |
| Social Services | 12,781 | 13,592 | 13,592 | 13,592 | 13,592 |
| Homeless Services | 2,047 | 2,104 | 2,104 | 2,104 | 2,104 |
| Health and Mental Hygiene | 5,571 | 5,778 | 5,771 | 5,766 | 5,766 |
| Finance | 2,043 | 2,102 | 2,102 | 2,102 | 2,102 |
| Transportation | 5,304 | 5,408 | 5,410 | 5,412 | 5,412 |
| Parks and Recreation | 4,199 | 4,260 | 4,260 | 4,260 | 4,260 |
| All Other Civilians | 31,661 | 27,011 | 26,944 | 26,944 | 26,944 |
| Subtotal | 110,467 | 108,101 | 108,460 | 108,457 | 108,457 |
| Total | 299,472 | 299,781 | 300,345 | 300,342 | 300,342 |
To meet the FY 2021 year-end full-time headcount, headcount would need to decline by a net 974 from the June 30, 2020 level, as shown in Table 19. Headcount on November 30, 2020 was 5,371 below June 30, 2020 level. The City will need to increase headcount by 4,397 from the November level, an increase of 1.5 percent over seven months. With the restriction on non-essential civilian hiring, it likely that the City will end the fiscal year below planned year-end headcount, resulting in additional personal services savings at the end of the fiscal year.
Table 19. November 30, 2020 Headcount
vs Planned June 30, 2021 Headcount
| 6/30/2020 Actuals | 11/30/2020 Actuals | 6/30/2021 Plan | Change 6/30/2020 to 11/30/2020 | Planned Change 6/30/2020 to 6/30/2021 | |
| Pedagogical | |||||
| Dept. of Education | 121,077 | 119,384 | 123,968 | (1,693) | 2,891 |
| City University | 4,545 | 4,460 | 4,441 | (85) | (104) |
| Subtotal | 125,622 | 123,844 | 128,409 | (1,778) | 2,787 |
| Uniformed | |||||
| Police | 35,910 | 34,938 | 35,007 | (972) | (903) |
| Fire | 11,047 | 10,879 | 10,945 | (168) | (102) |
| Correction | 9,237 | 8,925 | 7,219 | (312) | (2,018) |
| Sanitation | 7,755 | 7,480 | 7,425 | (275) | (330) |
| Subtotal | 63,949 | 62,222 | 60,596 | (1,727) | (3,353) |
| Civilian | |||||
| Dept. of Education | 13,607 | 13,399 | 12,790 | (208) | (817) |
| City University | 1,743 | 1,715 | 1,947 | (28) | 204 |
| Police | 15,519 | 14,931 | 15,104 | (588) | (415) |
| Fire | 6,366 | 6,408 | 6,341 | 42 | (25) |
| Correction | 1,741 | 1,692 | 1,667 | (49) | (74) |
| Sanitation | 2,107 | 2,076 | 2,071 | (31) | (36) |
| Admin. for Children’s Svcs | 7,039 | 6,924 | 6,941 | (115) | (98) |
| Social Services | 12,330 | 12,135 | 12,781 | (195) | 451 |
| Homeless Services | 2,119 | 2,072 | 2,047 | (47) | (72) |
| Health and Mental Hygiene | 5,530 | 5,461 | 5,571 | (69) | 41 |
| Finance | 1,996 | 1,956 | 2,043 | (40) | 47 |
| Transportation | 5,120 | 5,053 | 5,304 | (67) | 184 |
| Parks and Recreation | 4,236 | 4,153 | 4,199 | (83) | (37) |
| All Other Civilians | 31,422 | 31,034 | 31,661 | (388) | 239 |
| Subtotal | 110,875 | 109,009 | 110,467 | (1,866) | (408) |
| Total | 300,446 | 295,075 | 299,472 | (5,371) | (974) |
Overtime
Overtime expenditures are projected at $1.187 billion in the FY 2022 Preliminary Budget. The FY 2022 projection is a little more than 16 percent higher than the budgeted amount of $1.022 billion for FY 2021. With the scale-back on everyday operations and non-essential City employees working from home due to the pandemic, spending on overtime continues to be lower than normal for most agencies. The Comptroller’s Office estimates that overtime spending will be approximately $1.309 billion for FY 2021 and $1.294 billion for FY 2022, exceeding the Plan projections by $287 million in FY 2021 and $107 million in FY 2022.
FY 2021 police uniformed budget is projected to be $228 million in the January Financial Plan. The suspension of planned events such as parades and street fairs has lowered uniformed overtime costs. As shown in Table 20 below, uniformed overtime spending for special programs, Operation Atlas, operational activities, events, new arrests and investigations were $88 million for the first quarter of FY 2021 compared to $173 million for the first quarter of FY 2020. Through December of FY 2021, the City has spent $174 million for uniformed police overtime compared to $311 million for the same period in FY 2020. Despite the lower spending, the Comptroller’s Office estimates that uniformed police overtime cost could still exceed the City’s estimate by $172 million for FY 2021 and by $45 million for FY 2022.
Table 20. FY 2021 vs FY 2020 1st Quarter NYPD Uniformed Overtime Spending
| ($ in millions) | Overtime FY 2021 | Overtime
FY 2020 |
Difference | % Change |
| Overtime Category | ||||
| Special Programs | $6.8 | $27.2 | ($20.4) | (75.0%) |
| Operation Atlas | 2.7 | 9.7 | (7.0) | (72.2%) |
| Operational | 9.1 | 21.7 | (12.6) | (58.1%) |
| Events | 32.9 | 62.3 | (29.4) | (47.2%) |
| New Arrests | 9.6 | 17.9 | (8.3) | (46.4%) |
| Investigations | 26.9 | 33.8 | (6.9) | (20.4%) |
| Total NYPD Uniformed | $88.0 | $172.6 | ($84.6) | (49.0%) |
Civilian overtime spending through December of FY 2021 was approximately $210 million, or 28.5 percent lower than overtime spending for the same period in FY 2020. Based on year-to-date spending, the Comptroller’s Office expects civilian overtime spending to be at least $458 million in FY 2021, about $143 million lower than FY 2020. However, the Financial Plan assumes an even sharper drop of $258 million in FY 2021, posing a risk of $115 million to the City’s budget for FY 2021. For FY 2022, the Comptroller’s Office estimates that civilian overtime spending will be slightly lower at $426 million, exceeding the City’s budget by $43 million.
Table 21. Projected Overtime Spending, FY 2021 and FY 2022
| Plan Overtime | FY 2021 Comptroller’s Projection | Risk | Plan Overtime | FY 2022 Comptroller’s Projection | Risk | |
| Uniformed | ||||||
| Police | $228 | $400 | ($172) | $405 | $450 | ($45) |
| Fire | 230 | 230 | 0 | 220 | 220 | 0 |
| Correction | 84 | 84 | 0 | 81 | 100 | (19) |
| Sanitation | 137 | 137 | 0 | 98 | 98 | 0 |
| Total Uniformed | $679 | $851 | ($172) | $804 | $868 | ($64) |
| Civilians | ||||||
| Police-Civilian | $27 | $40 | $(13) | $80 | $80 | $0 |
| Admin for Child Svcs | 35 | 35 | 0 | 48 | 48 | 0 |
| Environmental Protection | 48 | 48 | 0 | 45 | 45 | 0 |
| Transportation | 53 | 60 | (7) | 53 | 53 | 0 |
| All Other Agencies | 180 | 275 | (95) | 157 | 200 | (43) |
| Total Civilians | $343 | $458 | ($115) | $383 | $426 | ($43) |
| Total City | $1,022 | $1,309 | ($287) | $1,187 | $1,294 | ($107) |
Health Insurance
The FY 2022 Preliminary Budget includes $6.925 billion for employees’ and retirees’ pay-as-you-go health insurance, an increase of $1.6 billion or 29 percent from FY 2021. This increase stems from the use of RHBT assets to defray $1.6 billion of retiree pay-as-you-go health insurance cost. Annual retiree health insurance cost is paid out of the RHBT. In normal circumstances, the City would remit the cost of retiree health insurance to the RHBT. However, faced with the fiscal challenges in the wake of the COVID-19 pandemic, the City is reducing its remittance to the RBHT by $1.6 billion for FY 2021 and drawing on the RHBT assets to make up the shortfall in remittance.
Health insurance costs are then projected to increase to $7.62 billion in FY 2023, $8.30 billion in FY 2024, and $8.94 billion by FY 2025. In the June 2020 Financial Plan, health insurance projections were lowered by $1 billion in each fiscal year, beginning in FY 2021 as a place holder for labor savings to be negotiated with the City’s labor unions. Since then the City had negotiated with the unions to defer $776 million of FY 2021 lump sum and welfare fund payments to FY 2022, of which $691 million are recognized as budget reductions.[19] In addition, the City implemented a five day furlough of managerial and non-represented employees which is estimated to produce $19 million in savings. The City has credited the combined $710 million spending reductions as part of the $1 billion labor savings, leaving $290 million of the remaining savings as a reduction in health insurance expenditures in FY 2021.
Table 22. Pay-As-You-Go Health Expenditures
| ($ in millions) | FY 2021 | FY 2022 | FY 2023 | FY 2024 | FY 2025 |
| Department of Education | $2,824 | $3,049 | $3,369 | $3,659 | $3,990 |
| CUNY | 115 | 135 | 143 | 147 | 159 |
| All Other | 4,029 | 3,741 | 4,109 | 4,489 | 4,793 |
| Sub-total | $6,968 | $6,925 | $7,621 | $8,295 | $8,942 |
| Retiree Health Benefits Trust (RHBT) | (1,600) | ||||
| PAYGO Health Insurance Cost | $5,368 | $6,925 | $7,621 | $8,295 | $8,942 |
Health insurance expenditures are relatively unchanged when compared to the November Plan, with increases of $28 million in FY 2021 and $3 million in each of FY 2023 and FY 2024. There was a net reduction of $3 million to the FY 2022 projection. The expenditure projections are based on premium rate increases of 3.0 percent in FY 2021, 6.5 percent in FY 2022, 6.25 percent in FY 2023, 6.0 percent in FY 2024, and 5.75 percent for FY 2025 for actives and non-Medicare eligible retirees. Over the last five years, premium rates for actives and non-Medicare eligible retirees grew by 2.89 percent in FY 2016, 4.88 percent FY 2017, 7.60 percent in FY 2018, 6.97 percent in FY 2019, and 3.49 percent in FY 2020. Premium rate increase for Medicare-eligible retiree health insurance is projected to be 4.9 percent for FY 2021 and FY 2022, 4.8 percent in FY 2023 and FY 2024, and 4.7 percent in FY 2025.
Pensions
The January Financial Plan projects expenditures for pension contributions of $10.150 billion in FY 2022, a net increase of $760 million over the FY 2021 estimate. As shown in Table 23, pension contributions are then projected to grow to $10.55 billion by FY 2024 before declining slightly to $10.46 billion in FY 2025.
Compared to the November Plan, pension projections are lower by $430 million in FY 2021, $304 million in FY 2022, and $69 million in FY 2023 and higher by $350 million in FY 2024 and by $436 million in FY 2025. Revisions to the pension contribution projections result from changes to the actuarial assumptions and methodology for determining pension contributions proposed by the Office of the Actuary (OA).
Changes to the actuarial assumptions center around lowering the consumer price index (CPI) assumption from 2.5 percent to 2.3 percent over a four-year period by reducing the CPI by 0.05 percent annually, beginning with the June 30, 2019 valuation. As noted by the OA, the average annual increase in the CPI was about 2.1 percent over the last twenty years and about 1.7 percent over the most recent ten years. The change to the CPI is supported by the historical averages plus other factors, such as long-term changes in the CPI assumed by the New York City Retirement Systems’ investment advisors.
The CPI assumption is a component of the Actuarial Interest Rate Assumption (AIRA), general wage increase assumption, and cost of living assumption. As such, the .05 percent annual reduction in CPI over four years would change these assumptions as follows:
- AIRA from 7.0 percent to an ultimate rate of 6.8 percent per year by the June 30, 2022 valuation.[20]
- General wage increase component of the salary scale from 3.0 percent to an ultimate rate of 2.8 percent per year by the June 30, 2022 valuation.
- Cost of Living Assumption from 1.5 percent to an ultimate rate of 1.3 percent per year by the June 30, 2022 valuation.
Lowering the AIRA — which is also the discount rate used for calculating the present value of pension liabilities — has the effect of increasing the liabilities, and results in higher required pension contributions. The other CPI-related changes will slightly offset that increase.
A more significant near-term offset will result from a change in the valuation of the systems’ assets. Since the last market value restart in FY 2012, the City’s share of the market value of assets (MVA) has grown to $160.4 billion, while the City’s share of the actuarial value of assets (AVA) has grown to $155.2 billion.[21] The Chief Actuary has proposed re-setting the AVA equal to MVA. The difference between MVA and AVA will be amortized over 20 years and is expected to reduce the City’s pension contributions by $507 million in FY 2021.
In addition, the Chief Actuary has proposed reducing the phase-in period for recognizing gains and losses above the AIRA from six years to five years. Under the revised phase-in schedule, investment gains and losses will be phased-in at 20 percent annually compared to 15 percent in the first 4 years, and 20 percent in the final two years under the current schedule.
Additional changes to the actuarial assumptions include an update to the post-retirement mortality assumptions to reflect the latest improvement scale released by the Society of Actuaries (MP-2020). After adjusting for lower pension cost resulting from the market value restart, the City’s pension costs would decrease by $430 million in FY 2021, $304 million in FY 2022, and $65 million in FY 2023 but increase by $358 million in FY 2024 and $443 million in FY 2025.
Table 23. Changes to City Pension Contributions
| ($ in millions) | FY 2021 | FY 2022 | FY 2023 | FY 2024 | FY 2025 |
| Pension Expense November Plan | $9,820 | $10,454 | $10,426 | $10,198 | $10,049 |
| Change in Actuarial Assumptions and Method | ($430) | ($304) | ($65) | $358 | $443 |
| Headcount Changes | 0 | 0 | ($4) | ($8) | ($7) |
| Net Change | ($430) | ($304) | ($69) | $350 | $436 |
| Pension Expense January Plan | $9,390 | $10,150 | $10,357 | $10,548 | $10,485 |
Note: Numbers may not add due to rounding
Public Assistance
Through January, the City’s public assistance caseload has averaged 383,653 recipients per month in FY 2021. Average monthly caseload has jumped more than 16 percent, or about 53,213 recipients compared to the same period in FY 2020. As shown in Chart 6, the City’s public assistance caseload rose rapidly during the early stage of the COVID-19 pandemic, spiking from 325,016 in March 2020 to 387,355 in July 2020. Since July, the pace of growth has tapered off significantly and started to decline in October. Caseload levels continued to recede through the end of 2020 and into January 2021, dropping from the 2020 caseload peak of 391,432 in September to the latest reported data of 371,975. Meanwhile, monthly baseline grants spending in FY 2021 has averaged about $121 million to date, reflecting an increase of nearly 5 percent over the same July-January period in FY 2020.
Chart 6. 2020 and YTD Public Assistance Caseload and Monthly Changes
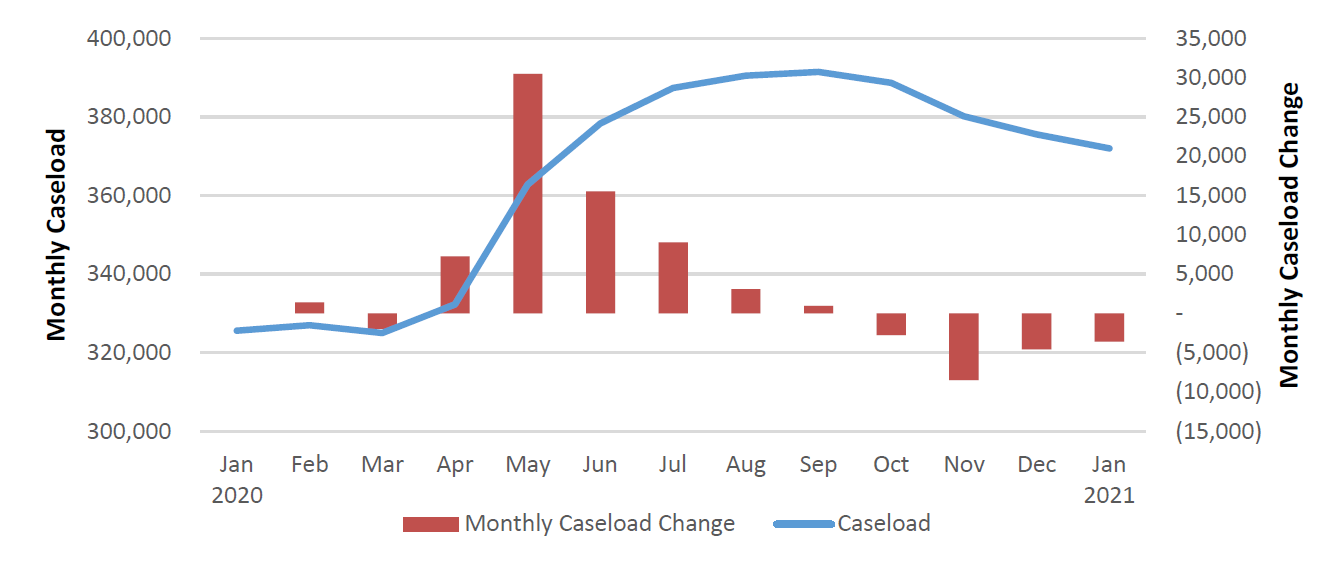
Though the City has not provided an update of its caseload projections, the January Plan maintains baseline grants expenditure estimates of approximately $1.44 billion in the current year and $1.48 billion in each of FY 2022 – FY 2025. Barring a significant rise in monthly spending, the City’s public assistance expenditures appear sufficiently funded.
Department of Education
The January Modification reflects a net increase of $422 million in the DOE budget in the current year. The DOE budget now totals $28.9 billion in FY 2021, an increase of about 3 percent or $884 million above actual FY 2020 spending of $28.02 billion. The current year increase in the January Modification is driven primarily by new needs of $220 million for special education Carter Cases and $58 million for school leases. In addition, $109 million in Federal Community Development Block grant has been recognized mainly to cover COVID-related spending, including $58 million for community meals, $25 million for iPad support and management, $13 million for software and $14 million for family support and school re-opening. The remainder of the increase consists mostly of $38 million in E-Rate revenue supporting school connectivity.
The FY 2022 Preliminary Budget projects DOE spending of $28.47 billion, a decline of $428 million or 1.5 percent from the FY 2021 budget. Compared to the November Plan, the FY 2022 Budget shows a net decrease of $220 million. The decline stems mainly from savings actions totaling $255 million, partly offset by $35 million to fund the new Academic Resiliency program under the Mayor’s school mental health initiative. The DOE savings center largely on a one-year reduction of Fair Student Funding school allocations ($150 million) and a delay in the rollout of 3-K programs in FY 2022 ($44 million). However, after the release of the Preliminary Budget, the Mayor announced these cuts will be restored as the Federal government committed greater FEMA reimbursement to support the City’s COVID spending. This would raise the DOE budget by $194 million in FY 2022 and reduce its portion of the Citywide Savings Plan to $61 million, comprised of $40 million in various programmatic reductions and $21 million in teacher per session costs.[22]
Under the State Executive Budget released in January, the DOE is earmarked to receive $2.15 billion in Federal funds under the Coronavirus Response and Relief Supplemental Act approved by Congress in December 2020. However, about 75 percent of this total would be offset by a shortfall in State education aid estimates and leave the City with only a $547 million gain in formula aids above the January Plan projections in FY 2022. In addition, the State has proposed to shift a host of education costs to the City outside of proposed formula aids, including reduced funding for charter leases and prior year reimbursement. A more detailed discussion on the State’s education aid proposals can be found in the Federal and State Aid section beginning on page 22.
These changes are summarized in Table 24.
Table 24. Changes to DOE FY 2021 and FY 2022 Budget Since November
| ($ in millions) | FY 2021 | FY 2022 | Change | Pct. Change |
| November Plan | $28,477 | $28,691 | $214 | 0.8% |
| City Funds Changes | 275 | (258) | ||
| Non-City Funds Changes | 147 | 38 | ||
| January Plan as Presented | $28,899 | $28,471 | ($428) | (1.5%) |
| Subsequent Actions | ||||
| Reverse Certain Cuts | – | 194 | ||
| January Plan Adjusted | $28,899 | $28,665 | ($234) | (0.8%) |
| State Executive Budget Impact | ($249) | $461 |
Note: Budget projections are net of Intra-City funds.
In the outyears, the DOE budget is expected to rise to $29.52 billion in FY 2023, reflecting an increase of slightly more than $1 billion from the FY 2022 Preliminary Budget. Over the remainder of the plan, funding for the Department is projected to rise to $29.91 billion in FY 2024 and $30.36 billion in FY 2025, reflecting annual increases of $397 million and $443 million, respectively. The most significant component of the outyear growth is City funds, which is expected to increase by $1.47 billion between FY 2022 and FY 2025. State support is projected to rise by $453 million in FY 2023 and stay flat thereafter. However, given the State’s budget woes, it is unclear if these assumptions will materialize as planned.
A number of other spending risks should be recognized in the DOE budget. First, the DOE budget has not yet reflected potential costs from increased charter school tuition rates expected in the outyears. Unless the State provides additional reimbursement in future years, the City could face potential shortfalls of $154 million to $600 million in FY 2022 – FY 2025. Second, while the City has addressed the growth of Carter Cases spending in FY 2021 with a funding increase of $220 million in the January Plan, the budget for this program remains underfunded in the outyears and will likely require additional funding of $150 million annually. Third, aside from the current year, the Department’s transportation needs remain unaddressed in the January Plan that could result in risks of $75 million annually in FY 2022-FY 2025. Finally, the DOE also will likely face a risk of $20 million in each of FY 2021 – FY 2025 for Medicaid reimbursement for special education services. Although the DOE’s Medicaid claiming process has improved over the years, the current assumptions include claims for transportation reimbursement of $20 million annually that have yet to be approved by the State.
These risks are offset by about $50 million in potential underspending annually in the special education pre-kindergarten program, which is budgeted at significantly higher levels than FY 2020 actual spending.
Homeless Services
Spending on adult and family shelter in the DHS is the primary driver of the City’s homelessness expenses. However, funding for homeless assistance is also, and increasingly, drawn from the budgets of other agencies, including the Department of Social Services, the Department of Youth and Community Development, the Department of Health and Mental Hygiene and the Department of Veterans Services. Table 25 details changes in total funding for seven major categories of homeless services across these agencies, starting with FY 2014, which provides a baseline for homeless services spending at the start of the current mayoral administration, and covering the Financial Plan period FY 2021 – FY 2025.
Table 25. Citywide Homeless Services Expenditures
| ($ in millions) | FY 2014 | FY 2021 | FY 2022 | FY 2023-25 (annual) |
| Adult Shelter Operations | $326 | $672 | $656 | $656 |
| Family Shelter Operations | 505 | 1,111 | 1,123 | 1,123 |
| Rental Assistance | 215 | 518 | 515 | 527 |
| Prevention, Diversion, Anti-Eviction & Aftercare | 221 | 472 | 462 | 463 |
| Domestic Violence, Youth & Emergency Shelters | 69 | 112 | 111 | 111 |
| Homeless Administration & Support Services | 151 | 600 | 262 | 262 |
| Total Citywide Homeless Spending | $1,488 | $3,485 | $3,130 | $3,142 |
Note: Numbers may not add due to rounding. FY 2014 figures are actual expenditures; FY 2021 through FY 2025 are planned.
Since FY 2014, planned citywide homeless services expenditures rose by over 128 percent, to $3.39 billion in FY 2020 (net of COVID-related spending of $143 million in FY 2020). Spending on homeless services is projected at $3.49 billion in FY 2021, including $330 million in COVID-related spending, before dropping to $3.13 billion in FY 2022 (with no budgeted COVID-related spending).
The average shelter census dropped from 59,903 individuals in FY 2019 to 58,615 individuals in FY 2020. COVID-19 concerns have seemingly been a driver of this reduction. Since the start of the pandemic period the total number of individuals in shelter has dropped by more than 5,200.
Shelter operations will comprise more than 60 percent of the homeless services budget in FY 2022. Additional expenditures of $11.7 million by the Department of Homeless Services are planned for family shelter operations in FY 2022 while adult shelter operations are scheduled to decrease by $15.4 million. This planned decrease for adult shelter operations continues a pattern of underestimating the cost of adult shelter operations and rests on an assumption that the adult shelter population could fall in FY 2022. However, the momentum propelling the adult shelter census upwards over the last several years would need to dramatically change. As Chart 7 illustrates, there has been a steady upward trajectory in the single adult shelter population. Barring any forthcoming policies to aggressively reduce the single adult shelter census or the emergence of new emergency funding from the Federal government, the Preliminary FY 2022 Budget for adult shelter operations appears to be insufficient. Even if the City is able to keep its adult shelter census at current levels, it is anticipated that at least $12.2 million in additional City funds will be necessary to meet adult shelter expenses in FY 2022.
Chart 7. Growth in the Single Adult Shelter Census, FY 2014 – FY 2021

Source – Single Adult shelter census on January 20th of each year as published by NYC Open Data
In the Prevention, Diversion, Anti-eviction, Aftercare and Other category, FY 2022 spending is planned to decrease by a cumulative $10.1 million. Of particular note are some changes in spending for anti-eviction programs in FY 2022. Anti-eviction services are planned to drop by $25 million, but anti-eviction outreach programming and the City’s Access to Counsel program have been bolstered by $1.5 million and $8.5 million, respectively, in FY 2022. The City also recently reduced City-funds expenditures for the Access to Counsel program by $8.5 million for the remainder of FY 2021. These adjustments may reflect additional anticipated delays in the full resumption of housing court activity in the next fiscal year. New York has been under a moratorium on residential evictions for tenants experiencing hardships related to COVID-19 since March 20, 2020. The State’s current anti-eviction order is in place until at least May 1, 2021 and there have been several instances of the anti-eviction period’s deadline being extended during the pandemic period. Other major programmatic changes in this category include over $22 million more for the Department of Social Service’s Subsidized Jobs for Homeless Clients program and a $12 million reduction to the Housing for Homeless Vets initiative.
Other notable changes to Citywide homeless services expenditures for FY 2022 impact the City’s support for supportive housing programs, including increased spending at the Department of Health and Mental Hygiene for New York City’s 15/15 supportive housing initiative, which is planned to rise from approximately $39.1 million in the FY 2021 budget to $62 million in FY 2022 and the outyears. However, the Department of Social Services is reducing $11.6 million in anticipated supportive housing expenditures in FY 2022 as part of the Citywide Savings Program. Finally, overall spending on rental assistance programs across various agencies will remain flat in FY 2022.
NYC Health + Hospitals
In its latest financial plan update, H+H projects ending the current fiscal year with a cash balance of $551 million. The City anticipates the H+H cash balance would decline to $256 million in the FY 2022 Preliminary Budget. Both projections represent significant declines from prior cash balance estimates of $869 million and $632 million in FY 2021 and FY 2022, respectively. The City indicates the declines mainly stem from unintended consequences of Federal stimulus plans that provide enhanced Federal Medical Assistance Percentage (eFMAP) reimbursement rates without increasing Federal allotments for Disproportionate Share Hospitals (DSH) payments. Under the State’s DSH distribution formula, H+H is the last payee in the system for the largest pool of DSH, receiving only the residual balance after all other DSH-eligible hospitals are paid. Therefore, while certain hospitals are drawing additional DSH funding under the enhanced reimbursement change, the residual balance assigned to H+H is actually shrinking because the DSH allotment is depleting more rapidly than under normal circumstances. H+H has appealed to the Federal government to resolve the misalignment issue by either exempting DSH claims from the eFMAP provision or increasing the Federal DSH allocation. Unless the Federal government takes remedial actions, H+H estimates it could lose DSH revenues of $383 million in FY 2021 and $408 million in FY 2022 while eFMAP is in effect through the end of calendar 2021.
As a result, H+H would face operating deficits of $138 million in FY 2021 and $295 million in FY 2022 instead of generating surpluses that would have significantly improved its cash position. The outlook improves by FY 2023, showing a surplus of $218 million as the eFMAP impact on DSH expires, enabling H+H to end the year with an estimated cash balance of $474 million. However, over the remainder of the Plan, the operating deficits would return at more than $200 million annually mainly due to DSH reductions of over $600 million in both FY 2024 and FY 2025. The reductions, which were slated to begin in December 2020, have been further delayed until Federal FY 2024. A major element of the H+H budget projections is the Transformation Plan, which includes revenue and savings actions totaling $807 million to $1.27 billion in each of FY 2021-FY 2025. The largest components of the plan are Supplemental Medicaid programs with annual values of $300 million to $653 million, revenue cycle and managed care ($143-$219 million) and growth initiatives ($62-$233 million).
IV. Capital Budget and Financing Program
Capital Commitment Plan, FY 2021 – FY 2025
The January 2021 Capital Commitment Plan for the five-year period FY 2021 through FY 2025 totals $84.13 billion in authorized all-funds commitments, as shown in Table 26.[23] City-funds commitments account for $78.0 billion of the total. All-funds commitments decreased by $1.46 billion, or 2.1 percent, from the November 2020 Commitment Plan.
All-Funds Commitments
All-funds commitments, after adjusting for the $8.28 billion reserve for unattained commitments, total $75.85 billion, or an average of $15.17 billion per year.[24] Approximately 17 percent of all-funds commitments, after netting out the reserve for unattained commitments, are scheduled for FY 2021.
Similar to past capital commitment plans, commitments for DOE and the City University of New York (CUNY), the Department of Environmental Protection (DEP), the Department of Transportation (DOT) and Mass Transit, and Housing and Economic Development account for a majority of total commitments, with 63.7 percent of total commitments.[25]
Table 26. FY 2021 – FY 2025 Capital Commitments, All-Funds
| Project Category | January FY 2021 – FY 2025 Commitment Plan | Percent of Total | Change from November 2020 Plan |
| Education and CUNY | $17,911 | 21.3% | 234 |
| Environmental Protection | 12,662 | 15.1% | 1,406 |
| Dept. of Transportation and Mass Transit | 11,218 | 13.3% | (953) |
| Housing and Economic Development | 11,770 | 14.0% | (200) |
| Administration of Justice | 8,911 | 10.6% | (643) |
| Resiliency, Technology and Equipment | 5,763 | 6.9% | (301) |
| Parks Department | 4,992 | 5.9% | (382) |
| Hospitals | 2,638 | 3.1% | 32 |
| Other City Operations and Facilities | 8,260 | 9.8% | (651) |
| Total Authorized Commitments | $84,126 | 100.0% | ($1,458) |
| Reserve for Unattained Commitments | ($8,280) | N/A | 449 |
| Total Net of Reserve for Unattained Commitments | $75,846 | N/A | ($1,009) |
Source: NYC Office of Management and Budget, FY 2021 – FY 2025 January Capital Commitment Plan, January 2021.
Note: Changes from November 2020 Plan are based on FY 2021 – FY 2024 only. Numbers may not add due to rounding.
The net decrease of $1.46 billion in authorized commitments from the November 2020 Plan over FY 2021 to FY 2024 is comprised of increases of $143.5 million in FY 2021 and $60.2 million in FY 2022, offset by decreases of $644.0 million in FY 2023 and $1.02 billion in FY 2024.
The increase of $143.5 million in estimated commitments in FY 2021 stems primarily from an acceleration of $454 million of HPD commitments into FY 2021 and a $266 million addition for the emergency purchase of learning devices in DOE. These increases are offset by a net decrease of $576 million among the remaining projects.
While FY 2022 showed a moderate net increase of $60.2 million, there were several significant revisions to individual projects. These include increases of $529 million for water pollution control projects and $147 million for sewer related projects, and decreases of $156 million for HPD projects due to their acceleration into FY 2021, and a $125 million decrease in resiliency, energy efficiency and equipment projects/purchases. The restoration of the Gowanus Canal superfund project in Brooklyn accounts for $416 million of the $529 million increase in water pollution control projects.
The decrease of $644 million in FY 2023 is largely driven by deferrals and acceleration of projects into the outyears and prior years, respectively. These include the deferrals of $334 million in Parks Department projects, and $179 million of the NYPD firearms training facility project on Rodman’s Neck in the Bronx to the outyears, and the acceleration of $156 million of HPD projects into FY 2021.
The decrease of $1.02 billion in FY 2024 is comprised of a decrease of $512 million in highway bridges projects, due largely to the delay in the Trans-Manhattan Expressway project in Washington Heights, deferrals of $357 million in various highway and street reconstruction projects, and $266 million in miscellaneous Courts related projects to the outyears. About 37 other project types combine for a net increase of about $117 million.
Preliminary Ten-Year Capital Strategy
The City is required by Sections 215 and 234 of the City Charter to issue a Preliminary Ten-Year Capital Strategy (Preliminary Strategy) every odd calendar year. The Preliminary Strategy for FY 2022 – FY 2031 totals $118.8 billion — $112.57 billion in City-funds and $6.22 billion in non-City funds. This is an increase of $1.88 billion, or 1.6 percent, increase from the last Ten-Year Capital Strategy published in April 2019 (the “prior Strategy”), as shown on Table 27.
Table 27. Preliminary Ten-Year Capital Strategy FY 2022 – FY 2031
vs April 2019 Ten-Year Capital Strategy
|
($ in millions) |
April 2019 Capital Strategy – City-Funds | April 2019 Capital Strategy – All-Funds | January 2021 Capital Strategy – City-Funds | January 2021 Capital Strategy – All-Funds | Change in City-Funds | Change in All-Funds |
| Education (DOE and CUNY) | $23,128 | $24,776 | $19,395 | $21,752 | $(3,733) | $(3,025) |
| Environmental Protection | 19,744 | 20,114 | 20,439 | 20,835 | 695 | 720 |
| DOT | 14,703 | 16,051 | 17,112 | 18,497 | 2,410 | 2,445 |
| Housing (HPD and NYCHA) | 12,461 | 12,781 | 12,554 | 12,874 | 93 | 93 |
| Administration of Justice | 13,632 | 13,670 | 12,881 | 12,900 | (752) | (770) |
| Hospitals (H + H) | 1,534 | 2,621 | 2,137 | 2,850 | 603 | 229 |
| Resiliency, Tech. & Equipment | 7,227 | 7,708 | 8,103 | 8,299 | 877 | 591 |
| Business Services | 3,658 | 3,922 | 4,329 | 4,524 | 671 | 602 |
| Parks Department | 4,178 | 4,591 | 4,618 | 5,026 | 440 | 434 |
| All Other | 10,446 | 10,673 | 11,005 | 11,235 | 559 | 563 |
| Total | $110,711 | $116,909 | $112,573 | $118,790 | $1,862 | $1,881 |
Source: January 2021 Preliminary Ten-Year Capital Strategy, Fiscal Years 2022-2031, and the April 2019 Ten-Year Capital Strategy. Note: Numbers may not add due to rounding.
The Preliminary Strategy is front-loaded with 56 percent of estimated commitments over the first four years. The majority of the commitments are for Education, DEP, Housing (including NYCHA), economic development, and DOT projects, which together constitute 66 percent of the current January 2021 Preliminary Strategy. The categories with the largest changes from the prior capital strategy are Education (DOE) with a decrease of $3.02 billion, DOT with an increase of $2.44 billion, and DEP with an increase of $720 million. The decrease in DOE from the prior Strategy is due primarily to declines in the system expansion category which includes new construction and leases. These changes, in large part, reflect revisions to commitments over FY 2022 – 2024 due to the School Construction Authority’s (SCA) process of planning in five-year intervals. Since SCA’s plan does not extend beyond FY 2024, it is unclear at this point if these reductions reflect deferrals to the outyears, or if there will be other increases in the outyears that will offset some of these reductions.
The increase in DOT is due to revisions in pedestrian ramp and bridge life extension related projects. DEP’s increase is due to estimated increases in water main and sewer related projects offset by decreases in water pollution control project estimates.
Commitments in the current capital strategy are also allocated among three “lifecycle” project categories: state of good repair, which involves maintaining and repairing facilities and infrastructure; program expansion, which involves adding new or expanding current facilities and infrastructure; and programmatic replacement, which involves replacing facilities or equipment. More than half of the commitments, $62.22 billion, are allocated for state of good repair followed by $30.19 billion for program replacement, and $26.37 billion for program expansion as shown in Table 28.
About 52 percent of the commitments for state of good repair are for maintaining transportation and education infrastructure in a state of good repair. These include about $10 billion for bridge reconstruction, $7.1 billion for the reconstruction and resurfacing of streets and highways, and $13.9 billion for the reconstruction and rehabilitation of schools.
Almost three quarters of programmatic replacements are for a variety of projects related to environmental control, sanitation, and administration of justice. Programmatic replacement in DEP includes $5.17 billion for the upgrade of water pollution control plants and $2.91 billion for water main replacement and dam safety programs. Commitments for programmatic replacement related to the administration of justice are driven by the design and construction of new jail facilities which is projected to cost $8.08 billion and the renovation and reconstruction of Court facilities with a projected cost of $2.31 billion.
Program expansion, which accounts for the smallest share of commitments in the Preliminary Strategy is focused in DOE, DEP and HPD, and Economic Development which together account for over 95 percent of the planned commitments for program expansion. These commitments are driven by commitments of $7.15 billion for the new school construction, $2.32 billion for the construction of the third water tunnel, $2.53 billion for the sewer extension to accommodate new development and water quality preservation, $5.51 billion for new and special needs housing, $2.45 billion for neighborhood revitalization and community development, and $2.07 billion for industrial, commercial, waterfront and market development.
Table 28. FY 2022 – FY 2031 Preliminary Ten-Year Capital Strategy
Major Capital Commitments by Life-Cycle Project Categories
|
Agency/ Project Type ($ in millions) |
State of Good Repair | Program Expansion | Programmatic Replacement |
Total |
| Department of Education/CUNY | $14,557 | $7,148 | $47 | $21,752 |
| Department Environmental Protection: | $1,214 | $8,358 | $11,262 | $20,834 |
| Water Pollution Control | 0 | 656 | 7,211 | 7,866 |
| Water Mains | 140 | 1,936 | 2,912 | 4,988 |
| Sewers | 1,021 | 3,440 | 585 | 5,046 |
| Water Supply | 1 | 2,326 | 0 | 2,327 |
| DEP Equipment | 52 | 0 | 555 | 607 |
| Dept. of Transportation: | $17,968 | $0 | $528 | $18,497 |
| Bridges and Highway Bridges | 9,979 | 0 | 25 | 10,004 |
| Highways | 7,146 | 0 | 0 | 7,146 |
| Traffic | 843 | 0 | 0 | 843 |
| Ferries | 1 | 0 | 433 | 434 |
| Transportation Equipment | 0 | 0 | 70 | 70 |
| Housing Preservation and Development | $4,475 | $5,506 | $0 | $9,981 |
| NYCHA | $2,879 | $14 | $0 | $2,893 |
| Economic Development (SBS) | $0 | $4,524 | $0 | $4,524 |
| Administration of Justice | $1,503 | $125 | $11,272 | $12,900 |
| Police | 594 | 0 | 617 | 1,211 |
| Correction | 909 | 108 | 8,342 | 9,359 |
| Courts | 0 | 17 | 2,313 | 2,330 |
| Resiliency, Technology, and Citywide Equipment | $5,677 | $0 | 2,622 | 8,299 |
| Parks Department | $4,767 | $259 | $0 | $5,026 |
| Hospitals (H +H) | $2,168 | $86 | $595 | $2,850 |
| Other City Operations and Facilities | $7,014 | $354 | $3,868 | $11,236 |
| Total | $62,223 | $26,373 | $30,194 | $118,790 |
Source: Office of Management and Budget, FY 2021 Preliminary Ten-Year Capital Strategy, January 2021.
Note: Numbers may not tie due to rounding
The Preliminary Strategy continues to be primarily financed by City bonds (GO and TFA FTS), with an estimated $92.13 billion in anticipated local tax-supported borrowing, or 77.6 percent of the Preliminary Strategy. Municipal Water Finance Authority (NYW) debt is expected to fund $20.44 billion, or 17.2 percent of the Preliminary Strategy. The remaining 5.2 percent, about $6.22 billion, will be funded with Federal, State, and other non-City resources as shown on Table 29.
Table 29. Funding of the FY 2022 – FY 2031 Preliminary Ten-Year Capital Strategy
| Agency/Project Type ($ in millions) |
Tax- Supported |
Water Authority Funded |
Non-City Funded |
Total Funded |
| Department of Education/CUNY | $19,395 | $0 | $2,357 | $21,752 |
| Department Environmental Protection: | $0 | $20,439 | $395 | $20,835 |
| Water Pollution Control | 0 | 7,476 | 390 | 7,866 |
| Water Mains | 0 | 4,985 | 3 | 4,988 |
| Sewers | 0 | 5,045 | 2 | 5,047 |
| Water Supply | 0 | 2,327 | 0 | 2,327 |
| DEP Equipment | 0 | 607 | 0 | 607 |
| Dept. of Transportation | $17,112 | 0 | $1,384 | $18,496 |
| Bridges and Highway Bridges | 9,487 | 0 | 517 | 10,004 |
| Highways | 6,626 | 0 | 520 | 7,146 |
| Traffic | 613 | 0 | 230 | 843 |
| Ferries | 317 | 0 | 116 | 434 |
| Transportation Equipment | 69 | 0 | 1 | 70 |
| Housing Preservation and Development | $9,661 | $0 | $320 | $9,981 |
| NYCHA | $2,893 | $0 | $0 | $2,893 |
| Economic Development (SBS) | $4,329 | $0 | $195 | $4,524 |
| Administration of Justice | $12,881 | $0 | $19 | $12,900 |
| Police | 1,200 | 0 | 11 | 1,211 |
| Correction | 9,359 | 0 | 0 | 9,359 |
| Courts | 2,322 | 0 | 8 | 2,330 |
| Resiliency, Technology, and Citywide Equipment | $8,103 | $0 | $196 | $8,299 |
| Parks Department | $4,618 | $0 | $408 | $5,026 |
| Hospitals (H +H) | $2,137 | $0 | $713 | $2,850 |
| Other City Operations and Facilities | $11,005 | $0 | $230 | $11,235 |
| Total | $92,134 | $20,439 | $6,217 | $118,790 |
| Percent of Total Funding | 77.6% | 17.2% | 5.2% | 100.0% |
Source: Office of Management and Budget, FY 2022-2031 Preliminary Ten-Year Capital Strategy, January 2021.
Note: Numbers may not add due to rounding.
Financing Program
The January 2021 Financial Plan contains $54.04 billion of planned borrowing in FY 2021 – FY 2025, as shown in Table 30. The borrowing is comprised of $21.25 billion of GO bonds, $23.61 billion of TFA FTS borrowing, $8.20 billion of New York Water Finance Authority (NYW) borrowing and $981 million from issuance of TFA Building Aid Revenue Bonds (BARB) that are supported by State school building aid revenues.
Table 30. January 2021 Plan Financing Program
| ($ in millions) | Estimated Borrowing and Funding Sources FY 2021 – FY 2025 | Percent of Total |
| General Obligation Bonds | $21,248 | 39.3% |
| TFA FTS Bonds | 23,613 | 43.7% |
| NYC Water Finance Authority | 8,202 | 15.2% |
| TFA BARBs | 981 | 1.8% |
| Total | $54,044 | 100.0% |
Source: NYC Office of Management and Budget, January 2021 Financial Plan.
Total projected borrowing in the January Plan for FY 2021 – FY 2025 is $155 million more than the November 2020 Financial Plan estimate. This is a result of an increase of $559 million in FY 2021, followed by decreases of $152 million in FY 2022, $23 million in FY 2023, and $229 million in FY 2024. Over the FY 2021 – 2024 period, NYW borrowing is estimated to increase by $593 million, while City GO and TFA FTS borrowing is forecast to decrease by $285 million and $160 million, respectively. In contrast, TFA BARBs borrowing is projected to be remain relatively flat with a modest increase of $7 million. These changes in borrowing reflect the reductions in the Capital Plan over FY 2021 – FY 2024.[26]
Debt Service
As shown in Table 31, debt service, net of prepayments, in the January 2021 Plan totals $6.54 billion in FY 2021, $7.43 billion in FY 2022, $8.56 billion in FY 2023, $8.90 billion in FY 2024, and $9.46 billion in FY2025. Between FY 2021 and FY 2025, total debt service is expected to increase by $2.92 billion, or an annual average growth rate of 9.7 percent. These projections do not include debt service of the NYW, which is backed by water and sewer user fees, and that of the TFA BARBs, which is supported by New York State building aid.
Table 31. January 2021 Financial Plan Debt Service Estimates
| ($ in millions) | FY 2021 | FY 2022 | FY 2023 | FY 2024 | FY 2025 | Change FY 2021 – FY 2025 |
Average Annual Growth |
| GO | $3,499 | $3,899 | $4,460 | $4,735 | $4,927 | $1,428 | 8.9% |
| TFA FTSa | 2,832 | 3,334 | 3,876 | 3,969 | 4,336 | 1,504 | 11.2% |
| Lease-Purchase | 125 | 125 | 148 | 118 | 116 | (9) | (1.9%) |
| TSASC, Inc. | 82 | 76 | 76 | 76 | 76 | (6) | (1.9%) |
| Total | $6,538 | $7,434 | $8,559 | $8,898 | $9,455 | $2,917 | 9.7% |
Source: January 2021 Financial Plan.
Note: Debt service is adjusted for prepayments.
a Amounts do not include TFA BARBs
The January Plan projections represent decreases from the November 2020 Financial Plan of $215 million in FY 2021, and $326 million in FY 2022, an increase of $14 million in FY 2023, and a decrease of $4 million in FY 2024. The decreases from the November Plan are due primarily to re-estimates of VRDB costs, downward revisions of letter of credit (LOC) and remarketing fees, and savings from refunding actions. Over the FY 2021-2024 period, re-estimates of VRDB lowered GO debt service by $198 million and TFA FTS debt service by $118 million; revisions to LOC and remarketing fees reduced debt service by $35 million; and refunding produced debt service savings of $205 million.
Since the beginning of FY 2021, the City has carried out two GO refundings, one in September and another in December, and a TFA FTS refunding in September. In total, the City refunded $3.0 billion of GO bonds with the issuance of $2.89 billion in refunding bonds, lowering debt outstanding by about $112 million. In the TFA’s sole FTS debt refunding, $1.98 billion of TFA FTS debt was refunded with the issuance of $1.62 billion in refunding bonds, lowering the TFA FTS debt outstanding by about $360 million. As shown on Table 32, the refunding actions produced savings of $445 million for GO and $372 million for TFA FTS debt service over FY 2021-2025. Combined, the savings total just below $817 million over the period.
Table 32. Year-To-Date FY 2021 GO and TFA FTS Savings
from Refunding Actions
| ($ in millions) | FY 2021 | FY 2022 | FY 2023 | FY 2024 | FY 2025 | Total |
| GO Refunding | $272.90 | $171.80 | $0.00 | $0.00 | $0.00 | $444.70 |
| TFA FTS Refunding | 229.90 | 141.40 | 0.20 | 0.20 | 0.20 | 371.90 |
| Total | $502.80 | $313.20 | $0.20 | $0.20 | $0.20 | $816.60 |
Debt Affordability
Debt service as a percent of local tax revenues and as a percent of total-funds revenues are commonly used measures of debt affordability. In FY 2020, the City’s debt service was 10.7 percent of local tax revenues. The January 2021 Plan projects that debt service will consume 10.6 percent of local tax revenues in FY 2021, rising to 11.8 percent in FY 2022, 13.1 percent in FY 2023, 13.2 percent in FY 2024, and 13.7 percent in FY 2025, as shown in Chart 8. The upward trend in the debt service to tax revenue ratio reflects the disparity between debt service and tax revenue growth rates over the Plan period. Debt service is projected to grow at an average annual rate of 9.8 percent from FY 2021 to FY 2025, while tax revenues during this period are projected to grow 2.9 percent annually.[27] Based on an assumption of 3 percent annual tax revenue growth in FY 2025 – FY 2031, this ratio would average 14.3 percent over this period. If annual tax revenue growth over this seven year period were to drop to 1.0 percent, the ratio would approach the 15 percent threshold that is considered prudent by FY 2027.
Chart 8. NYC Debt Service as a Percent of Tax Revenues
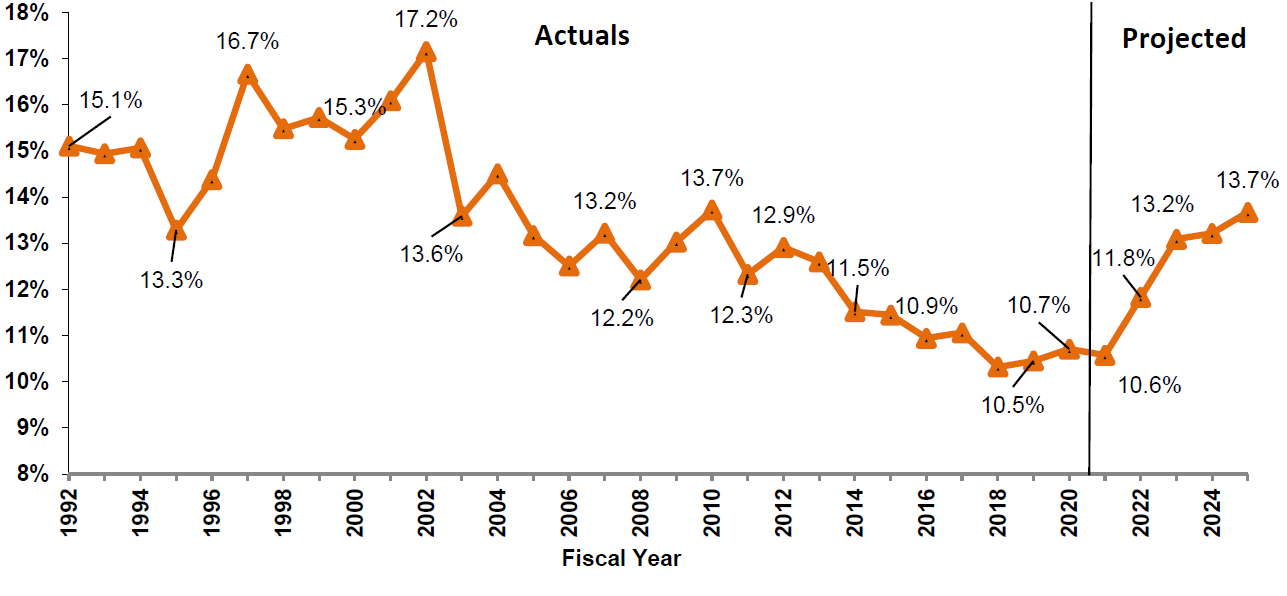
Source: Office of the NYC Comptroller, Comprehensive Annual Financial Reports, FY 1992 – FY 2020, and NYC Office of Management and Budget, January 2021 Financial Plan.
Debt service is also projected to grow at a faster rate than total revenues (including taxes, non-tax revenues, and Federal, State and other categorical aid) over the Plan period. As such, debt service is projected to consume an increasing share of total revenues as well. As shown in Chart 9, the City’s debt service as a percent of all-funds revenues is estimated to be 6.9 percent in FY 2021, 8.1 percent in FY 2022, 9.0 percent in FY 2023, 9.2 percent in FY 2024, and 9.6 percent in FY 2025. The debt service growth of 9.7 percent over the Financial Plan period is significantly higher than the projected total revenue growth of 1.0 percent, resulting in the growth of the ratio.[28]
Chart 9. NYC Debt Service as a Percent of Total Revenues
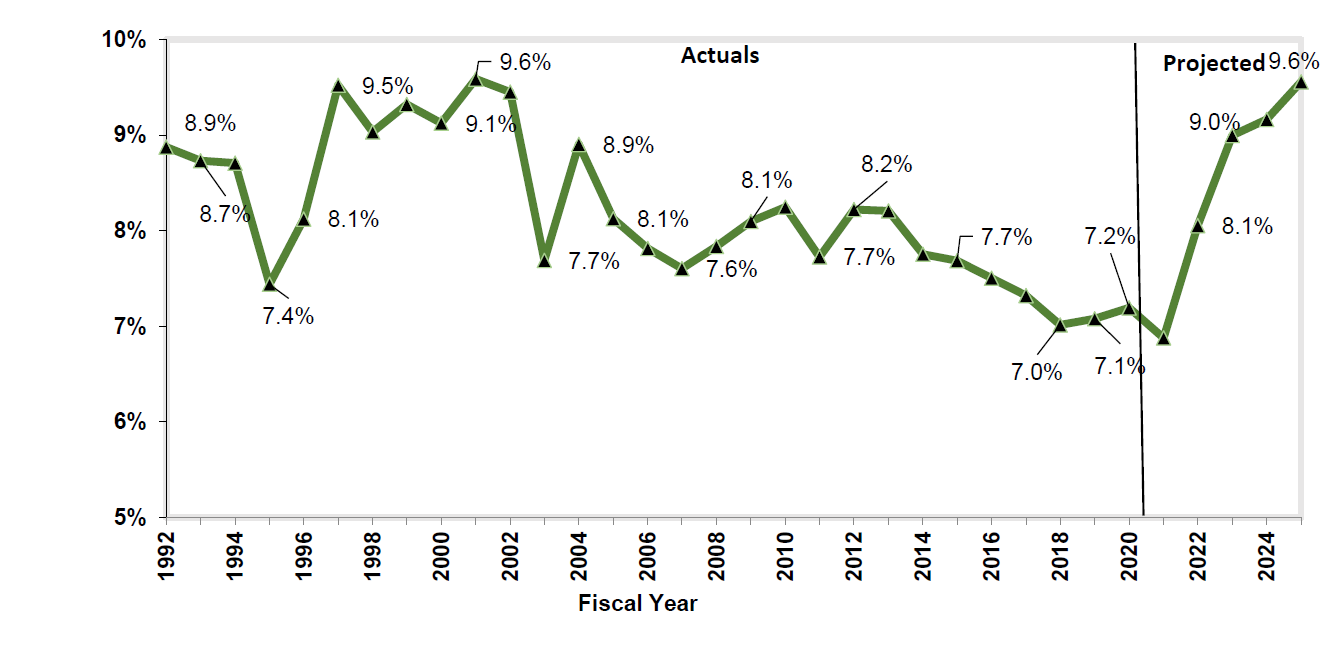
Source: Office of the NYC Comptroller, Comprehensive Annual Financial Reports, FY 1992 – FY 2020, and NYC Office of Management and Budget, January 2021 Financial Plan.
V. Appendix
Table A1. January 2021 Financial Plan Revenue Detail
| ($ in millions) | FY 2021 | FY 2022 | FY 2023 | FY 2024 | FY 2025 | Change FYs 2021 – 2025 Dollars Percent |
Annual Percent Change | |
| Taxes: | ||||||||
| Real Property | $30,845 | $29,522 | $30,192 | $30,619 | $31,027 | $182 | 0.6% | 0.1% |
| Personal Income Tax | 12,744 | 13,506 | 14,257 | 14,776 | 15,333 | 2,589 | 20.3% | 4.7% |
| General Corporation Tax | 3,930 | 4,235 | 4,397 | 4,383 | 4,410 | 480 | 12.2% | 2.9% |
| Unincorporated Business Tax | 1,932 | 2,005 | 2,090 | 2,170 | 2,253 | 321 | 16.6% | 3.9% |
| Sale and Use Tax | 6,551 | 7,648 | 8,414 | 8,992 | 9,451 | 2,900 | 44.3% | 9.6% |
| Real Property Transfer | 936 | 1,141 | 1,332 | 1,421 | 1,516 | 580 | 62.0% | 12.8% |
| Mortgage Recording Tax | 770 | 885 | 917 | 979 | 1,045 | 275 | 35.7% | 7.9% |
| Commercial Rent | 831 | 874 | 902 | 925 | 946 | 115 | 13.8% | 3.3% |
| Utility | 359 | 374 | 377 | 384 | 393 | 34 | 9.5% | 2.3% |
| Hotel | 75 | 225 | 350 | 520 | 630 | 555 | 740.0% | 70.2% |
| Cigarette | 24 | 23 | 22 | 21 | 20 | (4) | (16.7%) | (4.5%) |
| All Other | 892 | 833 | 833 | 833 | 833 | (59) | (6.6%) | (1.7%) |
| Tax Audit Revenue | 1,171 | 921 | 721 | 721 | 721 | (450) | (38.4%) | (11.4%) |
| Total Taxes | $61,060 | $62,192 | $64,804 | $66,744 | $68,578 | $7,518 | 12.3% | 2.9% |
| Miscellaneous Revenue: | ||||||||
| Licenses, Franchises, Etc. | $649 | $686 | $685 | $687 | $685 | $36 | 5.5% | 1.4% |
| Interest Income | 14 | 10 | 11 | 12 | 13 | (1) | (7.1%) | (1.8%) |
| Charges for Services | 968 | 1,033 | 1,033 | 1,033 | 1,033 | 65 | 6.7% | 1.6% |
| Water and Sewer Charges | 1,720 | 1,561 | 1,558 | 1,557 | 1,557 | (163) | (9.5%) | (2.5%) |
| Rental Income | 245 | 243 | 243 | 243 | 243 | (2) | (0.8%) | (0.2%) |
| Fines and Forfeitures | 953 | 1,103 | 1,098 | 1,098 | 1,098 | 145 | 15.2% | 3.6% |
| Miscellaneous | 655 | 343 | 342 | 341 | 340 | (315) | (48.1%) | (15.1%) |
| Intra-City Revenue | 2,061 | 1,811 | 1,807 | 1,806 | 1,806 | (255) | (12.4%) | (3.2%) |
| Total Miscellaneous Revenue | $7,265 | $6,790 | $6,777 | $6,777 | $6,775 | ($490) | (6.7%) | (1.7%) |
| Reserve for Disallowance of Categorical Grants | ($15) | ($15) | ($15) | ($15) | ($15) | $0 | 0.0% | 0.0% |
| Less: Intra-City Revenue | ($2,061) | ($1,811) | ($1,807) | ($1,806) | ($1,806) | $255 | (12.4%) | (3.2%) |
| TOTAL CITY-FUNDS | $66,249 | $67,156 | $69,759 | $71,700 | $73,532 | $7,283 | 11.0% | 2.6% |
Note: Numbers may not add due to rounding.
Table A1 (Con’t). January 2021 Financial Plan Revenue Detail
| ($ in millions) | FY 2021 | FY 2022 | FY 2023 | FY 2024 | FY 2025 | Change FYs 2021 – 2025 Dollars Percent |
Annual Percent Change | |
| Other Categorical Grants | $1,133 | $1,020 | $988 | $986 | $985 | ($148) | (13.1%) | (3.4%) |
| Inter-Fund Agreements | $695 | $706 | $656 | $656 | $656 | ($39) | (5.6%) | (1.4%) |
| Federal Categorical Grants: | ||||||||
| Community Development | $879 | $297 | $261 | $261 | $261 | ($618) | (70.3%) | (26.2%) |
| Welfare | 3,777 | 3,441 | 3,441 | 3,441 | 3,441 | (336) | (8.9%) | (2.3%) |
| Education | 2,720 | 2,000 | 1,962 | 1,962 | 1,962 | (758) | (27.9%) | (7.8%) |
| Other | 4,490 | 1,338 | 1,282 | 1,265 | 1,260 | (3,230) | (71.9%) | (27.2%) |
| Total Federal Grants | $11,866 | $7,076 | $6,946 | $6,929 | $6,924 | ($4,942) | (41.6%) | (12.6%) |
| State Categorical Grants | ||||||||
| Social Services | $1,885 | $1,826 | $1,818 | $1,818 | $1,818 | ($67) | (3.6%) | (0.9%) |
| Education | 10,848 | 12,252 | 12,705 | 12,705 | 12,705 | 1,857 | 17.1% | 4.0% |
| Higher Education | 283 | 283 | 282 | 282 | 282 | (1) | (0.4%) | (0.1%) |
| Department of Health and Mental Hygiene | 558 | 548 | 546 | 546 | 546 | (12) | (2.2%) | (0.5%) |
| Other | 1,537 | 1,418 | 1,414 | 1,463 | 1,463 | (74) | (4.8%) | (1.2%) |
| Total State Grants | $15,111 | $16,327 | $16,765 | $16,814 | $16,814 | $1,703 | 11.3% | 2.7% |
| TOTAL REVENUES | $95,054 | $92,285 | $95,114 | $97,085 | $98,911 | $3,857 | 4.1% | 1.0% |
Note: Numbers may not add due to rounding.
Table A2. January 2021 Financial Plan Expenditure Detail
| ($ in millions) | FY 2021 | FY 2022 | FY 2023 | FY 2024 | FY 2025 | Change FYs 2021 – 2025 Dollars Percent |
Annual Percent Change |
|
| Mayoralty | $147 | $154 | $149 | $149 | $149 | $3 | 1.9% | 0.5% |
| Board of Elections | 160 | 136 | 135 | 135 | 135 | (25) | (15.4%) | (4.1%) |
| Campaign Finance Board | 95 | 15 | 15 | 15 | 15 | (80) | (84.4%) | (37.1%) |
| Office of the Actuary | 7 | 7 | 7 | 7 | 7 | 0 | 4.4% | 1.1% |
| President, Borough of Manhattan | 5 | 5 | 5 | 5 | 5 | (0) | (8.3%) | (2.1%) |
| President, Borough of Bronx | 6 | 6 | 6 | 6 | 6 | (1) | (10.2%) | (2.7%) |
| President, Borough of Brooklyn | 7 | 7 | 6 | 6 | 6 | (1) | (14.0%) | (3.7%) |
| President, Borough of Queens | 6 | 6 | 5 | 5 | 5 | (1) | (19.0%) | (5.1%) |
| President, Borough of Staten Island | 5 | 5 | 4 | 4 | 4 | (0) | (6.9%) | (1.8%) |
| Office of the Comptroller | 109 | 108 | 110 | 110 | 110 | 1 | 0.8% | 0.2% |
| Dept. of Emergency Management | 324 | 29 | 29 | 29 | 29 | (295) | (91.1%) | (45.4%) |
| Office of Administrative Tax Appeals | 6 | 6 | 6 | 6 | 6 | 0 | 2.1% | 0.5% |
| Law Dept. | 257 | 237 | 241 | 241 | 241 | (16) | (6.3%) | (1.6%) |
| Dept. of City Planning | 46 | 42 | 42 | 42 | 42 | (5) | (9.8%) | (2.5%) |
| Dept. of Investigation | 51 | 45 | 46 | 45 | 45 | (5) | (10.4%) | (2.7%) |
| NY Public Library — Research | 31 | 29 | 30 | 30 | 30 | (1) | (1.8%) | (0.5%) |
| New York Public Library | 154 | 147 | 151 | 151 | 151 | (3) | (2.0%) | (0.5%) |
| Brooklyn Public Library | 116 | 111 | 114 | 114 | 114 | (2) | (2.1%) | (0.5%) |
| Queens Borough Public Library | 121 | 116 | 119 | 119 | 119 | (2) | (1.9%) | (0.5%) |
| Dept. of Education | 28,899 | 28,471 | 29,518 | 29,915 | 30,358 | 1,459 | 5.0% | 1.2% |
| City University | 1,235 | 1,156 | 1,268 | 1,288 | 1,305 | 70 | 5.7% | 1.4% |
| Civilian Complaint Review Board | 20 | 21 | 20 | 20 | 20 | 1 | 3.0% | 0.7% |
| Police Dept. | 5,060 | 5,114 | 5,164 | 5,164 | 5,164 | 103 | 2.0% | 0.5% |
| Fire Dept. | 2,159 | 2,092 | 2,103 | 2,093 | 2,093 | (66) | (3.1%) | (0.8%) |
| Dept. of Veterans’ Services | 6 | 6 | 6 | 6 | 6 | 0 | 2.6% | 0.6% |
| Admin. for Children Services | 2,674 | 2,646 | 2,646 | 2,646 | 2,646 | (28) | (1.0%) | (0.3%) |
| Dept. of Social Services | 9,790 | 10,081 | 10,040 | 10,040 | 10,040 | 251 | 2.6% | 0.6% |
| Dept. of Homeless Services | 2,393 | 2,052 | 2,053 | 2,053 | 2,053 | (340) | (14.2%) | (3.8%) |
| Dept. of Correction | 1,140 | 1,157 | 1,195 | 1,195 | 1,195 | 55 | 4.9% | 1.2% |
| Board of Correction | 2 | 3 | 3 | 3 | 3 | 0 | 9.8% | 2.4% |
| Citywide Pension Contribution | 9,390 | 10,151 | 10,356 | 10,548 | 10,484 | 1,094 | 11.7% | 2.8% |
| Miscellaneous | 9,361 | 11,511 | 11,780 | 12,552 | 13,385 | 4,024 | 43.0% | 9.4% |
| Debt Service | 3,903 | 4,024 | 4,608 | 4,853 | 5,043 | 1,140 | 29.2% | 6.6% |
| T.F.A. Debt Service | 2,553 | 3,334 | 3,876 | 3,969 | 4,336 | 1,782 | 69.8% | 14.2% |
| FY 2020 BSA | (3,819) | 0 | 0 | 0 | 0 | 3,819 | (100.0%) | (100.0%) |
| FY 2021 BSA | 3,358 | (3,358) | 0 | 0 | 0 | (3,358) | (100.0%) | (100.0%) |
| Public Advocate | 5 | 5 | 4 | 4 | 4 | (0) | (0.7%) | (0.2%) |
| City Council | 82 | 56 | 56 | 56 | 56 | (25) | (31.0%) | (8.9%) |
| City Clerk | 5 | 6 | 6 | 6 | 6 | 1 | 12.3% | 2.9% |
| Dept. for the Aging | 419 | 383 | 383 | 382 | 382 | (37) | (8.8%) | (2.3%) |
| Dept. of Cultural Affairs | 189 | 144 | 149 | 149 | 149 | (40) | (21.2%) | (5.8%) |
| Financial Info. Serv. Agency | 112 | 111 | 111 | 111 | 111 | (1) | (0.8%) | (0.2%) |
| Office of Payroll Admin. | 14 | 15 | 15 | 15 | 15 | 1 | 4.6% | 1.1% |
| Independent Budget Office | 6 | 6 | 6 | 6 | 6 | 0 | 1.4% | 0.3% |
| Equal Employment Practices | 1 | 1 | 1 | 1 | 1 | 0 | 6.5% | 1.6% |
Note: Numbers may not add due to rounding.
Table A2 (Con’t). January 2021 Financial Plan Expenditure Detail
| ($ in millions) | FY 2021 | FY 2022 | FY 2023 | FY 2024 | FY 2025 | Change FYs 2021 – 2025 Dollars Percent |
Annual Percent Change | |||
| Civil Service Commission | 1 | 1 | 1 | 1 | 1 | 0 | 8.6% | 2.1% | ||
| Landmarks Preservation Commission | 7 | 7 | 7 | 7 | 7 | 0 | 0.4% | 0.1% | ||
| Taxi & Limousine Commission | 54 | 55 | 57 | 56 | 56 | 2 | 3.6% | 0.9% | ||
| Commission on Human Rights | 13 | 13 | 13 | 13 | 13 | 0 | 3.4% | 0.8% | ||
| Youth & Community Development | 741 | 603 | 609 | 609 | 609 | (132) | (17.8%) | (4.8%) | ||
| Conflicts of Interest Board | 3 | 3 | 3 | 3 | 3 | 0 | 10.1% | 2.4% | ||
| Office of Collective Bargaining | 2 | 2 | 2 | 2 | 2 | 0 | 1.8% | 0.4% | ||
| Community Boards (All) | 19 | 19 | 19 | 19 | 19 | (0) | (0.1%) | (0.0%) | ||
| Dept. of Probation | 119 | 113 | 115 | 115 | 115 | (4) | (3.0%) | (0.8%) | ||
| Dept. Small Business Services | 283 | 152 | 138 | 137 | 137 | (146) | (51.5%) | (16.6%) | ||
| Housing Preservation & Development | 1,269 | 1,031 | 1,012 | 1,012 | 1,012 | (257) | (20.3%) | (5.5%) | ||
| Dept. of Buildings | 189 | 182 | 189 | 189 | 189 | (0) | (0.0%) | (0.0%) | ||
| Dept. of Health & Mental Hygiene | 2,175 | 1,765 | 1,749 | 1,747 | 1,747 | (427) | (19.6%) | (5.3%) | ||
| NYC Health + Hospitals | 1,539 | 1,196 | 1,178 | 1,187 | 1,187 | (352) | (22.9%) | (6.3%) | ||
| Office of Administrative Trials & Hearings | 47 | 51 | 51 | 51 | 51 | 5 | 10.1% | 2.4% | ||
| Dept. of Environmental Protection | 1,496 | 1,384 | 1,378 | 1,377 | 1,377 | (119) | (8.0%) | (2.1%) | ||
| Dept. of Sanitation | 2,143 | 1,729 | 1,744 | 1,743 | 1,743 | (400) | (18.7%) | (5.0%) | ||
| Business Integrity Commission | 9 | 9 | 9 | 9 | 9 | 0 | 4.9% | 1.2% | ||
| Dept. of Finance | 322 | 317 | 316 | 316 | 316 | (6) | (1.7%) | (0.4%) | ||
| Dept. of Transportation | 1,128 | 1,142 | 1,128 | 1,129 | 1,129 | 1 | 0.1% | 0.0% | ||
| Dept. of Parks and Recreation | 503 | 471 | 485 | 485 | 485 | (18) | (3.6%) | (0.9%) | ||
| Dept. of Design & Construction | 326 | 150 | 151 | 151 | 151 | (175) | (53.7%) | (17.5%) | ||
| Dept. of Citywide Admin. Services | 1,212 | 531 | 529 | 529 | 529 | (684) | (56.4%) | (18.7%) | ||
| D.O.I.T.T. | 680 | 560 | 569 | 581 | 587 | (93) | (13.7%) | (3.6%) | ||
| Dept. of Record & Info. Services | 11 | 16 | 16 | 16 | 16 | 5 | 48.5% | 10.4% | ||
| Dept. of Consumer Affairs | 41 | 41 | 41 | 41 | 41 | 1 | 1.6% | 0.4% | ||
| District Attorney – N.Y. | 136 | 125 | 125 | 125 | 125 | (11) | (7.9%) | (2.0%) | ||
| District Attorney – Bronx | 93 | 91 | 91 | 91 | 91 | (2) | (1.7%) | (0.4%) | ||
| District Attorney – Kings | 125 | 119 | 119 | 119 | 119 | (5) | (4.3%) | (1.1%) | ||
| District Attorney –Queens | 78 | 77 | 77 | 77 | 77 | (1) | (1.4%) | (0.3%) | ||
| District Attorney – Richmond | 19 | 19 | 18 | 18 | 18 | (1) | (3.3%) | (0.8%) | ||
| Office of Prosec. & Special Narc. | 26 | 25 | 25 | 25 | 25 | (0) | (1.2%) | (0.3%) | ||
| Public Administrator – N.Y. | 1 | 1 | 1 | 1 | 1 | 0 | 4.9% | 1.2% | ||
| Public Administrator – Bronx | 1 | 1 | 1 | 1 | 1 | 0 | 0.0% | 0.0% | ||
| Public Administrator – Brooklyn | 1 | 1 | 1 | 1 | 1 | 0 | 0.0% | 0.0% | ||
| Public Administrator – Queens | 1 | 1 | 1 | 1 | 1 | 0 | 3.5% | 0.9% | ||
| Public Administrator – Richmond | 1 | 1 | 1 | 1 | 1 | (0) | (0.9%) | (0.2%) | ||
| Prior Payable Adjustment | (421) | 0 | 0 | 0 | 0 | 421 | (100.0%) | (100.0%) | ||
| General Reserve | 50 | 100 | 1,000 | 1,000 | 1,000 | 950 | 1900.0% | 111.5% | ||
| Citywide Savings Initiatives | 0 | (313) | (375) | (381) | (387) | (387) | NA | NA | ||
| Energy Adjustment | 0 | 57 | 105 | 142 | 169 | 169 | NA | NA | ||
| Lease Adjustment | 0 | 39 | 80 | 121 | 164 | 164 | NA | NA | ||
| OTPS Inflation Adjustment | 0 | 0 | 56 | 111 | 167 | 167 | NA | NA | ||
| TOTAL EXPENDITURES | $95,053 | $92,285 | $99,425 | $101,277 | $103,189 | $8,136 | 8.6% | 2.1% | ||
Note: Numbers may not add due to rounding.
Endnotes
[1] https://www.cdc.gov/coronavirus/2019-ncov/vaccines/index.html
[2] https://www1.nyc.gov/site/doh/covid/covid-19-data.page#summary
[3] https://covid19vaccine.health.ny.gov/covid-19-vaccine-tracker
[4] https://www.nytimes.com/2021/01/21/health/biden-covid-vaccine-supply.html
[5] https://gis.cdc.gov/grasp/covidnet/COVID19_5.html
[6] https://www.cdc.gov/coronavirus/2019-ncov/need-extra-precautions/older-adults.html
[7] Non-City funds revenues are increased by a total of $198 million, with increases of $82 million in Federal categorical grants, $42 million in State categorical grants, $22 million in other categorical grants, and $52 million in interfund agreement revenues.
[8] Includes change in property tax STAR.
[9] Property tax revenue herein includes the State’s reimbursement for STAR and revenues associated with the City’s PEG Savings program. The Governor’s budget however has proposed reducing STAR as detailed in the State section of this report.
[10] Class 3 properties which include utility companies grew by almost seven percent.
[11] Stock Market Bubble? Warning Sign A Storm Is Coming (forbes.com)
[12] Local reform to business taxes largely phased out the previous banking corporation tax which was replaced by the GCT.
[13] The City could be indirectly impacted by this proposal but the larger question of whether the Federal Government will repeal the SALT limitation makes this an unsettled issue at this time
[14] New York by the Numbers: Weekly Economic and Fiscal Outlook No. 33 – February 1st, 2021 : Office of the New York City Comptroller Scott M. Stringer (nyc.gov)
[15] January 2021 Financial Plan Detail, Fiscal Years 2021-2025 (nyc.gov)
[16] The governor also proposed to expand sales taxes for home sharing platforms like Airbnb. However, the City limits the use of home sharing platforms, so the revenue impacts would likely be limited.
[17] http://www.p12.nysed.gov/psc/facts/nyscsfactsheet080420.pdf
[18] While the Plan shows headcount reductions and savings by agencies in FY 2021, there are no details on where the reductions will take place in the outyears.
[19] The $776 million lump deferral includes lump sum deferrals for both active employees and retirees. The City had booked retirees lump sum as an FY 2014 expense, which accounts for about $85 million of the lump sum deferrals. While only the deferrals of retiree lump sums are not recognized as budget reductions, the deferrals provide $776 million of cash flow relief in the current fiscal year.
[20] The June 30, 2022 valuation determines pension contributions for FY 2024.
[21] Over this period total MVA grew to $192.4 billion while the total AVA grew to $186.7 billion.
[22] The DOE savings program also includes a $38 million reduction in City funds spending for food services, which is fully offset by an increase in Federal school food revenue, thus posing no net impact on the DOE budget.
[23] The Commitment Plan is a schedule of anticipated capital contract registrations. Changes from the FY 2021 Adopted Capital Plan published in November 2020 are from FY 2021 – FY 2024 only. Estimates for FY 2025 were not included at that time.
[24] The annual average commitment of total authorized commitment, which includes reserve for unattained commitment, is $16.83 billion.
[25] This percentage assumes all DOT project types, not just bridges and highways.
[26] The November 2020 Plan did not include an estimate for FY 2025.
[27] Excludes TSASC debt service.
[28] Includes TSASC debt service.