
I. Executive Summary
The City’s fiscal outlook differs significantly from that depicted in the Preliminary Budget and Financial Plan released by the NYC Office of Management and Budget (OMB) on January 12, for three main reasons.
First, on February 17 the City and DC 37 announced a tentative contract agreement. The January Financial Plan funded raises of 1.25 percent per year for four years. The DC 37 agreement includes four annual raises of 3 percent, a fifth yearly raise of 3.25 percent, and a signing bonus of $3,000. The raises do not appear to be offset by savings or productivity increases. If this were to be pattern for all other unions, it would add costs of $2.5 billion in FY 2023, $1.8 billion in FY 2024, $3.4 billion in FY 2025, $3.9 billion in FY 2026, and $4.7 billion in FY 2027 for a total of $16.3 billion.
Second, the cost for shelter and services provided to asylum seekers is escalating. The January Financial Plan assumed the annual cost to be $1 billion in FY 2023 and zero in FY 2024 and beyond, and also assumed these costs would be covered in full by Federal aid. By February 7, City Hall had projected the cumulative cost for FY 2023 and FY 2024 would be $4.2 billion. State and Federal aid are currently projected to cover only one-quarter of that.
Third, the NY State Executive Budget, while providing partial funding for the cost of sheltering asylum seekers and an increase in school funding, also includes $1 billion in cost shifts, unfunded mandates, and revenue cuts just in FY 2024. Additional, significant costs could derive from the Governor’s proposals regarding charter schools. Finally, the cost of implementing the State’s class size mandate legislation enacted in 2022, which requires the City to reduce class size in its schools over the next five years, remains unfunded.
This report also incorporates an updated forecast of economic conditions and City revenues. The forecast reflects the economic resiliency in response to tighter monetary policy shown so far, and an outlook predicated on a successful economic “soft-landing.” In this scenario, the national and New York City economies slow down but avoid a recession. The analysis also incorporates up-to-date information on the City’s property tax, which is not included in the Financial Plan. The Office of the Comptroller’s projection of City revenues exceeds OMB’s by $1.38 billion in FY 2023, $2.32 billion in FY 2024, $1.90 billion in FY 2025, $2.19 billion in FY 2026, and $3.61 billion in FY 2027.
Despite the revised revenue projection, budget gaps are estimated at $1.30 billion in FY 2023 and $1.51 billion in FY 2024. Gaps swell to $7.07 billion in FY 2025, $10.22 billion in FY 2026 and $11.66 billion in FY 2027. These gaps do not include the risk deriving from the cost of services provided to asylum seekers: $823 million in FY 2023, $2.18 billion in FY 2024, and, potentially, $2.8 billion each year thereafter. The gaps also do not incorporate the fiscal impact of the Governor’s executive budget, of the Governor’s proposals regarding charter schools, and of class size legislation.
In FY 2023, the City has access to $1.8 billion in the General Reserve and Capital Stabilization Reserve, and the Mayor’s Executive Budget later this spring will include additional savings and resources to balance the FY 2024 budget. However, the full extent of the measures needed will depend on the cost and funding for the services provided to asylum seekers, and on the enacted State budget. In the outyears, the size of the budget gaps indicates the need of structural interventions on both expenses and revenues.
The FY 2024 Preliminary Budget & January 2023 Financial Plan
The FY 2024 Preliminary Budget totals $102.66 billion, reflecting a continued drop in spending with the ramping down of COVID-19 federal grant-related spending. The budget gap of $2.89 billion in the November Plan was resolved in the Preliminary Budget through a combination of revenue increases, and a pre-payment of $1.46 billion from FY 2023 to FY 2024.
The FY 2024 Preliminary Budget reflects the culmination of both the November Plan’s and the January Plan’s Program to Eliminate the Gap (PEG), for a total of $1.95 billion of savings. These savings programs resulted in a reduction of 4,374 City-funded positions.
The Comptroller’s Office anticipates overall tax revenues and miscellaneous revenues to come in higher than the City’s projections in each year of the Financial Plan. All categories of tax revenue are forecasted to come in higher than planned in FY 2023 and FY 2024. The Comptroller’s Office forecast for Property Tax Revenue grows significantly higher than the Plan in the outyears. All other tax revenues are projected to be higher than OMB’s forecast in each year, except Business Taxes and Real Estate Transaction taxes which begin to fall below OMB’s forecast in FY 2025 and FY 2026 respectively. In total, this report projects that revenues will be higher than OMB’s projections by $1.38 billion in FY 2023, $2.23 billion in FY 2024, $1.9 billion in FY 2025, $2.19 billion in FY 2026, and $3.61 billion in FY 2027.
Offsetting these higher revenues are a number of known and unknown expenses that are not yet included in OMB’s financial plan.
If, as noted above, labor contracts with all unions follow the same pattern as the recent agreement with DC 37, the City would face additional costs of $2.5 billion in FY 2023, $1.8 billion in FY 2024, $3.4 billion in FY 2025, $3.9 billion in FY 2026, and $4.7 billion in FY 2027.
The Comptroller’s Office is also including a variety of risks within the Department of Education’s budget. In addition to risks that this office has previously included, primarily for the exhaustion of federal stimulus funds and the chronic underbudgeting for Carter cases, pupil transportation, and charter school tuition, an additional risk is included for the class size mandates imposed by the State last year. The City is estimating the cost of implementing smaller class sizes will cost $1.3 billion once fully implemented ($433 million in FY 2026 and $867 million in FY 2027).
Other risks include additional underbudgeting within the City’s ongoing support of the Metropolitan Transportation Authority (MTA) and elevated temporary and overtime expenses compared to the budget.
Overall, the Comptroller’s estimated additional expense risk is $2.68 billion in FY 2023, $3.83 billion in FY 2024, $5.81 billion in FY 2025, $7.40 billion in FY 2026, and $8.80 billion in FY 2027. Combined with the revenue offsets above, the net risk, not yet incorporated into the Financial Plan, is $1.30 billion in FY 2023, $1.51 billion in FY 2024, $3.90 billion in FY 2025, $5.21 billion in FY 2026, and $5.20 billion in FY 2027.
It is with far less certainty that we layer in the possible expense of the asylum seekers on the five years of the Financial Plan. The January 2023 Financial Plan did not alter the November Plan addition of $1 billion of expense in FY 2023, with full Federal reimbursement. OMB has since stated that they expect the FY 2023 expenses to grow to $1.4 billion at current levels of growth till the end of the year, and the FY 2024 expenses would annualize to $2.8 billion. While OMB’s estimates do not extend beyond FY 2024, it is very likely that many of these expenses will continue in the outyears and possibly at even higher levels. Expected Federal and State assistance would only provide partial support, leaving a large portion of these costs to be borne by the City.
In addition, the Governor’s Executive Budget includes a number of other items that would directly impact the City’s budget, if enacted. While record-level school aid was driven by the first ever full funding of the State’s Foundation Aid formula, the City is set to receive only 21 percent of the historic $2.73 billion increase. Other significant proposals include raising the City’s contributions to the transit system by over $500 million per year and intercepting the Enhanced Federal Medical Assistance Percentage (eFMAP), that NYC and other localities across the State use to offset their share of Medicaid costs. These cost shifts and unfunded mandates would cost the City $1 billion in FY 2024 and grow to $2.3 billion if the charter cap is removed and the full number of allowable charter schools are implemented. If enacted, these changes would significantly widen the City’s budget gap.
Capital Budget & Financing
The January 2023 Capital Commitment Plan totals $96.55 billion in all-funds authorized commitments for FY 2023 – FY 2027, a $551.2 million (0.6 percent) increase compared to the September 2022 Capital Plan over the same fiscal years. The major increases are in projects related to water pollution control, sanitation, and citywide equipment, resiliency, and energy efficiency.
The City also released its required Preliminary Ten-Year Capital Strategy, which totals $159.33 billion for FY 2024 – FY 2033. This is an increase of $25.59 billion (19.1 percent), from the last Ten-Year Capital Strategy published in April 2021. The categories with the largest changes are the Department of Transportation with an increase of $8.43 billion, housing (HPD and NYCHA) with an increase of $7.92 billion, Department of Environmental Protection, with an increase of $6.38 billion, and the Parks Department with an increase of $3.13 billion. Offsetting these increases, is a projected decrease of $4.80 billion in Education/CUNY related projects.
Total projected borrowing in the January 2023 Financial Plan for FY 2023 through FY 2027 is $62.35 billion.
Table 1. FY 2023 – FY 2027 Financial Plan
| ($ in millions) | FY 2023 | FY 2024 | FY 2025 | FY 2026 | FY 2027 | Change FYs 2023 –2027 |
|
|---|---|---|---|---|---|---|---|
| Dollar | Percent | ||||||
| Revenues | |||||||
| Taxes: | |||||||
| General Property Tax | $31,421 | $32,013 | $32,146 | $32,156 | $32,156 | $735 | 2.3% |
| Other Taxes | 36,860 | 36,154 | 37,751 | 39,161 | 40,228 | 3,368 | 9.1% |
| Tax Audit Revenues | 721 | 721 | 721 | 721 | 721 | 0 | 0.0% |
| Subtotal: Taxes | $69,002 | $68,888 | $70,618 | $72,038 | $73,105 | $4,103 | 5.9% |
| Miscellaneous Revenues | 7,983 | 7,516 | 7,381 | 7,312 | 7,289 | (694) | (8.7%) |
| Unrestricted Intergovernmental Aid | 252 | 0 | 0 | 0 | 0 | (252) | (100.0%) |
| Less: Intra-City Revenues | (2,213) | (1,902) | (1,900) | (1,896) | (1,896) | 317 | (14.3%) |
| Disallowances Against Categorical Grants | (15) | (15) | (15) | (15) | (15) | 0 | 0.0% |
| Subtotal: City-Funds | $75,009 | $74,487 | $76,084 | $77,439 | $78,483 | $3,474 | 4.6% |
| Other Categorical Grants | 1,172 | 1,060 | 1,057 | 1,055 | 1,054 | (118) | (10.1%) |
| Inter-Fund Revenues | 726 | 698 | 699 | 699 | 699 | (27) | (3.7%) |
| Federal Categorical Grants | 12,424 | 9,485 | 8,151 | 7,017 | 6,999 | (5,425) | (43.7%) |
| State Categorical Grants | 17,057 | 16,925 | 17,163 | 17,217 | 17,281 | 224 | 1.3% |
| Total Revenues | $106,388 | $102,655 | $103,154 | $103,427 | $104,516 | ($1,872) | (1.8%) |
| Expenditures | |||||||
| Personal Service | |||||||
| Salaries and Wages | $31,497 | $31,492 | $31,937 | $32,625 | $33,323 | $1,826 | 5.8% |
| Pensions | 9,414 | 9,563 | 9,783 | 9,951 | 9,799 | 385 | 4.1% |
| Fringe Benefits | 12,535 | 13,501 | 14,379 | 15,119 | 15,726 | 3,191 | 25.5% |
| Subtotal-PS | $53,446 | $54,556 | $56,099 | $57,695 | $58,848 | $5,402 | 10.1% |
| Other Than Personal Service | |||||||
| Medical Assistance | $6,564 | $6,385 | $6,385 | $6,385 | $6,535 | ($29) | (0.4%) |
| Public Assistance | 1,650 | 1,650 | 1,650 | 1,650 | 2,000 | 350 | 21.2% |
| All Other | 41,430 | 34,781 | 34,280 | 34,049 | 34,281 | (7,149) | (17.3%) |
| Subtotal-OTPS | $49,644 | $42,816 | $42,315 | $42,084 | $42,816 | ($6,828) | (13.8%) |
| Debt Service | |||||||
| Principal | $4,003 | $4,161 | $4,178 | $4,193 | $4,384 | $381 | 9.5% |
| Interest & Offsets | 3,651 | 3,740 | 4,178 | 4,912 | 5,383 | 1,731 | 47.4% |
| Subtotal Debt Service | $7,654 | $7,901 | $8,356 | $9,105 | $9,767 | $2,112 | 27.6% |
| FY 2022 BSA and Discretionary Transfers | ($6,114) | $0 | $0 | $0 |
$0 |
$6,114 | (100.0%) |
| FY 2023 BSA | $2,166 | ($2,166) | $0 | $0 | $0 | ($2,166) | (100.0%) |
| Capital Stabilization Reserve | $250 | $250 | $250 | $250 | $250 | $0 | 0.0% |
| General Reserve | $1,555 | $1,200 | $1,200 | $1,200 | $1,200 | ($355) | (22.8%) |
| Less: Intra-City Expenses | ($2,213) | ($1,902) | ($1,900) | ($1,896) | ($1,896) | $317 | (14.3%) |
| Total Expenditures | $106,388 | $102,655 | $106,320 | $108,438 | $110,985 | $4,596 | 4.3% |
| Gap to be Closed | $0 | $0 | ($3,166) | ($5,011) | ($6,469) | ($6,469) | NA |
NOTE: Numbers may not add to totals due to rounding.
Table 2. Plan-to-Plan Changes
January 2023 Plan vs. November 2022 Plan
| ($ in millions) | FY 2023 | FY 2024 | FY 2025 | FY 2026 |
| Revenues | ||||
| Taxes: | ||||
| General Property Tax | $0 | $0 | $0 | $0 |
| Other Taxes | 1,253 | 501 | 545 | 521 |
| Tax Audit Revenues | 0 | 0 | 0 | 0 |
| Subtotal: Taxes | $1,253 | $501 | $545 | $521 |
| Miscellaneous Revenues | 503 | 220 | 82 | (3) |
| Unrestricted Intergovernmental Aid | 0 | 0 | 0 | 0 |
| Less: Intra-City Revenues | (70) | 17 | 20 | 22 |
| Disallowances Against Categorical Grants | 0 | 0 | 0 | 0 |
| Subtotal: City-Funds | $1,686 | $738 | $647 | $540 |
| Other Categorical Grants | 18 | 1 | 1 | 0 |
| Inter-Fund Revenues | (15) | (38) | (37) | (37) |
| Federal Categorical Grants | 613 | 466 | 420 | (7) |
| State Categorical Grants | 83 | (6) | (7) | (6) |
| Total Revenues | $2,385 | $1,161 | $1,024 | $490 |
| Expenditures | ||||
| Personal Service | ||||
| Salaries and Wages | $74 | ($144) | ($225) | ($227) |
| Pensions | 0 | 0 | 0 | 0 |
| Fringe Benefits | (79) | (115) | (120) | (123) |
| Subtotal-PS | ($5) | ($259) | ($345) | ($350) |
| Other Than Personal Service | ||||
| Medical Assistance | $0 | $0 | $0 | $0 |
| Public Assistance | 0 | 0 | 0 | 0 |
| All Other | 1,000 | 28 | 14 | 12 |
| Subtotal-OTPS | $1,000 | $28 | $14 | $12 |
| Debt Service | ||||
| Principal | $0 | $0 | $0 | $0 |
| Interest & Offsets | (1) | (54) | (79) | (98) |
| Subtotal Debt Service | ($1) | ($54) | ($79) | ($98) |
| FY 2022 BSA and Discretionary Transfers | 0 | 0 | 0 | 0 |
| FY 2023 BSA | 1,461 | (1,461) | 0 | 0 |
| Capital Stabilization Reserve | 0 | 0 | 0 | 0 |
| General Reserve | 0 | 0 | 0 | 0 |
| Deposit to Rainy Day Fund | 0 | 0 | 0 | 0 |
| Less: Intra-City Expenses | (70) | 17 | 20 | 22 |
| Total Expenditures | $2,385 | ($1,729) | ($390) | ($414) |
| Gap to be Closed | $0 | $2,890 | $1,414 | $904 |
NOTE: Numbers may not add to totals due to rounding.
Table 3. Plan-to-Plan Changes
January 2023 Plan vs. June 2022 Plan
| ($ in millions) | FY 2023 | FY 2024 | FY 2025 | FY 2026 |
| Revenues | ||||
| Taxes: | ||||
| General Property Tax | $0 | $0 | $0 | $0 |
| Other Taxes | 1,253 | 501 | 545 | 521 |
| Tax Audit Revenues | 0 | 0 | 0 | 0 |
| Subtotal: Taxes | $1,253 | $501 | $545 | $521 |
| Miscellaneous Revenues | 672 | 261 | 119 | 29 |
| Unrestricted Intergovernmental Aid | 0 | 0 | 0 | 0 |
| Less: Intra-City Revenues | (239) | 37 | 29 | 33 |
| Disallowances Against Categorical Grants | 0 | 0 | 0 | 0 |
| Subtotal: City-Funds | $1,686 | $799 | $693 | $583 |
| Other Categorical Grants | 143 | 44 | 42 | 43 |
| Inter-Fund Revenues | (10) | (34) | (32) | (32) |
| Federal Categorical Grants | 3,140 | 809 | 193 | 43 |
| State Categorical Grants | 305 | 35 | 29 | 29 |
| Total Revenues | $5,264 | $1,653 | $925 | $666 |
| Expenditures | ||||
| Personal Service | ||||
| Salaries and Wages | ($171) | ($481) | ($516) | ($425) |
| Pensions | 0 | 861 | 1,969 | 3,018 |
| Fringe Benefits | (105) | (255) | (341) | (318) |
| Subtotal-PS | ($276) | $125 | $1,112 | $2,275 |
| Other Than Personal Service | ||||
| Medical Assistance | $0 | $0 | $0 | $0 |
| Public Assistance | 0 | 0 | 0 | 0 |
| All Other | 3,712 | (368) | (523) | (342) |
| Subtotal-OTPS | $3,712 | ($368) | ($523) | ($342) |
| Debt Service | ||||
| Principal | $9 | ($60) | $87 | $38 |
| Interest & Offsets | (108) | (125) | (328) | (307) |
| Subtotal Debt Service | ($99) | ($185) | ($241) | ($269) |
| FY 2022 BSA and Discretionary Transfers | 0 | 0 | 0 | 0 |
| FY 2023 BSA | 2,166 | (2,166) | 0 | 0 |
| Capital Stabilization Reserve | 0 | 0 | 0 | 0 |
| General Reserve | 0 | 0 | 0 | 0 |
| Deposit to Rainy Day Fund | 0 | 0 | 0 | 0 |
| Less: Intra-City Expenses | (239) | 37 | 29 | 33 |
| Total Expenditures | $5,264 | ($2,557) | $377 | $1,697 |
| Gap to be Closed | $0 | $4,210 | $548 | ($1,031) |
NOTE: Numbers may not add to totals due to rounding.
Table 4. Risks and Offsets to the January 2023 Financial Plan
$ in millions, positive numbers decrease the gap and negative numbers increase the gap
| FY 2023 | FY 2024 | FY 2025 | FY 2026 | FY 2027 | |
| City Stated Gap | $0 | $0 | ($3,166) | ($5,011) | ($6,469) |
| Tax Revenues | |||||
| Property Tax | $177 | $577 | $730 | $1,211 | $2,539 |
| Personal Income Tax | 193 | 632 | 509 | 654 | 973 |
| Business Taxes | 180 | 27 | (152) | (21) | (59) |
| Sales Tax | 202 | 525 | 390 | 133 | 26 |
| Real Estate Transaction Taxes | 60 | 305 | 126 | (105) | (195) |
| All Other | 47 | 14 | 54 | 88 | 94 |
| Audit | 579 | 179 | 179 | 179 | 179 |
| Subtotal Tax Revenues | $1,438 | $2,259 | $1,836 | $2,139 | $3,557 |
| Miscellaneous Revenues | ($55) | $63 | $68 | $53 | $53 |
| Total Revenues | $1,383 | $2,322 | $1,904 | $2,192 | $3,610 |
| Expenditures | |||||
| PS Accrual Savings | $714 | $357 | $0 | $0 | $0 |
| Temporary and Professional Services | 0 | (194) | 0 | 0 | 0 |
| Overtime | (651) | (563) | (440) | (440) | (440) |
| Collective Bargaining Agreements* | (2,500) | (1,800) | (3,400) | (3,900) | (4,700) |
| Education | (255) | (856) | (1,069) | (1,949) | (2,634) |
| Public Health Corps | 0 | 0 | (13) | (49) | (49) |
| FDNY Mental Health Response Program /
B-HEARD |
0 | (37) | (37) | (37) | (37) |
| Public Assistance | (125) | (125) | (125) | (125) | 0 |
| Rental Assistance | 0 | (237) | (237) | (237) | (237) |
| Contributions to MTA | (74) | (125) | (271) | (445) | (492) |
| Prevailing Wage for Shelter Security Guards | 0 | (64) | (64) | (64) | (64) |
| Foster Care Reimbursement Rate | (47) | (118) | (118) | (118) | (118) |
| Variable Rate Debt Service Savings | 60 | 50 | 50 | 50 | 50 |
| Court Appointed Counsel | (84) | (84) | (84) | (84) | (84) |
| Temporary eFMAP (Public Health Emergency) | 285 | 48 | 0 | 0 | 0 |
| Lynch Settlement | 0 | (82) | 0 | 0 | 0 |
| Total Expenditures | ($2,678) | ($3,829) | ($5,808) | ($7,399) | ($8,805) |
| Comptroller’s (Risks)/Offsets | ($1,295) | ($1,507) | ($3,904) | ($5,207) | ($5,195) |
| Restated (Gap)/Surplus† | ($1,295) | ($1,507) | ($7,070) | ($10,218) | ($11,664) |
| Asylum Seekers | |||||
| Federal Assistance-Asylum Seekers | ($800) | 0 | 0 | 0 | 0 |
| State Assistance-Asylum Seekers | 377 | 623 | 0 | 0 | 0 |
| Asylum Seekers Expenses | (400) | (2,800) | (2,800) | (2,800) | (2,800) |
| Subtotal Asylum Seekers | ($823) | ($2,177) | ($2,800) | ($2,800) | ($2,800) |
NOTE: Numbers may not add to totals due to rounding. *Collective bargaining risk represents the floor based on the DC 37 pattern. †Comptroller’s Restated (Gap)/Surplus does not include risks associated with Asylum Seekers.
II. The City’s Economic Outlook
Economic Forecast, 2023 – 2027[1]
The U.S. economy lingers at an important crossroads with the most disruptive impacts of the COVID-19 pandemic already in the rear-view mirror, but also the sunsetting of the unprecedented and largely successful government-led economic responses financed mainly by Federal deficits. High inflation has been the bee in the bonnet of an otherwise strong national recovery from the pandemic’s low points, and the Federal Reserve has recently taken firm steps to demonstrate that they are watching it closely and are willing and able to respond to what the latest price data tell them.
Many economic forecasters are still expecting a significant growth slowdown in 2023, despite upbeat recent data describing economic and job growth. So far unbothered by the Fed’s contractionary policy over the past year, labor markets remain very tight with U.S. unemployment at 3.4 percent, near a historic low point. Thus, markets and many forecasters took the surprisingly strong jobs report in January to be a bad piece of news—projecting that the swift pace of hiring will further widen the gap between labor demand and supply…which should drive up wages…which in turn likely increases prices…which motivates the Fed to push harder on their economic brakes.
Labor markets in NYC are arguably less tight than the U.S. nationally, with a higher unemployment rate of 5.9 percent in the city and, in New York statewide data, a recently dropping ratio of job openings to unemployed workers. Nonetheless, the city’s economy remains vulnerable to national economic trends in monetary policy, especially in the financial, technology and professional services sectors that form an important core of local income, spending, and tax bases. The technology and securities sectors in New York City are likely to experience both job and income loss in 2023 because of profit and market declines that have already occurred.
But while there may be a near-term slowdown, the forecast for the city and the nation beginning in 2024 looks brighter. The Comptroller’s forecast assumes that the Fed is relatively successful in guiding the economy through a “soft landing,” lowering inflation without creating a recession or significantly high unemployment. Most sectors in the NYC economy have already substantially caught up to their pre-pandemic levels of operation, and therefore it is likely that, after a one-year pause, most economic measures will resume patterns of growth typical of pre-pandemic years.
Table 5 summarizes the economic forecasts of the Office of the NYC Comptroller and the Mayor’s Office.
Table 5. Summary of Economic Forecasts
| 2023 | 2024 | 2025 | 2026 | 2027 | ||
|---|---|---|---|---|---|---|
| U.S. Economy | ||||||
| Real GDP (2012 $, % Change) | Comptroller | 1.3 | 2.1 | 2.7 | 2.7 | 2.4 |
| Mayor | 0.3 | 1.8 | 2.0 | 1.8 | 1.6 | |
| Payroll Jobs, (% Change) | Comptroller | 1.4 | 0.7 | 0.7 | 0.3 | 0.4 |
| Mayor | 0.6 | (0.3) | 0.5 | 0.4 | 0.3 | |
| Fed Funds Rate, (Percent) | Comptroller | 4.8 | 4.2 | 3.2 | 2.5 | 2.5 |
| Mayor | 4.8 | 4.3 | 3.0 | 2.6 | 2.6 | |
| 10-Year Treasury Notes, (Percent) | Comptroller | 4.2 | 4.0 | 3.8 | 4.0 | 4.0 |
| Mayor | 3.6 | 3.3 | 3.2 | 3.2 | 3.2 | |
| NYC Economy | ||||||
| Payroll Jobs (Change in Thousands) | Comptroller | 51.9 | 29.1 | 56.5 | 59.7 | 63.0 |
| Mayor | 68.0 | 95.5 | 103.3 | 90.1 | 80.3 | |
| Wage Earnings, (% Change) | Comptroller | 2.3 | 3.6 | 4.6 | 4.7 | 4.5 |
| Mayor | 0.0 | 5.0 | 5.4 | 5.0 | 4.9 | |
| CPI NY Area | Comptroller | 4.0 | 2.6 | 2.4 | 2.3 | 2.3 |
| Mayor | 3.1 | 1.9 | 1.7 | 1.6 | 1.6 | |
SOURCE: Office of the NYC Comptroller, NYC OMB
The National Economy
The U.S. economy’s real gross domestic product (GDP) grew by a 3.1 percent annual rate in the latter half of 2022, a moderately strong rebound after a decline of 1.1 percent in the first half of last year. This growth occurred amidst a continued contractionary monetary policy instituted by the Federal Reserve. The Fed Funds Rate began 2022 at 0.1 percent, had risen to 1.6 percent by the beginning of July and finished the year at 4.3 percent.
Meanwhile, once-hot inflation began to slow over the course of the year. Year-over-year inflation as measured by the Consumer Price Index (CPI) fell to 6.4 percent in January 2023, down from its peak of 9.1 percent in June 2022. Although the overall index has been trending down the last six months, the energy and the food indexes remain elevated, at year over year increases of 8.7 percent and 10.1 percent, respectively, in January 2023.
The deceleration in price growth can be attributed to several factors. The Fed can probably enjoy some of the credit for the slowdown—not because of its impact on the economy, which hasn’t cooled off, but by lowering future inflationary expectations that are always a major driver of price spirals. Another factor was the gradual adoption of resilience strategies by many businesses facing new supply-chain bottlenecks that initially had fueled shortage-related price hikes. In addition, energy prices declined from their spring and summer highs that were sparked by Russia’s war against Ukraine. Lastly, the effects of pandemic-response stimulus financed by Federal deficit spending began to wind down in 2022, removing a temporary fuel for additional consumer demand and a possible inhibitor of labor supply.
But it is the tight labor market that has inflation hawks worried right now. The unemployment rate was 3.4 percent in January 2023—its lowest rate since 1969. In December, the number of job openings per unemployed worker was 1.8, while the quits rate was at an elevated 2.7 percent. The Bureau of Labor Statistics reported 517,000 jobs added to U.S. payrolls in January. And while that month’s total may have been beefed-up by unseasonably warm temperatures across the country, payrolls have been consistently increasing at a good clip for the past several months. With labor markets unresponsive to monetary actions so far, the Fed will likely be watching to see if the imbalance between high labor demand and low labor supply can clear without significant wage inflation.
A key question is whether the Fed can thread the needle, lowering inflation to their target of 2 percent without pushing the economy into recession. This “soft landing” scenario probably requires that some visible signs of a loosening labor market occur soon. Debt markets appear to expect the recession option. Treasury yield curves are more sharply inverted than at any time since 1981, with 2-year rates currently more than 0.8 percent above 10-year rates. Such inversions usually reflect a strong expectation of a recession, when policy rates are almost always lowered to stimulate the economy into recovery. The Fed raised interest rates by 25 basis points early in February (0.25 percent) to a range of 4.5-4.75 percent. Recent statements by the Fed Chairman indicate that rates may rise higher than 5.0 percent in 2023 if wage growth and inflation figures do not show decelerating prices.
The Mayor’s Office of Management and Budget (OMB) has predicted a significant slowdown in U.S. economic growth in calendar year 2023 (a 0.3 percent increase in real GDP) but does not expect the economy to go all the way into a recession. Higher growth resumes in their forecast beginning in 2024, although they do not project growth above 2.0 percent any year during the Plan window (through 2027). While noting that monetary policy often works with a lag, they expect that inflation drops by 2024 all the way down to 2.3 percent, close to the Fed target. Their unemployment rate forecast peaks at 5.0 percent in 2024. Overall, their medium-term view expects that inflation will subside quickly without long-lasting economic hardships.
The Office of the NYC Comptroller’s forecast for the U.S. economy projects much less slowing in 2023, with forecast GDP growth of 1.3 percent. Our projected growth rates in years 2024-27 are also higher than OMB’s and closer to long-run average growth rates in non-recessionary years. But aside from differing GDP growth rates, our U.S. economic forecast is quite similar to OMB’s in that we forecast inflation to subside by 2024 without a recession or a significant spike in unemployment.
The New York City Economy
Employment
Private sector employment in New York City currently stands at 4.02 million, 97.9 percent of its pre-pandemic level. The city added more than 199,000 private sector jobs in 2022, a 5.2 percent annual growth rate and a pace of roughly 17,000 per month (see Table 6). The extent of recovery from pandemic job losses varies by industry sector. The sectors experiencing the most recent job growth in the city are health care and social assistance (adding 18,000 jobs in the fourth quarter of 2022) and food and hospitality (14,000). Together, these two categories accounted for roughly three-fourths of 4th-quarter growth in private payroll employment, and more than half of the growth seen throughout 2022 (See Chart 1).
Table 6. New York City Employment, Pre-pandemic vs Current
| (in thousands) | Seasonally Adjusted NYC Employment | December 2022 Change From |
Dec. ’22 % of | |||||
|---|---|---|---|---|---|---|---|---|
| Industry: | Feb. ’20 | Apr.’20 | Dec. ’21 | Dec. ’22. | Feb. ‘20 | Apr. ‘20 | Dec. ’21 | Feb. ’20 |
| Total Private | 4,108.4 | 3,161.4 | 3,821.7 | 4,021.0 | (87.4) | 859.5 | 199.3 | 97.9% |
| Financial Activities | 487.2 | 469.2 | 467.8 | 478.6 | (8.6) | 9.4 | 10.8 | 98.2% |
| Information | 229.2 | 204.1 | 233.2 | 242.3 | 13.2 | 38.2 | 9.2 | 105.7% |
| Professional and Business Services | 781.3 | 688.0 | 759.1 | 801.7 | 20.4 | 113.7 | 42.6 | 102.6% |
| Educational Services | 256.4 | 229.4 | 240.0 | 238.3 | (18.1) | 8.9 | (1.7) | 92.9% |
| Health Care and Social Assistance | 823.5 | 707.5 | 815.2 | 880.6 | 57.1 | 173.1 | 65.4 | 106.9% |
| Arts, Entertainment, and Recreation | 95.7 | 50.7 | 74.0 | 82.8 | (12.9) | 32.1 | 8.8 | 86.5% |
| Accommodation and Food Services | 374.4 | 105.8 | 288.4 | 327.6 | (46.9) | 221.8 | 39.2 | 87.5% |
| Other Services | 196.1 | 129.2 | 171.5 | 184.7 | (11.4) | 55.5 | 13.1 | 94.2% |
| Retail Trade | 346.1 | 230.2 | 301.8 | 302.0 | (44.1) | 71.8 | 0.2 | 87.3% |
| Wholesale Trade | 139.8 | 108.2 | 126.9 | 129.2 | (10.6) | 21.0 | 2.2 | 92.4% |
| Transportation and Warehousing | 135.0 | 98.8 | 132.8 | 135.7 | 0.7 | 36.9 | 2.9 | 100.5% |
| Construction | 162.6 | 87.7 | 139.5 | 143.6 | (19.0) | 55.9 | 4.1 | 88.3% |
| Manufacturing | 66.0 | 37.8 | 56.5 | 59.0 | (6.9) | 21.2 | 2.5 | 89.5% |
SOURCE: New York State Department of Labor, NYC Office of Management and Budget
Chart 1. 2022 Changes in NYC Employment by Industry (in thousands)
NOTE: Quarterly changes shown are measured by comparing seasonally adjusted payrolls from the last month of each quarter versus three months prior.
SOURCE: New York State Department of Labor, NYC Office of Management and Budget
The Health Care and Social Assistance sector is first among the several industries that have neared or surpassed their pre-pandemic levels, at 107 percent of the February 2020 count (see Chart 2). Office-based sectors, with relatively high average wages, did not cut payrolls as much as many other industries when the pandemic hit, and they have also grown since that time. At the same time, the food and hospitality sector, with lower-than-average wages, suffered the largest payroll contraction and even with strong 2022 growth job counts remain 13 percent below February 2020. The tourism portion of the food and hospitality industry may now have nearly fully recovered from the pandemic, and we project that the rate of job growth in the sector will slow down. However, it may take more than a few years for jobs in this entire sector to approach their pre-pandemic levels, as business travel to NYC is not expected to return as quickly or as completely as tourism.
Chart 2. NYC Employment Relative to Pre-Pandemic (February 2020) Levels
SOURCE: New York State Department of Labor, NYC Office of Management and Budget
Retail employment—which is also relatively low-paying on average—fell substantially in 2020 and has had more difficulty coming back in 2022, declining in the 4th quarter and still 13 percent below its pre-pandemic level. Employment in NYC retail trade was already shrinking in the years prior to the pandemic (at an annual rate of -1.7 percent in 2015-19) and the lockdowns, closures and enhanced unemployment benefits may have accelerated a trend already in motion. In addition, the now seemingly long-term reduction in the number of office workers in central business districts on weekdays will reduce the volume of retail trade in those areas—although some of this loss will presumably be offset by retail expansion in other areas. We project that the retail sector will not recover the remaining jobs it lost during the pandemic.
We anticipate near-term job losses in the securities industry, a very high-wage sector in New York City. Profits for NYC securities firms, driven down by a bear market and the erosion of interest rate spreads, declined by 60 percent in 2022 and we project a further decline in 2023. We forecast that the industry will shed close to 4,000 jobs in 2023, with an additional 3,000 in 2024 and 2025, for a cumulative total of 4 percent of that sector’s workforce. And we do not expect these jobs to rebound within the next five years. As Chart 3 demonstrates, in each of the two prior bear markets, Wall Street shed jobs and did not bring them back quickly. It can also be seen in this chart that the current down cycle, unlike the prior two, was not preceded by as large a buildup of hiring and therefore we do not expect employment to drop as dramatically as in the past.
Chart 3. History of Declines in NYC Securities Employment
SOURCE: New York State Department of Labor, New York City Office of Management and Budget, Office of the New York City Comptroller
The Comptroller’s forecast also anticipates a falloff in technology sector jobs in 2023. The sector has thus far added to its NYC payroll count over and above its pre-pandemic level. Eroding profits and share prices at many major technology companies have led many to announce layoffs and cost-cutting initiatives.[2] Our forecast calls for the sector to lose more than 9,000 jobs in 2023, approximately half of its post-COVID job gain over pre-COVID levels.[3]
OMB’s private sector employment forecast grows by over 2 percent annually, on average through 2027. In contrast, the Comptroller’s forecast expects that relatively little post-pandemic catch-up remains and assumes that—after a brief slowdown in 2023-24—overall NYC employment resumes growth at historically typical rates.
NYC Labor Market
There are indications that New York City does not have as taut a labor market as exists for the whole U.S. Unemployment in the city stood at 5.9 percent in December, compared to 3.5 percent nationally. Job openings and quits data are not available at the NYC level, but statewide rates should be heavily influenced by conditions in the city. The ratio of job openings per unemployed worker in New York State has recently fallen to 1.1, compared with 1.9 per unemployed person in the U.S. The statewide quits rate of 1.8 percent is also much smaller than the national average of 2.7 percent.[4]
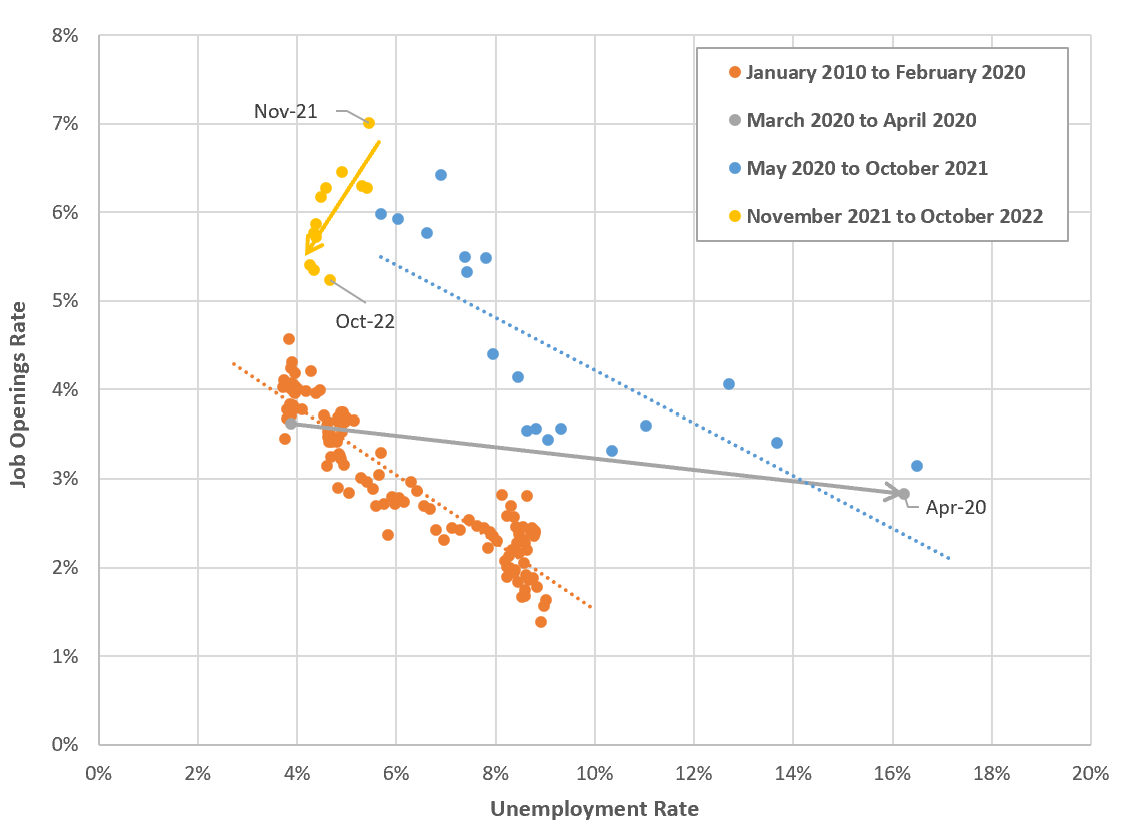
Chart 4 suggests a change in New York local labor market conditions possibly occurring in the past year. The plot shows what is known as a “Beveridge Curve” for New York State, which relates the rate of job openings to the rate of unemployment, each as a share of the labor force. While these rates are usually inversely related, the pandemic shifted this curve to the right where it has remained for most of the recovery period—indicating a higher number of job openings at every level of unemployment. This most likely reflects a sudden shock to the supply of labor—more than 300,000 people left the NYC labor force in the initial months of the pandemic and most have not returned. But in the past year, New York’s rate of job openings has been falling without unemployment rates rising—consistent with a gradual adjustment that is shifting the curve back to its longer-run level. This suggests that labor markets in NYC may no longer be so tight.
Chart 4. Beveridge Curve for New York State
SOURCE: Bureau of Labor Statistics
Inflation in the NY Area
On a 12-month basis, headline CPI in the NY area peaked at 6.7 percent in June of 2022 and was 6.0 percent in January of 2023. However, core CPI, which subtracts the more volatile food and energy components from the consumption basket, continues to increase and reached a post-pandemic high of 5.7 percent in January. This is largely because the shelter category of expenses, which represents 39.7 percent of the overall basket, jumped from a 2.1 percent increase in June 2022 to a 5.8 percent increase in January 2023 (see Chart 5).
Chart 5. NY Area CPI Inflation (12-month Percent Change)
SOURCE: Bureau of Labor Statistics
The steep increase in shelter inflation follows the well-documented large increase in market rate rents that is reflected in the CPI with a lag due to the time needed for rent contracts to reset at a higher price. Chart 6 shows year-over-year (yoy) percentage changes for the StreetEasy repeat rent index and NY shelter CPI lagged two quarters. Given the (relative) softening of market rate rent growth NY CPI shelter inflation might peak in the second quarter of 2023 and will continue to sustain core CPI inflation.
Chart 6. NY Area Shelter Inflation and Market Rent Index (Year-over-Year Percent Change)
SOURCE: Bureau of Labor Statistics, StreetEasy
Consumer Spending and Taxable Sales
As recently reported, the shift toward hybrid work schedules has disproportionately impacted spending by commuters into Manhattan’s central business districts. Manhattan resident spending also appears to be growing less than for other residents of NYC—likely a result of outmigration—according to data available from the Opportunity Insights project[5] and sourced from Affinity Solutions. Chart 7 shows the 8-week moving average of the indexes for NYC, Manhattan, and the average of Queens and Staten Island (Bronx and Brooklyn are not available). The 8-week moving average of consumer spending in NYC is 12.3 percent above pre-pandemic levels, with a large wedge between Manhattan (2.4 percent above January 2020) and the average of Queens and Staten Island (20.4 percent above January 2020).
Chart 7. Consumer Spending Indexed to January 2020
SOURCE: Opportunity Insights, Office of the NYC Comptroller
Given the differences in data sources and methodologies, the consumer spending data lines up reasonably well with data on taxable sales provided by the NYS Department of Taxation and Finance, available up to the quarter ending in November 2022.[6] Without adjusting for inflation, overall taxable sales were 14.2 percent above the level in the first quarter of 2020 and the consumer spending measure was up 12.2 percent, as shown in Chart 8 below. Consumer spending was affected relatively less than taxable sales for at least two reasons. First, consumption shifted toward non-taxable items (e.g., groceries) in the first months of the pandemic. Second the precipitous decline in tourism affected taxable sales directly but not resident spending.
Chart 8. Consumer Spending and Taxable Sales in NYC
SOURCE: NYS Department of Taxation and Finance, Opportunity Insights, Office of the NYC Comptroller
The growth of taxable sales, while still robust, is starting to moderate. Table 7 reports yearly growth rates for total sales and for its three main categories accounting for roughly two thirds of all taxable sales. Total sales grew 11.3 percent in the fourth quarter of 2022 in nominal terms, pushed by high inflation. In real terms, they have returned to 4.1 percent, within the norm of pre-pandemic quarterly growth rates. In 2022Q4 the retail category posted weak nominal growth of 2.0 percent, affected by lower sales at gasoline stations and automobile dealers, similar to national trends. Additionally, the growth rate is skewed by an unusually high amount of sales in lawn and garden equipment stores in the third quarter of 2022. Accommodation and food services expanded by 35.7 percent (28.5 percent adjusted for inflation). Utilities and information services posted another strong quarter at 10.0 percent (2.7 percent adjusted for inflation). Inflation net of shelter peaked at 9.2 percent in the third quarter (June-August) of 2022 and dropped to 7.3 percent in the fourth. As inflation continues to decline, the growth in taxable sales should continue to moderate.
Table 7. Taxable Sales Growth Rates (Year-over-Year Percent Change)
| Quarter | Total | Retail (incl. online) | Accommodation and Food Services | Utilities and Information | ||||
|---|---|---|---|---|---|---|---|---|
| Nominal | Real | Nominal | Real | Nominal | Real | Nominal | Real | |
| 2018Q4 | 6.1% | 4.1% | 3.4% | 1.4% | 3.5% | 1.5% | 3.6% | 1.7% |
| 2019Q1 | 3.8% | 2.7% | 1.7% | 0.6% | 2.3% | 1.2% | 2.5% | 1.4% |
| 2019Q2 | 4.1% | 2.9% | 4.3% | 3.2% | 4.4% | 3.2% | (2.0%) | (3.1%) |
| 2019Q3 | 6.0% | 4.6% | 2.1% | 0.7% | 3.7% | 2.3% | 8.6% | 7.3% |
| 2019Q4 | 6.0% | 4.8% | 7.7% | 6.5% | 3.3% | 2.2% | 8.8% | 7.7% |
| 2020Q1 | 7.7% | 5.3% | 11.5% | 9.2% | 4.3% | 1.9% | 6.9% | 4.6% |
| 2020Q2 | (36.1%) | (37.2%) | (31.6%) | (32.7%) | (74.0%) | (75.1%) | 4.8% | 3.8% |
| 2020Q3 | (21.7%) | (22.9%) | (3.2%) | (4.5%) | (69.0%) | (70.3%) | 1.8% | 0.5% |
| 2020Q4 | (19.8%) | (21.5%) | (4.8%) | (6.5%) | (62.3%) | (64.0%) | 1.5% | (0.2%) |
| 2021Q1 | (16.0%) | (17.7%) | (8.3%) | (10.0%) | (64.1%) | (65.9%) | 8.1% | 6.4% |
| 2021Q2 | 44.5% | 40.6% | 59.4% | 55.4% | 103.2% | 99.3% | 11.0% | 7.1% |
| 2021Q3 | 27.7% | 22.6% | 20.9% | 15.8% | 135.6% | 130.4% | 8.6% | 3.5% |
| 2021Q4 | 29.2% | 22.9% | 19.6% | 13.2% | 109.8% | 103.4% | 14.1% | 7.7% |
| 2022Q1 | 25.1% | 18.1% | 19.9% | 12.9% | 121.8% | 114.8% | 9.9% | 2.9% |
| 2022Q2 | 26.4% | 17.6% | 12.2% | 3.5% | 87.0% | 78.3% | 12.2% | 3.4% |
| 2022Q3 | 17.8% | 8.6% | 10.4% | 1.3% | 42.1% | 32.9% | 7.4% | (1.7%) |
| 2022Q4 | 11.3% | 4.1% | 2.0% | (5.3%) | 35.7% | 28.5% | 10.0% | 2.7% |
SOURCE: NYS Department of Taxation and Finance, Bureau of Labor Statistics, Office of the NYC Comptroller
NYC Real Estate Markets
Table 8. Manhattan Office Market Statistics
| Period | Vacancy Rates | Leasing (YTD, msf) |
Absorption (YTD, msf) |
Asking Rent (psf) | ||
|---|---|---|---|---|---|---|
| Direct | Sublease | Total | $2022* | |||
| Average 2010Q4 – 2019Q4 | 8.0% | 1.6% | 9.6% | 29.4 | 4.1 | $80.0 |
| 2020Q4 | 10.4% | 4.8% | 15.2% | 12.8 | (15.3) | $81.2 |
| 2021Q4 | 15.4% | 5.1% | 20.4% | 18.6 | (19.5) | $73.9 |
| 2022Q4 | 16.8% | 5.4% | 22.2% | 24.3 | (0.8) | $71.6 |
* Nominal value indexed to NY CPI-U quarterly average in 2022Q4. Average 2010Q4-2019Q4 is the average of the fourth quarters from each year.
SOURCE: Cushman & Wakefield, Bureau of Labor Statistics
The disconnect between occupancy and growth in office-using jobs continues, with the latter regaining and exceeding their previous peak in the fourth quarter of 2022. According to Kastle Systems data measuring swipes into office buildings in the NY area, attendance reached 47.8 percent of the pre-pandemic baseline in the first quarter of 2023 (data up to the week of February 9). Employers surveyed by the Partnership for NYC (PFNYC) indicated that average attendance reached 52 percent in January of 2023. Mass transit ridership also continued to increase at the start of the year, more markedly for the subway system (Table 9).
Table 9. Office-Using Jobs, Office Attendance, and Transit Indexes
| Quarter | Office-using Jobs | Kastle Systems | PFNYC Surveys | MTA Ridership (Percent of Baseline) | |||
|---|---|---|---|---|---|---|---|
| (‘000s) | Swipes as a % of Baseline | Average Weekday Attendance | Subway | LIRR | Metro North | Bridges & Tunnels | |
| 2020Q1 | 1,494 | 68.9% | N/A | 50.6% | 11.8% | 58.4% | 72.0% |
| 2020Q2 | 1,349 | 6.0% | N/A | 11.8% | 5.6% | 5.4% | 54.7% |
| 2020Q3 | 1,347 | 11.7% | 8.0% | 25.5% | 16.1% | 12.9% | 85.2% |
| 2020Q4 | 1,369 | 14.2% | 10.0% | 30.8% | 18.0% | 14.5% | 85.2% |
| 2021Q1 | 1,385 | 13.6% | 10.0% | 31.2% | 17.1% | 14.2% | 83.4% |
| 2021Q2 | 1,397 | 17.9% | 12.0% | 39.6% | 27.4% | 23.9% | 92.9% |
| 2021Q3 | 1,411 | 23.8% | 23.0% | 47.0% | 40.2% | 36.2% | 95.8% |
| 2021Q4 | 1,450 | 29.9% | 28.0% | 55.5% | 46.6% | 43.2% | 98.9% |
| 2022Q1 | 1,461 | 29.6% | N/A | 53.3% | 44.9% | 42.0% | 95.6% |
| 2022Q2 | 1,482 | 38.6% | 38.0% | 57.8% | 53.9% | 52.2% | 99.1% |
| 2022Q3 | 1,504 | 39.9% | 49.0% | 58.5% | 56.3% | 55.1% | 98.5% |
| 2022Q4 | 1,518 | 43.0% | N/A | 63.5% | 59.6% | 60.2% | 100.4% |
| 2023Q1 (to 2/9) | N/A | 47.8% | 52.0% | 66.2% | 60.7% | 61.9% | 99.2% |
NOTE: Red denotes to-date post-pandemic peak. Data matched to workdays in the Kastle data up to 2/9/2023, except PFNYC. PFNYC survey by date of publication: 8/20, 10/20, 3/21, 6/21, 8/21, 11/21, 5/22, 9/22, and 2/23. The PFNYC survey reported in 2023Q1 was conducted in January. All data are quarterly averages. Office-using jobs are the sum of FIRE, Information, and Professional and Business Services from the Current Employment Survey, seasonally adjusted by NYC OMB.
SOURCE: NYC OMB, Kastle Systems, Partnership for NYC, MTA, Office of the NYC Comptroller
Over time, PFNYC surveyed employers for both current and expected attendance, at varying horizons. As shown in Table 10, the difference between actual and expected attendance dropped dramatically in 2022 as average attendance rose toward the mid-50s. In the latest survey, PFNYC switched to asking about long-term (“new normal”) expected attendance, which was only 4 percent higher than the reported actual. The data signals that attendance may be finally stabilizing. The survey indicated that 59 percent of employees were in the office 3 or more days per week. The modal schedule was 3 days/week for 35 percent of employees. The expectations for the “new normal” pin the percentage in office for 3 or more days at 66 percent (40 percent for 3 days), with only 7 percent fully remote.
Table 10. Surveyed vs. Expected Office Attendance in NYC
| Publication Month | Average Weekly Attendance | |||
|---|---|---|---|---|
| As of Survey Period | Expectation Horizon | Expected | Difference | |
| August 2020 | 8% | July 2021 | 54% | 46% |
| October 2020 | 10% | July 2021 | 48% | 38% |
| March 2021 | 10% | September 2021 | 45% | 35% |
| June 2021 | 12% | September 2021 | 62% | 50% |
| August 2021 | 23% | January 2022 | 76% | 53% |
| November 2021 | 28% | January 2022 | 49% | 21% |
| May 2022 | 38% | September 2022 | 49% | 11% |
| September 2022 | 49% | January 2023 | 54% | 5% |
| February 2023 | 52% | “New normal” | 56% | 4% |
SOURCE: PFNYC
For any combination of hybrid schedules, the demand for space depends on peak occupancy. It is increasingly apparent that peak occupancy tends to be Tuesday through Thursday, and this is directionally confirmed by the data from Kastle Systems in Table 9. Because occupancy is not distributed uniformly through the week, any reduction in demand for office space is likely to be less than average attendance. Nonetheless, hybrid schedules imply a downward adjustment to space demanded per job. In its U.S. Real Estate Market Outlook for 2023, CBRE suggests that the reduction could be around 15 percent. In the first quarter of 2020 office space per job averaged 241 square feet. CBRE’s estimate suggests that, at current office-using jobs levels of around 1.5 million jobs (see Table 9 above), demand could be reduced by approximately 55 million square feet, other things equal.
Table 11. NY-Area Office Swipes by Day of Week
| Day of Week | Swipes as Percent of Baseline | ||
|---|---|---|---|
| 2021Q1 | 2022Q1 | 2023Q1 (to 2/9) | |
| Monday | 12.7% | 27.3% | 41.8% |
| Tuesday | 14.1% | 34.1% | 57.0% |
| Wednesday | 14.8% | 34.4% | 56.8% |
| Thursday | 14.3% | 32.2% | 53.0% |
| Friday | 11.7% | 18.8% | 25.6% |
SOURCE: Kastle Systems, Office of the NYC Comptroller
In an indication that new high-quality office space continues to be attractive, the construction pipeline for office space continues to be robust. Market reports indicate 13 million square feet (msf) under construction, including, among others, Two Manhattan West (2 msf), PENN 2 (1.6 msf), 1 Madison Avenue (1.4 msf).
The residential market remained strong in 2022 but growth in rents moderated from the blistering pace established in the first half of the year. As shown in Chart 9, median New York City asking rents held steady at $3,400 in December 2022. Rents remain up 16 percent from pre-pandemic levels and up 27 percent from the pandemic lows. Available inventory remained low and started sliding in the second half of the year. Supply averaged 28.8 thousand apartments per month in 2022, 24.8 percent less than in 2019.
Chart 9. Residential Rents and Inventory
Similar to rents, sale prices have started to moderate, with the median and mean price for condos and coops in Manhattan dropping 5.5 percent and 0.4 percent in 2022Q4 from a year ago, according to the latest Elliman report. The Case-Shiller index for condos in the NY area is also decelerating, with prices growing 5.1 percent in November 2022 over the previous 12 months. The condo index peaked in August and has declined through November. The repeat sale index produced by StreetEasy specifically for NYC also peaked in August, although this index has fluctuated less than the Case-Shiller data.
Tourism
NYC hotels capped off a strong year in December 2022 with total room demand hitting 93 percent of its December 2019 level (92 percent for the entire last quarter). For the whole year demand was 85.4 percent of 2019 levels, dragged down by the spread of COVID-19 variants at the beginning of 2022. Revenue per available room (RevPAR) was $303, 14 percent higher than December 2019 (not adjusted for inflation). With more than 11,000 rooms in the pipeline, supply growth is expected to remain robust.
Passenger volume at Port Authority’s airports increased sharply, going from 80 percent of pre-pandemic levels in December 2021 to 96 percent (or 11.4 million passengers) in December 2022. The total number of passengers in 2022 was 91 percent of 2019 levels (or 128.1 million passengers). The gain in international visitors was steeper, with December 2022 climbing to 88 percent of December 2019 levels vs. 63 percent in December 2021. The recent reopening of China to international travel could lift the outlook for tourism in 2023.
Risks to the Forecast
The U.S. economy is at a precarious moment where there is significant risk of a recession predicated by tightening monetary policy. The Fed has made its intentions clear that it will raise rates and even risk a downturn if inflation is not kept in check. Even though the “soft landing” scenario remains intact so far, a few months of wage and price growth could alter the near-term economic outlook significantly. Due to the strength of recent data on payroll jobs, consumer spending, and core services inflation, a “no landing” scenario has started to emerge, where the Fed needs to raise rates more to tighten financial conditions and slow down demand. Negotiations regarding the U.S. debt ceiling could also generate market volatility. The Congressional Budget Office estimates that the government’s ability to issue additional debt could be exhausted between July and September.
At the city level, an additional risk derives from the possibility of deeper job losses in the securities and tech sectors, and in overall office-using employment. Higher interest rates (especially long-term rates) and stagnating or declining leasing activity could be a source of real financial stress for commercial real estate. Widespread monetary tightening and supply shocks could also slow the global economy beyond projections, slowing down the recovery of international travel and tourism spending.
III. The FY 2024 Preliminary Budget
The FY 2024 Preliminary Budget totals $102.66 billion, $3.73 billion less than the modified FY 2023 budget. Excluding reserves and adjustments, the January 2023 Financial Plan reflects $108.53 billion in FY 2023 spending, decreasing to $103.37 billion in FY 2024.
The drop in spending between FY 2023 and FY 2024 primarily reflects the continued ramp down of COVID grant-related spending of $1.6 billion, as well as the $1 billion in projected expenditures for the asylum seekers included in FY 2023 only. The remaining decreases are seen in general contractual services.
Changes to the FY 2023 Modified Budget and the FY 2024 Preliminary Budget since the November Plan are depicted in Table 12.
Table 12. Changes to FY 2023 and FY 2024 City-Funds Estimates from the November 2022 Plan
| ($ in millions) | FY 2023 | FY 2024 |
| Gap to be Closed – November 2022 Plan | $0 | ($2,890) |
| Revenues | ||
| Property Tax Revenues | $0 | $0 |
| Non-Property Tax Revenues | 1,253 | 501 |
| Non-Tax Revenues | 368 | 235 |
| Revenues From PEGs | 66 | 2 |
| Total Revenue Changes | $1,687 | $738 |
| Expenditures | ||
| Agency Expenditures | $445 | $39 |
| Savings from PEGs | (144) | (285) |
| Federal Funding Swap | (75) | (390) |
| Debt Service | (1) | (54) |
| Total Expenditure Changes | $225 | ($690) |
| Gap To Be Closed Before Prepayments | $1,462 | ($1,462) |
| FY 2023 Prepayment of FY 2024 Debt Service | ($1,462) | $1,462 |
| Gap to be Closed – January 2023 Plan | $0 | $0 |
The January 2023 Financial Plan held Property Taxes and Personal Income taxes steady, but increased other taxes, including business, sales and hotel occupancy taxes, by $1.25 billion, and miscellaneous revenues by $503 million.
Expense changes were fairly limited in this Plan–the largest addition was to the Fire Department to right size personnel expenditures in FY 23 only for $140 million. $70 million was added to the Department of Small Business Services for the Early Childhood Education Stabilization Fund. $35 million was added to the Mayor’s Office of Criminal Justice for transitional housing initiatives.
As discussed directly below, the Program to Eliminate the Gap (PEG) primarily resulted from vacancy reductions across City agencies.
The resulting budget surplus forms the basis for the pre-payment of FY 2024 Debt Service, enabling both years’ budgets to balance, as required.
Program to Eliminate the Gap (PEG)
The January 2023 Financial Plan PEG totals $1.73 billion over the five years of the Financial Plan period: $210.5 million of savings in FY 2023, $340.6 million in FY 2024, $373.1 million in FY 2025, $396.0 million in FY 2026, and $413.1 million in FY 2027.
Savings were mostly concentrated in vacancy reductions as City agencies were required by the Administration to halve available vacancies (with some exceptions for public safety and essential services). The January Financial Plan proposes cutting City-funded vacancies by 3,660, resulting in a savings of $1.32 billion across the Plan in salary and fringe costs. The largest number of positions cut are in the Department of Social Services (773 positions), the Department of Education (390 non-pedagogical positions), and the Department of Health and Mental Hygiene (403 positions).
Revenue-generating initiatives total $72.1 million in savings throughout the January Plan, with $65.3 million in FY 2023. Most of these initiatives were already identified in the November 2022 Financial Plan, but FY 2023 savings were not accounted for at that time. Revenue proposals tied to new (not included in November) initiatives total $18.2 million, all in FY 2023 – with the bulk of revenue ($13.8 million) coming from the Office of Technology and Innovation (OTI, formerly known as the Department of Information & Telecommunications) mobile telecommunication franchising to offset declines in cable franchise revenues.
In a reversal from the City’s typical budget cycle, the January Plan PEG was far more technical than the November 2022 Plan PEG. The table below provides a look at savings from the PEG across the two plans. For a detailed analysis on the November 2022 Plan PEG, refer to the PEG section of the Comptroller’s latest Annual State of the City’s Economy and Finances.
Table 13. November 2022 and January 2023 Plan PEGs
| Category | FY 2023 | FY 2024 | FY 2025 | FY 2026 | FY 2027 |
|---|---|---|---|---|---|
| January 2023 Financial Plan | |||||
| Debt Service | ($616,957) | ($53,812,000) | ($79,819,057) | ($98,664,469) | ($111,802,343) |
| PS Savings | ($144,597,385) | ($285,047,311) | ($291,594,235) | ($295,592,072) | ($299,626,167) |
| Revenue | ($65,328,000) | ($1,700,000) | ($1,700,000) | ($1,700,000) | ($1,700,000) |
| January 2023 Financial Plan Total | ($210,542,342) | ($340,559,311) | ($373,113,292) | ($395,956,541) | ($413,128,510) |
| November 2022 Financial Plan | |||||
| Debt Service | ($83,297,519) | ($116,163,806) | ($147,652,118) | ($158,593,298) | ($244,103,734) |
| Expense Re-Estimate | ($126,426,331) | ($337,193,520) | ($433,520,680) | ($477,893,767) | ($484,938,396) |
| Possible Program Impact | ($61,007,001) | ($373,974,503) | ($405,132,687) | ($372,021,785) | ($370,825,074) |
| PS Savings | ($366,431,053) | ($349,123,202) | ($290,620,868) | ($263,352,741) | ($254,383,677) |
| Revenue | ($278,885,567) | ($437,631,050) | ($239,631,723) | ($226,926,474) | ($217,585,625) |
| November 2022 Financial Plan Total | ($916,047,471) | ($1,614,086,081) | ($1,516,558,076) | ($1,498,788,065) | ($1,571,836,506) |
| Total PEG Impact November 2022 and January 2023 | |||||
| ($1,126,589,813) | ($1,954,645,392) | ($1,889,671,368) | ($1,894,744,606) | ($1,984,965,016) | |
SOURCE: NYC Office of Management and Budget; Office of the NYC Comptroller
Risks and Offsets
The January 2023 Financial Plan presents stated budget gaps of $3.17 billion in FY 2025, $5.01 billion in FY 2026 and $6.47 billion in FY 2027.
The Comptroller’s Office foresees some differences, including positive offsets against the Plan, but some additional risks as well.
Table 14. Risks and Offsets to the January 2023 Financial Plan
$ in millions, positive numbers decrease the gap and negative numbers increase the gap
| FY 2023 | FY 2024 | FY 2025 | FY 2026 | FY 2027 | |
| City Stated Gap | $0 | $0 | ($3,166) | ($5,011) | ($6,469) |
| Tax Revenues | |||||
| Property Tax | $177 | $577 | $730 | $1,211 | $2,539 |
| Personal Income Tax | 193 | 632 | 509 | 654 | 973 |
| Business Taxes | 180 | 27 | (152) | (21) | (59) |
| Sales Tax | 202 | 525 | 390 | 133 | 26 |
| Real Estate Transaction Taxes | 60 | 305 | 126 | (105) | (195) |
| All Other | 47 | 14 | 54 | 88 | 94 |
| Audit | 579 | 179 | 179 | 179 | 179 |
| Subtotal Tax Revenues | $1,438 | $2,259 | $1,836 | $2,139 | $3,557 |
| Miscellaneous Revenues | ($55) | $63 | $68 | $53 | $53 |
| Total Revenues | $1,383 | $2,322 | $1,904 | $2,192 | $3,610 |
| Expenditures | |||||
| PS Accrual Savings | $714 | $357 | $0 | $0 | $0 |
| Temporary and Professional Services | 0 | (194) | 0 | 0 | 0 |
| Overtime | (651) | (563) | (440) | (440) | (440) |
| Collective Bargaining Agreements* | (2,500) | (1,800) | (3,400) | (3,900) | (4,700) |
| Education | (255) | (856) | (1,069) | (1,949) | (2,634) |
| Public Health Corps | 0 | 0 | (13) | (49) | (49) |
| FDNY Mental Health Response Program /B-HEARD | 0 | (37) | (37) | (37) | (37) |
| Public Assistance | (125) | (125) | (125) | (125) | 0 |
| Rental Assistance | 0 | (237) | (237) | (237) | (237) |
| Contributions to MTA | (74) | (125) | (271) | (445) | (492) |
| Prevailing Wage for Shelter Security Guards | 0 | (64) | (64) | (64) | (64) |
| Foster Care Reimbursement Rate | (47) | (118) | (118) | (118) | (118) |
| Variable Rate Debt Service Savings | 60 | 50 | 50 | 50 | 50 |
| Court Appointed Counsel | (84) | (84) | (84) | (84) | (84) |
| Temporary eFMAP (Public Health Emergency) | 285 | 48 | 0 | 0 | 0 |
| Lynch Settlement | 0 | (82) | 0 | 0 | 0 |
| Total Expenditures | ($2,678) | ($3,829) | ($5,808) | ($7,399) | ($8,805) |
| Comptroller’s (Risks)/Offsets | ($1,295) | ($1,507) | ($3,904) | ($5,207) | ($5,195) |
| Restated (Gap)/Surplus† | ($1,295) | ($1,507) | ($7,070) | ($10,218) | ($11,664) |
| Asylum Seekers | |||||
| Federal Assistance-Asylum Seekers | ($800) | $0 | 0 | 0 | 0 |
| State Assistance-Asylum Seekers | 377 | 623 | 0 | 0 | 0 |
| Asylum Seekers Expenses | (400) | (2,800) | (2,800) | (2,800) | (2,800) |
| Subtotal Asylum Seekers | ($823) | ($2,177) | ($2,800) | ($2,800) | ($2,800) |
NOTE: Numbers may not add to totals due to rounding. *Collective bargaining risk represents the floor based on the DC 37 pattern. †Comptroller’s Restated (Gap)/Surplus does not include risks associated with Asylum Seekers.
Revenue
The Comptroller’s Office anticipates tax and miscellaneous revenues to come in higher than the City’s projections in each year of the Plan. All categories of tax revenue are forecast to come in higher than planned in the current fiscal year and FY 2024, with Audits notably higher in FY 2023 at $579 million above Plan. The Comptroller’s Office forecast for Property Revenue grows significantly higher than the City’s Plan in the outyears. All other tax revenues are higher than planned in each year, except business taxes and real estate transaction taxes which begin to fall below OMB’s forecast in FY 2025 and FY 2026, respectively.
Miscellaneous Revenues show a slight risk in FY 2023 due to the possible non-payment from the City’s vendor for bus shelter advertising. Fines are anticipated to come in higher in all years of the Plan.
In total, revenue offsets against the Plan are $1.38 billion in FY 2023, $2.32 billion in FY 2024, $1.90 billion in FY 2025, $2.19 billion in FY 2026, and $3.61 billion in FY 2027.
Expenditures
The current Financial Plan holds a labor reserve to cover annual wage increases of 1.25 percent pertaining to collective bargaining agreements. Since the January Plan was released, the City has come to a tentative agreement with DC 37, the City’s largest union, for increases of 3 percent for the first four years of the agreement (retroactive to FY 2021) and 3.25 percent in the fifth year. The agreement also includes a one-time bonus of $3,000 upon ratification of the agreement. Typically, other unions follow the established pattern, though certain unions could negotiate higher increases. If followed, the DC 37 pattern is estimated to cost $2.5 billion in FY 2023, $1.8 billion in FY 2024, $3.4 billion in FY 2025, $3.9 billion in FY 2026, and $4.7 billion in FY 2027, based on the timing of the specific contract expirations and the respective retroactive payments associated with each contract. These amounts are above what is currently held in the labor reserve.
Other personnel expenditure variances against the four-year plan include payroll savings due to the current high vacancy rate and elevated temporary staff and overtime expenses compared to the budget.
The Comptroller’s Office is including a variety of risks within the Department of Education’s budget against the January Plan. Some of these are familiar risks that the office has previously included relating to the exhaustion of federal stimulus funds (fiscal cliffs associated with Summer Rising, Special Education Pre-K Expansion, Universal 3-K, and Community Schools), and the chronic underbudgeting for Carter cases, pupil transportation, and charter school tuition. A new risk is now included for the class size mandates imposed by the State last year. The City is estimating the cost of implementing smaller class sizes will cost $1.3 billion annually once fully implemented. Furthermore, the additional risks posed by the Governor’s Executive Budget and the removal of the charter school cap, are not included in this number but could pose significant exposure. See the Department of Education section for a further discussion of these items.
Other risks include underbudgeting within the City’s ongoing support of the Metropolitan Transportation Authority (MTA). The City is currently required to pay 50 percent of the paratransit expenses, for a risk of $48 million in FY 2023 growing to $120 million in FY 2027. The City’s budgeted amounts for the operating subsidies to the MTA Bus Company and Staten Island Railway are also underestimated; an additional risk is included for these items of $26 million in FY 2023, growing to $372 million in FY 2027. Not included in the table, but also looming within the Governor’s Executive Budget is the possibility that the City will be required to contribute over $500 million further in additional paratransit costs, student MetroCards, and an enhanced Payroll Mobility Tax. See the State Executive Budget section for additional details on these items.
The Comptroller’s Office risks include several other items that are currently not funded in the Financial Plan. Funding required to cover foster care reimbursement costs associated with a State requirement to pay 100 percent of the rates set by the State Office of Children and Family Services is estimated at $47 million in the current year and annualizing at $118 million per year. In addition, a New York State Court decision increased the hourly rate to be paid to court appointed counsel, with an estimated annual cost to the City of $84 million. In addition, New York City reached a settlement in the Lynch class action case on behalf of former detainees whose releases had been delayed for hours or days after they made bail. The Comptroller’s Office is assuming that approximately 25 percent of the 72,000 potential claimants will come forward for payments of $3,500; the settlement will be paid by the City in FY 2024. The Comptroller’s Office is also watching several other class-action cases, including Dunn et al v. NYC which concerns the Department of Correction’s alleged failure to provide constitutionally appropriate incarceration conditions to detainees at Rikers Island, and the Onaida class action concerning the City’s former policy of enforcing requests made by Immigration and Customs Enforcement to the Department of Correction.
The Comptroller’s estimated expense risk, including the impact of Collective Bargaining, but not including the unexpected and unpredictable forecast around asylum seekers noted below, is $2.68 billion in FY 2023, $3.83 billion in FY 2024, $5.81 billion in FY 2025, $7.40 billion in FY 2026, and $8.81 billion in FY 2027. Combined with the revenue offsets above, the net risk, not yet incorporated into the Financial Plan, is $1.30 billion in FY 2023, $1.51 billion in FY 2024, $3.90 billion in FY 2025, $5.21 billion in FY 2026 and $5.20 billion in FY 2027.
The Comptroller’s resulting restated budget gap for the January 2023 Plan is $1.30 billion in FY 2023, $1.51 billion in FY 2024, $7.07 billion in FY 2025, $10.22 billion in FY 2026, and $11.66 billion in FY 2027.
Asylum Seekers
The Comptroller’s Office is carrying an expense risk of $400 million in FY 2023 and $2.8 billion in FY 2024, in line with OMB’s recently stated cost estimates for providing shelter and services to the asylum seekers, who continue to come to New York City and are driving the shelter census upward. Although President Biden has recently announced a more stringent policy to stem the flow of asylum seekers at the border, there is much uncertainty in how the courts will respond, and some level of new arrivals can be expected to continue, particularly given that the underlying causes in the home countries of many of these migrants remain unresolved. Also, the lack of sufficient affordable housing within the city suggests no simple alternative to the shelter system for those who arrive in New York without a place to live. The Comptroller’s Office is maintaining a below the line risk at $2.8 billion in the outyears, though acknowledging significant uncertainty in either direction. The City budgeted $1 billion in federal aid in FY 2023 when it first introduced these expenses in November. The Comptroller’s Office anticipates some level of federal reimbursement given the $800 million allocated nationally in the Omnibus appropriations bill in December, but is assuming only 25 percent of the allocation will come to New York City. Furthermore, the Governor has proposed to cover 29 percent of the shelter expenses for the asylum seekers, yet capped the amount at $1 billion over two years.
State Executive Budget
As noted above and further outlined in the State Executive Budget section, the Governor’s proposed budget includes a variety of items that would have a potential negative impact on the City. These cost shifts and unfunded mandates would cost the City $992 million in FY 2024 and grow to approximately $2.3 billion over time if the charter cap is removed and the full number of allowable charter schools are implemented. The Comptroller’s Office will incorporate items that are in the State Budget into its assessment of Risks and Offsets once the Budget is enacted.
Revenue Analysis
Tax Revenues
The January 2023 Plan revises expected local tax revenues upward by $1.3 billion in the current fiscal year (FY 2023) compared to the November 2022 Plan. This revision primarily reflects collections that have significantly exceeded OMB’s prior expectations thus far by a similar amount.
The second column to the left in Table 15 shows the FY 2023 variance of collections through December relative to the November 2022 projections. As of December, total tax revenues grew 13.2 percent from the same period in FY 2022 and were above expectations by $1.4 billion. Non-property taxes grew by 23.6 percent. Some of the strength is temporary, particularly in PIT due to the timing of collections and expected refunds related to the Pass-Through Entity Tax (PTET) and an anomalous amount of State/City offsets received at the end of October that are expected to be more fully reversed later in the fiscal year.[7] Even after correcting for these and other timing issues, non-property taxes grew 12.4 percent over the year, as noted at the bottom of the table.
The table also reports, in the fourth column, OMB’s full-year FY 2023 expected growth rate per the January Plan, which is slightly negative (-0.9 percent) despite the large positive growth in collections observed in the fiscal year to-date. Their prediction for non-property taxes in FY 2023 is down more than 6 percent from FY 2022 despite collections running over 12 percent higher than FY 2022 so far in this fiscal year (after collections timing adjustments). The last column in Table 15 shows the implicit rate of growth (year-over-year) in OMB’s January forecast for the remainder of FY 2023. Their forecast contains significant expected declines in non-property taxes, a drop of over 20 percent from the prior year (after adjusting for technical timing issues).
Table 15. Tax Revenues FY 2023 to-Date Relative to the Mayor’s November 2022 Projections
| Collected FY to-date through Dec. 2022 ($ in mil.) |
Variance versus Mayor’s November 2022 Plan ($ in mil.) |
FY 2023 to-date growth versus prior year | January Plan forecast growth versus prior year | Implied forecast growth for remainder of FY (versus prior year) | |
| Total | 44,471 | 1,352 | 13.2% | (0.9%) | (19.1%) |
| Property tax | 24,920 | 62 | 6.3% | 6.2% | 6.1% |
| Non-Property Taxes | 19,551 | 1,229 | 23.6% | (6.1%) | (27.9%) |
| PIT | 6,850 | 382 | 17.7% | (19.7%) | (39.7%) |
| Business taxes* | 4,998 | 562 | 54.0% | 13.8% | (46.1%) |
| GCT/Bank tax | 2,496 | 305 | 0.6% | (9.0%) | (16.5%) |
| UBT | 819 | 74 | 7.3% | (8.9%) | (15.8%) |
| PTET | 1,682 | 182 | N/A | N/A | N/A |
| Sales Tax | 4,682 | 166 | 16.2% | 6.9% | (1.4%) |
| Real Estate Transaction Taxes | 1,286 | 11 | (13.6%) | (32.6%) | (48.7%) |
| RPTT | 719 | (4) | (19.3%) | (34.0%) | (51.2%) |
| MRT | 567 | 14 | (5.2%) | (30.6%) | (48.7%) |
| All Other | 1,390 | 110 | 45.4% | 12.8% | (8.0%) |
| NYC DOF Audits | 347 | 61 | 24.3% | (15.1%) | (34.3%) |
| Memo: PIT with collections adjustments (PTET and offsets) | 6,541 | 73 | 12.4% | (8.5%) | (19.6%) |
| Memo: Non-property taxes with collections adjustments | 17,460 | 820 | 12.4% | (6.1%) | (19.3%) |
* Growth rate includes PTET
SOURCE: NYC Office of Management and Budget, Office of the NYC Comptroller
Based on a much-improved economic outlook for the first half of 2023, continued strong sales tax collections and unexpectedly high audit collections, the Comptroller’s Office has revised its tax forecast upward for FY 2023. Overall, tax revenues are projected to be $70.4 billion, up approximately $1.5 billion from our previous estimate.
The difference between the Comptroller’s and OMB’s tax revenues forecasts is reported in Table 16. The Comptroller’s Office expects tax revenues will be higher than OMB’s estimates by $1.4 billion in FY 2023, $2.3 billion in FY 2024, $1.8 billion in FY 2025, $2.1 billion in FY 2026, and $3.6 billion in 2027.[8]
Table 16. Tax Revenues Risks and Offsets ($ in millions)
| FY 2023 | FY 2024 | FY 2025 | FY 2026 | FY 2027 | |
| Property Tax | $177 | $577 | $730 | $1,211 | $2,539 |
| PIT/PTET | $193 | $632 | $509 | $654 | $973 |
| Business taxes | $180 | $27 | ($152) | ($21) | ($59) |
| Sales Tax | $202 | $525 | $390 | $133 | $26 |
| Real Estate-Related | $60 | $305 | $126 | ($105) | ($195) |
| Other | $47 | $14 | $54 | $88 | $94 |
| Audits | $579 | $179 | $179 | $179 | $179 |
| Total | $1,438 | $2,259 | $1,836 | $2,139 | $3,557 |
SOURCE: Office of the NYC Comptroller
Tables 17 and 18 provide both levels and growth rates from the Comptroller’s and OMB’s forecasts. A discussion of the individual taxes follows.
Table 17. Comparison of Tax Revenue Projections: Growth Rates
| FY 2023 | FY 2024 | FY 2025 | FY 2026 | FY 2027 | FYs 2024 – 2027 Average Annual Growth |
|
|---|---|---|---|---|---|---|
| Property | ||||||
| Comptroller | 6.8% | 3.1% | 0.9% | 1.5% | 4.0% | 2.4% |
| Mayor | 6.2% | 1.9% | 0.4% | 0.0% | 0.0% | 0.6% |
| PIT/PTET | ||||||
| Comptroller | (7.3%) | 0.0% | 3.2% | 3.5% | 4.4% | 2.7% |
| Mayor | (8.5%) | (2.9%) | 4.2% | 2.6% | 2.5% | 1.6% |
| Business | ||||||
| Comptroller | (6.8%) | (6.4%) | 0.0% | 3.8% | 1.2% | (0.4%) |
| Mayor | (9.0%) | (4.5%) | 2.5% | 1.9% | 1.7% | 0.4% |
| Sales | ||||||
| Comptroller | 9.2% | 4.9% | 4.8% | 4.1% | 2.6% | 4.1% |
| Mayor | 6.9% | 1.5% | 6.5% | 6.9% | 3.7% | 4.6% |
| Real Estate- Related | ||||||
| Comptroller | (4.1%) | 6.8% | (1.1%) | (2.5%) | 1.2% | 1.0% |
| Mayor | (6.0%) | (1.1%) | 4.7% | 4.7% | 3.9% | 3.0% |
| All Other | ||||||
| Comptroller | 23.9% | (3.2%) | 5.2% | 3.3% | 1.5% | 1.7% |
| Mayor | 20.9% | (1.6%) | 3.1% | 1.7% | 1.3% | 1.1% |
| Audits | ||||||
| Comptroller | 53.1% | (30.8%) | 0.0% | 0.0% | 0.0% | (8.8%) |
| Mayor | (15.1%) | 0.0% | 0.0% | 0.0% | 0.0% | 0.0% |
| Total Tax | ||||||
| Comptroller | 1.2% | 1.0% | 1.8% | 2.4% | 3.4% | 2.1% |
| Mayor | (0.9%) | (0.2%) | 2.5% | 2.0% | 1.5% | 1.5% |
SOURCE: Office of the NYC Comptroller, NYC Office of Management and Budget
Table 18. Comparison of Tax Revenue Projections: Levels
($ in millions)
| FY 2023 | FY 2024 | FY 2025 | FY 2026 | FY 2027 | ||
|---|---|---|---|---|---|---|
| Property Tax | Comptroller | 31,598 | 32,590 | 32,876 | 33,367 | 34,695 |
| Mayor | 31,421 | 32,013 | 32,146 | 32,156 | 32,156 | |
| PIT/PTET | Comptroller | 15,477 | 15,476 | 15,971 | 16,523 | 17,242 |
| Mayor | 15,284 | 14,844 | 15,462 | 15,869 | 16,269 | |
| Business Taxes | Comptroller | 7,670 | 7,181 | 7,180 | 7,453 | 7,543 |
| Mayor | 7,490 | 7,154 | 7,332 | 7,474 | 7,602 | |
| Sales Taxes | Comptroller | 9,333 | 9,791 | 10,258 | 10,682 | 10,961 |
| Mayor | 9,131 | 9,266 | 9,868 | 10,549 | 10,935 | |
| Real Estate-Related | Comptroller | 3,105 | 3,315 | 3,277 | 3,194 | 3,232 |
| Mayor | 3,045 | 3,010 | 3,151 | 3,299 | 3,427 | |
| Other | Comptroller | 1,956 | 1,894 | 1,991 | 2,058 | 2,089 |
| Mayor | 1,909 | 1,879 | 1,937 | 1,970 | 1,995 | |
| Audits
|
Comptroller | 1,300 | 900 | 900 | 900 | 900 |
| Mayor | 721 | 721 | 721 | 721 | 721 | |
| Total | Comptroller | 70,440 | 71,147 | 72,453 | 74,177 | 76,662 |
| Mayor | 69,002 | 68,888 | 70,618 | 72,038 | 73,105 |
Property Tax
The Comptroller’s forecast of real property tax (RPT) revenue for FY 2023 is $31.6 billion, an increase of 6.9 percent from FY 2022. As of December 2022, the total RPT collections is $24.9 billion. The Department of Finance (DOF) released the tentative 2024 assessment roll in January 2023 and based on these tentative property values, the Comptroller forecasts that the RPT revenue in FY 2024 would be $32.4 billion, an increase of 3.2 percent over the FY 2023 revenue forecast. The growth in the revenue for FY 2024 is primarily due to an increase in values of Class 1 and Class 4 properties. The market values of Class 1 properties are estimated using sales of mostly one, two, and three-family homes. The median sales price for a one-family home sold outside Manhattan (these properties make up most of Class 1 properties) increased by 10.2 percent from 2020 to 2021 and 7.0 percent from 2021 to 2022. The Comptroller forecasts revenue growth for FY 2025 to FY 2027 would average 2.1 percent with revenue forecasted to be $34.6 billion in 2027.
In the tentative roll released by DOF, the total market value for all properties citywide increased by 6.1 percent from FY 2023 to $1.5 trillion. Class 1 and Class 4 properties saw the biggest increase in their market values at 8.3 percent and 7.4 percent, respectively. Even with this increase, the total market value of Class 4 properties remains below its pre-pandemic level in FY 2021. Class 2 properties had the smallest increase in market value at 0.9 percent. This was mainly due to the reduction in the market values of Manhattan rental and cooperative properties. The total taxable assessed value for all properties increased by 4.4 percent to $286.8 billion, with the biggest increase for Class 1 and Class 4 properties at 6.0 percent and 5.2 percent, respectively.
Property owners are given a period to request a review or to appeal their tentative assessments before the final roll is published in May. The Comptroller estimates that on the final roll, the total taxable assessed value will be $284.6 billion.
The Comptroller’s property tax revenue forecast for FY 2023 is $177.0 million more than the revenue forecast by the Office of Management and Budget (OMB) for the January Plan. The difference between the revenue estimates increases from $576.8 million in FY 2024 to $2.5 billion for FY 2027. OMB has not yet incorporated the tentative FY 2024 roll in its forecast for FY 2024 to FY 2027. The difference in the revenue forecast for FY 2023 is primarily due to the differences in our forecast of refunds, net cancellations, and gross delinquency of the property tax reserve since the levy for FY2023 is set. The comptroller is forecasting a refund of $335.2 million vs. OMB forecast of $500 million, a net cancellation of $690.8 million vs OMB forecast of $703.4 million, and a gross delinquency of $559.7 million vs. OMB’s forecast of $600 million. Additionally, the FY 2023 proceeds from the sale of delinquent liens were moved to FY 2024, under the assumption that the authority to conduct a sale will be renewed at some point in the future. Finally, the FY 2023 forecast incorporates the lower estimated cost of the property tax rebate enacted in 2022 ($60 million vs. budgeted $90 million).
Personal Income Tax
Both OMB and the Comptroller expect NYC Personal Income Tax (PIT) to end FY 2023 lower than the prior year. PIT collections to-date have exceeded the prior year on the strength of withholding during the months before the high bonus season. But shrinking bonuses this winter plus the impact of a depressed stock market on January 2023 estimated payments have resulted in declining collections that are forecast to remain lower through the rest of the fiscal year.
Income tax withholding grew strongly through the first five months of fiscal year 2023—rising by 9.9 percent in July through November versus the same months in 2021—but flattened during the start of the bonus season, rising a scant 0.4 percent year-over-year in December 2022/January 2023. There is little doubt that the switch in fortune was mostly the result of the size of the bonuses themselves, particularly in the securities industry where bonuses are closely related to financial market performance. After an especially strong year in 2021 for profits and bonuses, Wall Street profits fell 56.3 percent in 2022. Based on our analysis of withholding up through February 24th, bonus payments are tracking a 20.5 percent decline versus the previous season.
Income tax installment payments also were also affected by the swings of markets, with estimated tax payments received in December and January 48 percent below the prior year. Capital gain and loss realizations are an important cause of fluctuations in estimated tax, and 2022 was the first year since 2009 to end with a lower stock market valuation than it began. As the final payment for the tax year, the January installment can be especially influenced by asset performance, as investors may realize losses (or smaller gains) at the close of the year and some taxpayers make an adjustment to their payments to account for their actual annual income. But even before January of this year, tax installments from June and September 2022 were declining by more than 30 percent from their 2021 levels, for an overall fiscal year decline through January of 40 percent (See Table 19 below).
Table 19. PIT Collections FY through January
| ($ in millions) | FY 2023 | FY 2022 | Growth |
|---|---|---|---|
| Withholding | $6,349.6 | $5,968.3 | 6.4% |
| Installments/Extension Payments | $992.9 | $1,660.7 | (40.2%) |
| Returns | $223.6 | $135.4 | 65.1% |
| Assessments | $148.7 | $150.5 | (1.2%) |
| State/City Offsets | $1,172.0 | $384.0 | 205.2% |
| Refunds | ($284.3) | ($276.1) | 3.0% |
| Total Net of Admin Charges | $8,546.7 | $7,967.1 | 7.3% |
SOURCE: Office of the NYC Comptroller, NYC Office of Management and Budget
The January Plan projects that the economy slows down rapidly to almost no growth in calendar year 2023, impacting both the total wage and capital income tax bases driving PIT collections. The Comptroller forecast is for a much less pronounced slowdown, with moderate growth this year, which accounts for much of the difference between PIT revenue forecasts in the near term.
Business Taxes
FY 2023 business tax collections (corporation taxes and Unincorporated Business Tax, net of audits) grew 0.6 percent through January. This is a sharp deceleration from the 22.9 percent gain in the same period in FY 2022 driven by lower collections in the finance sector as seen in Table 20. This is a consequence of lower profits in the securities sector (which are estimated to have declined 60 percent in 2022). For calendar year 2022, collections from the finance sector dropped 3.5 percent (12.7 percent for corporate taxes) while non-finance payments grew 14.7 percent. Correspondingly, the share of payments from the finance sector went from 41.2 percent in 2021 to 37.1 percent in 2022.
Table 20. Business Taxes Gross Collections (Year-over-Year Growth)
| Calendar Quarter | Finance | Non-Finance | Total |
|---|---|---|---|
| 2021Q1 | 36.8% | 1.0% | 11.1% |
| 2021Q2 | 81.3% | 42.4% | 58.7% |
| 2021Q3 | 29.2% | (2.0%) | 10.0% |
| 2021Q4 | 27.6% | 16.1% | 20.0% |
| 2022Q1 | 19.2% | 15.7% | 16.9% |
| 2022Q2 | (12.2%) | 19.3% | 4.2% |
| 2022Q3 | (19.5%) | 20.8% | 2.5% |
| 2022Q4 | 6.2% | 2.7% | 4.0% |
SOURCE: NYC DOF, Office of the NYC Comptroller
In FY 2023, the forecast calls for revenues to drop to $7.7 billion from $8.2 billion in FY 2022 (a 6.8 percent decline). Another decline to $7.2 billion is expected in FY 2024 as the economy slows down and Wall Street profits stabilize at $22.0 billion. Revenues are expected to stabilize in FY 2025 and resume growth afterward.
Sales Tax
Sales tax collections have risen sharply through the first seven months of FY 2023, growing by 16.0 percent over the same months of the prior year. Even the most recent collections data do not reveal a downward turn has yet occurred, with January 2023 collections 11.4 percent above January 2022.
However, like OMB, the Comptroller expects the year-over-year growth to drop significantly over the remainder of the fiscal year as the impact of slower wage growth, lower bonuses, and declining savings puts an end to the post-pandemic spending spree that we have seen over the past year. The Comptroller forecasts sales tax collections to end FY 2023 9.2 percent above the prior year. This is higher than the OMB forecast of 6.9 percent growth. The OMB forecast implies that sales tax collections in the second half of FY 2023 will be slightly below collections in the same months of the prior fiscal year. This is consistent with their forecast of a sharper turn for the economy starting this fiscal year.
The difference between Comptroller and OMB projected sales tax revenue peaks in FY 2024, when our divergent views of economic and wage growth are most pronounced. Over the subsequent fiscal years, the differences recede with more stable growth rates.
Other Taxes
Collections from real estate transactions are declining but the pace of the decline is slowing. Chart 10 shows the 3-month moving average of MRT and RPTT on a steady downward path since September, with previous data reflecting strength at the end of FY 2022. As of January 2023, the 3-month moving averages stood at 38 percent and 49 percent below the previous year for MRT and RPTT, respectively.
Chart 10. MRT and RPTT Collections (3-Month Moving Average)
SOURCE: NYC DOF, Office of the NYC Comptroller
In the forecast, we lift expectations for the current year by $141 million ($60 million above the January Plan’s assumption). The outlook for FY 2024 and beyond remains unchanged. However, because OMB lowered its forecast profile substantially, the Comptroller’s forecast is now providing offsets in FY 2024 ($305 million) and FY 2025 ($126 million) and a smaller risk in FY 2026 ($105 million).
The Comptroller’s forecast for the hotel occupancy tax assumes that demand in 2023 stabilizes just below the previous peak in 2019 and exceeds it in 2024. This is in line with NYC & Company’s estimates and OMB’s forecast profile. The Comptroller’s forecast provides offsets of $47 million in FY 2023, $14.3 million in FY 2024, and slightly larger amounts in the outyears of the Plan, peaking at $93.9 million in FY 2027.
The Office of the NYC Comptroller has long held that the financial plan underestimates the amount of City tax audits. The January Plan holds the amount at $721 million each year. Year-to-date through January the City has collected $958 million due to $481 million collected in January from the Banking Corporation Tax. Even at a reduced pace of $50 million per month for the remainder of the year (February through August), it appears likely that total tax audits can reach $1.3 billion. The City should be able to collect $900 million in tax audits in each year of the plan.
Risks to the Tax Revenues Forecast
The elevated uncertainties surrounding the U.S. and NYC economies have an impact on the tax revenue forecast. OMB’s tax forecast—which reflects the consequences of very slow growth in 2023 but not a recession—will underestimate tax revenues if the economy holds up well through this year, as is now being predicted by many forecasters.
The Comptroller’s tax revenue forecast is based on a higher economic growth rate this year but still anticipates job declines and curtailed bonuses for certain key, high-wage industries. If financial markets remain more resilient, even the Comptroller’s tax revenue estimates may fall below future collections. If the economy falls into an actual recession—certainly a possibility given current Fed policy statements—tax revenues would be expected to be significantly lower than both OMB and the Comptroller project.
Miscellaneous Revenues
In the January 2023 Financial Plan, the City raised its FY 2023 miscellaneous revenue projection by a net $433 million, to $5.77 billion, a 13.6 percent increase over the previous year. About $66 million of this revenue increase is included in the City’s January PEG Program. The bulk of the revision reflects higher projections for interest income and fine revenues. Table 21 shows the changes in the FY 2023 miscellaneous revenue projections since the November Plan.[9]
Table 21. Changes in FY 2023 Miscellaneous Revenue Estimates
January 2023 Plan vs. November 2022 Plan
| ($ in millions) | November | January | Change |
|---|---|---|---|
| Licenses, Permits & Franchises | $737 | $751 | $14 |
| Interest Income | 107 | 325 | 218 |
| Charges for Services | 1,029 | 1,004 | (25) |
| Water and Sewer Charges | 1,801 | 1,817 | 16 |
| Rental Income | 250 | 255 | 5 |
| Fines and Forfeitures | 1,076 | 1,273 | 197 |
| Other Miscellaneous | 337 | 345 | 8 |
| Total | $5,337 | $5,770 | $433 |
The projected interest income for FY 2023 increased by $218 million to $325 million. This re-estimate, the first since the April 2022 Plan, reflects higher year-to-date collections following increases in short-term interest rates and greater than anticipated cash balances.
The Plan also raised FY 2023 fine revenue projections by $197 million to $1.27 billion to reflect higher than anticipated collections, in line with the Comptroller’s forecast after the November Plan. The bulk of this change reflects increased projections for camera fines. This includes $120 million in additional revenues from speed camera fines, $20 million in bus lane camera fines, and $9 million in red light camera fines. Projected revenues from parking violation fines also increased by about $50 million.
Revenue projections for licenses, permits, and franchises increased by a net $14 million. This is mostly due to a $32 million increase in mobile telecommunication franchise revenues, which was partially offset by a $17 million decline in expected revenues from cable television franchises.
Revenues from charges for services decreased by $25 million. The re-estimate reflects decreases in projected parking meter revenues ($27 million), fire inspection fees ($12.1 million), NYPD towing operations ($5.7 million), commissary funds ($3.5 million) and other fees. These were partially offset by increases in projected fee revenues from the Affordable NY Housing Program ($19 million), credit card convenience fees ($6.3 million), and 2 percent fire insurance fees ($5.4 million). Estimated rental income increased by $5 million, mostly to account for additional commercial rent revenue from arbitration of City commercial property.
The category “other miscellaneous” increased by a net $8 million including $4.4 million in additional auto auction revenue, $2.4 million in employee health contributions and $2.3 million in recycled bulk and paper sales revenue.
Total miscellaneous revenue projections for FYs 2024 and 2025 increased by a net $237 million and $102 million respectively. These adjustments include a $241 million increase in projected revenues from interest income in FY 2024 and a $103 million increase in FY 2025 which reflect higher short-term interest rate assumptions compared to the November Plan projections. FYs 2026 and 2027 projections remain relatively unchanged from the November Plan.
Table 22 shows the City’s January Plan projections for all categories of miscellaneous revenues. After increasing 13.6 percent in FY 2023 to $5.8 billion, total miscellaneous revenues are expected to drop slightly to $5.6 billion in FY 2024 and remain stable over the remainder of the plan period ranging from $5.4 billion to $5.5 billion annually in FYs 2025-2027.
Table 22. Miscellaneous Revenue Forecast January 2023 Plan
| ($ in millions) | FY 2023 | FY 2024 | FY 2025 | FY 2026 | FY 2027 |
|---|---|---|---|---|---|
| Licenses, Permits & Franchises | $751 | $696 | $694 | $699 | $679 |
| Interest Income | 325 | 402 | 298 | 228 | 225 |
| Charges for Services | 1,004 | 1,024 | 1,026 | 1,026 | 1,026 |
| Water and Sewer Charges | 1,817 | 1,768 | 1,755 | 1,749 | 1,749 |
| Rental Income | 255 | 254 | 254 | 254 | 254 |
| Fines and Forfeitures | 1,273 | 1,121 | 1,115 | 1,122 | 1,122 |
| Other Miscellaneous | 345 | 349 | 339 | 338 | 338 |
| Total | $5,770 | $5,614 | $5,481 | $5,416 | $5,393 |
Based on the City’s January Plan projections and collection trends, the Comptroller’s Office projects total miscellaneous revenue will be below the City’s current forecasts by $55 million in FY 2023, and above the City’s forecast by $63 million in FY 2024, $68 million in FY 2025, and $53 million in each of FYs 2026-2027.
As discussed in the Annual Report on the State of the City’s Economy and Finances published in December, the Comptroller projects that the City’s bus stop franchise agreement with JCDecaux poses a risk of $108 million to FY 2023 revenues.
Our projections for fine revenues are above the City’s current forecast by $53 million in FY 2023, $63 million in FY 2024, and $53 million in each of FYs 2025-2027. The Comptroller projects revenues from parking fines and camera violation fines will exceed current plan projections by a combined $45 million in FY 2023, $55 million in FY 2024, and $45 million annually in FYs 2025-2027. The Comptroller’s revenue projection for Environmental Control Board (ECB) fines is also above the City’s projection by $8 million in each of the FYs 2023 through 2027.
Finally, based on the Comptroller’s forecast of short-term interest rates and cash balances, interest income will be above the City’s projections by $15 million in FY 2025.
Federal and State Aid
The January Financial Plan projects total Federal and State aid of $29.73 billion (including unrestricted aid) in FY 2023, supporting nearly 28 percent of the City’s expenditure budget. Compared with the November Plan, the City has reflected an increase of $696 million in the current year comprised of $613 million in Federal aid and $83 million in State grants. Over the next two fiscal years, additional Federal funds of $466 million and $420 million are reflected in FY 2024 and FY 2025, respectively.
The increased Federal funding is primarily from the recognition of about $1.46 billion in COVID-related grants. Major changes in the January Plan include $1.08 billion in American Rescue Plan-State and Local Fiscal Recovery Funds (ARP SLFRF) grants and $300 million in ARP and Coronavirus Response and Relief Supplemental Appropriations (CRRSA) education grants resulting from the roll of unspent FY 2022 funding allocations, that were previously unaccounted for in the November Plan.
The January Plan reflects the roll of ARP SLFRF funds in increments ranging from $265 million to $425 million annually in FY 2023 – FY 2025. The recognition of ARP SLFRF funding produces funding swaps totaling $890 million, after adjusting for a $190 million allocation to Health + Hospitals in the current year. The swaps reduce City-funded spending by $75 million in FY 2023, $390 million in FY 2024, and $425 million in FY 2025. The largest funding shifts are $490 million for the Department of Sanitation and $75 million each for the Department of Social Services and Department of Parks and Recreation. The roll of ARP-CRRSA education grants has provided the DOE budget with corresponding increases of $220 million in FY 2023 and $80 million in FY 2024, further detailed in the Department of Education section later in the report.
Revisions in the January Plan have raised total Federal COVID assistance anticipated by the City to $7.56 billion in FY 2023 – FY 2027, as shown in Table 23. The largest component is $3.99 billion in combined ARP-CRRSA education funding for the DOE budget, followed by $2.02 billion in ARP SLFRF and $768.5 million in FEMA grants (including unrestricted aid) currently reflected in the January Plan. These three funding categories constitute nearly 90 percent of the Federal COVID assistance assumed in the Plan. Combined with grants recognized in FY 2020 through FY 2022, which totaled about $18.88 billion, overall COVID-19 assistance is currently expected to reach $26.45 billion.
Table 23. Projected Federal COVID Assistance – January 2023 Plan
| ($ in millions) | FY 2023 | FY 2024 | FY 2025 | FY 2026 | FY 2027 | Total |
|---|---|---|---|---|---|---|
| ARP SLFRF | $610.4 | $574.1 | $834.4 | $0.0 | $0.0 | $2,018.8 |
| ARP-CRRSA Education | 1,991.3 | 1,747.9 | 245.8 | 0.0 | 0.0 | 3,985.1 |
| FEMA | 515.9 | 1.0 | 0.0 | 0.0 | 0.0 | 516.9 |
| Epidemiology and Laboratory Capacity Grants |
295.0 | 10.3 | 0.1 | 0.0 | 0.0 | 305.4 |
| All Other | 362.2 | 57.9 | 44.0 | 15.4 | 7.1 | 486.5 |
| Subtotal | $3,774.7 | $2,391.1 | $1,124.3 | $15.4 | $7.1 | $7,312.7 |
| Unrestricted Aid-FEMA | $251.6 | $0.0 | $0.0 | $0.0 | $0.0 | $251.6 |
| Subtotal | $251.6 | $0.0 | $0.0 | $0.0 | $0.0 | $251.6 |
| Grand Total | $4,026.3 | $2,391.1 | $1,124.3 | $15.4 | $7.1 | $7,564.3 |
SOURCE: NYC Office of Management and Budget
State grant changes in the January Plan (aggregate increase of $83 million) were concentrated in the social service-related agencies and the Department of Health and Mental Hygiene. These included a $42.2 million increase in FY 2023 funding for the Administration of Children’s Services tied to foster care and $35.1 million in OTPS and PS funding for the Department of Health and Mental Hygiene’s Public Health Works! Campaign. The remaining $6 million in increases reflects changes in a variety of other areas including $1.9 million for the Department of Youth and Community Development for runaway and homeless youth and a $1.5 million modification to support the Economic Development Corporation’s project to dredge Hammond’s Cove, flowing through the Department of Small Business Services.
Federal and State grants are projected to fall sequentially in the outyears to $26.41 billion in FY 2024, $25.31 billion in FY 2025 before settling at about $24.2 billion annually in FY 2026 and FY 2027. This trend essentially mirrors the decline in Federal COVID-19 grants in the outyears and the absence of any expected Federal assistance for asylum seekers beyond FY 2023. Moreover, in the January Plan, the City anticipates State aid to grow by less than $250 million or slightly more than one percent, over the next four years. School aid, the largest component of State support, would grow modestly from $12.52 billion in the current year to $12.89 billion in FY 2025 and remain flat thereafter. As a result, Federal and State support of the City’s expenditure budget would taper to 25.7 percent in FY 2024 and 23.8 percent in FY 2025, and then level off at about 22 percent in both FY 2026 and FY 2027.
State Executive Budget
On February 1st, Governor Kathy Hochul released a proposed budget for the State fiscal year that begins on April 1st. The State Department of Budget forecasts a surplus of $8.7 billion in its current fiscal year, largely due to an upward revision of $5.9 billion in tax receipts compared to the Mid-Year Update released in November. The Governor’s budget includes a number of proposals that will significantly impact the City (Table 24).
Positive budget impacts were primarily found in formula-based school aid and funding support for New York City’s asylum crisis.
Record-level school aid was driven by the first ever full funding of the State’s Foundation Aid formula. However, the City is set to receive only 21 percent of the historic $2.73 billion increase. For a full discussion of education funding, refer to the Department of Education section of this report.
The State has pledged to contribute 29 percent of shelter costs for asylum seekers but capped the amount at $1 billion over two years. After the release of the City’s Preliminary Budget, the New York City Office of Management and Budget (OMB) reported that asylum seeker costs were revised upwards by a large margin, to $1.4 billion in FY 2023 and $2.8 billion in FY 2024 – effectively reducing the State’s promised share of contributions to 23.8 percent ($1 billion of the new $4.2 billion estimate) of costs. For a comprehensive discussion of the asylum crisis, refer to the Homeless Services and Asylum Seeker Emergency section of this report.
While the Governor’s budget also includes $300 million in one-time aid for the MTA, it concurrently proposes raising New York City contributions to the transit system by over $500 million per year. These additional contributions include the City fully reimbursing net operating shortfalls for paratransit services at an additional cost of $266 million in FY 2024, $105 million a year in costs associated with taking over payments for student MetroCards, and a Payroll Mobility Tax (PMT) offset of $115 million a year to cover the costs of revenue from exempt organizations including libraries and schools. The City also estimates an additional $40 million a year in costs associated with City agency and contractor payments resulting from a proposed rise in the PMT (also referred to as the Metropolitan Commuter Transportation Mobility Tax or MCTMT) from 0.34 percent to .50 percent. Lastly, the Governor’s budget proposes allocating the City’s full 20 percent share of any potential future casino revenue directly to the MTA on top of the proposed $500 million contribution just described; other localities would retain their local shares of casino revenue.
The Governor’s Executive budget also puts forward intercepting Enhanced Federal Medical Assistance Percentage (eFMAP) funds intended for local use. The eFMAP funds are provided by the federal government based on proportionate shares paid into Medicaid and historically passed on to localities to pay for services. Under the Governor’s proposed budget, these funds would shift to the State, costing New York City $343 million and other counties $281 million per year.
The budget also proposes a mandate on health insurers to pay emergency department visits and emergency admissions up-front, requiring them to pursue recoupments for payments of any stays subsequently deemed not medically necessary. OMB estimates this “Pay and Pursue” policy, if enacted, would increase the City’s health insurance costs by $36 million in FY 2024 and $75 million in FY 2025, with costs continuing to increase in future fiscal years.[10] NYC Health + Hospitals would benefit from the policy, as would other non-public hospitals throughout the City.
The Governor also proposes indexing the State’s minimum wage of $15 to inflation, with several off-ramps that would limit the impact of the policy if approved.[11] NYC OMB initially estimated a cost impact of $15 million in FY 2024 and $180 million over the financial plan period to cover City employee and contractor wage increases resulting from this action. Recently, the Administration tentatively came to terms with DC 37, the City’s largest municipal employee union, on a new employment contract to take effect retroactively from 2021 to 2025. This agreement increases wages by 3% a year, outpacing the Governor’s proposal. The Comptroller’s Office assumes other unions will follow this pattern, and the agreed-upon increases will be passed on to contracted employees at a similar level, reducing the impact of the Governor’s proposal to $5 million in FY 2024 and $89 million over the four years of the Financial Plan. The remaining costs are primarily due to college interns and Summer Youth Employment Program participants, whose wage status is not yet clear. A more expansive bill, Raise Up NY, sponsored by Senator Jessica Ramos (S3062D/A7503C) would increase the minimum wage over three years and then index it to inflation. If passed, it would cost the City over the Financial Plan period approximately $600 million, largely to cover the cost of contracted human service workers.
Table 24. Potential Impact of Proposed FY 2024 State Budget
| ($ in millions) | FY 2023 | FY 2024 | Total Two-Year Impact |
|---|---|---|---|
| Formula-based School Aid | $61 | $407 | $468 |
| Other Positive Spending Impacts | $377 | $667 | $1,044 |
| State Support for Migrant Shelter and HERRC Costs | 377 | 623 | 1,000 |
| Fund Threat Assessment Management Teams | <1 | <1 | <1 |
| Increase Funding for Re-Entry Programs | <1 | 1 | 1 |
| Increase NYC Federal Revenue by Reducing State Share of Indigent Care Pool | 43 | 43 | |
| Increase Funding for Code Blue Program | <1 | <1 | |
| Other Negative Spending Impacts | ($125) | ($992) | ($1,117) |
| ACA eFMAP to Offset Growth Financed by State | (125) | (343) | (468) |
| Redirect Title XX Funding to Child Welfare | (8) | (8) | |
| Increase NYC Funding for MTA School MetroCards | (105) | (105) | |
| Increase NYC Share of MTA Paratransit | (266) | (266) | |
| Offset Payroll Mobility Tax (PMT) for Exempt Organizations | (115) | (115) | |
| Increased PMT taxes associated with City workforce and contract staff | (40) | (40) | |
| Increase State Share of SUNY Indigent Care Pool | (72) | (72) | |
| Increase Access to Opportunity for Public Assistance Recipients | (2) | (2) | |
| Pay and Pursue (Managed Care Program Reforms) | (36) | (36) | |
| Index the Minimum Wage to Inflation | (5) | (5) | |
| Revenue Impacts | $2 | $2 | |
| Require State S-Corporation Conformity with Federal Return | 2 | 2 | |
| Create a NYC Biotech Tax Credit | (3) | (3) | |
| NYC Parking Reform | 3 | 3 |
SOURCE: NYS Division of Budget, NYC Office of Management and Budget, and Office of the NYC Comptroller.
The Governor’s budget includes additional items that are either outside of the plan window or not fully costed out.
The Governor recommends increasing the charter school cap and reviving defunct charters. This would potentially add 85 new charter schools and revive over 20 “zombie” charters without additional State funding. The charter school reforms are estimated to cost the City up to $1.3 billion in additional funds if fully implemented, representing a 44 percent increase in costs to the City for charters based on projected FY 2023 charter school spending in the DOE budget. Unlike other localities in the State, NYC is not eligible for Transition Aid to offset the cost of charter school tuition, and is also responsible for the leasing expenses when charter schools are located in public buildings. Further discussion on charters is also located in the Department of Education section of this report.
Outside the Financial Plan window, the Waste Reduction and Recycling Infrastructure Act mandating responsibility for disposal management to producers of packaging and paper products is expected to save the City $50 million by FY 2028 and $100 million in FY 2029 and out.
The budget also includes policy proposals to encourage residential housing development, a “Cap-and-Invest” program to limit greenhouse gas emissions, a community hiring initiative for candidates from disadvantaged backgrounds, the renewal of J-51 property tax exemptions for renovations on residential buildings, the right for New York City to lower its speed limit, and expanded mental health services including specialized housing options and additional hospital beds.
Expenditures Analysis
The January Financial Plan reflects $106.39 billion in spending in FY 2023, decreasing to $102.66 billion in FY 2024, and then growing to $110.99 billion in FY 2027. Both FY 2023 and FY 2024 expenditures include prior year adjustments which artificially lower expenditures by $3.95 billion and $2.17 billion, respectively. Excluding these adjustments and reserves, the FY 2023 expenditure budget of $108.53 will drop to $103.37 billion in FY 2024 before increasing to $104.87 billion in FY 2025, $106.99 billion in FY 2026, and $109.53 billion in FY 2027.
The largest change in the expenditure budget over the financial plan is a $6.53 billion decrease in OTPS between FY 2023 and FY 2024, specifically in the Contractual Services and Other OTPS categories. This is primarily due to:
- $1 billion in spending for asylum seekers included in FY 2023 only;
- a $1.6 billion ramp down in COVID grant-related spending;
- a $1.3 billion decrease in contractual services spending across City agencies;
- a $733 million decrease in all other DOE/CUNY OTPS;
- and a $408 million decrease for Temp Services.
Personnel services grow by 10.2 percent over the life of the plan, largely driven by health insurance premium growth, as well as headcount, pension contributions, and other fringe benefits changes.
Table 25. FY 2023 – FY 2027 Expenditure Growth
Adjusted for Prepayments and Reserves
|
($ in millions) |
FY 2023 |
FY 2024 |
FY 2025 |
FY 2026 |
FY 2027 |
Growth FYs 2023-2027 |
Annual Growth |
||
|
Personal Service |
|
|
|
|
|
|
|
||
|
Salaries and Wages |
$31,107 |
$31,114 |
$31,556 |
$32,245 |
$32,942 |
5.9% |
1.4% |
||
|
Pensions |
9,301 |
9,451 |
9,671 |
9,839 |
9,687 |
4.1% |
1.0% |
||
|
Health Insurance |
7,963 |
8,822 |
9,565 |
10,175 |
10,630 |
33.5% |
7.5% |
||
|
Other Fringe Benefits |
4,476 |
4,585 |
4,720 |
4,851 |
5,004 |
11.8% |
2.8% |
||
|
Subtotal-PS |
$52,847 |
$53,971 |
$55,512 |
$57,109 |
$58,263 |
10.2% |
2.5% |
||
|
|
|
|
|
|
|
|
|
||
|
Other Than Personal Service |
|
|
|
|
|
|
|
||
|
Medicaid |
$6,564 |
$6,385 |
$6,385 |
$6,385 |
$6,535 |
(0.4%) |
(0.1%) |
||
|
Public Assistance |
1,650 |
1,650 |
1,650 |
1,650 |
2,000 |
21.2% |
4.9% |
||
|
Judgments and Claims |
1,199 |
1,165 |
877 |
823 |
840 |
(29.9%) |
(8.5%) |
||
|
Contractual Services |
23,110 |
19,327 |
19,232 |
18,956 |
18,952 |
(18.0%) |
(4.8%) |
||
|
Other OTPS |
15,507 |
12,973 |
12,859 |
12,961 |
13,178 |
(15.0%) |
(4.0%) |
||
|
$48,030 |
$41,499 |
$41,003 |
$40,775 |
$41,505 |
(13.6%) |
(3.6%) |
|||
|
Debt Service |
$7,654 |
$7,900 |
$8,356 |
$9,105 |
$9,767 |
27.6% |
6.3% |
||
|
|
|
|
|
|
|
|
|
||
|
Expenditures Excluding Prior Year Adjustments and Reserves |
$108,531 |
$103,371 |
$104,870 |
$106,989 |
$109,534 |
0.9% |
0.2% |
||
|
|
|
|
|
|
|
|
|
||
|
Prior Year Adjustment |
($3,948) |
($2,166) |
|
|
|
|
|
||
|
General Reserve |
$1,555 |
$1,200 |
$1,200 |
$1,200 |
$1,200 |
|
|||
|
Capital Stabilization Reserve |
$250 |
$250 |
$250 |
$250 |
$250 |
|
|||
|
|
|
|
|
|
|
|
|
||
|
Total Expenditures |
$106,388 |
$102,655 |
$106,320 |
$108,439 |
$110,984 |
|
|||
NOTE: Intra-city adjustments are reflected in each of their respective expense categories.
Headcount
At the end of FY 2022, the City employed 282,498 full-time employees. At the time of the Adopted Plan, the number of full-time employees for FY 2023 was forecast to be 306,302 by June 30, 2023. As of December 31, 2022, full-time headcount has remained relatively stable, declining slightly to 280,987 employees. As stated in the Comptroller’s Office report, Title Vacant, the City is facing a vacancy crisis at many agencies.
With so many vacancies going unfilled, the January Plan reflects budgetary savings of more than $200 million in FY 2023 resulting from personnel and vacancy reductions since budget adoption. More than a quarter of the positions reduced are at agencies that provide health and welfare services – the Department of Social Services (DSS) with a reduction of 938 positions, the Department of Health and Mental Hygiene (DOHMH) with 403, and the Department of Homeless Services (DHS) with 107. As shown in Table 26, several agencies saw more than 10 percent of their authorized headcounts lowered, including the Department of Correction (DOC), City University (CUNY), and the Law Department.
Table 26. Personnel Reductions (Civilian Only) FY 2023 Full-time Headcount
| Agency | FY 2023 | FY 2023 Adopted Budget Plan | PEG % Adopted Budget Plan | ||
|---|---|---|---|---|---|
| Total HC Reduction | City Funded | Other Funding | |||
| Social Services | 938 | 773 | 165 | 13,023 | 7.2% |
| Police | 504 | 504 | 0 | 15,042 | 3.4% |
| Health & Mental Hygiene | 403 | 403 | 0 | 6,050 | 6.7% |
| Education | 390 | 390 | 0 | 13,472 | 2.9% |
| Transportation | 271 | 155 | 116 | 5,708 | 4.7% |
| Parks and Recreation | 259 | 200 | 59 | 4,830 | 5.4% |
| Correction | 244 | 244 | 0 | 1,974 | 12.4% |
| City University | 200 | 200 | 0 | 1,946 | 10.3% |
| Law Department | 177 | 177 | 0 | 1,704 | 10.4% |
| Fire Department* | 166 | 166 | 0 | 6,537 | 2.5% |
| Environmental Protection | 138 | 14 | 124 | 6,413 | 2.2% |
| Design and Construction | 123 | 0 | 123 | 1,310 | 9.4% |
| Finance | 116 | 116 | 0 | 1,992 | 5.8% |
| Mayoralty | 116 | 114 | 2 | 1,395 | 8.3% |
| DCAS | 107 | 107 | 0 | 2,428 | 4.4% |
| Homeless Services | 107 | 107 | 0 | 2,012 | 5.3% |
| Technology | 101 | 101 | 0 | 1,755 | 5.8% |
| All Other | 623 | 592 | 51 | 218,711 | 0.3% |
| TOTAL | 5,003 | 4,363 | 640 | 306,302 | 1.6% |
* Includes reduction of 54 positions resulting from the re-estimate of the B-HEARD program.
Also shown in Table 26, most of the reductions to FY 2023 authorized headcount, about 87 percent, were for City-funded positions. About 10 percent of the total reflected reductions were supported through Inter-Fund Agreements (IFAs). IFAs are internal City contracts whereby there is an agreement to use funds earmarked for the capital budget to reimburse the general fund for the cost of City employees who work on specific capital projects. The remaining reduction of 165 positions was at the Department of Social Services (DSS), Medicaid Eligibility Unit. The authorized headcount for that unit was reduced from 791 at budget adoption to 626 in the January Plan.
The reductions to FY 2023 budgeted headcount were partly offset by increases of 271 positions to support new initiatives and a net increase from other adjustments (primarily, headcount revisions) of 1,047 positions. These actions altogether resulted in a net decrease of 3,685 positions since budget adoption as shown in Table 27. The actual headcount level as of December 31, 2022 highlights a gap in planned hiring for FY 2023 of 21,630. It is interesting to note that despite the number of vacancy reductions at DSS, the agency still has the authorization to hire 1,746 employees by the end of FY 2023. DSS, DOHMH, and DHS together are expected to hire more than 2,500 positions by year-end to achieve their authorized headcount levels. It is unlikely that agencies will be able to achieve their planned headcount levels by the end of the fiscal year. The Comptroller’s Office is carrying an offset against the budget for these vacancies in FY 2023 of $714 million and $357 million in FY 2024, as well as risks for the overtime and temporary services used to compensate.
Table 27. December 31, 2022 Headcount vs. Planned June 30, 2023 Headcount
| FY 2023 Adopted Budget Plan | FY 2023 12/31/2022 Actuals |
FY2023 6/30/2023 January Plan |
Planned Change FY 2023 Adopted to January Plan |
Gap in Planned Hiring |
|
| Pedagogical | |||||
| Dept. of Education | 126,892 | 116,593 | 126,895 | 3 | (10,302) |
| City University | 4,313 | 4,278 | 4,293 | (20) | (15) |
| Subtotal | 131,205 | 120,871 | 131,188 | (17) | (10,317) |
| Uniformed | |||||
| Police | 35,030 | 33,913 | 35,030 | 0 | (1,117) |
| Fire | 10,952 | 10,647 | 10,954 | 2 | (307) |
| Correction | 7,060 | 6,583 | 7,060 | 0 | (477) |
| Sanitation | 7,449 | 8,131 | 7,599 | 150 | 532 |
| Subtotal | 60,491 | 59,274 | 60,643 | 152 | (1,369) |
| Civilian | |||||
| Dept. of Education | 13,472 | 12,633 | 13,109 | (363) | (476) |
| City University | 1,946 | 1,592 | 1,746 | (200) | (154) |
| Police | 15,042 | 13,992 | 14,680 | (362) | (688) |
| Fire | 6,537 | 6,174 | 6,427 | (110) | (253) |
| Correction | 1,974 | 1,469 | 1,731 | (243) | (262) |
| Sanitation | 1,995 | 1,855 | 1,907 | (88) | (52) |
| Admin. For Children’s Services | 7,073 | 6,188 | 7,079 | 6 | (891) |
| Social Services | 13,023 | 10,401 | 12,147 | (876) | (1,746) |
| Homeless Services | 2,012 | 1,804 | 1,952 | (60) | (148) |
| Health and Mental Hygiene | 6,050 | 5,094 | 5,798 | (252) | (704) |
| Finance | 1,992 | 1,626 | 1,878 | (114) | (252) |
| Transportation | 5,708 | 4,957 | 5,681 | (27) | (724) |
| Parks and Recreation | 4,830 | 4,235 | 4,661 | (169) | (426) |
| All Other Civilians | 32,952 | 28,822 | 31,990 | (962) | (3,168) |
| Subtotal | 114,606 | 100,842 | 110,786 | (3,820) | (9,944) |
| Total | 306,302 | 280,987 | 302,617 | (3,685) | (21,630) |
The January Plan reflects a decline in headcount levels throughout the plan period from 302,617 as of June 30, 2023 to 297,221 by FYs 2026 and 2027. The overall decline in headcount is driven primarily by lower projections for Department of Education (DOE) pedagogical employees and civilian employees. As shown in Table 28, pedagogical employees’ headcount at DOE is projected to decline between FY 2023 and FY 2027 by 3,528, and civilian employees’ headcount is expected to decrease by 554 in the same period.
Table 28. Total Funded Full-Time Year-End Headcount
January 2023 Financial Plan
| FY 2023 | FY 2024 | FY 2025 | FY 2026 | FY 2027 | % Change FY 2023 – FY 2027 |
|
| Pedagogical | ||||||
| Dept. of Education | 126,895 | 126,075 | 125,186 | 123,367 | 123,367 | (2.8%) |
| City University | 4,293 | 4,289 | 4,289 | 4,289 | 4,289 | (0.1%) |
| Subtotal | 131,188 | 130,364 | 129,475 | 127,656 | 127,656 | (2.7%) |
| Uniformed | ||||||
| Police | 35,030 | 35,030 | 35,030 | 35,030 | 35,030 | 0.0% |
| Fire | 10,954 | 10,954 | 10,954 | 10,954 | 10,954 | 0.0% |
| Correction | 7,060 | 7,060 | 7,060 | 7,060 | 7,060 | 0.0% |
| Sanitation | 7,599 | 7,649 | 7,651 | 7,653 | 7,653 | 0.7% |
| Subtotal | 60,643 | 60,693 | 60,695 | 60,697 | 60,697 | 0.1% |
| Civilian | ||||||
| Dept. of Education | 13,109 | 13,109 | 13,102 | 12,555 | 12,555 | (4.2%) |
| City University | 1,746 | 1,735 | 1,735 | 1,735 | 1,735 | (0.6%) |
| Police | 14,680 | 14,502 | 14,502 | 14,502 | 14,502 | (1.2%) |
| Fire | 6,427 | 6,285 | 6,276 | 6,276 | 6,276 | (2.3%) |
| Correction | 1,731 | 1,730 | 1,730 | 1,726 | 1,726 | (0.3%) |
| Sanitation | 1,907 | 1,902 | 1,902 | 1,902 | 1,902 | (0.3%) |
| Admin. for Children’s Services | 7,079 | 7,079 | 7,079 | 7,079 | 7,079 | 0.0% |
| Social Services | 12,147 | 12,127 | 12,003 | 11,990 | 11,990 | (1.3%) |
| Homeless Services | 1,952 | 1,920 | 1,905 | 1,887 | 1,887 | (3.3%) |
| Health and Mental Hygiene | 5,798 | 5,604 | 5,514 | 5,507 | 5,507 | (5.0%) |
| Finance | 1,878 | 1,878 | 1,878 | 1,878 | 1,878 | 0.0% |
| Transportation | 5,681 | 5,768 | 5,838 | 5,841 | 5,841 | 2.8% |
| Parks and Recreation | 4,661 | 4,586 | 4,589 | 4,589 | 4,589 | (1.5%) |
| All Other Civilians | 31,990 | 31,430 | 31,414 | 31,401 | 31,401 | (1.8%) |
| Subtotal | 110,786 | 109,655 | 109,467 | 108,868 | 108,868 | (1.7%) |
| Total | 302,617 | 300,712 | 299,637 | 297,221 | 297,221 | (1.8%) |
Labor
The City maintains a labor reserve within the Financial Plan to cover anticipated expenses from collective bargaining agreements for contracts that are currently pending negotiation. The current balance in the labor reserve of $1.38 billion in FY 2023, $1.91 billion in FY 2024, $2.55 billion in FY 2025, $3.22 billion in FY 2026, and $3.88 billion in FY 2027 was held primarily to provide annual wage increases of 1.25 percent.
Since the January Plan was released, the City announced a tentative agreement with DC 37, the City’s largest union, for increases of 3 percent for the first four years of the agreement (retroactive to FY 2021) and 3.25 percent in the fifth year. The agreement includes an Equity Fund of $70 million to provide for salary adjustments for hard-to-recruit positions and to ensure that all employees represented by DC 37 will make at least $18 an hour as of July 1, 2023. Members will also receive a one-time bonus of $3,000 upon ratification of the agreement. This agreement is estimated to cost the City $4.4 billion through FY 2027. Typically, other unions and management follow the established pattern and if so, the agreements will cost the City $26 billion through FY 2027 for all employees. After offsets from funds held in the labor reserve, the remaining costs to the City are estimated to be $2.5 billion in FY 2023, $1.8 billion in FY 2024, $3.4 billion in FY 2025, $3.9 billion in FY 2026, and $4.7 billion in FY 2027, based on the timing of the specific contract expirations and the respective retroactive payments associated with each contract.
The Patrolmen’s Benevolent Association (PBA) is the only major union that has yet to reach a labor agreement with the City under the previous round of collective bargaining. Labor negotiations between the City and PBA were declared at an impasse by the New York State Public Employment Relations Board (PERB). Both parties have presented arguments before an arbitration panel and are currently awaiting a final ruling. The City has funded this contract based on the pattern established by the Uniformed Officers Coalition of 7.95 percent over three years. Through FY 2023, approximately $1.3 billion retroactive to August 2017 has been allocated both through accruals and in the labor reserve.
Overtime
The FY 2024 Preliminary Budget includes $1.23 billion for overtime expenditures, 23 percent lower than the $1.60 billion currently budgeted for FY 2023. Based on the current overtime spending trend, both FYs 2023 and 2024 overtime costs will likely exceed the Plan’s budget. As shown in Table 29, the Comptroller’s Office expects overtime expenditures to exceed Plan projections by $651 million in FY 2023 and $563 million in FY 2024.
Table 29. Projected Overtime Spending, FY 2023 and FY 2024
| ($ in millions) | FY 2023 Adopted Budget | FY 2023 January Plan | FY 2023 Comptroller’s Projection | FY 2023 Risk | FY 2024 Preliminary Budget | FY 2024 Comptroller’s Projection | FY 2024 Risk |
|---|---|---|---|---|---|---|---|
| Uniformed | |||||||
| Police | $372 | $374 | $640 | ($266) | $372 | $650 | ($278) |
| Enhanced Subway Safety | N/A | 0 | 100 | (100) | 0 | 0 | 0 |
| Fire | 252 | 418 | 418 | 0 | 244 | 275 | (31) |
| Correction | 126 | 126 | 250 | (124) | 126 | 200 | (74) |
| Sanitation | 148 | 169 | 169 | 0 | 109 | 109 | 0 |
| Total Uniformed | $898 | $1,087 | $1,577 | ($490) | $851 | $1,234 | ($383) |
| Civilian | |||||||
| Police-Civilian | 80 | $81 | $120 | ($39) | $81 | $100 | ($19) |
| Social Services | 16 | 57 | 80 | (23) | 16 | 60 | (44) |
| All Other Agencies | 306 | 376 | 475 | (99) | 283 | 400 | (117) |
| Total Civilians | $402 | $514 | $675 | ($161) | $380 | $560 | ($180) |
| Total City Risk | $1,300 | $1,601 | $2,252 | ($651) | $1,231 | $1,794 | ($563) |
| State funding for Enhanced Subway Safety through January* | N/A | N/A | N/A | 62 | |||
| Adjusted risk | N/A | N/A | N/A | ($589) | N/A | N/A | ($563) |
* “Mayor Eric Adams Makes a Subway Safety-Related Announcement with Governor Kathy Hochul”, January 27, 2023. Adjustment to risk will be made if the Enacted State Budget includes this funding.
The City has increased its overtime expenditure projections for FY 2023 by $224 million in the January 2023 Financial Plan, for a total of $300 million since the budget adoption. Seventy-one percent or $213 million of the total increase to the overtime budget went to FDNY, with $166 million budgeted for uniformed overtime spending. Of that amount, $155 million was added in the January Plan. FDNY uniformed headcount has declined from 10,952 employees as of June 30, 2022 to 10,647 by December 31, 2022. By June 30, 2023, the department is authorized to add 307 uniformed employees. If filled, these positions should reduce overtime usage in FY 2024, as it appears likely that spending for FDNY uniformed overtime in FY 2024 will be similar to the pre-pandemic average of $275 million, for a risk of $31 million.
The City routinely underbudgets police uniformed overtime costs in an effort to stem the growth in overtime expenditures. The January 2023 Financial Plan includes $374 million for that expense in FY 2023 and $372 million for FY 2024. These amounts are overly optimistic when compared to actual overtime spending of $671 million in FY 2022. Past attempts to reduce police uniformed overtime spending have not been very successful. Currently, the NYPD continues to utilize higher overtime usage to address increased criminal activity, including within the subway system. For most of FY 2022, the City was faced with rising crime within the system with major crimes increasing more than 50 percent when compared to FY 2021. This trend continued into FY 2023, with an increase of 27 percent during the first four months when compared to the same period in FY 2022. In response, the City, with the support of the State, implemented the Cops, Cameras and Care program, whereby 1,200 additional patrol shifts were added daily within the subway system at an estimated cost of $680,000 per day, beginning in late October. Three months into this program, overtime costs of $62 million have been incurred. The Governor has indicated that the State will reimburse the City for the costs spent through January. Since the program began, major crimes within the subway system have declined by 28 percent, and the City is committed to continuing this program. Each additional month at the current level of spending will increase overtime cost by approximately $20 million. Assuming that the program continues at this level through March 2023 coupled with historical patterns of overtime that are continuing, the Comptroller’s Office projects that NYPD uniformed overtime costs could pose risks to the budget of at least $366 million for FY 2023 and $278 million for FY 2024; the risk will be reduced if the Governor’s committed amount is included in the enacted State budget.
There are also risks to the DOC uniformed overtime budget of $124 million in FY 2023 and $74 million in FY 2024. DOC continues to face challenges in hiring uniformed staff, exerting upward pressure on the use of overtime.
The City’s spending for civilian overtime averaged $585 million between FY 2016 and FY 2020. That spending declined to $510 million in FY 2021 due to the scale-back on everyday operations and non-essential City employees working from home. However, as the City faced difficulties in hiring employees and relied more on overtime usage for FY 2022, that cost increased to $660 million. The Comptroller’s Office projects civilian overtime spending of at least $675 million for FY 2023 and $560 million for FY 2024.
Actual overtime costs have consistently been much higher than the Adopted Budget forecast in prior fiscal years. Between FYs 2013 and 2017, actual overtime costs averaged 43 percent higher, ranging from 24 percent higher than the FY 2013 Adopted Budget to 54 percent above the FY 2016 Adopted Budget (Chart 11). In FY 2022, actual overtime costs of $2.22 billion were almost double the Adopted Budget estimate of $1.15 billion due to lower headcount levels and the COVID-19 outbreak in the winter of 2022. Because actual headcount this year remains at consistently low levels, the Comptroller’s Office is expecting overall overtime in FY 2023 to remain consistent with the FY 2022 level, as shown in Table 29 above.
Chart 11. Overtime Expenditures FY 2013 – FY 2022
SOURCE: NYC Annual Comprehensive Financial Report of the Comptroller adjusted for unplanned events such as Hurricane Sandy and protests following the deaths of Eric Garner in 2014 and George Floyd in 2020
Temporary and Contracted Professional Services
City agencies often contract with outside vendors to staff and perform essential functions. These include temporary services and various professional services, including legal services, accounting services, architectural and engineering services, and other consultant services, and can be used to counter high vacancy rates in particular areas or titles, or to fill a temporary or highly specialized need. The January 2023 Plan forecasts $1.25 billion in spending authority in FY 2023, sharply decreasing to $809.6 million in FY 2024, and then slowly ramping down to $764.7 million in FY 2027. Historically, the City conservatively budgets these expenses in the Adopted Plan, particularly in Computer Services, Legal Services, Professional Services-Other, and Temporary Services. The City then adjusts spending throughout the fiscal year in each Plan (Table 30). Since FY 2019, agencies have consistently committed and spent upwards of $1 billion, with $1.18 billion already committed for FY 2023. It is likely that agencies will still require these services at a similar level to current spending in FY 2024, which could pose a risk of $194 million to the FY 2024 budget (Table 31). The City may reduce its reliance on these services if it hires up to its authorized headcount in the outyears.
Table 30. Historical Actual Commitments vs Plan
| ($ in millions) | FY 2019 | FY 2020 | FY 2021 | FY 2022 | FY 2023 |
|---|---|---|---|---|---|
| Actual Commitments | $1,099.7 | $1,141.6 | $1,043.8 | $1,189.3 | $1,180.8 |
| Adopted Plan | $847.4 | $841.2 | $727.9 | $890.9 | $955.9 |
| November Plan | $1,021.7 | $1,103.8 | $949.8 | $1,212.2 | $1,177.4 |
| Preliminary Plan | $1,105.8 | $1,152.2 | $1,046.9 | $1,264.8 | $1,247.7 |
| Executive Plan | $1,174.0 | $1,226.2 | $1,120.7 | $1,263.3 | N/A |
NOTE: FY 2023 Actual Commitments are as of February 26, 2023. Planned expenditures and commitments exclude COVID-related budget codes, but are otherwise All-Funds.
Table 31. Potential Risk (Temporary and Contracted Professional Services)
| ($ in millions) | FY 2024 |
|---|---|
| Plan | $809.6 |
| Commitment | $1,165.0 |
| Underbudgeting Risk – All Funds | ($355.4) |
| Underbudgeting Risk – City Funds | ($193.6) |
NOTE: FY 2024 Commitment is a projection based on the average of FY 2019 – FY 2023 historical actual commitments, including a 3 percent price increase to account for inflation.
Health Insurance
The FY 2024 Preliminary Budget includes $8.82 billion for employees’ and retirees’ pay-as-you-go health insurance in FY 2024, $859 million higher than the adjusted health insurance cost for FY 2023. The increase from FY 2023 reflects projected premium rate increases of 6 percent for active employees and pre-Medicare retirees and 4.8 percent for the senior care rate. Health insurance costs are then projected to increase to $9.57 billion in FY 2025, $10.18 billion in FY 2026 and to $10.63 billion in FY 2027, growing at an annual rate of 6.4 percent. The outyear projections assume annual increases in health insurance premium rates for active employees and pre-Medicare retirees of 5.75 percent in FY 2025, 5.5 percent in FY 2026, and 5.25 percent in FY 2027. Senior care rates are projected to increase by 4.7 percent for FY 2025 and FY 2026 and 4.6 percent in FY 2027.
Table 32. Projected Pay-As-You-Go Health Expenditures
| ($ in millions) | FY 2023 | FY 2024 | FY 2025 | FY 2026 | FY 2027 |
| Department of Education | $2,740 | $3,249 | $3,681 | $3,990 | $4,131 |
| CUNY | 139 | 138 | 150 | 150 | 163 |
| All Other | 4,292 | 5,435 | 5,733 | 6,035 | 6,336 |
| Sub-total | 7,170 | 8,822 | 9,565 | 10,175 | 10,630 |
| FY 2023 Retiree Health Prepayment | 792 | ||||
| PAYGO Health Insurance Costs | $7,962 | $8,822 | $9,565 | $10,175 | $10,630 |
Compared to the November 2022 Financial Plan, budgeted amounts for health insurance are lower by $70 million in FY 2023 and by an average of $94 million annually in the outyears. Fringe benefit costs for employees were re-estimated to reflect lower projected headcount levels resulting from the vacancy reductions.
The continued growth in health insurance premium costs poses a major challenge to the City. With the support of the Municipal Labor Committee (MLC), the City in 2021 announced a plan to implement the NYC Medicare Advantage Plus Program, replacing the current Senior Care program for retirees. If this plan is implemented, the City estimates an annual cost savings of approximately $600 million, which would be deposited into the Health Insurance Stabilization Fund.[12] Retirees challenging this plan were successful in obtaining court decisions requiring the City to honor the current laws relating to health insurance coverage in the City’s Administrative Code.[13] A proposal put forward by the Mayor and the MLC requesting the City Council to amend the City’s Administrative Code was not successful. An amendment to the Administrative Code would allow the City to establish more than one benchmark for health insurance plans, requiring retirees who opt out of the Medicare Advantage Plan to pay the premium for the senior care program. The City has appealed the court’s latest decision and is awaiting the court’s ruling.
Pensions
Pension expenditures in the January 2023 Financial Plan are expected to remain relatively stable throughout the Plan period, averaging $9.6 billion. Included in the Plan are reserved amounts of $861 million in FY 2024, $1.97 billion in FY 2025, $3.02 billion in FY 2026, and $4.07 billion in FY 2027 to fund the additional costs to the pension systems due to the FY 2022 combined investment loss of 8.65 percent.[14] These funds were included in the November 2022 Financial Plan and are being held in reserve until the valuations of the pension funds are updated to reflect the FY 2022 investment loss and other demographic changes. No changes were made in the January 2023 Financial Plan.
Pension investments realized average returns of approximately 8 percent annually between FY 2013 and FY 2022. Pension costs to the City, however, increased steadily between FY 2013 and FY 2019 from $8.05 billion to $9.83 billion after incorporating wage increases associated with labor contracts and the updating of certain underlying assumptions used in the calculations of pension expenditures (See Chart 12). Revaluing the pension systems’ assets to reflect the market value as of June 30, 2019 helped reverse that trend with pension expenditures declining to $9.33 billion in FY 2021 before rising to $9.59 billion in FY 2022.[15] For FY 2023, pension expenditures are projected to decline to $9.30 billion before trending upward in FY 2024 through FY 2027, reflecting the impact of the FY 2022 investment loss.
Chart 12. City Pension Contributions FY 2013 – FY 2027
NOTE: (1) Budgeted amounts for FYs 2023 – 2027 per January 2023 Financial Plan. (2) FY 2022 contributions to the pension systems were comprised of approximately 70 percent from City contributions, 12 percent from other employers’ contributions and 18 percent from member contributions.
SOURCE: NYC Annual Comprehensive Financial Report of the Comptroller and NYC Office of Management and Budget
Public Assistance
Through January, the City’s public assistance caseload has averaged 438,793 recipients per month in FY 2023. Over the same July-January period in the prior year, caseload averaged only 373,879. The caseload average in the current year represents a 17.4 percent increase over the same period in FY 2022. As shown in Chart 13, the caseload spike comes on the heels of the end of the Federal Pandemic Unemployment Compensation program in September 2021, which provided supplemental unemployment benefits dating back to the initial months of the COVID outbreak.[16]
According to the Human Resources Administration, between September 2021 and January 2023, there was a 74 percent increase in the average number of applicants per month compared to the final month in FY 2021. For applications received between September 2021 and August 2022, the most recent month for which complete data is available, the average monthly case acceptance rate increased to 46 percent from 35 percent in June 2021.
Chart 13. Public Assistance Caseload and Monthly Changes, March 2020-January 2023
SOURCE: NYC Department of Social Services
The City currently maintains internal caseload projections in the 440,000 range and baseline grants expenditure estimates of approximately $1.48 billion annually in FY 2023–FY 2026, before rising to $1.83 billion in FY 2027. Given the surge in both caseload and monthly grant spending over the past year, it appears likely that spending will stabilize at higher levels for the foreseeable future at a monthly rate of at least $145 million. At this rate, the City will likely need to provide additional funding of at least $125 million annually in FY 2023–FY 2026 to keep pace with its obligations for public assistance spending.
Department of Education
The January Modification reflects a net increase of $248 million in the Department of Education (DOE) budget in the current year. For FY 2023, the DOE budget now totals $31.21 billion net of intra-city funds, representing a decline of about one percent or $269 million from actual FY 2022 spending of $31.48 billion.
Compared to the November Plan, the bulk of the increase in the FY 2023 budget is attributable to a roll of $220 million in unspent FY 2022 stimulus funds. The City has utilized the Federal funds to indirectly increase its budget for special education Carter Cases spending, through a funding swap that frees up City funds previously allocated towards school custodial services. The remainder of the changes in the current year mainly consists of about $50 million in additional fuel and energy costs.
These increases are partly offset by PEG savings assigned to the DOE in the January Plan, consisting of $22 million from the reduction of vacant positions across various functions that grows to $42 million in FY 2024, with fringe benefits savings comprising more than one-third of the totals. Overall, PEG actions in the November 2022 and January 2023 Plans have reduced City support for the DOE budget by a combined $976 million – $176 million in the current year and $800 million in FY 2024. The significantly higher savings in FY 2024 is primarily attributable to a November Plan action to scale back expansion and supplant existing City funds with Federal stimulus money in the 3K for All program, culminating in a one-time City funds savings of $568 million, and a net budget decline of $284 million in FYs 2024 and 2025.[17]
The FY 2024 Preliminary Budget projects DOE spending of $30.73 billion, an increase of $37 million compared to the November Plan projections. Aside from the January Plan PEG savings, the City has incorporated the remaining $80 million from the roll of unspent FY 2022 stimulus funds in school budget allocations. Schools were provided certain register relief[18] from declining enrollments during the pandemic, which had been budgeted to ramp down from $375 million in FY 2022 to $160 million in FY 2023 and $80 million in FY 2024. This January Plan adjustment brings register relief in FY 2024 in line with the current FY 2023 projection of $160 million.[19]The January Plan does not assume any further register relief beyond FY 2024.
Under the State Executive Budget released in February, school formula aids would increase by $3.07 billion statewide in the next fiscal year. Against the January Plan State aid assumptions for DOE, the proposed formula aids increase would provide additional funding of $61 million in FY 2023 and $407 million in FY 2024. Foundation Aid, in the final year of a three-year phase-in to become fully funded for the first time, will rise by a historic $2.73 billion in the Governor’s proposal. Despite the record increase, the City would receive only 21 percent of the additional Foundation Aid. Comparatively speaking, the City’s Foundation Aid allocation would grow by 6.4 percent while the rest of the state will receive a 17.5 percent increase. As a result, the City’s share of statewide Foundation Aid would fall from 42 percent in SFY 2023 to slightly below 40 percent in SFY 2024.
The State Executive Budget also includes measures that could significantly increase the number of charter schools in the City. The Governor has proposed to lift the existing cap on the number of charter schools operating in the City and reauthorize slots that are currently taken up by defunct schools. According to the City, the two proposals could separately increase the number of charter schools by over 80 from the cap removal and more than 20 from renewed slots, potentially increasing annual DOE spending by $1 billion and up to $300 million, respectively, when fully phased-in. Similar to the class size reduction legislation enacted in 2022, the State is again seeking to impose new or expand existing mandates that seemingly target the New York City exclusively without providing new funding to help shoulder the additional costs.
In the outyears, the City projects the DOE budget to increase from $30.73 billion to $31.20 billion. Over this span, Federal stimulus funding under ARP-CRRSA education grants will continue to wind down, falling from $1.99 billion in FY 2023 to $1.75 billion in FY 2024 and then $246 million in FY 2025, before expiring in FY 2026. The reduced Federal support is offset mainly by higher level of City funds in the Plan, rising by $1.69 billion between FY 2023 and FY 2027, while State support is expected to grow by only $366 million across the same period.
A significant number of risks to the DOE budget projections remain unaddressed in the January Plan, as shown in Table 33. The City indicates that unless the State provides dedicated funding to support charter school tuition rate increases, it could lead to potential funding shortfalls of $81 million in FY 2024, $133 million in FY 2025, $313 million in FY 2026, and $514 million in FY 2027. In addition, the City has underbudgeted spending for special education Carter Cases in each year of the Plan, which has nearly tripled over the past six years. In order to maintain baseline funding similar to the FY 2022 spending level of $918 million, the City will need to increase Carter Cases funding by an additional $255 million in FY 2023, even after the January plan adjustment mentioned above, and $475 million annually in FY 2024–FY 2027. Moreover, the DOE budget has likely underfunded pupil transportation costs in the outyears that could require additional City funding of $75 million beginning in FY 2024 growing to $225 million by FY 2027.
The City could also face risks for various core instructional and support initiatives upon the expiration of Federal COVID-19 grants. Chief among these are the underfunding of 3K programmatic costs by $93 million annually in FY 2026 and FY 2027, and respective needs of $176 million and $49 million for the continuation of Summer Rising and school nursing each year beginning in FY 2024. The City would also need to provide additional funding of $111 million in FY 2025 and $235 million annually in FY 2026 and FY 2027 as ongoing support of special education pre-kindergarten expansion, mental health, and community schools programs unless these initiatives can be phased out.
In addition, the January Plan does not include funding to address the State’s mandate to further lower class size caps in FY 2024 through FY 2027. The approved legislation would begin imposing the stricter class size limits, designated for New York City only, in the next school year. Under the plan, the City will need to phase-in the reductions over a five-year period and achieve full compliance by September 2028. The City estimates that, once fully implemented, the new mandate could impose additional costs reaching $1.3 billion annually. The State has the authority to withhold certain education aid receipts from the City unless stipulated conditions are met, which includes the submission of annual progress reports and implementation of corrective actions if needed. The bill also contains a provision forewarning the City that compliance with the plan will be taken into consideration in the determination of its Foundation Aid increases. The City indicates it would seek a change in the legislation that would limit the implementation of smaller class size caps to kindergarten through third grade only, as well as additional State assistance to help cover the new costs.
Table 33. Projected Education-Related Risks to the January 2023 Financial Plan
$ in millions, Negative numbers indicate risks to the Financial Plan, and increase the gap.
| FY 2023 | FY 2024 | FY 2025 | FY 2026 | FY 2027 | |
| Charter School Tuition | $0 | ($81) | ($133) | ($313) | ($514) |
| Carter Cases | (255) | (475) | (475) | (475) | (475) |
| Pupil Transportation | 0 | (75) | (125) | (175) | (225) |
| Class Size Reduction Mandate | 0 | 0 | 0 | (433) | (867) |
| 3K Expansion | 0 | 0 | 0 | (93) | (93) |
| Special Ed Pre-K Expansion | 0 | 0 | (47) | (95) | (95) |
| DOE Mental Health Services | 0 | 0 | (37) | (86) | (86) |
| Community Schools Expansion and Sustainability | 0 | 0 | (27) | (54) | (54) |
| Summer Rising | 0 | (176) | (176) | (176) | (176) |
| DOE Contracted Nursing | 0 | (49) | (49) | (49) | (49) |
| Total Education-Related Risks | ($255) | ($856) | ($1,069) | ($1,949) | ($2,634) |
NOTE: Numbers may not add to totals due to rounding.
The implementation of the mandate poses major logistical and financial challenges to the City. The $1.3 billion cost estimate does not include additional billions in capital spending that have yet to be quantified for the creation of new classroom space, as new schools and annexes will likely be needed in districts with more acute space shortages. Moreover, the mandate will require hiring a significant number of new teachers over the next several years. The DOE anticipates it would need to hire as many as 7,000 teachers in order to comply with the law. Given the system is already experiencing teacher shortages, hiring and retaining a quality pedagogical staff could evolve into a process that requires more extensive planning and coordination as well as new job incentives. The mandate could also have other unintended negative consequences such as the effect on school choice. As enrollment capacities for special programs narrow over time under the law (unless more programs are introduced), the admission process will become even more competitive for schools that are already strained by high numbers of applicants.
Homeless Services and the Asylum Seeker Emergency
New York City has been confronted with an unprecedented surge of asylum seekers since the spring of 2022, which has had unexpected consequences for the City’s FY 2023 budget after it was adopted in June. Providing immediate shelter and services for these new arrivals has presented both operational and fiscal challenges for the City. In the longer run, these immigrants will face significant housing and income challenges due to their ineligibility for social safety net programs, lack of work opportunities due to their immigration status and current eligibility requirements, and insufficient affordable housing more generally.
Since April, over 49,000[20] asylum seekers have passed through the City’s care. Initially the City responded to this need by standing up emergency shelters within the existing DHS shelter system. In October, the Mayor issued an Emergency Authorization designating the NYC Health and Hospitals (H+H) to operationalize Humanitarian Emergency Response and Relief Centers (HERRCs). While the HERRCs were initially envisioned as short-term intake and referral centers to welcome the new arrivals, they have instead become longer-term shelter for asylum seekers with nowhere else to turn.
There are currently 86 new emergency hotels that have been opened since April managed by the Department of Homeless Services, and 6 (soon to be 7) HERRCs run by H+H.
Chart 14 provides historical context for the extraordinary demand for shelter that has emerged since the beginning of 2023 and specifically delineates the population living in HERRCs.
Chart 14. Growth in the Shelter Census, FY 2014 – FY 2023
SOURCE: Total individual shelter census on March 1st of each year as published by NYC Open Data. The 2023 HERRC population reflects the March 1 census number reported to the Comptroller’s Office by the Mayor’s Office.
The unique and potentially long-term nature of this new and persistent influx of shelter dwellers, coupled with a lack of Federal funding to assist the City in accommodating asylum seekers into its shelter system, has created tremendous fiscal uncertainty.
The Adopted Budget for FY 2023 for the Adult and Family Shelter Operation Divisions within DHS was $831 million and $1.1 billion respectively. The City added $600 million in the November Plan to the DHS budget to fund the 58 emergency shelters that DHS had opened as of that time. It also added $400 million, primarily to H+H, to operationalize the HERRCs, and to cover the projected costs for sheltering additional asylum seekers for the remainder of the year. The November Plan authorized funding for a total expense of $1 billion in FY 2023, with no funding in FY 2024 or the outyears. The $1 billion was predicated on an increase of approximately 34 households per day. Since then, the daily increase has fluctuated, at times well above that level.
No new funding was added in the January Plan, but OMB has stated that they anticipate the full cost for the asylum seekers to be approximately $1.4 billion in FY 2023 and $2.8 billion in FY 2024. The Comptroller’s Office can approximate these numbers by assuming a continued increase of approximately 65 households a day (the estimated average daily increase since August) for the remainder of FY 2023, and then holding the census flat for FY 2024.
Without knowing what will happen at the southern border (Title 42 is set to expire with the expiration of the Public Health Emergency in May, if not earlier), it is impossible to know if this is a reasonable assumption. When Title 42 expires, the influx could return to the mid-December level, and assuming no other interventions to reduce the flow of migrants at the border, these costs could easily grow well beyond the $2.8 billion estimate for next fiscal year.
Chart 15. Total Individuals in DHS Shelter and HERRC Facilities since April 2022
SOURCE: NYC Open Data, NYC Mayor’s Office, Office of the NYC Comptroller
The per diem cost of emergency shelter will also likely remain at an elevated level throughout FY 2024 as the City continues to use emergency procurement, temporary staffing, and shorter-term contracts to operationalize the emergency hotels and HERRCs. Whether the per-unit costs can be brought down significantly with longer term planning is uncertain, particularly if census levels continue to rise.
The Comptroller’s Office is carrying an expense risk in line with OMB’s assumptions of $400 million in FY 2023 (the expected expense above the budgeted $1 billion) and $2.8 billion in FY 2024. If the census is able to stabilize, the City should move away from emergency response and procurement and the unit cost may revert back to the historical cost of providing shelter. The continued inflow of some level of new arrivals seems likely given the underlying causes in the home countries of the asylum seekers, significant uncertainty with Title 42 sunsetting, and the likelihood of a legal challenge to President Biden’s recently announced proposal to limit asylum seekers entering the country at the Southern border. Furthermore, without the availability of new affordable housing options in the city for those already being provided temporary shelter, it is likely that the homeless census will remain at elevated levels regardless of these external factors. The Comptroller’s Office is maintaining the risk at the FY 2024 level in the outyears.
The Federal and State governments, as noted earlier in the report, have indicated some financial support. The Federal government allocated $800 million in the Omnibus Reconciliation act for FEMA to reimburse localities for the costs of caring for asylum seekers. However, these funds are intended for all localities and the appropriations are for one year only. In FY 2023, the Comptroller’s Office anticipates federal reimbursement through FEMA grants of only $200 million for this purpose (compared to the $1 billion assumed in the Financial Plan). The Governor’s Executive Budget lays out a commitment to cover 29 percent of the shelter costs for asylum seekers, however the amount is capped at $1 billion over two years. The Governor did not extend this commitment into the outyears.
Rental Assistance
In addition, the January 2023 Financial Plan shows a significant drop in funding for the City’s rental assistance program. The Comptroller’s Office projects a risk of at least $237 million in City funds for the CityFHEPs (City Fighting Homelessness and Eviction Prevention Supplement) rental assistance program just to maintain prior year spending and the current vouchers already in use. There is likely to be further upward pressure on the rental assistance budget as more families require vouchers to exit the shelter system and with the shift to Federal Section 8 Fair Market Housing Rent levels. Proposed legislation to reduce requirements for longer term shelter residents (eliminating work requirements and enabling undocumented immigrants to access vouchers) is being considered by the City Council. Other legislation that would remove the shelter prioritization is also being considered, and would pose financial risks well beyond those stated here.
NYC Health + Hospitals
In the January Plan update, the City projects NYC Health + Hospitals (H+H) will end the current fiscal year with a cash balance of $563 million. This estimate represents a decline of $187 million from the previous projection, mainly owing to a swing from a modest income of about $18 million in the FY 2023 Executive Budget to a current projected loss of nearly $144 million. For the FY 2024 Preliminary Budget, the City anticipates the year-end cash balance for H+H will continue retreating to $453 million.
The City projects the H+H budget will trend downward from $12.7 billion in FY 2022 to $10.6 billion in FY 2023 as the wind down of COVID-related activities continues, significantly reducing their impact on the FY 2023 budget. For the current year, the City has raised H+H’s revenue projection by a net $768 million that includes the recognition of increased third party revenues of $929 million, primarily from Supplemental Medicaid ($744 million) and managed care ($135 million) revenues, partly offset by a $180 million reduction in strategic revenue initiatives. The additional Supplemental Medicaid revenues are mainly due to revised timing of Upper Payment Limit (UPL) receipts previously anticipated in FY 2022. These revenue increases are eclipsed by $903 million in greater expenses. The higher spending mainly stems from the $763 million in other OTPS costs, which includes more than $300 million for oversight and operations of HERRCs for asylum seekers and over $150 million from delays of certain payments due to the City from the prior year. A more detailed discussion on the HERRCs appears in the Homeless Services and the Asylum Seeker Emergency section of this report.
Similarly, the City projects an operating loss of $110 million for H+H in the FY 2024 Preliminary Budget, leading to a lower expected cash balance of $453 million compared to the April 2022 Plan. The most notable element in the FY 2024 Preliminary Budget, projected at about $9.4 billion, is the anticipated cut of Supplemental Medicaid Disproportionate Share Hospitals (DSH) revenue. Unless the Federal government once again delays implementation, the cut would go into effect in October 2023 and reduce H+H baseline revenues by over $600 million annually beginning in FY 2024.
Compared to prior estimates, the Preliminary Budget also reflects an increase of over $300 million in strategic revenue initiatives, which are almost in equal parts due to revised assumptions for ongoing UPL conversion and additional Federal and State actions needed to address the DSH revenue reduction. On the negative side, delayed Covid-19 related reimbursement and higher spending totaling $520 million more than offset revenue increases reflected in the latest update.
Over the remainder of the Plan, H+H’s cash balance is anticipated to rise to $531 million in FY 2025 before resuming its decline to $300 million in FY 2026 and $12 million in FY 2026. These projections assume the continuation of DSH cuts, and therefore the outlook could improve significantly if the cuts are restored by Congress. Strategic initiatives, which have become a growing component in the H+H budget, will continue to hover around $2 billion annually during this span. About 80 percent of the total value of strategic initiatives during this span is comprised of revenue actions, with a significant portion dependent on Federal and State actions.
IV. Capital Budget and Financing Program
Capital Commitment Plan, FY 2023 – FY 2027
All-Funds Commitments
The January 2023 Capital Commitment Plan totals $96.55 billion in all-funds authorized commitments, a $551.2 million increase compared to the September 2022 Capital Plan over the same fiscal years. City-funds authorized commitments make up $92.29 billion of the total authorized commitments. After adjusting for the reserve for unattained commitments, all-funds planned commitments drop to $87.74 billion, as shown in Table 34. The City-funds commitments after adjusting for the reserve for unattained commitments drop to $83.48 billion. Twenty-two percent, or $21.46 billion, of the all-funds authorized commitments are scheduled for FY 2023. When adjusted for the reserve for unattained commitments, the percentage drops to 17 percent. In the outyears of the Plan, authorized commitments increase to $22.18 billion in FY 2024, then decrease to $19.01 billion in FY 2025, to $17.03 billion in FY 2026, and to $16.86 billion in FY 2027, resulting in an average authorized commitment amount of $19.31 billion per year over the period.
Table 34. FY 2023–FY 2027 Capital Commitments, All-Funds
| ($ in millions) Project Category |
FY 2023–FY 2027 January 2023 Commitment Plan | Percent of Total | Change from September 2022 Plan |
| Education and CUNY | $15,776 | 16.3% | ($19) |
| Environmental Protection | 15,995 | 16.6% | 1,178 |
| Dept. of Transportation and Mass Transit | 14,881 | 15.4% | (1,152) |
| Housing and Economic Development | 16,373 | 17.0% | 76 |
| Administration of Justice | 9,972 | 10.3% | (36) |
| Resiliency, Technology and Equipment | 6,539 | 6.8% | 289 |
| Parks Department | 3,917 | 4.1% | (379) |
| Hospitals | 2,991 | 3.1% | 122 |
| Other City Operations and Facilities | 10,101 | 10.5% | 472 |
| Total Authorized Commitments | $96,545 | 100.0% | $551 |
| Reserve for Unattained Commitments | ($8,807) | N/A | ($239) |
| Total Net of Reserve for Unattained Commitments | $87,739 | N/A | $312 |
SOURCE: NYC Office of Management and Budget, FY 2023–FY 2027 January 2023 Capital Commitment Plan
NOTE: Numbers may not add due to rounding.
Following a similar pattern as past Plans, almost two-thirds of the Plan is in the four program areas of Education and CUNY, Environmental Protection (DEP), Department of Transportation (DOT) and Mass Transit, and Housing and Economic Development as shown in Table 34. Housing and Economic Development leads the way with 17.0 percent of the total, followed by DEP with 16.6 percent, Education and CUNY with 16.3 percent, and DOT and Mass Transit at 15.4 percent.
The increase of $551.2 million is a complicated mix of increases and decrease over 39 project types. The top three increases are for water pollution control related projects in the amount of $744 million, followed by an increase of $406 million for Sanitation related projects, and $263 million for citywide equipment, resiliency and energy efficiency projects. The top three decreases are in DOT related highway bridges projects of $988 million, Parks projects of $379 million, and DOT highways and street reconstruction projects of $225 million.
The remaining net increase of about $730 million over the period is comprised of increases for 20 project types totaling $1.12 billion, offset by a combined $387 million decrease in 11 other project types, along with two other project types with no change. Notable increases include DEP water supply projects in the amount of $202 million, and DEP water main-related projects of $175 million. Notable decreases are $115 million in cultural affairs-related projects and $64 million in CUNY projects.
Ten-Year Capital Strategy
The City is required by Sections 215 and 234 of the City Charter to issue a Preliminary Ten-Year Capital Strategy (the Preliminary Strategy or PTYCS) every odd calendar year. The Preliminary Strategy for FY 2024–FY 2033 totals $159.33 billion — $155.45 billion in City-funds and $3.88 billion in non-City funds. This is an increase of $25.59 billion, or 19.1 percent, from the Ten-Year Capital Strategy (TYCS) published in April 2021, as shown in Table 35. The Preliminary Strategy increased by $26.16 billion in City funds but decreased by $575.8 million in non-City funds. The Preliminary Strategy is supported almost exclusively by City General Obligation (GO), Transitional Finance Authority (TFA), and New York Water Finance Authority financing, accounting for 97.6 percent of the total.
Table 35. Ten-Year Capital Strategy, Published in April 2021 vs January 2023 Preliminary Ten-Year Capital Strategy
| ($ in millions) | April 2021 Capital Strategy City-Funds | April 2021 Capital Strategy All-Funds | January 2023 Capital Strategy City-Funds | January 2023 Capital Strategy All-Funds | Change in City-Funds | Change in All-Funds |
| Education (DOE and CUNY) | $22,967 | $22,971 | $18,105 | $18,169 | ($4,862) | ($4,802) |
| Environmental Protection | 22,046 | 22,669 | 28,418 | 29,046 | 6,372 | 6,377 |
| DOT | 21,375 | 22,846 | 29,978 | 31,280 | 8,604 | 8,434 |
| Housing (HPD and NYCHA) | 14,805 | 15,125 | 22,728 | 23,048 | 7,923 | 7,923 |
| Administration of Justice | 13,529 | 13,582 | 13,358 | 13,391 | (171) | (191) |
| Hospitals (H + H) | 2,533 | 3,300 | 3,174 | 3,831 | 640 | 530 |
| Resiliency, Tech. & Equipment | 9,035 | 9,367 | 9,702 | 9,811 | 666 | 444 |
| Economic Development | 4,778 | 4,999 | 5,963 | 6,058 | 1,185 | 1,060 |
| Parks Department | 5,209 | 5,613 | 8,324 | 8,747 | 3,116 | 3,134 |
| All Other | 13,012 | 13,273 | 15,702 | 15,951 | 2,690 | 2,678 |
| Total | $129,289 | $133,745 | $155,451 | $159,332 | $26,163 | $25,587 |
SOURCE: January 2023 Preliminary FY 2024 Ten-Year Capital Strategy, Fiscal Years 2024-2033, and the April 2021 Ten-Year Capital Strategy, Fiscal Years 2022-2031
NOTE: Numbers may not add due to rounding.
The January 2023 Preliminary Strategy is front-loaded with 47.1 percent of estimated commitments over the first four years and 57.1 percent over the first five. However, this is an improvement from the April 2021 TYCS when the percentages were 57.4 and 68.1 percent, respectively. Consistent with past strategies, most of the commitments are for Education, DEP, housing (including NYCHA), economic development, and DOT projects, which together constitute 67.5 percent of the Capital Strategy. The categories with the largest changes from the April 2021 TYCS are DOT with an increase of $8.43 billion, housing with an increase of $7.92 billion, DEP with an increase of $6.38 billion, and the Parks Department with an increase of $3.13 billion as shown on Table 35. Offsetting these increases is a projected decrease of $4.80 billion in Education/CUNY related projects.
The increase in DOT is largely driven by a projected increase of $2.93 billion for bridge life extension projects and miscellaneous related work, $2.07 billion for capital improvements for bridges rated “fair,” and $1.72 billion for primary street reconstruction projects. The $7.92 billion increase in housing is primarily from a projected $3.52 billion increase for new housing, $1.34 billion for low to moderate income housing upgrades related to NYCHA, $1.22 billion for the preservation of existing housing, and $1.07 billion for special needs housing. DEP’s increase of $6.38 billion is comprised of $2.11 billion for sewer extensions to accommodate new development, $1.46 billion for water pollution control plant upgrades and reconstruction, and $903 million for the replacement and/or augmentation of existing sewers. The increase of $3.13 billion to the Parks Department is driven by the projected increase of $2.43 billion for neighborhood parks and playgrounds. The decrease in the January 2023 PTYCS from the April 2021 TYCS in the DOE/CUNY program area of $4.80 billion is due primarily to decreases of $2.39 billion for DOE new school system expansion, $1.34 billion in other system expansion alternatives, and $974 million in educational enhancement projects. CUNY, however, saw an increase of $246 million for miscellaneous construction projects.
The PTYCS is also categorized by service categories. This categorization places capital projects in broad infrastructure, equipment, vehicle, land, and facility categories. Just below 60 percent of the Capital Strategy is allocated in four of the eleven service categories for Road and Bridge Works, Public Building and Facilities, Housing, and Stormwater and Wastewater management as shown on Table 36. Planned commitments for Road and Bridge works sum to $29.66 billion, $16.37 billion (55.2 percent) of which are for the rehabilitation and reconstruction of bridges, highlighted by $9.76 billion for bridge useful life extension projects throughout the city, and $5.83 billion for the reconstruction of bridges rated “fair.” Major projects include $398 million for the Trans-Manhattan Expressway and $1.53 billion for the Brooklyn Queens Expressway (BQE) bridge related projects. Another 42.3 percent ($12.56 billion) of projected commitments for Road and Bridge works are allocated for street reconstruction and resurfacing, including $5.18 billion for primary street reconstruction, $3.55 billion for pedestrian ramp construction, and $3.80 billion for primary street resurfacing and sidewalk reconstruction. The remaining commitments for Roads and Bridge works are allocated for facilities reconstruction, bridge painting, East River bridges, traffic pavement markings, and lighting projects.
Within the Public Buildings and Facilities category, $6.84 billion of estimated commitments are for new borough-based jail facilities over FY 2024—2028,[21] followed by $6.32 billion for miscellaneous energy efficiency, sustainability, and retrofit projects, $2.67 billion for the reconstruction and renovation of court facilities, and $1.67 billion for building systems and infrastructure projects for the Department of Correction, and $1.40 billion for Department of Sanitation garages and facilities. Within the Housing category, projected commitments are directed primarily to new housing construction ($7.55 billion), preservation of existing housing stock ($5.4 billion), low to moderate income public housing construction and upgrades associated with NYCHA which include roof replacements, lead abatement, elevator rehabilitation, heating component upgrades, and pest mitigation ($4.36 billion), and special needs housing ($3.96 billion).
Table 36. FY 2024 – FY 2033 Ten-Year Capital Strategy
Major Capital Commitments by Service Category and Life-Cycle Classifications
| ($ in millions) Service Category |
State of Good Repair | Program Expansion | Programmatic Replacement | Total | Percent of Total |
| Road and Bridge Works | $29,664 | $0 | $0 | $29,664 | 18.6% |
| Public Buildings and Facilities | 13,772 | 567 | 9,620 | 23,959 | 15.0% |
| Housing | 11,539 | 11,509 | 0 | 23,048 | 14.5% |
| Stormwater and Wastewater Management | 1,334 | 8,023 | 9,270 | 18,627 | 11.7% |
| Educational Facilities | 13,859 | 4,231 | 3 | 18,093 | 11.4% |
| Equipment and Technology | 1,253 | 0 | 9,784 | 11,037 | 6.9% |
| Water Supply and Treatment | 166 | 6,460 | 3,150 | 9,776 | 6.1% |
| Parks and Open Spaces | 8,072 | 512 | 0 | 8,584 | 5.4% |
| Community Facilities | 7,631 | 96 | 170 | 7,897 | 5.0% |
| Economic Development | 0 | 6,058 | 0 | 6,058 | 3.8% |
| Mass Transit | 0 | 0 | 2,589 | 2,589 | 1.6% |
| Total | $87,290 | $37,457 | $34,585 | $159,332 | 100.0% |
| Percent of Total | 54.8% | 23.5% | 21.7% | 100.0% |
SOURCE: Office of Management and Budget, FYs 2024-2033 Preliminary Ten-Year Capital Strategy, January 2023
NOTE: Numbers may not tie due to rounding.
In the Stormwater and Wastewater Management category, $6.60 billion is projected for water pollution control upgrades and reconstruction, $3.40 billion is estimated for citywide sewer extension to accommodate new development, and $3.01 billion for the replacement and/or augmentation of existing sewers citywide.
The remaining 40 percent of the Preliminary Strategy is allocated among seven service categories, with $18.09 billion of it allocated for Educational Facilities, $11.04 billion for Equipment and Technology, $9.78 billion for Water Supply and Equipment, $7.90 billion for Community Facilities, $8.58 billion for Parks and Open Spaces, $6.06 billion for Economic Development projects, and $2.59 billion for Mass Transit. The top three items in the Educational Facilities category are the rehabilitation of school components with a projected $7.72 billion, new school construction or expansion with $3.20 billion, and emergency, inspection, and miscellaneous projects with $3.18 billion. Within the Equipment and Technology category, the major items include $3.48 billion for data processing equipment along with $2.23 billion for Sanitation trucks and other equipment. Within Water Supply and Treatment, the highlights are trunk and distribution water main extensions and replacements in the amount of $2.75 billion, the Kensico City tunnel project with $1.81 billion, and $1.77 billion for various water quality preservation projects.
Parks and Open Spaces are led by $4.02 billion for neighborhood parks and playground related projects, followed by $2.36 billion for large, major, and regional park reconstruction projects, and $1.49 billion for major recreational facilities and facility projects. Community Facilities related projects include a variety of H+H’s routine reconstruction projects in the amount of $3.09 billion, along with $1.43 billion for the essential reconstruction of facilities for cultural institutions, and $1.34 billion allocated to the four library systems largely for state of good repair work.
Notable projects in the Economic Development and Mass Transit categories include $1.67 billion for miscellaneous economic development projects related to program expansion, $1.31 billion for neighborhood revitalization, $1.15 billion for commercial development, $2.06 billion for track and other miscellaneous improvements related to New York City Transit, and $529 million for DOT related ferry boat upgrades and terminal reconstruction work.
In addition to the Service Categories noted above, capital commitments in the Preliminary strategy are also allocated among three “lifecycle” project categories: state of good repair (SOGR), which involves maintaining and repairing facilities and infrastructure, program expansion, which involves adding new or expanding current facilities and infrastructure, and programmatic replacement, which involves replacing facilities or equipment. More than half of the commitments, $87.29 billion (54.8 percent), are allocated for state of good repair, followed by $37.46 billion (23.5 percent) for program expansion, and $34.59 billion (21.7 percent) for programmatic replacement as shown in Table 36.
In the SOGR category, Road and Bridge Works, Educational Facilities, Public Buildings and Facilities, constitute just less than 66 percent, or $57.29 billion of commitments within the SOGR; with commitments for Educational Facilities and Road and Bridge Works totaling more than $43.52 billion combined. These SOGR projected commitments account for over 76 percent of planned commitments for Educational Facilities and the entirety of planned commitments for Road and Bridge Works.
Within the program expansion category, the service categories of Housing, Stormwater and Wastewater, Water Supply and Treatment, and Economic Development projects constitute over 85 percent of the total. Major anticipated capital commitments include $7.55 billion for new housing construction, $3.96 billion for special needs housing, and $3.40 billion of sewer extensions to accommodate new construction.
Within the programmatic replacement category, the service categories of Equipment and Technology, Public Buildings and Facilities, and Stormwater and Wastewater projects make up 82.9 percent of the total. Projected capital commitments include $6.84 billion for the design and construction of new borough-based jail facilities, $6.60 billion for upgrades to water pollution control plants, $3.15 billion for water main replacement and dam safety programs at DEP, and $3.48 billion for citywide information systems and equipment.[22]
The January 2023 PTYCS continues to be primarily financed by City bonds – General Obligation (GO) and Transitional Finance Authority Future Tax Secured (TFA FTS) – with an estimated $127.03 billion in anticipated local tax-supported borrowing, or 79.7 percent of the Strategy. Municipal Water Finance Authority (NYW) debt is expected to fund $28.42 billion, or 17.8 percent of the Strategy. The remaining 2.4 percent, about $3.88 billion, will be funded with Federal ($3.04 billion), State ($604.2 million), and other non-City sources ($236 million) as shown in Table 37.
Table 37. Funding of the FY 2024 – FY 2033 Preliminary Ten-Year Capital Strategy, January 2023
| ($ in millions) Agency/Project Type |
Tax-Supported | Water Authority Funded | Non-City Funded | Total Funded |
|---|---|---|---|---|
| Department of Education/CUNY | $18,105 | $0 | $64 | $18,169 |
| Department of Environmental Protection: | $0 | $28,418 | $628 | $29,046 |
| Water Pollution Control | 0 | 8,855 | 416 | 9,271 |
| Water Mains | 0 | 6,494 | 204 | 6,698 |
| Sewers | 0 | 9,348 | 8 | 9,356 |
| Water Supply | 0 | 3,077 | 0 | 3,077 |
| DEP Equipment | 0 | 643 | 0 | 643 |
| Dept. of Transportation | $29,978 | 0 | $1,301 | $31,280 |
| Bridges and Highway Bridges | 15,956 | 0 | 446 | 16,402 |
| Highways | 12,453 | 0 | 569 | 13,022 |
| Traffic | 1,092 | 0 | 145 | 1,237 |
| Ferries | 388 | 0 | 141 | 529 |
| Transportation Equipment | 89 | 0 | 0 | 89 |
| Housing Preservation and Development | $18,366 | $0 | $320 | $18,686 |
| NYCHA | $4,362 | $0 | $0 | $4,362 |
| Economic Development (SBS) | $5,963 | $0 | $95 | $6,058 |
| Administration of Justice | $13,358 | $0 | $33 | $13,391 |
| Police | 1,471 | 0 | 25 | 1,496 |
| Correction | 9,032 | 0 | 0 | 9,032 |
| Courts | 2,856 | 0 | 8 | 2,863 |
| Resiliency, Technology, and Citywide Equipment | $9,702 | $0 | $109 | $9,811 |
| Parks Department | $8,324 | $0 | $423 | $8,747 |
| Hospitals (H +H) | $3,174 | $0 | $657 | $3,831 |
| Other City Operations and Facilities | $15,702 | $0 | $249 | $15,951 |
| Total | $127,034 | $28,418 | $3,881 | $159,332 |
| Percent of Total Funding | 79.73% | 17.84% | 2.44% | 100.0% |
NOTE: FYs 2024-2033 Preliminary Ten-Year Capital Strategy, January 2023. Numbers may not tie due to rounding.
Financing Program
Total projected borrowing in the January 2023 Financial Plan for FY 2023 through FY 2027 is $62.35 billion. For the period FY 2023-2026, the January 2023 Plan is $1.28 billion less than the November 2022 Financial Plan’s estimate.[23] This is a result of decreases of $1.24 billion in GO borrowing, $335 million in Transitional Finance Authority (TFA) Future Tax Secured (FTS) borrowing, with an increase of $287 million in New York City Municipal Water Finance Authority (NYW) borrowing over the period. The reduction in overall borrowing, despite the modest increase of $551 million in capital commitments from the September 2022 Capital Plan, stems primarily from $1.38 billion of commitment deferrals from FY 2023 and FY 2024 to the outyears and the expected additional capital proceeds from bond premiums in FY 2023.[24] Estimated total borrowing ranges from $9.23 billion in FY 2023 to $14.98 billion in FY 2027, with an annual average of $12.47 billion over the period, down from $12.73 billion per year in the November 2022 Financial Plan. Excluding NYW borrowing, the GO/TFA borrowing averages are $10.60 billion per year in the January 2023 Plan over FY 2023–FY 2027, compared with $10.92 billion per year in the November 2022 Financial Plan.
Table 38. January 2023 Plan Financing Program
| ($ in millions) | Estimated Borrowing and Funding Sources FY 2023 – FY 2027 | Percent of Total |
|---|---|---|
| General Obligation Bonds | $26,595 | 42.6% |
| TFA FTS Bonds | 26,420 | 42.4% |
| NYC Water Finance Authority | 9,333 | 15.0% |
| TFA BARBs | 0 | 0.0% |
| Total | $62,348 | 100.0% |
SOURCE: NYC Office of Management and Budget, FY 2024 Preliminary Budget and January 2023 Financial Plan.
Debt Service
As shown in Table 39 debt service, net of prepayments, in the January 2023 Financial Plan and FY 2024 Preliminary Budget (January 2023 Plan) totals $7.73 billion in FY 2023, $7.98 billion in FY 2024, $8.43 billion in FY 2025, $9.17 billion in FY 2026, and $9.84 billion in FY 2027.[25] These amounts represent decreases from the November 2022 Financial Plan of $1 million in FY 2023, $54 million in FY 2024, $80 million in FY 2025, $99 million in FY 2026 and $112 million in FY 2027 for a total decrease of $345 million over the Plan period.[26] Between FY 2023 and FY 2027, total annual debt service is expected to increase by $2.11 billion, or by 27.2 percent. In addition, these estimates for debt-service represent an estimated annual average percent increase of 6.2 percent. These projections exclude debt service of the NYW, which is backed by water and sewer user fees, and the debt service of TFA BARBs, supported by State building aid.
Table 39. January 2023 Financial Plan Debt Service Estimates
| ($ in millions) | FY 2023 | FY 2024 | FY 2025 | FY 2026 | FY 2027 | Change FY 2023 – FY 2027 |
Average Annual Growth |
| GO | $4,212 | $4,430 | $4,604 | $4,849 | $5,039 | $827 | 4.6% |
| TFA FTSa | 3,295 | 3,352 | 3,635 | 4,140 | 4,613 | 1,318 | 8.8 |
| Lease-Purchase | 147 | 118 | 117 | 116 | 115 | (32) | -6.0 |
| TSASC, Inc. | 76 | 76 | 76 | 69 | 69 | (7) | -2.4 |
| Total | $7,730 | $7,976 | $8,432 | $9,174 | $9,836 | $2,106 | 6.2% |
SOURCE: NYC Office of Management and Budget, FY 2024 January 2023 Financial Plan, January 2023
NOTE: Debt service is adjusted for prepayments.
a Amounts do not include TFA BARBs
The $345 million reduction from the November 2022 Plan over FY 2023–FY 2027 is comprised of $293 million of GO savings and $52 million in TFA savings. GO debt service projected savings over the Plan period are derived almost exclusively from the decrease in estimated borrowing over the period resulting in debt service savings of $52 million in FY 2024, $71 million in FY 2025, $81 million in FY 2026, and $88 million in FY 2027. Projected TFA debt service reductions over the Plan period are similarly driven by reduced projected borrowing, albeit less dramatic, in the amount of $2 million in FY 2024, $9 million in FY 2025, $18 million in FY 2026, and $24 million in FY 2027. These savings are in the City’s PEG program and are additive to the PEG savings for debt-service savings presented in the November 2022 Plan.
Debt Affordability
Debt affordability continues to be an important topic facing the City. Debt service as a percent of local tax revenues and as a percent of total-funds revenues are widely used measures of debt affordability.[27] In FY 2022, the City’s debt service was 9.7 percent of local tax revenues, a continuation of FY 2021’s historically low percentage. The January 2023 Plan projects debt service will consume 11.1 percent of local tax revenues in FY 2023, 11.5 percent in FY 2024, 11.8 percent in FY 2025, 12.6 percent in FY 2026, and 13.4 percent in FY 2027 as shown in Chart 16. The upward trend in the debt service to tax revenue ratio reflects the disparity between debt service and tax revenue growth rates over the Financial Plan period. Debt service is projected to grow at an average annual rate of 6.3 percent[28] from FY 2023 to FY 2027 while tax revenue during this period is projected to grow 1.5 percent annually. Beyond FY 2027 the ratio is estimated to reach 14.8 percent by FY 2033, below the 15 percent threshold for debt-service affordability. OMB’s assumed tax revenue growth is 3.6 percent per year over the FY 2027 to FY 2033 period. If this assumed rate is less than projected, the ratio could possibly exceed the 15 percent mark. However, in past Ten-Year Capital Strategies which contain a ten-year outlook for debt service, it is often the case that the debt-service to tax revenue ratio is estimated to approach but not exceed 15 percent.
Chart 16. NYC Debt Service as a Percent of Tax Revenues
SOURCE: Office of the NYC Comptroller, Comprehensive Annual Financial Reports, FY 1992 – FY 2022 and NYC Office of Management and Budget, FY 2023 January Plan and FY 2024 Preliminary Budget
Debt service as a percent of total revenues was 6.2 percent in FY 2022. Due to the drop in total revenues in FY 2023, the January 2023 Plan projects that debt service as a percent of total revenues will be 7.3 percent in FY 2023, 7.8 percent in FY 2024, 7.9 percent in FY 2025, 8.5 percent in FY 2026, and 8.9 percent in FY 2027. This is driven by a 6.2 percent annual growth rate in debt service compared to a growth rate in revenues of 1.1 percent over the same period.
Chart 17. NYC Debt Service as a Percent of Total Revenues
SOURCE: Office of the NYC Comptroller, Comprehensive Annual Financial Reports, FY 1992 – FY 2022 and NYC Office of Management and Budget, FY 2023 January Plan and FY 2024 Preliminary Budget
V. Appendix
Table A1. January 2023 Financial Plan Revenue Detail
| ($ in millions) | FY 2023 | FY 2024 | FY 2025 | FY 2026 | FY 2027 | Change FYs 2023– 2027 |
Annual Percent Change | |
|---|---|---|---|---|---|---|---|---|
| Dollars | Percent | |||||||
| Taxes: | ||||||||
| Real Property | $31,421 | $32,013 | $32,146 | $32,156 | $32,156 | $735 | 2.3% | 0.6% |
| Personal Income Tax | 15,284 | 14,844 | 15,462 | 15,869 | 16,269 | $985 | 6.4% | 1.6% |
| General Corporation Tax | 5,170 | 4,789 | 4,902 | 4,951 | 4,982 | (188) | (3.6%) | (0.9%) |
| Unincorporated Business Tax | 2,320 | 2,365 | 2,430 | 2,523 | 2,620 | 300 | 12.9% | 3.1% |
| Sale and Use Tax | 9,131 | 9,266 | 9,868 | 10,549 | 10,935 | 1,804 | 19.8% | 4.6% |
| Real Property Transfer Tax | 1,256 | 1,294 | 1,376 | 1,462 | 1,540 | 284 | 22.6% | 5.2% |
| Mortgage Recording Tax | 927 | 853 | 909 | 969 | 1,019 | 92 | 9.9% | 2.4% |
| Commercial Rent | 862 | 863 | 866 | 868 | 868 | 6 | 0.7% | 0.2% |
| Utility | 379 | 395 | 403 | 418 | 418 | 39 | 10.3% | 2.5% |
| Hotel | 589 | 644 | 695 | 713 | 738 | 149 | 25.3% | 5.8% |
| Cigarette | 18 | 17 | 16 | 16 | 16 | (2) | (11.1%) | (2.9%) |
| All Other | 924 | 824 | 824 | 823 | 823 | (101) | (10.9%) | (2.9%) |
| Tax Audit Revenue | 721 | 721 | 721 | 721 | 721 | 0 | 0.0% | 0.0% |
| Total Taxes | $69,002 | $68,888 | $70,618 | $72,038 | $73,105 | $4,103 | 5.9% | 1.5% |
| Miscellaneous Revenue: | ||||||||
| Licenses, Franchises, etc. | $751 | $696 | $694 | $699 | $679 | ($72) | (9.6%) | (2.5%) |
| Interest Income | 325 | 402 | 298 | 228 | 225 | (100) | (30.8%) | (8.8%) |
| Charges for Services | 1,004 | 1,024 | 1,026 | 1,026 | 1,026 | 22 | 2.2% | 0.5% |
| Water and Sewer Charges | 1,817 | 1,768 | 1,755 | 1,749 | 1,749 | (68) | (3.7%) | (0.9%) |
| Rental Income | 255 | 254 | 254 | 254 | 254 | (1) | (0.4%) | (0.1%) |
| Fines and Forfeitures | 1,273 | 1,121 | 1,115 | 1,122 | 1,122 | (151) | (11.9%) | (3.1%) |
| Miscellaneous | 345 | 349 | 339 | 338 | 338 | (7) | (2.0%) | (0.5%) |
| Intra-City Revenue | 2,213 | 1,902 | 1,900 | 1,896 | 1,896 | (317) | (14.3%) | (3.8%) |
| Total Miscellaneous Revenue | $7,983 | $7,516 | $7,381 | $7,312 | $7,289 | ($694) | (8.7%) | (2.2%) |
| Unrestricted Intergovernmental Aid: | ||||||||
| Other Federal and State Aid | $252 | $0 | $0 | $0 | $0 | ($252) | (100.0%) | (100.0%) |
| Total Unrestricted Intergovernmental Aid | $252 | $0 | $0 | $0 | $0 | ($252) | (100.0%) | (100.0%) |
| Reserve for Disallowance of Categorical Grants | ($15) | ($15) | ($15) | ($15) | ($15) | $0 | 0.0% | 0.0% |
| Less: Intra-City Revenue | ($2,213) | ($1,902) | ($1,900) | ($1,896) | ($1,896) | $317 | (14.3%) | (3.8%) |
| TOTAL CITY-FUNDS | $75,009 | $74,487 | $76,084 | $77,439 | $78,483 | $3,474 | 4.6% | 1.1% |
| Other Categorical Grants | $1,172 | $1,060 | $1,057 | $1,055 | $1,054 | ($118) | (10.1%) | (2.6%) |
| Inter-Fund Agreements | $726 | $698 | $699 | $699 | $699 | ($27) | (3.7%) | (0.9%) |
| Federal Categorical Grants: | ||||||||
| Community Development | $407 | $252 | $239 | $239 | $239 | ($168) | (41.3%) | (12.5%) |
| Social Services | 3,473 | 3,458 | 3,443 | 3,441 | 3,441 | (32) | (0.9%) | (0.2%) |
| Education | 3,947 | 3,687 | 2,147 | 1,901 | 1,901 | (2,046) | (51.8%) | (16.7%) |
| Other | 4,597 | 2,088 | 2,322 | 1,436 | 1,418 | (3,179) | (69.2%) | (25.5%) |
| Total Federal Grants | $12,424 | $9,485 | $8,151 | $7,017 | $6,999 | ($5,425) | (43.7%) | (13.4%) |
| State Categorical Grants: | ||||||||
| Social Services | $1,965 | $1,863 | $1,853 | $1,846 | $1,846 | ($119) | (6.1%) | (1.5%) |
| Education | 12,522 | 12,695 | 12,887 | 12,887 | 12,887 | 365 | 2.9% | 0.7% |
| Higher Education | 276 | 276 | 276 | 276 | 276 | 0 | 0.0% | 0.0% |
| Department of Health and Mental Hygiene | 639 | 605 | 605 | 606 | 606 | (33) | (5.2%) | (1.3%) |
| Other | 1,655 | 1,486 | 1,542 | 1,602 | 1,666 | 11 | 0.7% | 0.2% |
| Total State Grants | $17,057 | $16,925 | $17,163 | $17,217 | $17,281 | $224 | 1.3% | 0.3% |
| TOTAL REVENUES | $106,388 | $102,655 | $103,154 | $103,427 | $104,516 | ($1,872) | (1.8%) | (0.4%) |
NOTE: Numbers may not add due to rounding.
Table A2. January 2023 Financial Plan Expenditure Detail
| ($ in millions) | FY 2023 | FY 2024 | FY 2025 | FY 2026 | FY 2027 | Change FYs 2023 – 2027 |
Annual Percent Change |
|
|---|---|---|---|---|---|---|---|---|
| Dollars | Percent | |||||||
| Mayoralty | $191 | $160 | $159 | $158 | $158 | ($33) | (17.2%) | (4.6%) |
| Board of Elections | 236 | 137 | 137 | 137 | 137 | (99) | (41.9%) | (12.7%) |
| Campaign Finance Board | 77 | 13 | 13 | 13 | 13 | (65) | (83.6%) | (36.3%) |
| Office of the Actuary | 7 | 7 | 7 | 7 | 7 | 0 | 0.9% | 0.2% |
| President, Borough of Manhattan | 6 | 5 | 5 | 5 | 5 | (1) | (13.3%) | (3.5%) |
| President, Borough of Bronx | 7 | 6 | 6 | 6 | 6 | (1) | (14.1%) | (3.7%) |
| President, Borough of Brooklyn | 8 | 6 | 6 | 6 | 6 | (2) | (19.9%) | (5.4%) |
| President, Borough of Queens | 7 | 5 | 5 | 5 | 5 | (2) | (28.1%) | (7.9%) |
| President, Borough of Staten Island | 5 | 4 | 4 | 4 | 4 | (1) | (11.7%) | (3.1%) |
| Office of the Comptroller | 113 | 114 | 114 | 114 | 114 | 1 | 0.5% | 0.1% |
| Dept. of Emergency Management | 156 | 33 | 31 | 31 | 31 | (125) | (79.9%) | (33.1%) |
| Office of Administrative Tax Appeals | 6 | 6 | 6 | 6 | 6 | (0) | (0.3%) | (0.1%) |
| Law Dept. | 265 | 217 | 217 | 217 | 217 | (49) | (18.3%) | (4.9%) |
| Dept. of City Planning | 47 | 44 | 43 | 42 | 43 | (3) | (7.0%) | (1.8%) |
| Dept. of Investigation | 50 | 40 | 39 | 39 | 39 | (10) | (20.7%) | (5.6%) |
| NY Public Library — Research | 31 | 29 | 29 | 29 | 29 | (2) | (5.7%) | (1.5%) |
| New York Public Library | 161 | 150 | 150 | 150 | 150 | (11) | (6.6%) | (1.7%) |
| Brooklyn Public Library | 122 | 114 | 114 | 114 | 114 | (8) | (6.4%) | (1.7%) |
| Queens Borough Public Library | 126 | 118 | 118 | 118 | 118 | (9) | (6.9%) | (1.8%) |
| Dept. of Education | 31,209 | 30,726 | 30,821 | 31,002 | 31,204 | (5) | (0.0%) | (0.0%) |
| City University | 1,385 | 1,254 | 1,268 | 1,269 | 1,286 | (99) | (7.1%) | (1.8%) |
| Civilian Complaint Review Board | 23 | 22 | 22 | 22 | 22 | (0) | (1.9%) | (0.5%) |
| Police Dept. | 5,337 | 5,182 | 5,224 | 5,243 | 5,253 | (84) | (1.6%) | (0.4%) |
| Fire Dept. | 2,507 | 2,242 | 2,238 | 2,237 | 2,234 | (273) | (10.9%) | (2.8%) |
| Dept. of Veterans’ Services | 6 | 5 | 5 | 5 | 5 | (0) | (8.1%) | (2.1%) |
| Admin. for Children Services | 2,790 | 2,693 | 2,687 | 2,666 | 2,666 | (124) | (4.4%) | (1.1%) |
| Dept. of Social Services | 11,310 | 10,668 | 10,624 | 10,599 | 11,099 | (211) | (1.9%) | (0.5%) |
| Dept. of Homeless Services | 3,014 | 2,327 | 2,207 | 2,188 | 2,188 | (826) | (27.4%) | (7.7%) |
| Dept. of Correction | 1,250 | 1,196 | 1,186 | 1,186 | 1,186 | (64) | (5.1%) | (1.3%) |
| Board of Correction | 3 | 3 | 3 | 3 | 3 | 0 | 6.9% | 1.7% |
| Citywide Pension Contributions | 9,301 | 9,451 | 9,671 | 9,839 | 9,687 | 385 | 4.1% | 1.0% |
| Miscellaneous | 14,134 | 14,928 | 15,729 | 16,851 | 18,053 | 3,920 | 27.7% | 6.3% |
| Debt Service | 4,359 | 4,548 | 4,721 | 4,965 | 5,154 | 795 | 18.2% | 4.3% |
| TFA Debt Service | 3,295 | 3,352 | 3,635 | 4,140 | 4,613 | 1,317 | 40.0% | 8.8% |
| FY 2022 BSA and Discretionary Transfers | (6,114) | 0 | 0 | 0 | 0 | 6,114 | (100.0%) | (100.0%) |
| FY 2023 BSA | 2,166 | (2,166) | 0 | 0 | 0 | (2,166) | (100.0%) | (100.0%) |
| Public Advocate | 5 | 5 | 5 | 5 | 5 | (0) | (5.6%) | (1.4%) |
| City Council | 100 | 64 | 64 | 64 | 64 | (36) | (35.8%) | (10.5%) |
| City Clerk | 6 | 5 | 5 | 5 | 5 | (0) | (8.0%) | (2.1%) |
| Dept. for the Aging | 533 | 466 | 484 | 403 | 403 | (130) | (24.4%) | (6.8%) |
| Dept. of Cultural Affairs | 239 | 150 | 150 | 150 | 150 | (90) | (37.4%) | (11.1%) |
| Financial Info. Serv. Agency | 116 | 113 | 113 | 113 | 113 | (3) | (2.7%) | (0.7%) |
| Office of Payroll Admin. | 15 | 15 | 15 | 15 | 15 | (0) | (0.4%) | (0.1%) |
| Independent Budget Office | 6 | 6 | 6 | 6 | 6 | (0) | (6.4%) | (1.6%) |
| Equal Employment Practices | 1 | 1 | 1 | 1 | 1 | 0 | 1.1% | 0.3% |
| Civil Service Commission | 1 | 1 | 1 | 1 | 1 | (0) | (1.9%) | (0.5%) |
| Landmarks Preservation Commission | 7 | 7 | 7 | 7 | 7 | (0) | (5.5%) | (1.4%) |
| Districting Commission | 1 | 0 | 0 | 0 | 0 | (1) | (100.0%) | (100.0%) |
| Taxi & Limousine Commission | 172 | 51 | 50 | 50 | 50 | (121) | (70.6%) | (26.4%) |
| Commission on Human Rights | 14 | 13 | 13 | 13 | 13 | (1) | (7.7%) | (2.0%) |
| Youth & Community Development | 1,012 | 801 | 801 | 781 | 781 | (231) | (22.8%) | (6.3%) |
| Conflicts of Interest Board | 3 | 3 | 3 | 3 | 3 | (0) | (1.5%) | (0.4%) |
| Office of Collective Bargaining | 2 | 2 | 2 | 2 | 2 | (0) | (0.0%) | (0.0%) |
| Community Boards (All) | 20 | 20 | 20 | 20 | 20 | (1) | (3.4%) | (0.9%) |
| Dept. of Probation | 120 | 110 | 109 | 108 | 108 | (12) | (9.6%) | (2.5%) |
| Dept. Small Business Services | 425 | 164 | 173 | 144 | 144 | (281) | (66.0%) | (23.7%) |
| Housing Preservation & Development | 1,431 | 1,193 | 1,195 | 1,208 | 1,210 | (221) | (15.4%) | (4.1%) |
| Dept. of Buildings | 218 | 188 | 183 | 181 | 181 | (37) | (16.8%) | (4.5%) |
| Dept. of Health & Mental Hygiene | 2,868 | 2,016 | 1,985 | 1,954 | 1,954 | (914) | (31.9%) | (9.2%) |
| NYC Health + Hospitals | 1,677 | 826 | 824 | 787 | 787 | (889) | (53.0%) | (17.2%) |
| Office of Administrative Trials & Hearings | 65 | 63 | 63 | 63 | 63 | (2) | (3.2%) | (0.8%) |
| Dept. of Environmental Protection | 1,669 | 1,542 | 1,523 | 1,516 | 1,516 | (153) | (9.1%) | (2.4%) |
| Dept. of Sanitation | 1,921 | 1,816 | 1,824 | 1,818 | 1,819 | (102) | (5.3%) | (1.4%) |
| Business Integrity Commission | 9 | 8 | 8 | 8 | 8 | (1) | (5.9%) | (1.5%) |
| Dept. of Finance | 338 | 327 | 318 | 318 | 318 | (20) | (5.9%) | (1.5%) |
| Dept. of Transportation | 1,456 | 1,400 | 1,391 | 1,369 | 1,361 | (95) | (6.5%) | (1.7%) |
| Dept. of Parks and Recreation | 564 | 521 | 513 | 514 | 514 | (50) | (8.9%) | (2.3%) |
| Dept. of Design & Construction | 265 | 145 | 146 | 146 | 146 | (118) | (44.7%) | (13.8%) |
| Dept. of Citywide Admin. Services | 667 | 568 | 565 | 565 | 565 | (102) | (15.2%) | (4.0%) |
| D.O.I.T.T. | 679 | 560 | 574 | 546 | 546 | (133) | (19.5%) | (5.3%) |
| Dept. of Record & Info. Services | 17 | 16 | 16 | 16 | 16 | (0) | (2.0%) | (0.5%) |
| Dept. of Consumer & Worker Protection | 64 | 61 | 61 | 61 | 61 | (3) | (5.1%) | (1.3%) |
| District Attorney – N.Y. | 156 | 147 | 147 | 147 | 147 | (9) | (5.7%) | (1.5%) |
| District Attorney – Bronx | 103 | 99 | 99 | 99 | 99 | (4) | (4.1%) | (1.0%) |
| District Attorney – Kings | 133 | 130 | 130 | 130 | 130 | (3) | (2.2%) | (0.5%) |
| District Attorney –Queens | 87 | 86 | 86 | 86 | 86 | (1) | (0.7%) | (0.2%) |
| District Attorney – Richmond | 23 | 21 | 21 | 21 | 21 | (2) | (7.0%) | (1.8%) |
| Office of Prosec. & Special Narc. | 26 | 26 | 26 | 26 | 26 | 0 | 0.0% | 0.0% |
| Public Administrator – N.Y. | 1 | 1 | 1 | 1 | 1 | 0 | 4.9% | 1.2% |
| Public Administrator – Bronx | 1 | 1 | 1 | 1 | 1 | 0 | 3.0% | 0.7% |
| Public Administrator – Brooklyn | 1 | 1 | 1 | 1 | 1 | 0 | 0.0% | 0.0% |
| Public Administrator – Queens | 1 | 1 | 1 | 1 | 1 | 0 | 5.0% | 1.2% |
| Public Administrator – Richmond | 1 | 1 | 1 | 1 | 1 | (0) | (4.0%) | (1.0%) |
| General Reserve | 1,555 | 1,200 | 1,200 | 1,200 | 1,200 | (355) | (22.8%) | (6.3%) |
| Energy Adjustment | 0 | 10 | 7 | 99 | 108 | 108 | N/A | N/A |
| Lease Adjustment | 0 | 43 | 87 | 133 | 180 | 180 | N/A | N/A |
| OTPS Inflation Adjustment | 0 | 0 | 56 | 111 | 167 | 167 | N/A | N/A |
| TOTAL EXPENDITURES | $106,388 | $102,655 | $106,320 | $108,439 | $110,984 | $4,597 | 4.3% | 1.1% |
NOTE: Numbers may not add due to rounding. Agency expenditures shown above are net of intra-city expenditures.
Acknowledgements
The Comptroller wishes to thank the Bureau of Budget staff for producing this report. He is also grateful to Michael Dardia for his advice on the economic and tax forecast. And finally, he thanks Archer Hutchinson for his contributions to the design and layout.
Endnotes
[1] The Office of the Comptroller is grateful to Michael Dardia for his work and advice on the economic and tax forecast.
[2] https://about.fb.com/news/2022/11/mark-zuckerberg-layoff-message-to-employees/, https://www.npr.org/2022/11/14/1136659617/tech-layoffs-amazon-meta-twitter, https://www.cnn.com/2022/11/03/tech/lyft-layoffs/index.html.
[3] Average employment in the NYC information sector in the last two quarters of 2022 was approximately 18,000 higher than the average of the 4th quarter of 2019 and the 1st quarter of 2020 (Current Employment Survey, seasonally adjusted: NY State Department of Labor and NYC OMB).
[4] See Bureau of Labor Statistics, JOLTs data.
[5] The data are derived from consumer credit and debit card spending, allocated by place of residence, indexed to January 2020, and seasonally adjusted. Data and documentation are available at https://github.com/OpportunityInsights/EconomicTracker.
[6] Data are subject to revision, particularly the last published quarter. Quarters are December-February, March-May, June-August, and September-November. CPI and consumer spending data were lined up with the timing of taxable sales. The inflation adjustment uses NY CPI-U less shelter. Taxable sales data are not seasonally adjusted.
[7] According to the NYS Department of Taxation and Finance who administers the City’s PIT, the anomaly is related to the accounting treatment of NYS Pass-Through Entity Tax (PTET) credit toward NYS PIT. PTET is discussed in more detail in the NYC Comptroller’s recent The State of the City’s Economy and Finances report.
[8] Alternative, more optimistic revenue estimates are available from the NYC Independent Budget Office and the NYC Council.
[9] Miscellaneous revenue analysis excludes intra-city revenues. Water and sewer revenues are mostly payments from the New York City Water Board for the operation and maintenance of the water delivery and sewer systems and are not available for general operating purposes.
[10] OMB had provided an earlier estimate of $111 million in FY 2024 and $265 million in FY 2025, which was based on an earlier proposal with broader implications.
[11] See the Comptroller’s February spotlight for a fuller description of the Governor’s minimum wage proposal, and a comparison to the Raise Up NY bill: https://comptroller.nyc.gov/wp-content/uploads/documents/Spotlight-Minimum-Wage.pdf
[12] The Health Insurance Stabilization Fund created in the mid 1980s paid the difference between the GHI and HIP health insurance premiums, essentially protecting employees and retirees from paying more to be covered by GHI. Currently, the City contributes $35 million to the fund annually. For several fiscal years, the GHI premium was lower than the HIP premium leading to a higher than anticipated balance in the fund. Over time, the City and unions were able to draw from the fund balance to offset wage increases and other benefits for employees. In recent years, however, GHI health insurance premiums have been about equal or higher than HIP premiums. This has led to a reduction in the balance of the fund and the likelihood that the fund will not be able to meet obligations in coming fiscal years.
[13] Administrative Code of the city of New York section 12-126 (b) (1).
[14] Investment gains or losses above or below the actuarial interest rate assumption (AIRA) of 7 percent will decrease or increase pension expenditures by similar amounts beginning the second fiscal year following the given fiscal year returns.
[15] Due to the phasing in of investment gains or losses above or below the AIRA, the value of the pension assets, referred to as the actuarial assets, used in determining the required employer contributions do not equal exactly to the market value of assets. The Chief Actuary may choose at a given point in time to revalue the actuarial pension assets to equal the market value of assets.
[16] A more detailed review of NYC pandemic aid can be found in the January 2023 Economic Newsletter.
[17] The net impact of the Federal funding shift and City funding changes reduced 3K programmatic funding from $996 million to $712 million in the November Plan for both FY 2024 and FY 2025. The funding baseline for the 3K program then falls further to $619 million annually in FY 2026 and FY 2027.
[18] School budgets are funded through a Fair Student Funding formula based on the number of students, assigning greater weights for students with various needs. Given the enrollment decline during the pandemic, schools with register losses were set to face drastic cuts. The City used stimulus funds to hold schools harmless from these cuts and brought certain school budgets in line with pre-pandemic levels (known as register relief).
[19] Subsequent to the release of the January Plan, the DOE has internally allocated an additional $136 million in ARPA funds to school budgets for register relief in the current year, bringing total register relief funding to $296 million in FY 2023.
[20] As of March 1, 2023, the City reports that over 49,000 asylum seekers have gone through the system and been offered a place to sleep since last Spring.
[21] $891 million of planned commitments for borough based jail facilities reside in FY 2023 and actual commitments to date are about $500 million.
[22] Given the current inflationary environment, there is the potential for higher construction costs for the new Borough Based Jails planned in the four boroughs. In addition, meeting the initial 2026 deadline for completion of the four facilities is unlikely.
[23] The changes are measured from FY 2023-2026 as FY 2027 was not contained in the November 2022 Financial Plan.
[24] When the City issues bonds with coupon rates that exceed current market rates for the associated principal maturity, the computed bond proceeds will exceed the face (par) value of the issued bond. (aka bond premiums).
[25] Includes GO, conduit debt, TFA-PIT bonds, and TSASC.
[26] These figures represent all-funds and thus may differ from estimates in the City’s PEG program.
[27] Debt service in this discussion is adjusted to exclude prepayments.
[28] These ratios exclude TSASC debt-service and revenues. When TSASC is included, the growth drops slightly to 6.2 percent per annum.