Expanding Access in One Swipe: Opening Commuter Lines to Metrocards
Executive Summary
After years of deferred maintenance and ballooning construction costs, the Metropolitan Transportation Authority (MTA) has neither the appetite nor the resources to meaningfully expand its transit system with new subway tunnels and stations in order to meet the needs of a growing and changing city. And yet, there is a simple way for the MTA to quickly and effectively expand its rail network in one “swipe”—by charging the base $2.75 fare for all in-city trips on Metro-North and Long Island Rail Road (LIRR) and allowing free transfers to the subway and bus. Instead, the MTA has locked its commuter rail stops behind a steep pay wall, charging up to $10.25 for a one-way fare to Penn Station or Grand Central, all but closing off these vital transit links to city commuters and leaving these stations severely underutilized.
This report, by New York City Comptroller Scott M. Stringer, outlines how the MTA can dramatically expand its five borough transit network at an estimated cost of just $50 million per year—a pittance when compared to the billions of dollars required to build new tunnels and stations—by aligning fares within the five boroughs across its commuter rail, subway, and bus systems.[1] The findings of this report include:
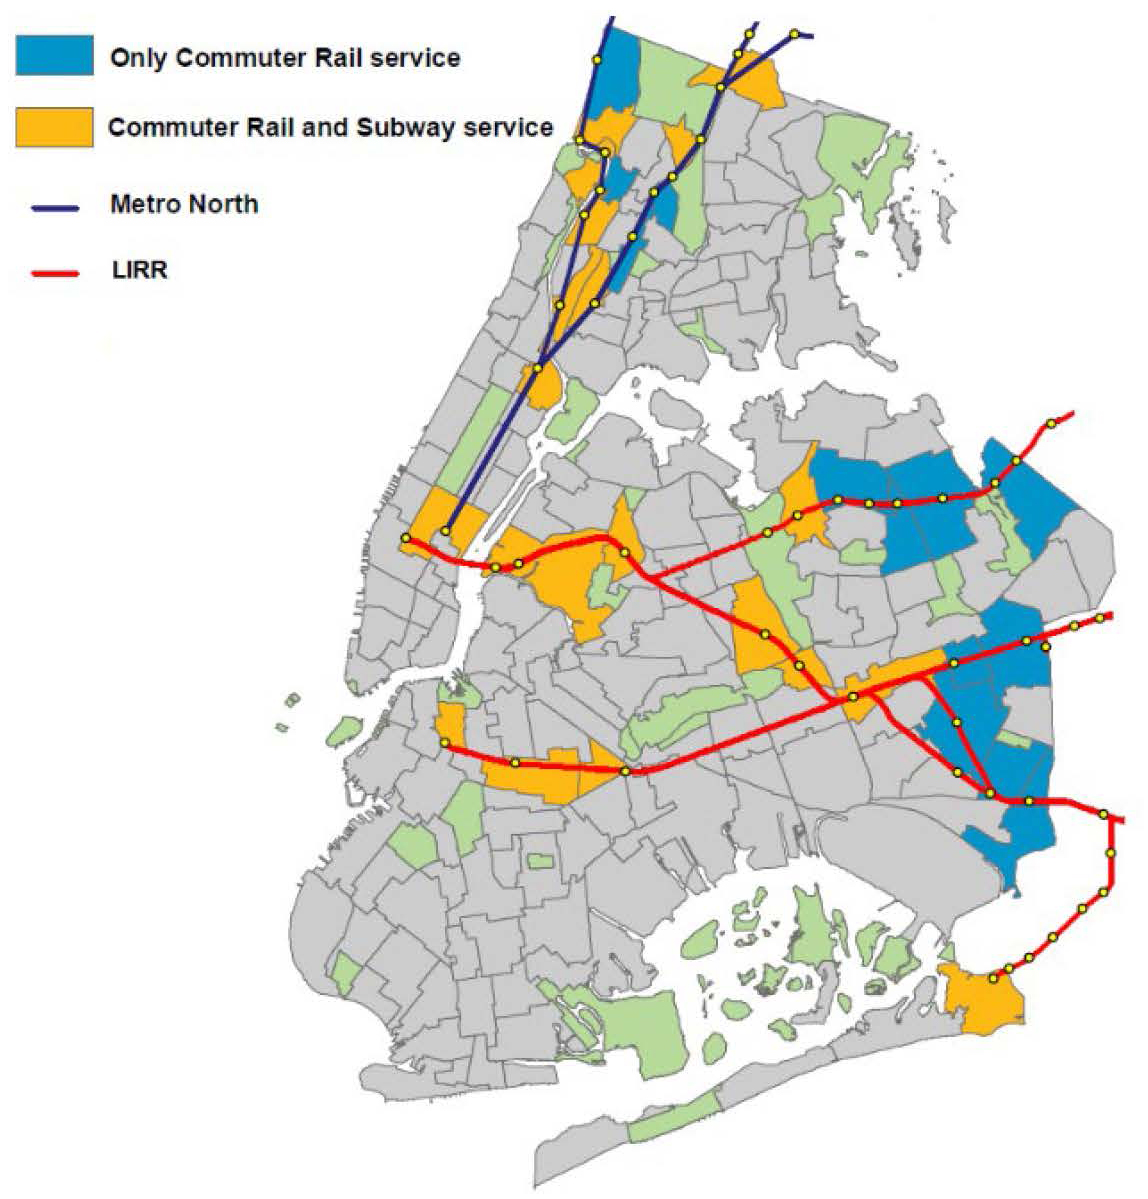
- In total, 38 Metro-North and LIRR stations serve 31 neighborhoods in the Bronx, Brooklyn, and Queens.[2] These neighborhoods are home to 327,000 jobs and 1.4 million residents—all of whom would benefit from improved mobility and a better integrated transit system.[3]
- From 2000 to 2017, the Bronx, Queens, and Brooklyn were responsible for a staggering 84 percent of the city’s net employment growth and 73 percent of its residential growth.[4] As job opportunities and the population expand in the five boroughs and commuting patterns shift, so too must the transit system.
- Of the 38 commuter rail stations outside of Manhattan, 18 are located in neighborhoods that sit beyond the reach of the subway system. In these under-served neighborhoods, 82 percent of residents are people of color and 41 percent are foreign-born—much higher than the city-wide averages of 68 percent and 37 percent, respectively.
- Unfortunately, many of these New Yorkers are all but shut out of commuter rail service because of steep fares. From the thirteen Bronx stations to Grand Central, a one-way Metro-North ticket costs $9.25 during rush hour. From Flushing, Hollis, St. Albans, or Laurelton to Penn Station, a one-way fare is an even higher $10.25—or three times more expensive than the 41-mile LIRR trip from Westhampton to Montauk.
- These fares and transfer policies deflate ridership within the five boroughs, leaving off-peak commuter trains more than half empty and peak-hour trains with significant spare capacity. The average LIRR train, for instance, has 233 empty seats during morning rush hour and 282 during the evening peak.[5]
- Yet even if New York City riders wished to access these empty seats, they cannot, as LIRR and Metro-North trains skip over local, in-city stations nearly 80 percent of the time during the morning rush, noisily bypassing most stations in the Bronx and Queens without providing passenger service.
- The result is that commuters in these areas are forced to spend hours longer getting into Manhattan via subway and bus. The LIRR to Penn Station, for instance, takes 35 minutes from Queens Village and 25 minutes from Auburndale. The same trip on the subway and local bus requires 80 minutes and 75 minutes, respectively. The Metro-North to Grand Central, meanwhile, takes 30 minutes from Riverdale and 25 minutes from Belmont. Traveling by subway and local bus consumes 90 minutes and 50 minutes, respectively.
Making these train lines more affordable and available would save hours of commuting time for thousands of New Yorkers, allowing them more time with family and friends, more time for work and leisure, and more time for rest and recovery. Indeed, locking New Yorkers behind a paywall, limiting their access to rapid transit, and underutilizing dozens of train stations throughout the five boroughs makes little sense. To extend the reach of the transit system, improve job access, and relieve overcrowding on the subway, this report recommends that the MTA do the following:
- Reduce fares for all in-city commuter rail trips and make more local stops. As the regional economy expands and commuting patterns change, it is imperative that the MTA take full advantage of its rail assets. Efforts to integrate fares and fully-leverage the commuter rail system are long overdue. Whether traveling via bus, subway, or commuter rail, all MTA trips within the city should cost $2.75 and allow free transfers. Moreover, LIRR and Metro-North trains should make more local stops in neighborhoods like St. Albans, Queens Village, Laurelhurst, Murray Hill, Spuyten Duyvil, Tremont, and Williamsbridge, so that New Yorkers can actually take advantage of this rapid rail service.
- Better connect its buses to commuter rail stations. There is no clearer evidence of the MTA’s failure to integrate its commuter lines with the rest of the city’s transit infrastructure than the bus map. In northeast Queens, for instance, while dozens of bus lines converge at the terminus of the 7 Train, several LIRR stations are multiple blocks from a single bus stop. This same pattern holds in sections of northwest Bronx and southeast Queens. As a more equitable fare policy is introduced, the MTA bus companies should provide more frequent service to these commuter rail stations.
- Make all commuter stations fully accessible. Half of the Metro-North and LIRR stations in the Bronx, Brooklyn, and Queens are not currently accessible as required by the Americans with Disabilities Act (ADA). Much like the existing paywall that surrounds commuter stations, these physical barriers to access have the effect of denying service to thousands of young families, seniors, and mobility-impaired travelers every single day. This should be rectified as soon as possible, adding new elevators, ramps, and wayfinding upgrades for the sight- and hearing-impaired.
Taking these steps, of course, will necessitate improved coordination between the MTA’s Metro-North, LIRR, and New York City Transit divisions, which for too long have operated in bureaucratic silos, squandering opportunities to better integrate service and to better serve New Yorkers. It may also demand higher frequencies on commuter rail lines to handle increased ridership—though the agency should begin by focusing on filling the spare capacity that already exists.
Fortunately, the necessary technological and infrastructure upgrades to achieve these goals are already in the pipeline. Over the next several years, East Side Access will free up commuter rail capacity at Penn Station, a third track will be laid on the LIRR’s Main Line, Positive Train Control upgrades will be complete on the Metro-North and LIRR, the MTA will roll out its modern fare-payment system, and the construction of the LaGuardia AirTrain will necessitate more frequent connections from the Port Washington Line. At the same time, new commuter rail stations will be built in Co-Op City, Morris Park, Parkchester, Hunts Point, Elmhurst, and Sunnyside. Clearly, the timing has never been better, and the capacity has never been more available, to weave together the city’s commuter rail, subway, and bus systems.
Introduction
There are 38 Metro-North and Long Island Rail Road (LIRR) stations in the Bronx, Queens, and Brooklyn. Many are located beyond the reach of the subway system, in areas of New York City commonly referred to as “transit deserts.” Yet these neighborhoods are clearly not deserted by transit infrastructure. Instead, they have been deserted by transit agencies.
While the Metropolitan Transportation Authority (MTA) was created to oversee and coordinate the activities of its subsidiary transit agencies, it has, in fact, allowed them to operate as separate fiefdoms. Nowhere is this more evident than in the fragmentation of its fare policies. Transit trips that cover an identical geographic area—New York City, for instance—can cost $2.75 using one mode (the subway or bus) and $10.25 using another (commuter rail).
Within New York City, these prohibitively expensive Metro-North and LIRR fares have been paired with prohibitively infrequent service. In Queens, Brooklyn, and the Bronx, for instance, local commuter rail stations are largely neglected, with four out of five trains loudly rumbling by, failing to open its doors to the 1.4 million residents and 327,000 jobs located in surrounding neighborhoods.
This combination of patchy service and exorbitant fares has produced a predictable outcome: severely underutilized stations. Apart from the Jamaica hub, only three stops in Queens—all sitting along the Port Washington line—serve more than 1,000 riders during the 6 a.m. to 10 a.m. morning peak. In the Bronx, not a single station does.[6]
And while these stations remain lightly used, many of the trains passing by have significant spare capacity. The average LIRR train, for instance, has 233 empty seats during morning rush hour and 282 during the evening peak.[7] The Metro-North, meanwhile, is currently more crowded, but will soon have available capacity once the installation of new safety technology (known as Positive Train Control) is complete and train cars are placed back into service.[8]
Rather than utilizing these empty seats, this rapid service, and this vast transit network, residents of Hollis, Rochdale Village, Murray Hill, Williamsbridge, Spuyten Duyvil, Claremont, East New York, and 24 other Bronx, Queens, and Brooklyn neighborhoods (see Chart 1) have been effectively locked behind a paywall. As a result, local residents are left to drive their cars on congested streets or make multiple transfers on meandering bus routes and crowded subways—adding hours to their weekly commutes.
Chart 1: New York neighborhoods served by LIRR or Metro-North commuter rail
Geography: NYC Department of City Planning, “Neighborhood Tabulation Area.” 2018.
Subway Stations: New York Transit Authority. “Static Data Feeds: General Transit Feed Specification,” MTA. 2018.
To reduce commute times, improve job access, extend the reach of the transit system, and relieve overcrowding on the subway, the MTA must take immediate action. Moving forward, any trip within New York City—whether by subway, bus, LIRR, or Metro-North—should cost $2.75 and provide free transfers.
Aligning MTA fares within the city is long-overdue and, at a cost of approximately $50 million per year, a relatively affordable strategy for expanding the five-borough transit network, eliminating vast transit deserts, and providing much needed service to the fastest growing population and job centers in the city.
At a time when the subway system is in disrepair and adding four new stations in Manhattan requires 10 years and $7 billion, new subway tunnels, tracks, and stations are clearly not the way forward. Instead, the MTA must leverage and maximize its existing assets. With 38 stations and seven commuter rail lines sitting outside of Manhattan, the choice is obvious.
How we got here: The city charges forward, MTA capital construction takes a U-Turn
The early-2000s were a period of relief, pride, and ambition for the MTA. After two decades of repairing, replacing, and overhauling tracks, trains, switches, and subway stations, the system was approaching a state of good repair. On-time performance exceeded 90 percent on 17 of the subway’s 20 lines and the “mean distance between failure”—measuring how often subway cars break down—reached its all-time peak, climbing from 7,000 miles in 1982 to 178,000 miles in 2005.[9]
For the MTA, the opportunity had finally arrived to shift focus from basic repair and maintenance to system expansion. From 1990 to 2000, New York City added 686,000 residents and 121,000 jobs. Annual ridership grew by 419 million on the subway and by 24 million on Metro-North and LIRR. Major corridors and stations were now overstrained and overcrowded.[10]
As the population grew and new employment centers emerged, the system desperately needed additional capacity and an extended reach. A series of capital budgets and projects aimed to confront these challenges head on.
The Second Avenue Subway would relieve overcrowding on the Lexington Avenue line, a corridor carrying more passengers than the entire DC Metro system. East Side Access would free-up capacity at Penn Station, the busiest railway hub in North America, by opening up Grand Central Terminal to LIRR trains. The 7 Train extension would bring subway service to Hudson Yards, giving rise to an entirely new, mixed-use neighborhood in western Manhattan.
Each of these projects had been floated for decades. Each were green lit and funded at the turn of the century.
But eighteen years and $18 billion dollars later, MTA executives and local politicians have been chastened. With major projects soaring past their budgets and timelines, it has become abundantly clear that the MTA failed to develop necessary capacity and oversight to manage a full menu of capital projects.
Phase One of the Second Avenue Extension exceeded its budget by $400 million and three years. The 7 Train extension was $500 million and two years over budget and did not deliver a promised station at 10th Avenue. Construction continues on East Side Access; fourteen years and $7 billion beyond the initial benchmark (see Chart 2).
Chart 2: Over time and Over budget
| Project | Estimated Budget | Estimated Completion Date | Actual Budget | Completion Date |
| 7 Train Extension | $1.9 billion | 2013 | $2.4 billion | 2015 |
| Second Avenue Subway – Phase I | $3.8 billion | 2013 | $4.2 billion | 2016 |
| East Side Access | $4.3 billion | 2009 | > $11 billion | ~2023 |
Geography: RPA. “Building Rail Transit Projects Better for Less,” February 2018.
Moreover, as these projects ran billions of dollars over budget, too little funding was dedicated to basic repair and replacement. As a result, twenty years of progress gave way to a decade of backsliding and a return to a “state of emergency.” Today, on-time performance exceeds 75 percent on only one subway line and the mean distance between failure has fallen to 122,000 miles—31 percent off its 2005 peak.[11]
Faced with this renewed crisis, the MTA has been forced to reorient its priorities and attention once again. As the subway system fell into disrepair and the agency’s reputation cratered, state-of-good-repair investments have become essential.
A series of task forces and emergency plans confirmed these new constraints and realities. In May 2018, New York City Transit released its sweeping Fast Forward Plan to overhaul the New York City subway system. While the plan to rapidly modernize the signal system hardly lacked in ambition, it did not include a single of mile of new track. Though East Side Access and Phase Two of the Second Avenue Subway would (slowly) move forward, the message was clear: funding and focus were now on modernizing and repairing existing infrastructure, not building anew.
As City Changes, MTA Must Adapt
While the pivot from system expansion to system maintenance is understandable, local employment and population growth continue to accelerate and show no sign of abating. As a result, while the MTA is concentrating its resources on shoring up the existing rail network, this same network is growing increasingly outmoded.
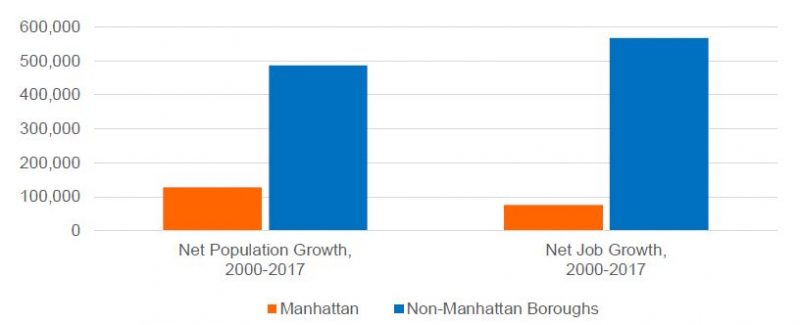
From 2000 to 2017, rail ridership continued to grow: up 346 million on the subway and 19 million on commuter rail. Over this period, the city added 614,000 residents and 643,000 jobs. Even more remarkably, 79 percent of this residential growth and 88 percent of new jobs were located outside of Manhattan (see Chart 3). New York City’s population and, more notably, its economy had grown increasingly decentralized.
Chart 3: From 2000 to 2017, Manhattan’s job growth and population growth was dwarfed by rest of the five boroughs
Jobs: New York State Department of Labor, “Quarterly Census of Employment and Wages.” 2000-2017. Population: U.S. Census Bureau, Population Estimates. 2000-2017.
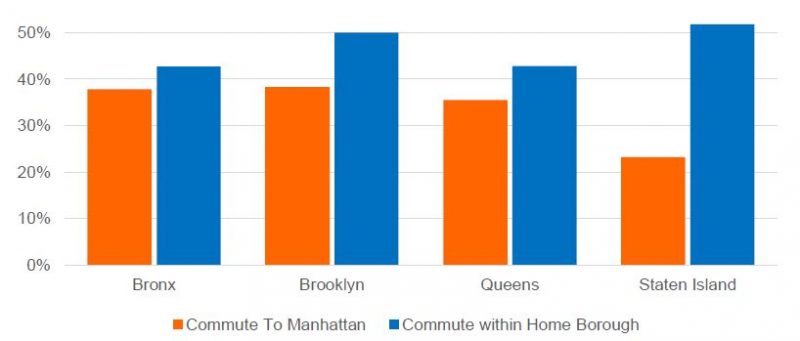
As a result of these demographic and employment shifts, 46 percent of outer borough residents now work within their home borough while only 36 percent commute to Manhattan (see Chart 4). This leaves the MTA with a stiff challenge: serving increasingly dispersed and irregular commuting patterns at a time when there is little funding and appetite for expanding the system.
Chart 4: Less than 40 percent of non-Manhattan residents work in Manhattan, while nearly 50 percent work within their home borough
United States Census Bureau. American Community Survey 2012-2016 5-Year Estimates.
To contend with these constraints, the MTA must look to existing resources and seize new opportunities in order to adapt to changing demographics. The Authority should look no further than its Metro-North and LIRR systems.
Integrating Commuter Rail
There are 13 Metro-North stations in the Bronx, 22 LIRR stations in Queens, and three in Brooklyn. Nearly half of these 38 commuter rail stations are located beyond the reach of the subway system, in 13 New York City neighborhoods commonly referred to as “transit deserts.” Home to 451,454 residents and 65,654 jobs, each of these communities—ranging from Hollis, St. Albans, and Murray Hill in Queens to Claremont, University Heights, and Spuyten Duyvil in the Bronx—stands to benefit from affordable and frequent commuter rail service.
Chart 5: Neighborhoods with Metro-North or LIRR Stations, outside of Manhattan
| No Subway | Subway | Total | |
| Number of Neighborhoods | 13 | 18 | 31 |
| Number of Stations | 18 | 20 | 38 |
| Number of Inaccessible Stations | 7 | 12 | 19 |
| Number of Local Jobs | 65,654 | 261,276 | 326,930 |
| Local Population | 451,454 | 903,654 | 1,355,108 |
Geography: NYC Department of City Planning, “Neighborhood Tabulation Area.” 2018.
Demographics: NYC DCP. “New York City Population FactFinder: Neighborhood Tabulation Area,” 2018.
Jobs: United States Census Bureau. “LEHD Origin-Destination Employment Statistics.” 2015.
Importantly, these 13 Bronx and Queens neighborhoods look very different than the rest of the five boroughs and are critically in need of improved transit access and mobility. In these under-served neighborhoods, 82 percent of residents are people of color and 41 percent are foreign-born—much higher than the city-wide averages of 68 percent and 37 percent, respectively (see Chart 6). Nearly 60 percent of the renters in these neighborhoods are “rent-burdened”—compared to 54 percent across the city—leaving them with little to spare for the exorbitant commuter rail fares.
Chart 6: Neighborhoods with Metro-North or LIRR Stations, Demographics
| Area | Neighborhoods | Commuter Rail Stations | Share Non-White |
Share Foreign Born | Unemployment Rate | Rent Burdened |
| New York City | 189 | 41 | 68% | 37% | 8.6% | 54% |
| Bronx & Queens with Commuter Rail,
but no Subway |
13 | 18 | 82% | 41% | 9.4% | 59% |
| Bronx Neighborhoods with Metro-North Stations | 11 | 13 | 87% | 39% | 12.0% | 61% |
| Queens Neighborhoods with LIRR Stations | 17 | 22 | 77% | 49% | 7.5% | 58% |
NYC DCP. “New York City Population FactFinder: Neighborhood Tabulation Area,” 2018.
Circumstances in the Bronx are even more dramatic. In the 11 neighborhoods with a Metro-North station, the unemployment rate is 12 percent and 61 percent of residents are rent-burdened. Clearly, more affordable transit and greater mobility and employment access are needed.
Beyond these critical benefits for Bronx and Queens residents, improved integration between Metro-North, LIRR, and New York City Transit would relieve overcrowding throughout the subway system. For instance, five of the six busiest subway stops in Queens— Flushing (1st), Jamaica Center (3rd), Forest Hills (4th), Kew Gardens (5th), and Sutphin-Archer (6th) subway stations—have an LIRR station within walking distance.[12]
The 7 Train, meanwhile, is overtaxed and would benefit from straphangers being diverted to the LIRR at Woodside and Flushing stations. From 2010 to 2016, ridership on the 7 Line increased by a robust 26 percent while the number of train cars supplied by the MTA dropped by 2 percent due to service cuts and delays. As a result, the average number of passengers per train car jumped from 29 to 38 (see Chart 7). Only the J/M/Z corridor experienced a bigger increase in crowding over this period.
Chart 7: Crowding on the 7 Train
| Tunnel | Subway Lines | Average Passengers per Train Car | ||
| 2010 | 2016 | Growth | ||
| Williamsburg Bridge | J, M, Z LINES | 31 | 42 | 35% |
| Steinway Street Tunnel | 7 LINE | 29 | 38 | 29% |
| Eighth Avenue (Local) | A, B, C LINES (Local) | 34 | 43 | 28% |
| Rutgers Tunnel | F LINE | 33 | 42 | 27% |
| 14th Street Tunnel | L LINE | 55 | 67 | 24% |
New York Metropolitan Transportation Council. “2016 Hub Bound Travel.”
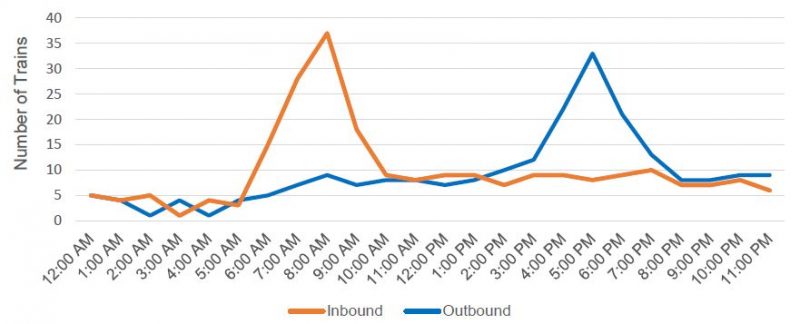
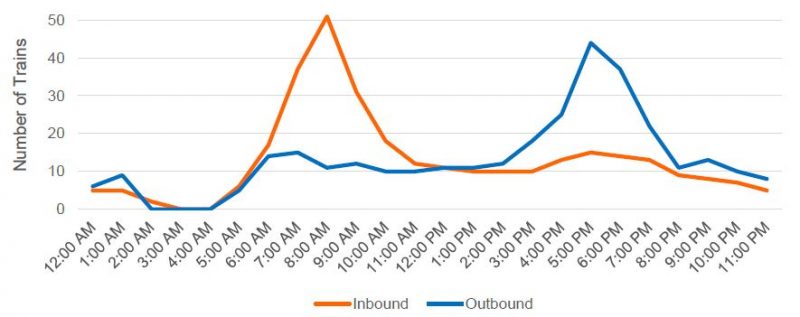
The LIRR and Metro-North, meanwhile, clearly have the capacity to relieve congested subway lines and broaden service options. While these rail lines are certainly more peak-oriented than the subway, an impressive thirty-seven LIRR trains enter Penn Station from 8 a.m. to 9 a.m. each morning (see Chart 8), including six Port Washington trains that pass Flushing Station and ride roughly parallel to the 7 Line.
Chart 8: LIRR trains entering and exiting Penn Station each hour
Long Island Rail Road. “Ridership Book,” 2017.
During the morning peak (6 a.m. to 10 a.m.), these Penn Station bound LIRR trains are typically 79 percent full and have 233 empty seats. During the evening peak (4 p.m. to 8 p.m.), the average train is only 75 percent full and has 282 available seats.[13]
Service on Metro-North, meanwhile, is even more frequent. Over 50 trains enter Grand Central from 8 a.m. to 9 a.m. each morning (see Chart 9) via three rail lines running through the Bronx. This hourly through-put surpasses most subway lines.
Chart 9: Metro-North trains entering and exiting Grand Central each hour
Metro-North Railroad. “Static Data Feeds: General Transit Feed Specification,” MTA.
Of course, not all of these Manhattan bound trains actually pick up passengers in the Bronx. Of the 15 Hudson line trains arriving in Grand Central between 8 a.m. and 9 a.m., only three make stops at Spuyten Duyvil and two at University Heights. The situation is even more egregious with the 36 peak-hour trains on the Harlem and New Haven lines, where all but two bypass passengers at the Melrose, Tremont, Williams Bridge, and Woodlawn stations (see Chart 10).
Chart 10: Metro-North trains bypassing Bronx and Manhattan stations during rush hour (8 a.m. and 9 a.m.)
| Station | Total Trains Passing Station | Trains Stopping at Station | Share of Trains that Stop |
| Melrose | 36 | 2 | 6% |
| Tremont | 36 | 2 | 6% |
| Botanical Garden | 36 | 2 | 6% |
| Williams Bridge | 36 | 2 | 6% |
| Woodlawn | 36 | 2 | 6% |
| Fordham | 36 | 4 | 11% |
| Wakefield | 16 | 2 | 13% |
| Morris Heights | 15 | 2 | 13% |
| University Heights | 15 | 2 | 13% |
| Marble Hill | 15 | 3 | 20% |
| Spuyten Duyvil | 15 | 3 | 20% |
| Riverdale | 15 | 3 | 20% |
| Yankees-E153 St. | 15 | 3 | 20% |
| Harlem-125th St. | 51 | 33 | 65% |
Metro-North Railroad. “Static Data Feeds: General Transit Feed Specification,” MTA.
The neglect of these Bronx stations can be explained, in part, by an 1848 agreement allowing trains on the New Haven line to bypass all local New York City stops. And while this 1848 agreement predates the incorporation of the Metro-North company by 135 years, it continues to be upheld by the MTA and the Connecticut Department of Transportation.
While the LIRR is not bound by any such agreement, its commuter rail lines also provide minimal service in the five boroughs. Of the six trains that pass Flushing Main Street Station—which the LIRR officially designates as a “Major Transit Hub”—from 8 a.m. to 9 a.m., only two will stop to pick-up passengers. Of the fourteen West Hempstead, Babylon, and Montauk trains that pass St. Albans during this hour, just two stop to provide passenger service. Twenty-one trains travel past Queens Village and Hollis from 8 a.m. to 9 a.m., but only one Oyster Bay and one West Hempstead train make local stops. And of the 31 trains racing past Forest Hills Station, just two offer local service.
While all of these neighborhoods cope with the burdens of loud trains rumbling by their homes, they receive little in the way of benefits. Instead, the MTA has opted to squander its vast commuter rail network within the five boroughs, denying frequent and affordable service to the residents of the Bronx, Brooklyn, and Queens.
The Transit Pay-Wall
High-quality LIRR and Metro-North service would save hours of commuting time for thousands of New Yorkers. That’s more time with family and friends. More time for work and leisure. More time for rest and recovery.
The LIRR to Penn Station, for instance, takes just 40 minutes from Rosedale and 30 minutes from Bayside. The same trip on the subway and local bus requires 90 minutes and 80 minutes, respectively. The Metro-North to Grand Central, meanwhile, takes 30 minutes from Riverdale and 25 minutes from Belmont. Traveling by subway and local bus would consume 90 minutes and 50 minutes, respectively.
Unfortunately, for many New Yorkers, this rapid commuter rail service is not within their financial means. From the thirteen Metro-North stations in the Bronx to Grand Central Station, a one-way ticket costs $9.25 during commuting hours and a monthly pass is $208. Even the $4.50 discount on off-peak fares for seniors and riders who are disabled is significantly more expensive than the subway fare and does not allow transfers between the two systems.[14]
LIRR fares in Queens, meanwhile, are a bit more complicated, with stations divided into three zones. Of the stations with direct access to Manhattan, the vast majority are in Zone 3 and pay $10.25 for a one-way trip to Penn Station during peak hours or $226 for a monthly pass.
While certain premium tickets allow for discounts and transfers, they remain far more expensive than the subway, limited in their reach, convoluted, and underutilized. The CityTicket, for instance, charges $4.25 for weekend travel within the five boroughs. It has doubled in price since its initial introduction. The Atlantic Ticket, meanwhile, charges $5 for all trips between southeast Queens and Brooklyn’s Atlantic Terminal. It offers no discount for Manhattan-bound commuters, does not provide free transfers to the subway or bus (except through its $60 weekly pass), and is not available for purchase on train cars or through the MTA’s mobile ticketing app.[15]
Even with these discounts, in-city commuter rail trips remain far costlier than local trips outside of the five boroughs. For instance, an LIRR ticket from Amityville to Babylon, from Roslyn to Oyster Bay, or from Great Neck to Port Washington costs only $3.25 during rush hour. The 41-mile trek from Westhampton to Montauk, meanwhile, is four times longer, but three times cheaper than the train from Flushing to Penn Station.[16]
These disparities are neither fair nor practical. Just as riders of the Bee-Line bus in Westchester and the NICE bus in Nassau County can freely transfer to New York City subways and buses, residents of the five boroughs should enjoy the same privileges with the local commuter rail network. Now more than ever, an expanding regional economy demands a more expansive view of how to integrate and maximize commuter rail.
Recommendations
#1: Integrate Fares and Add More Local Stops
The MTA will devote billions of dollars in the coming years to increase commuter rail capacity and extend its reach with three core projects: East Side Access to Grand Central Station, Penn Station Access from Metro-North, and a third track on the LIRR Main Line. These investments have the potential to dramatically improve the commuting experience, both outside of New York City and within the five boroughs.
To ensure these dollars are well spent and benefit all riders, the MTA must reform their unfair fare policies. This should be phased in over the next four years, in conjunction with the introduction of the city’s new fare payment system and the completion of East Side Access. The MTA should begin immediately by reducing fares for all in-city commuter rail trips and making more local stops. Over time, as infrastructure projects are completed and ridership grows, they should also increase peak, off-peak, and reverse-commute frequencies on select lines.
#2: Improve Bus Service to Commuter Rail Stations
If one is looking for a visual reminder that commuter rail and New York City Transit are poorly integrated, there is, perhaps, no clearer evidence than the bus map. In northeast Queens, for instance, while dozens of bus lines converge at the terminus of the 7 Train, several LIRR stations are multiple blocks from a single bus stop. This same pattern holds in sections of northwest Bronx and southeast Queens.
As a more equitable fare policy is introduced, LIRR and Metro-North stations in the Bronx, Queens, Brooklyn will certainly grow in use. NYCT Bus and MTA Bus should respond accordingly, routing several lines and providing frequent service to these commuter rail stations.
#3: Make all LIRR and Metro-North Stations ADA Accessible
Half of the Metro-North and LIRR stations in the Bronx, Brooklyn, and Queens are not currently ADA accessible (see Chart 11). Much like the existing paywall that surrounds commuter rail stations, these physical barriers to access have the effect of denying service to thousands of young families, seniors, and mobility-impaired travelers every single day. This should be rectified as soon as possible, adding new elevators, ramps, and wayfinding upgrades for the sight- and hearing-impaired.
Chart 11: Inaccessible Commuter Rail Stations
| Metro-North and LIRR Stations | |||
| Borough | Number of Stations | Inaccessible Stations | Share Inaccessible |
| Bronx | 13 | 7 | 54% |
| Brooklyn | 3 | 2 | 67% |
| Queens | 22 | 10 | 45% |
| Total | 38 | 19 | 50% |
MTA. “Commuter Rail Lines: LIRR and Metro-North Railroad.” http://web.mta.info/accessibility/rail.htm
Acknowledgements
Comptroller Scott M. Stringer thanks Adam Forman, Chief Policy & Data Officer and the lead author of this report. He also recognizes the important contributions made by David Saltonstall, Assistant Comptroller for Policy; Jacob Bogitsh, Policy Analyst for Economic Development; Archer Hutchinson, Web Developer and Graphic Designer; Angela Chen, Senior Web Developer and Graphic Designer; Ilana Maier, Press Secretary; and Tian Weinberg, Press Officer.
Endnotes
[1] The $50 million estimate is drawn from a 2015 report by the Regional Plan Association and a follow-up conversation. It considers a) the reduction in revenue from existing city riders of LIRR and Metro-North, b) revenue gains from new riders, and c) shifts in revenue as some riders move from the subway and bus to commuter rail trips.
RPA. “Overlooked Boroughs: Where New York City’s Transit Falls Short and How to Fix It,” February 2015.
[2] For this report, “neighborhoods” are delineated by the Department of City Planning’s 189 “Neighborhood Tabulation Areas.”
[3] Jobs: United States Census Bureau. “LEHD Origin-Destination Employment Statistics.” 2015.
Population: NYC DCP. “New York City Population FactFinder: Neighborhood Tabulation Area,” 2018.
[4] Jobs: New York State Department of Labor, “Quarterly Census of Employment and Wages.” 2000-2017.
Population: U.S. Census Bureau, Population Estimates. 2000-2017.
[5] Long Island Rail Road. “Ridership Book,” 2017.
[6] The Metro-North and LIRR do not track station ridership, but have hired consultants to provide origin-destination surveys on occasion. While the last LIRR analysis was conducted in 2016, Metro-North has not completed one since 2008. Though Bronx ridership has grown since that time, we rely on those 2008 numbers here.
Abt SRBI. “2012-2014 LIRR Origin and Destination Report,” August 23, 2016.
Resource Systems Group, Inc. “2007 MTA/Metro-North Railroad Origin-Destination Survey,” October 24, 2008.
[7] Long Island Rail Road. “Ridership Book,” 2017.
And while Metro-North trains are more crowded, this is largely due to regularly scheduled train cars being pulled out of service so that new safety technology (Positive Train Car) can be installed. This work will soon be complete, allowing Metro-North to run at full capacity and with open seats.
[8] Zambito, Thomas. “Why are Metro-North trains packed? It’s complicated, but let us explain,” Poughkeepsie Journal. September 28, 2018.
[9] Fitzsimmons, Emma. “Every New York City Subway Line Is Getting Worse. Here’s Why,” New York Times. June 28, 2017.
DiNapoli, Thomas P. “Metropolitan Transportation Authority: An Overview of Capital Needs,” Office of the New York State Comptroller. July 2014.
[10] NYS DOT, “Transit Program Funding.” https://www.dot.ny.gov/divisions/policy-and-strategy/public-trans-respository/lirr_0.pdf
Metro-North, “Ridership Report Appendix,” 2017.
Moss, Mitchell, et al. “Subway Ridership 1975-2015,” March 2017.
[11] New York City Transit. “Committee Meeting,” September 2018.
[12] MTA, “Annual Subway Ridership,” 2017.
[13] Long Island Rail Road. “Ridership Book,” 2017.
[14] Metro-North, “Hudson and Harlem Line Fares.”
[15] Barone, Vincent. “LIRR’s Atlantic Ticket to slash prices for 10 Brooklyn and Queens Stations,” AM New York. May 23, 2018.
[16] In the past, the MTA has likened its commuter rail fare policy to a “taxi meter,” with a fixed charge for each trip and an additional charge depending on distance. Yet given how many LIRR and Metro-North trips outside of New York City travel a farther distance for a lower fare, this is clearly not the case.
According to MTA Spokesman Aaron Donovan: Commuter rail fares are “set up much like a taxi meter…. The fixed portion of the fare recognizes that travelers derive a certain value from getting from Point A to Point B, regardless of how far [they’re] traveling, and for the railroads, a large portion of our costs are fixed regardless of how far the trains travel (for example the length of the trains, the crews, etc.)…. The variable portion of the fare recognizes that a portion of our costs are higher for longer trips (wear-and-tear on equipment, maintenance of greater lengths of track, greater fuel usage, etc.).”
Evelly, Jeanmarie. “City Residents Riding Commuter Rail Pay More Per Mile than Suburbanites,” City Limits. June 4, 2018.