
Introduction
The New York State Real Property Tax Law (RPTL §581) requires that:
“Real property owned or leased by a cooperative corporation or on a condominium basis shall be assessed […] at a sum not exceeding the assessment which would be placed upon such parcel were the parcel not owned or leased by a cooperative corporation or on a condominium basis.”
In practice this means that cooperatives and condominiums in New York City are assessed as if they were rental buildings, hypothetically. To this end, the New York City Department of Finance (DOF) selects “comparable rentals” for cooperatives and condominiums with more than 10 units within Class 2, from which their DOF market values are derived.
In this fiscal note we answer three questions:
- What is a comparable rental? It is a rental building that is matched based on location, age, and other parameters to a cooperative or condominium. The DOF market value assigned to the rental building informs the DOF market value of the cooperative or condominium it is matched to. The analysis shows that:
- The minority of rental apartments in buildings with six or more units is market rate, which limits DOF’s flexibility in the matching stage and lowers valuations in the aggregate.
- In the data published by DOF, there are more cooperatives and condominiums than comparable rental buildings. Therefore, the same comparable can be used in multiple matches.
- What do the DOF data on comparable rentals show? The matching and valuation formulas are part of the Computer Assisted Mass Appraisal (CAMA) software contracted by DOF and, as such, “proprietary”.[1] Assessors have discretion to select alternative matches, to override the CAMA matches altogether, and to choose values outside of the range of the selected set of matches. For these reasons, we could only perform a descriptive analysis, with the following takeaways:
- Relative to the average DOF market value of each comparable rental, DOF tends to overvalue low-value cooperatives and condominiums and undervalue high-value ones.
- More than one quarter of cooperatives and condominiums is assigned a value outside of the range of their comparable rentals.
- Cooperatives and condominiums in Manhattan South of 96th Street (“Manhattan core”) tend to have a higher DOF market value than those in the rest of the City. However, properties in the Manhattan core that surround Central Park, which command some of the highest transaction prices, are on average not found at the top of the DOF market value distribution.
- How does DOF market value compare to actual sale prices? Valuing cooperatives and condominiums as hypothetical rental buildings (as mandated by State law) results in discrepancies with actual sale prices. However, valuations need not be regressive if comparable buildings exist. Our analysis shows that:
- DOF captures only a fraction of sale prices and that the fraction decreases as sale prices increase. In other words, DOF valuations are regressive. These results confirm previous analysis from the Independent Budget Office (2006) Twenty-Five Years After S7000A: How Property Tax Burdens Have Shifted in New York City, and the NYC Advisory Commission on Property Tax Reform (2020) Preliminary Report and (2021) Final Report.
- Even if DOF could perfectly match the highest-valued comparable rentals to the highest-priced cooperatives and condominiums, regressivity could be alleviated but not eliminated. That is, the constraint imposed by RPTL §581 are intrinsically regressive.
DOF’s Market Values and Comparable Rentals
DOF uses comparable rentals to value cooperatives and condominiums with more than 10 units. In turn, the value of rental buildings with more than 10 units, is determined based on self-reported Real Income and Expense (RPIE) statements, which are required on rental properties with an assessed value of more than $40,000.[2]
Using 2021 Housing and Vacancy Survey data, Table 1 breaks down occupied rental units by building type and type of housing. Only rental buildings with six or more units could potentially be comparable to cooperatives and condominiums with more than ten units. These buildings contained 1.3 million occupied rental units (60.3% of the total). Within these buildings, 1.0 million units (79.6%) were rent-stabilized, controlled, owned by the NYC Housing Authority, or subject to other types of regulations. This lowers the income produced both currently and prospectively relative to market-rate units, therefore affecting DOF’s valuations.[3]
Table 1. Occupied Rental Units in 2021 (Thousands)
| Building Type | Market-rate | Not Market-rate | Total |
| Cooperatives, Condominiums, and others up to 5 units | 701.7 | 161.1 | 862.8 |
| 6+ Units | 267.1 | 1,041.1 | 1,308.2 |
| Total | 968.9 | 1,202.2 | 2,171.0 |
Source: 2021 NYC Housing and Vacancy Survey.
The comparable rental data used by DOF to value cooperatives and condominiums shows that in FY 2024 DOF assessed 7,368 cooperatives and condominiums (568,751 units) using 5,623 unique rental buildings (361,578 units).[4] Out of the unique comparable rental buildings, 53.2% had at least one stabilized or regulated unit and the total number of units in these buildings was 199,580 (we will refer to these buildings as “rent-regulated”).[5] Based on these statistics, it appears that DOF is already oversampling market-rate rental units.
Each cooperative and condominium is assigned up to three comparable rentals, with the implication that the same rental building can be used in several valuations. In addition, when used multiple times, the same comparable rental can be assigned different incomes and market values. The formulas used to assign values to comparable rentals and to assess cooperatives and condominiums are not shared by DOF because they are “proprietary” to the vendor of DOF’s Computer Assisted Mass Appraisal (CAMA) software.[6] Lacking an opportunity to assess whether DOF’s matching and valuation algorithms can be improved, the analysis that follows is mainly descriptive.
In Chart 1 we show the DOF market value per square foot (psf) for each cooperative and condominium against the average DOF market value psf of their comparable rentals. If a dollar of comparable rentals’ DOF value was, on average, reflected in the valuation of cooperatives and condominiums, observations should fluctuate around a 45-degree line. The fitted values from a locally weighted regression show that this is true in the middle of the distribution, roughly between $100 and $275 in DOF market value for the comparable rentals (58.9% of the cooperatives and condominiums is included in this range). Cooperatives and condominiums are on average valued above their comparable rentals at the bottom of the distribution (27.0% have comparable rentals with DOF value below $100 psf). Conversely, DOF market values for cooperatives and condominiums are on average below their comparable rentals when the latter exceed $275 psf (14.1% of the sample is in this portion of the distribution).
Chart 1. Coop/Condo DOF Market Values Against the Average of DOF’s Comparable Rentals Values
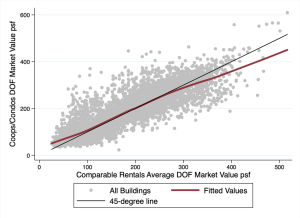
Source: NYC DOF, Office of the NYC Comptroller. The y-axis reports DOF market value psf for each cooperative and condominium. The x-axis reports the average DOF market value psf of the comparable rentals for each unique cooperative and condominium. Fitted values are derived from a locally weighted regression.
Chart 1 shows that there is dispersion around the fitted values. Chart 2 adds fitted values for the minimum and maximum value of the comparable rentals to show that DOF market value of cooperatives and condominiums often exceeds their comparable rentals’ ranges. Qualitatively, this result echoes findings of a NYC Comptroller audit published in 2012. The State Comptroller also found in a 2017 audit that assessors have discretion to select among alternative comparable buildings and to override CAMA altogether. In the FY 2024 sample, 15.9% of cooperatives and condominiums are valued more than 5% above the maximum of their comparable rentals, while 11.8% are valued less than 5% below the minimum. That is, more than a quarter of cooperatives and condominiums are valued beyond the range of their comparable rentals.
Chart 2. Coop/Condo DOF Market Values Against the Range of DOF’s Comparable Rentals Values
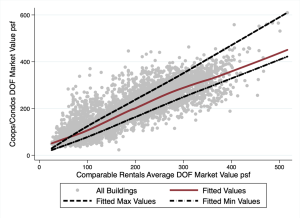
Source: NYC DOF, Office of the NYC Comptroller. See the notes for Chart 1. The fitted values for the average maximum and minimum DOF values are locally weighted regressions.
Chart 3 shows that the cooperatives and condominiums in the Manhattan core (defined generally as Manhattan south of 96th Street) tend to be assigned higher-valued comparable rentals and, as a result, have higher DOF market values. The average DOF market value in the Manhattan core was $265 psf versus $124 psf in the rest of NYC (the means are statistically different from each other).
Chart 3. Coop/Condo DOF Market Values Against Comparable Rentals: Manhattan Core vs. the Rest of NYC
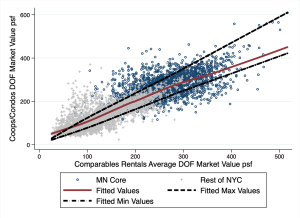
Source: NYC DOF, Office of the NYC Comptroller. See the notes for Charts 1-2. Manhattan core (generally south of 96th Street) was derived from 2020 Neighborhood Tabulation Areas (NTAs) from NYC Department of City Planning. The northernmost NTAs are MN0702 on the West Side, and MN0802 and MN0803 on the East Side.
Chart 4 focuses on properties within the Manhattan core. The cooperatives and condominiums surrounding Central Park should be among the highest-valued in the sample but their average DOF market value is statistically indistinguishable from the rest of the Manhattan core. Intuition would suggest that the properties surrounding Central Park should have a higher valuation but, given the lack of data available to us, it is not possible to ascertain whether the matching and discretionary adjustments could yield a different distribution. To illustrate this point we selected a subset of properties in the so-called billionaire’s row: 220 Central Park South and One57 (two condominiums). While both properties are at or above the fitted maximum value of comparable rentals, the two condominiums at One57 have DOF market value of $552 and $560 psf, while 220 Central Park South has DOF value of $404 psf. As seen in the following section, this is a small fraction of the transaction value of these properties.
Chart 4. Coop/Condo DOF Market Values Against Comparable Rentals Within Manhattan
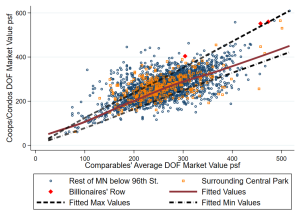
Source: NYC DOF, Office of the NYC Comptroller. See the notes for Charts 1-3. Properties surrounding Central Park were derived from 2020 Census tracts within the boundary of the Manhattan core.
Valuation Based on Comparable Rentals is Inherently Regressive
At the heart of the valuation problem is not as much the matching and valuation methodology, as the legal requirement to value cooperatives and condominiums per RPTL §581 as if they were hypothetical rental buildings. To illustrate with an example, the absolute maximum comparable rental DOF market value psf in the FY 2024 sample was $705. On the other hand, units within 220 Central Park South recently transacted for more than $10,000 psf (vs. DOF FY 2024 valuation of $404).
In New York City, there are sufficient transactions to move to a valuation based on actual sale prices. We derived simple sales-based estimates of market value for cooperatives and condominiums based on the median price psf within the same building using transactions from 2014 to 2023, adjusted for inflation. If transactions were not available within a building, we used the median price psf of larger geographies in the following order: neighborhood tabulation area, community district, and borough.[7]
The median ratio between DOF’s market values and the sales-based market values from our methodology is 20.6%: one fifth of the true market value of cooperatives and condominiums is captured by DOF’s market values. Chart 5 shows that the ratio of DOF to sales-based market value declines as sales-based market value increases, confirming the regressivity of DOF valuations.[8] Relying on median sale prices in our methodology compresses the distribution of market values but the main takeaways are generally consistent with those included in the NYC Advisory Commission on Property Tax Reform final report for FY 2019 and FY 2021 (see tables 4 to 7).
Chart 5. DOF- to Sales-Based Market Value Ratios
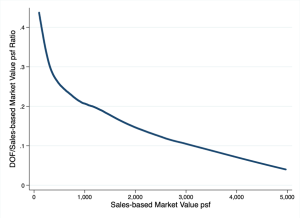
Source: NYC DOF, Office of the NYC Comptroller. See the notes for Charts 1-3.
Because DOF’s methodology is not published, it is not possible to understand to what extent a different matching could flatten the curve in Chart 5. In Table 2 we report the median, top 10%, top 5%, and top 1% of sales-based values and the corresponding comparable rentals’ DOF market values. The third row simply says that the DOF values of cooperatives and condominiums is low relative to their sale price because the value of their comparable rentals is low. The table also reports DOF average values for not rent-regulated comparable rentals assuming, hypothetically, that DOF could match the highest-valued comparable rentals with the highest-valued cooperatives and condominiums. The last row in the table shows that even if this were the case, regressivity could be alleviated but not eliminated.
Table 2. Market Value psf Comparison
| Market Value psf | Median | Top 10% | Top 5% | Top 1% |
| 1) Sales-Based: Cooperatives and Condominiums | $803 | $1,677 | $2,029 | $2,737 |
| 2) DOF: Comparable Rentals Corresponding to Coop/Condo Sales-Based Percentiles | $191 | $259 | $287 | $295 |
| 3) Ratio of 2) to 1) | 0.24 | 0.15 | 0.14 | 0.11 |
| 4) DOF: All Not Rent-regulated Comparable Rentals | $210 | $343 | $383 | $458 |
| 5) Ratio of 4) to 1) | 0.26 | 0.20 | 0.19 | 0.17 |
Source: NYC DOF, Office of the NYC Comptroller. DOF market value for comparable rentals corresponding to sales-based percentile are averages for 5% windows around the sales-based point value. The DOF market values by rent regulated status are derived from the distribution of average valuation by comparable rental (because the same building can be used in more than one comparison).
Conclusions
State law dictates that cooperatives and condominiums be valued as if they produced the income of a rental building. At a conceptual level, this means that rental buildings need to be matched to cooperatives and condominiums to provide the basis for their valuation. Due to lack of available data on the inputs and outcomes of the valuation procedures, as well as on discretionary adjustments made by assessors, it is not possible to evaluate the appropriateness of the comparable rentals.
Regardless of DOF’s methodology, the requirement imposed by State law is a significant constraint. On the one hand, the vast majority of occupied rental units in buildings with six units or more is not market-rate. On the other, it is unclear that proper comparable rental buildings exist for the highest-valued cooperatives and condominiums. This implies that the valuation framework set by State law is inherently regressive and that a better matching could alleviate but not eliminate its distortions.
Acknowledgements
This fiscal note was prepared by Francesco Brindisi, Executive Deputy Comptroller for Budget and Finance, and Yaw Owusu-Ansah, Director of Tax Policy and Revenue Analysis. Archer Hutchinson, Creative Director, led the design.
[1] See the transcript of the testimony given by the DOF Commissioner at the City Council Finance Committee oversight hearing on the recommendations from the Advisory Commission on Property Tax Reform held on 11/15/2022 (p. 80). A review of the contractual terms confirmed the existence of stringent disclosure limitations.
[2] Information about the RPIEs can be found here.
[3] The 2023 HVS micro data are not yet available. The summary published by the Department of Preservation and Development notes that fewer cooperatives and condominiums rental units were classified as rent-stabilized in the 2023 survey, even if registered as such with the NYS Department of Homes and Community Renewal. Therefore, the 2023 survey likely portrays a similar picture as Table 1 for buildings with six or more units.
[4] Cooperatives and rentals are identified by their borough, block, and lot numbers. Condominiums are identified by their borough, block, billing lot, and condominium number (if there is more than one within a billing lot). Individual condominium units are included within the unique condominium number. DOF market value is an estimate per square foot for the entire condominium number. Each individual unit’s DOF market value is the estimate of value per square foot multiplied by the unit’s square footage. The count of residential units within cooperatives and condominiums is biased downward by the tendency of condops and conrentals to report only one unit.
[5] Our office does not have access to more specific information on the number of units subject to stabilization or otherwise regulated within each building.
[6] See footnote 1.
[7] In addition, we applied the following rules: 1) include building classes R1, R2, R4, and R8 for condominiums and C6, C8, D0, D4, and R9 for cooperatives; 2) exclude properties with taxable billable assessed value equal to zero; 3) exclude properties with less than 11 units and easements. The methodology should not be interpreted as a proposal for an assessment procedure.
[8] To test for assessment regressivity, we calculated a Price-Related Differentials (PRD) of 1.13 for cooperatives and 1.12 for condominiums (a value above one indicates regressivity). This is outside the upper bound of 1.03 recommended by the International Association of Assessing Officers.