
Executive Summary
New York City invests billions of dollars each year in capital projects that maintain, modernize, and expand the infrastructure that millions of New Yorkers rely on every day. These investments keep roads, bridges, sidewalks, and sewers functioning; ensure children can learn in safe and comfortable schools; and sustain the parks, cultural spaces, and civic amenities that make the City livable. Since 2022, the City has ramped up its capital commitments to build affordable housing, create resilient communities that can withstand worsening storms from climate change, move inmates out of Riker’s Island jails into more compassionate facilities across the boroughs, and comply with the State mandate to build more classroom space to reduce class size. Yet the City’s ability to deliver these benefits is consistently undermined by cost and schedule overruns.
Since 2022, capital commitments and liquidations have had compounding annual growth rates of 13.9 percent and 16.6 percent respectively. This has increased debt, placing greater strain on the City’s expense budget, and reflects escalating construction costs as the City seeks to do more through its capital program. Haphazard planning, weak project management, ballooning costs, poor coordination between agencies, and a lack of transparency has meant that most projects take too long, cost too much, and deliver too little.[1] In short, New Yorkers are getting less for more.
Comptroller Brad Lander and this Office have long championed the reforms needed to address these challenges, from alternative project delivery models like design-build to the reforms needed to keep our infrastructure in a state of good repair and control costs in the long-term.[2] Local Law 37 of 2020, sponsored and spearheaded by Brad Lander while in City Council, sought to improve the City’s capital projects management by mandating a centralized, public, and interactive capital projects dashboard to ensure real-time access to accurate and consistent project information.3 The intent of the Capital Projects Dashboard was twofold: first, to increase public transparency around the status of the City’s capital projects, and second, equally if not more important, to provide a management tool that helps the City keep projects on budget and on schedule. With reliable capital data, the City could see which projects are over budget or delayed, understand the reasons, intervene more quickly, and identify where systemic reforms are needed.
Unfortunately, the City’s Capital Projects Dashboard has not delivered even the basic transparency it promised—let alone served as the management tool the law envisioned. Many fundamental questions about capital projects remain unanswerable using City-provided data. The Capital Projects Dashboard is woefully incomplete, while the Capital Commitment Plan (CCP) and Ten-Year Capital Strategy (TYCS) documents continue to be released as incompressible, nearly two-thousand-page, multi-volume PDFs with arcane labels and a byzantine layout.
This Fiscal Note examines the extent of the data currently available, identifies key limitations, and provides recommendations for the incoming Mayoral administration on the data’s structure and policy changes needed to enable comprehensive, accessible, and actionable reporting. This robust analysis of capital data and documents found that:
- The Capital Projects Dashboard has limited financial data: just 46.8 percent of Financial Management System (FMS) IDs and 58.1 percent of planned commitments in each CCP are contained in the latest Capital Projects Dashboard.
- Capital financial data maintained in the City’s internal financial management system (FMS) do not provide information on project schedules or reasons for project delays and cost overruns.
- The unique identifier used by FMS, referred to in this report as “FMS ID,” is used inconsistently. Sometimes FMS IDs represent a discrete project, while at other times a single ID is used to reflect an entire agency’s capital plan. In other instances, the IDs represent “holding codes.” These “store” planned capital commitments for larger Citywide initiatives and are later drawn down in other, more specific FMS IDs. FMS does not link the holding code to the code in which planned commitments are later spent.
- The City’s project management and financial systems are not linked. The City has tried numerous times to build a holistic capital project database by linking the two, with the most recent being the Capital Projects Dashboard. The resulting data products are not useful for project management, financial management, or transparency.
To make the Capital Projects Dashboard a reliable source of data and useful management tool, this Office has the following recommendations:
- Fully build out agency-level capital project data. Require agencies to create complete, linked, and detailed project management records in FMS and project management systems, including full scope, schedule, location, lifecycle category, reasons for delays and overruns, and triannual status updates.
- Include all capital projects in the Capital Projects Dashboard. Ensure the Dashboard contains every FMS ID and its full data – including planned and actual commitments – and incorporate School Construction Authority projects.
- Standardize FMS ID naming and other data rules in FMS. Establish clear, consistent rules for FMS IDs, including indicators for holding codes and multi-agency projects, removal of embedded fiscal years, and links between holding codes and project-level IDs.
- Add additional variables to FMS data to improve monitoring. Add detailed funding-source information and ensure smaller agencies’ projects are properly represented to support comprehensive monitoring and oversight.
- Recommendations to be implemented in future phases. Integrate contract, asset management, financial, and project management data to transform the Dashboard into a comprehensive tool for evaluating project and agency performance.
As the City braces for a bumpy road ahead with shrinking federal support, strengthening the efficiency of our capital program is even more critical. The Federal government has reduced appropriations through the One Big Beautiful Bill Act, passed in 2025, and the Trump Administration has withheld taxpayer dollars appropriated by Congress for critical infrastructure projects in and around the City.[3] In this environment, the City must do everything possible to stretch limited resources, starting with accurate, timely, and detailed data on individual capital projects and the capital program as a whole.
What is the Capital Budget?
The City develops several interrelated documents as part of its capital budgeting and planning process. The Capital Budget is released three times a year along with the City’s updates to the City’s Expense Budget and Financial Plan. The Capital Budget outlines the maximum capital appropriations that can be spent by budget line in the upcoming fiscal year and projects capital appropriations for the following three years. The City Council adopts the Capital Budget along with the City’s Expense Budget and Financial Plan by July 1. This document serves less as a planning document and more as a notification to sponsor agencies on the maximum they can spend in a fiscal year on capital projects.
In addition to the Capital Budget, the Mayor’s Office of Management and Budget (OMB) releases updates of its Capital Commitment Plan (CCP) three times a year. The first is a four-year plan, typically released in September, that must be published within 90 days of the adoption of the Capital Budget. This is followed by a five-year plan released concurrently with the Preliminary Expense Budget, typically in January, and then another five-year plan in May alongside the Executive Budget. The CCP includes planned commitments for the fiscal years that are in the associated Financial Plan.
The CCP, in many ways, is a more critical capital planning document than the Capital Budget. It provides a planned schedule for when financial commitments (which start being incurred after a contract is registered with the Comptroller’s Office) will occur, by project (FMS ID), and in what amount over the subsequent four to five fiscal years. This data is more granular than that contained in the Capital Budget as FMS IDs roll up to budget lines in the Capital Budget. While the commitment plan contains projected month and year of commitments, it is generally only somewhat useful for projecting the fiscal year of the commitment.
Since OMB and City agencies plan for more capital commitments in the CCP than they can take on, the CCP includes a “reserve for unattained capital commitments” that reduces fiscal year planned commitments to a level that is more realistic. The reserve is calculated as a bottom line lump sum, so this adjustment is not reflected when drilling down to individual projects and agencies in the CCP. [4]
In odd fiscal years, the City also releases a Preliminary Ten Year Capital Strategy (TYCS) alongside the Preliminary Capital Budget and Preliminary CCP in January. A final TYCS is later released alongside the Executive Capital Budget and Executive CCP in April/May of the same year as the preliminary TYCS. The TYCS is intended to serve as a longer-range planning document than the four- to five-year CCPs. The TYCS outlines the schedule of planned commitments across a 10-year period, the City’s goals, key investments, and plan for financing those investments.[5] It also helpfully links each project to broad agency-specific capital initiatives. For instance, the New York Police Department (NYPD) uses the categories Vehicles, Police Facilities, Computer Equipment, etc. to group their projects. The TYCS also denotes whether a project is to fix or replace an existing asset or build a new asset that expands City infrastructure (such as a new park or school).
The City’s internal Financial Management System (FMS) captures TYCS and CCP information from the plan or strategy’s starting fiscal year to ten fiscal years from that date. FMS also includes actual capital spending in the form of commitments and liquidations (when money is drawn down from the contract). Independent monitors of the City’s budget use this information to regularly evaluate the City’s capital program.
For more detailed information on the Capital Budget process, consult this IBO guide.
What Capital Data Is Available to the Public?
OMB releases the TYCS and the CCP to the public as large and difficult-to-parse PDFs. The CCP is published on OMB’s website as an almost two-thousand-page, multi-volume, PDF with arcane labels and a confusing layout. Most pages have an identical layout to Figure 1, which is an annotated screenshot of page 1003 (contained in Volume 3) of the FY 2026 Adopted CCP; the Comptroller’s Office added the annotations. Each line below the final group of headers in Figure 1 represents a planned commitment for an FMS ID on a specific date. Many FMS IDs, like the one framed in purple, have planned commitments for multiple dates. This document does not contain data on actual commitments or liquidations by FMS ID.
Figure 1: Annotated Screenshot of FY 2026 Adopted CCP PDF
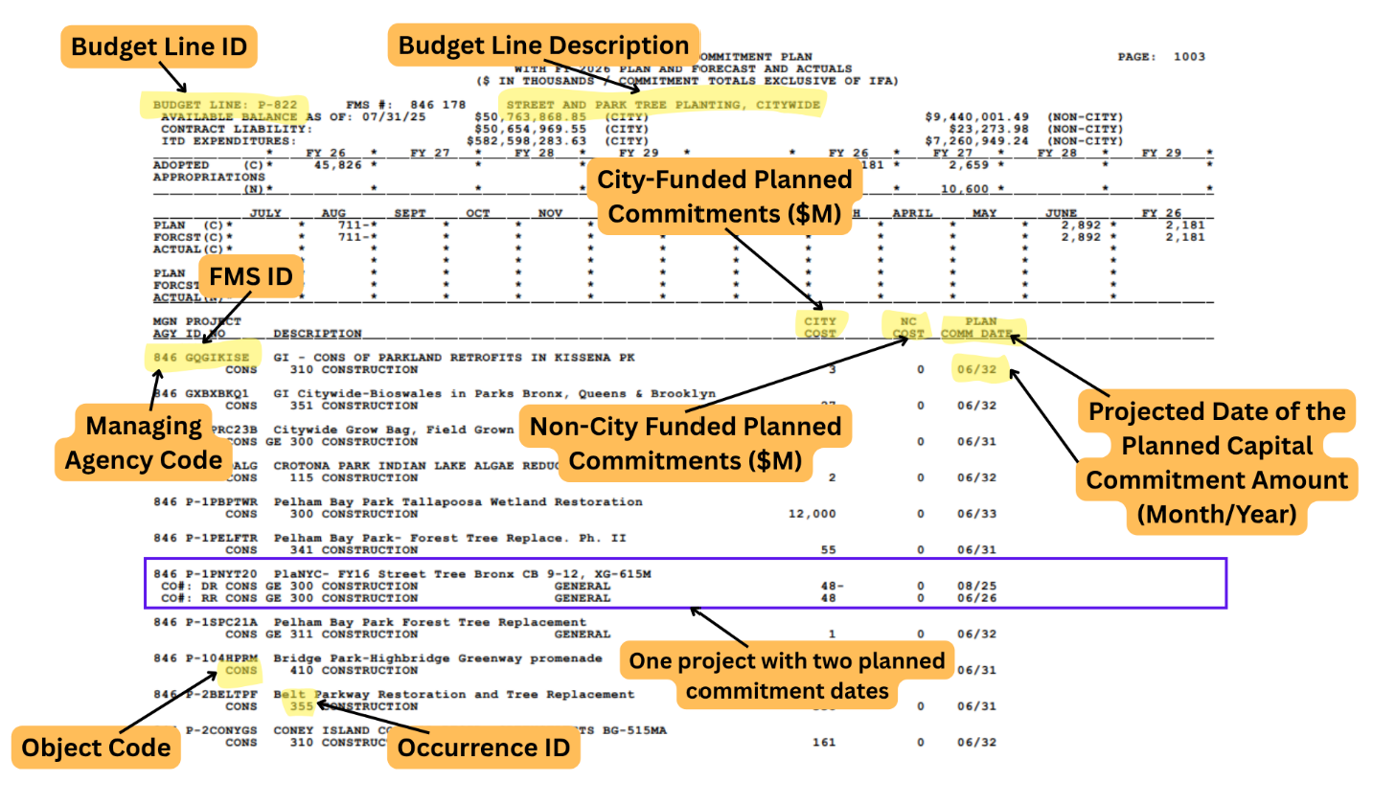
Source: Mayor’s Office of Management and Budget, FY 2026 September CCP, Volume 3
The TYCS and the CCP do not provide information on project schedule or reasons for project delays and cost overruns (neither does FMS, however this is not available to the public). The information these financial sources do provide on project scope and location is limited because agencies maintain separate project management systems. In addition, none of these data sources are tied to the City’s assessment of capital needs, which is kept in a separate internal system called the Asset Information Management System, or AIMS, that the Comptroller’s Office also found to be inaccurate and incomplete.[6]
The City has attempted to merge financial and project management data with limited success. The City previously merged components of financial and project management data in the Capital Project Detail Data (CPDD) report, which was last released on March 18, 2024.[7] An Office of the State Comptroller (OSC) analysis of the October 2023 CPDD found that it was missing approximately 50 percent of total planned commitments due to the exclusion of all School Construction Authority (SCA) projects, City-funded Metropolitan Transportation Authority (MTA) projects, as well as all projects funding equipment purchases or housing loans.[8] Even when data on projects is included, OSC found details on delays and cost overruns to be limited.
The City now releases comparable data via the Capital Projects Dashboard that arose from Local Law 37 of 2020.[9] The Comptroller’s Office analysis of the data in the Capital Projects Dashboard below finds that the data continues to suffer from limitations similar to the CPDD.
Limitations of the Capital Projects Dashboard
The Comptroller’s Office was hopeful that the Capital Projects Dashboard, released on November 1, 2023,[10] would provide the City with a tool to better manage its capital program, and the public with useful, accurate, and timely information. Unfortunately, this Office was quickly disappointed. While some projects in the Dashboard contain information about project name and description, how the schedule of commitments has changed over time, the total amount budgeted and spent, a project’s timeline by phase, and a project’s community district location, the gaps were profound. Searches of capital projects in the Dashboard consistently turned up blank.
Therefore, the Comptroller’s Office sought to understand exactly how much data the Capital Projects Dashboard was missing and whether certain agencies had larger information gaps. To do so, this Office compared Capital Projects Dashboard data to FMS data and found that only 46.8 percent of FMS IDs and 58.1 percent of planned commitments in each CCP were included in the Dashboard over the four-or-five-year plan period.
As the report details in the subsection immediately following, many of the information gaps are attributable to FMS’ limitations. Other gaps arise from the fact that project management data maintained by agencies and financial data in FMS are not appropriately linked.
The Dashboard is Limited by Quality of FMS Data
The City tracks spending and builds its budgets through FMS. It is an extensive, internal database of the City’s financial data that can be queried by users. Data is split across two systems: FMS 2 and FMS 3. FMS 3 is the official system of record for how NYC appropriates, modifies, obligates, and pays out public funds, while FMS 2 is the budget system through which agencies enter budget modifications, plan updates, and other Charter-required budget actions. This report uses the acronym “FMS” to describe just the capital portion of FMS 2.
FMS data is one of the two key inputs into the Capital Projects Dashboard, with the other being project management data direct from agencies. FMS is the authoritative source of financial information from the City. That said, data within FMS lacks consistency in nomenclature and granularity, which limits the usefulness of the Capital Projects Dashboard and the ability for FMS users to analyze capital data.
FMS IDs are named in a variety of inconsistent ways, making it difficult for users to understand the City’s capital program at the level of a discrete project. For instance, some FMS IDs, like CLOUDBRST, are used as holding codes. This is so planned commitments can be registered in FMS before they are moved to a more specific code, against which actual commitments and liquidations are incurred. These IDs tend to represent larger capital programs that fund similar projects throughout the City. Sometimes FMS IDs reflect City-funded grant or loan programs by fiscal year, such as the Department of Housing Preservation and Development’s (HPD) Affordable Neighborhood Cooperative Program (ANCP), which is divided into ANCP20, ANCP21, ANCP22, ANCP23, and so on. This is common for HPD as it has many grant and loan programs that distribute funds to private developers.
Other FMS IDs represent vast lump sum amounts the City gives to its own agencies as well as non-city agencies without providing any detail on the specific projects the lump sum funds. As an example, the vast majority of the SCA capital budget is represented as a single multi-billion-dollar FMS ID for each fiscal year. Similarly, the City’s contribution to the MTA’s five-year capital plans is represented by a single FMS ID. At the other end of the spectrum, other agencies, like NYC Health + Hospitals, create separate FMS IDs for small individual purchases, like a separate ID for the purchase of a single $223,000 mobile x-ray blood irradiator at Bellevue Hospital.
In terms of granularity, some smaller agencies, like the Financial Information Services Agency (FISA) and Office of Technology and Innovation (OTI), do not have an associated sponsor agency category in FMS. These agencies are subsumed into larger sponsor agencies (such as the Department of Citywide Administrative Services, or DCAS) based on the type of capital project (e.g. technology upgrades), making it challenging to isolate and analyze their respective capital programs.
Further issues relate to project funding details in FMS. While FMS indicates whether a project is funded by the City, State, Federal government, or private source, it does not specify the specific Federal or State funding program by which a project is funded. This has not been crucial in the past; however, now that the Federal government is cutting specific grant programs, it is a critical piece of information.
Analysis of Capital Projects Dashboard Data
Shortly after a CCP is published, the City updates the Capital Projects Dashboard and uploads the source data to OpenData. As of November 2025, OpenData contains data associated with the seven updates made to the Capital Projects Dashboard,[11] beginning with updates following the release of the April FY 2023 CCP through the May FY 2025 CCP. It also contains actual commitments data from FY 2000 through FY 2025 for projects in these plans.
As discussed, the Comptroller’s Office compared planned commitment data released in FMS against planned commitment data included in the Dashboard to assess the Dashboard’s gaps and limitations. Before the report dives into the results of the analysis, it is important to highlight a few methodological decisions.
First, to obtain the most holistic picture possible, the Office merged the two datasets on “FMS ID,” the most granular variable the two have in common.
And second, some of the data in the analysis was filtered out due to a mismatch in the number of fiscal years each source contains. The Capital Projects Dashboard includes 10 years of planned commitments for each CCP. Because this Office’s access to FMS limits outputs to just the four-or five-year plan period, this Office filtered out commitments and associated information included in the Dashboard data that was outside the four- or five-year plan period to ensure an accurate comparison.
The detailed results of this comparison follow below.
Results: The Dashboard Has Limited Financial Data
Table 1 shows planned commitments in the Capital Projects Dashboard as a share of total planned commitments from FMS, grouped by CCP, and spread across fiscal years. Commitments are substantially lower in the Dashboard than what are included in the full CCP, although commitments in the Dashboard are closer to full CCP amounts in the later fiscal years.
Table 1: Share of Planned Capital Commitments Included in the Capital Projects Dashboard, by Capital Commitment Plan
| Plan Date | FY 2023 | FY 2024 | FY 2025 | FY 2026 | FY 2027 | FY 2028 | FY 2029 |
|---|---|---|---|---|---|---|---|
| 4/26/2023 | 44.0% | 47.4% | 61.7% | 70.2% | 66.6% | ||
| 9/28/2023 | 43.3% | 60.1% | 70.5% | 70.9% | |||
| 1/16/2024 | 42.8% | 58.8% | 69.0% | 68.3% | 66.4% | ||
| 4/24/2024 | 41.3% | 58.5% | 58.3% | 61.0% | 62.0% | ||
| 9/30/2024 | 52.9% | 55.8% | 60.0% | 62.4% | |||
| 1/16/2025 | 50.9% | 58.5% | 60.7% | 63.3% | 64.4% | ||
| 5/1/2025 | 50.6% | 58.1% | 58.1% | 64.5% | 58.2% |
Source: Mayor’s Office of Operations, Capital Projects Dashboard; Mayor’s Office of Management and Budget, Capital Commitment Plans from the FY 2023 April CCP to the FY 2025 May CCP.
Table 2 further highlights the incompleteness of the financial data in the Dashboard. Aggregated by sponsor agency, the columns show the share of planned commitments in FMS that are in the Dashboard, and the share of FMS IDs in FMS that are also in the Dashboard.[12]
Table 2: Share of Planned Commitments and FMS IDs Included in the Capital Projects Dashboard, by Sponsor Agency
| Sponsor Agency | Share of Planned Commitments in FMS Included in Dashboard | Share of FMS IDs in FMS Included in Dashboard |
|---|---|---|
| Dept. of Education | 0.0% | 0.0% |
| Office of Technology and Innovation | 0.0% | 0.0% |
| Transit Authority (MTA) | 0.0% | 0.0% |
| Housing Preservation and Development | 0.3% | 1.4% |
| Dept. of Health and Mental Hygiene | 27.1% | 9.1% |
| New York Research Library | 27.2% | 6.9% |
| Dept. of Sanitation | 28.1% | 48.4% |
| Human Resources Admin. | 36.2% | 11.1% |
| Fire Dept. | 41.8% | 42.7% |
| Dept. of Cultural Affairs | 50.6% | 23.8% |
| New York Public Library | 64.6% | 37.8% |
| Dept. for the Aging | 65.1% | 12.8% |
| Police Dept. | 68.3% | 31.9% |
| Admin. for Children’s Services | 68.4% | 14.9% |
| City University | 74.1% | 56.6% |
| Dept. of Citywide Admin Servs | 74.8% | 40.7% |
| Health + Hospitals | 76.8% | 39.0% |
| Dept. of Environmental Protection | 89.4% | 65.1% |
| Dept. of Small Business Services | 92.1% | 60.3% |
| Dept. of Homeless Services | 93.3% | 65.7% |
| Queens Borough Public Library | 94.2% | 42.9% |
| Brooklyn Public Library | 94.6% | 41.3% |
| Water Supply | 96.0% | 40.0% |
| Dept. of Parks and Recreation | 96.8% | 62.9% |
| Dept. of Correction | 97.5% | 38.3% |
| Dept. of Transportation | 97.8% | 71.6% |
Source: Mayor’s Office of Operations, Capital Projects Dashboard; Office of Management and Budget, Capital Commitment Plans from the FY 2023 April CCP to the FY 2025 May CCP.
Notably, the City’s Capital Projects Dashboard does not contain information on the Department of Education’s commitment plan. This is because the SCA maintains its own financial management system. This data is not brought into the City’s centralized FMS database for the capital program at the level of granularity needed to track projects.[13] Nearly all capital dollars committed through the SCA are tracked as a single annual line item in the FMS capital program database – for instance, SCA24 for SCA’s 2024 planned commitments. The SCA does publish its own quarterly status report as a PDF,[14] but it does not link projects with the FMS codes.
The Dashboard also excludes all information from OTI and the MTA, and most HPD projects. The City does not have discretion over how the MTA commitments are spent, but it is unclear why all OTI projects are excluded. The dataset also excludes 99.7 percent of planned commitments from HPD. The City has stated this is because most HPD commitments are provided to non-city entities through grant and loan programs, and the status of private development projects is more challenging to track.
Other Capital Tracking Tools
Various agencies performing work in the City publish and regularly update capital tracking tools. These include:
- The School Construction Authority: The SCA provides a quarterly PDF status report of capital projects in process. It details planned and actual project costs and schedule by phase; project description and location; and project category. The SCA performs capital planning largely separate from the rest of the City. City contributions to the SCA are reflected in FMS as an annual lump sum.
- The Department of Parks and Recreation (DPR): DPR maintains an excellent capital dashboard. Users can access the dashboard through DPR’s website. The landing page is a clean, user-friendly, interactive map containing plotted locations of their active projects. Clicking on a plotted location brings up basic information on a project, including a link that can be followed for additional project details. Below the map on the landing page is a list of DPR’s capital projects, split across four tabs: active projects, proposed projects, partner projects, and completed projects. Once a user selects a project to view more details, they are sent to a separate webpage. This page provides detailed timeline information by phase, recent project updates, estimated project cost, funding source, and – if available – a graphic of the work. It also notes the project lead and their email address should a user have any questions.
- The Department of Transportation (DOT): The City passed Local Law 62[15] and 63[16] in FY 2025 that should significantly enhance DOT’s project reporting. In conjunction, the two require all capital projects (outside of projects for facilities not used by the general public) to publish a GIS project location, project description, status updates, estimated and actual start and completion, indication of percent of work completed by phase, reasons for delay, presentations given to community boards, funding source, contractors and vendors involved, and cost overruns by phase. When completed by FY 2027, the webpage or dashboard should improve transparency for projects that many residents are interested in.
- New York City Housing Authority (NYCHA): NYCHA maintains a high-quality dashboard. NYCHA’s housing developments are plotted onto a navigable map. Users can select these developments (or search for them) to view that property’s five- and 20- year capital needs, and past and ongoing projects that address these needs. Project information includes detailed timelines by phase, progress against the schedule, estimated budget, funding source, bi-weekly project updates, and often a small picture of the completed work. NYCHA notes that due to “system constraints”[17] this dashboard excludes unfunded projects, projects completed before 2019, emergency projects, and projects performed under the Permanent Affordability Commitment Together (PACT) program.
- The Department of City Planning (DCP): DCP maintains the Capital Planning Explorer – a GIS-based dashboard that shows housing production, SCA projects, transit and other public infrastructure, and flood and zoning maps among others. The dashboard also includes capital planning data through April 2023 (it was replaced by the Capital Projects Dashboard). This data includes information about managing agencies, sponsor agencies, and planned commitments by phase and budget line. DCP notes that only projects it worked with agencies to map are included.[18]
- The Metropolitan Transportation Authority (MTA): The MTA has a dashboard that provides significant detail on the agency’s capital projects, such as: project location plotted onto Google Maps, project description, budgeted and actual spend, schedule start and completion dates by phase, and capital plan category groupings. As the MTA has acknowledged, this interface is outdated and defines discrete projects using an internal financial code that does not map well with how the MTA performs its work nor how the public thinks of a capital project. In response, the MTA released a Beta dashboard that aims to better define discrete capital projects and provide an improved user experience.
Results: The Dashboard Has Limited Project Management Data
As mentioned earlier, the Capital Projects Dashboard was intended to merge agency-provided and -maintained project management data with the financial data housed in FMS. However, agencies often define a discrete capital project in a way that does not neatly align with information listed in FMS. To bridge that misalignment, the Capital Projects Dashboard includes an additional identifier—what they call “Project ID or PID”—that constitutes a discrete “project” as defined by the agency. Where this identifier exists, FMS IDs typically roll up to the PID (ex: FMS IDs A and B in Figure 2). In this scenario, the FMS ID can be thought of as a subpart of a larger project. In rare cases, the PID may be a subset of a discrete project in FMS (ex: FMS ID C in Figure 2) or fall into both categories. The figure below helps illustrate this relationship.
Figure 2: Demonstration of Possible Relationships Between FMS ID and Project ID
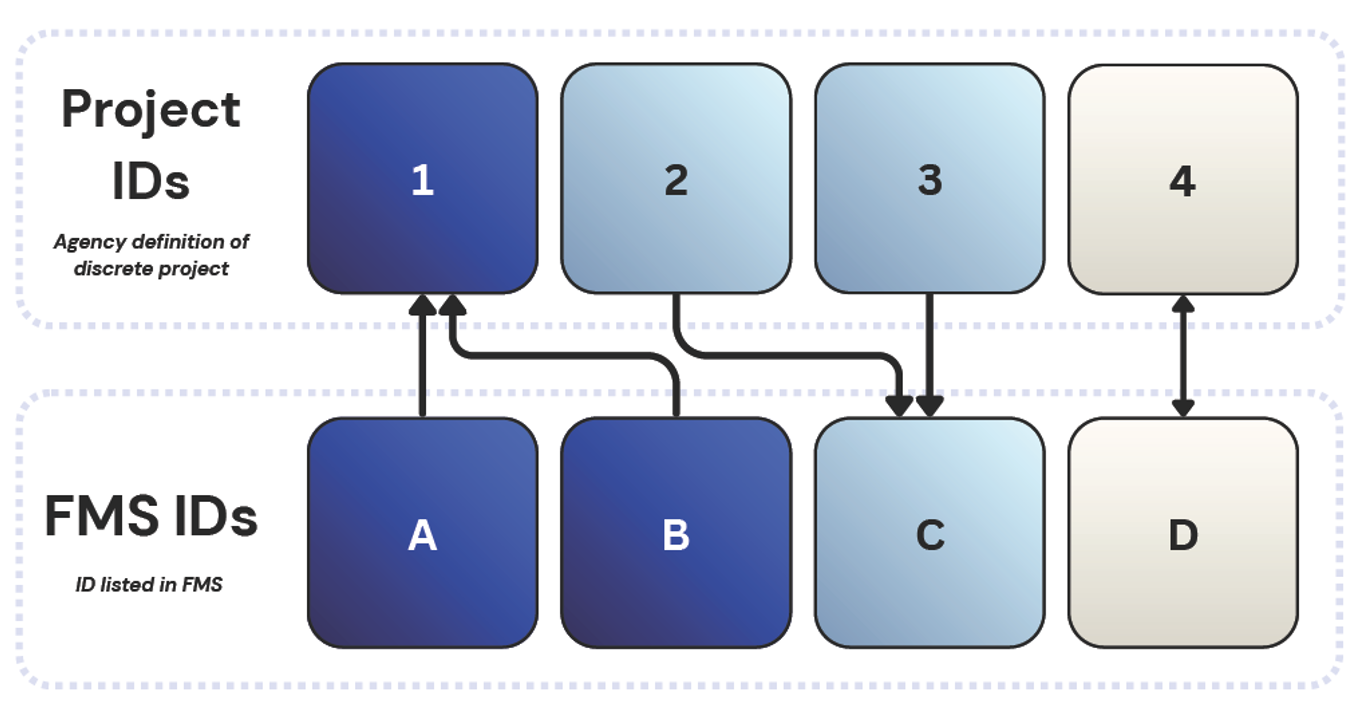
Note: The colors are used to indicate which FMS IDs and Project IDs are linked. If cells share a color, then they are linked. The direction of the arrow indicates hierarchy, with the arrow pointing towards the higher-level record. Project ID 4 and and FMS ID D have a 1:1 relationship.
Our Office found that of the FMS IDs that are in the Dashboard, 31.1 percent have an associated PID. Meaning, most FMS IDs are not linked to project management data. Of these linked FMS IDs, 70.8 percent have a one-to-one linkage (ex: PID 4 and FMS ID D), 25.0 percent roll up to a PID with at least one other FMS ID (ex: PID 1), while just 2.6 percent are associated with more than one PID (ex: FMS ID C). 1.6 percent fall into both categories.
While the project management data included in the Dashboard is helpful where it is complete, it is rarely so. Within the universe of just project management data, PIDs with an associated budget have a schedule provided by the agency. However, just 52.4 percent of PIDs that are delayed have a listed reason for the delay. As shown in Table 3, some managing agencies[19] do a better job at listing rationale for a delay.
Table 3: Completeness of Delay Information by Managing Agency
| Managing Agency | Percent of Delayed PIDs With a Listed Reason |
| Dept. of Health and Mental Hygiene | 33.3% |
| Dept. of Sanitation | 34.3% |
| City University | 37.5% |
| Dept. of Parks and Recreation | 39.1% |
| Dept. of Design and Construction | 42.5% |
| Dept. of Environmental Protection | 51.0% |
| Fire Dept. | 57.6% |
| Dept. of Correction | 58.3% |
| Dept. of Transportation | 61.7% |
| Dept. of Citywide Admin Servs | 72.2% |
| Business Integrity Commission | 78.9% |
| Dept. of Homeless Services | 85.7% |
| Police Dept. | 93.0% |
Source: Mayor’s Office of Operations, Capital Projects Dashboard
The Importance of High-Quality Capital Data
This Office’s analysis of capital data shows that the ability for the City and public to track the status of capital projects is primarily limited by capital project data itself and not how this data is displayed. While the Capital Projects Dashboard provides information on project scope, location, schedule, budget and its adherence to those, too few projects have a complete and up-to-date set of this data to make the Dashboard useful for capital project oversight, capital project reform, or public inquiry.
The Dashboard continues to leave the City, its residents, the news media, and other concerned parties unable to answer simple questions of New York City’s capital program, like: What are the scopes, schedules, locations, and budgets of the City’s capital projects? Have projects remained on time and within budget, and if not, why? Have the scope, schedule, and budget of capital projects changed?
As a result, the City is still left flying blind. It remains without a comprehensive view of its capital program, and outside of the agency managing a particular project, the City does not have insight into how a project is progressing relative to its stated budget and schedule. It also continues to lack the ability to identify common issues with capital project delivery and develop solutions to address them.
In short, capital project data requires major reform. The Comptroller’s Office in the section below outlines some ideas on how it can be improved.
Recommendations
As this Office has outlined above, the City’s capital financial and project data suffers from major gaps: it is incomplete, inconsistent across agencies, fragmented across disparate project management systems, and poorly aligned with financial data. The recommendations that follow aim to strengthen existing public-facing capital data and build on the work already underway by the Department of Design and Construction (DDC) and the NYC Capital Process Task Force. DDC’s “Advanced Capital Planning” initiative, for example, will create a GIS-based portal that unifies information on public buildings.[20] The Comptroller’s Office hopes that these recommendations will help set a new direction for capital project data management and reporting for the incoming Mayoral administration.
Fully Build Out Agency-Level Capital Project Data
- Require all agencies to link project management data to FMS. All FMS IDs should have an accompanying PID. This includes the Department of Housing Preservation and Development (HPD) loan programs, contributions to Metropolitan Transportation Authority (MTA) capital programs, and all other data in FMS that is not linked to a PID.
- Require all projects with schedule delays or cost overruns to include a clear, standardized reason, and add variables indicating why a project was delayed or went over budget.
- Add detailed project descriptions that go beyond the few words currently included in FMS for every project.
- Link each project to the most specific geographic location possible, listing all locations in a searchable format while accounting for security concerns.
- Add a detailed, phase-by-phase project schedule for every project, including estimated and actual dates.
- Link projects to the agency-specific Ten Year Capital Strategy (TYCS) service categories to clarify agency spending priorities.
- Link projects to the TYCS lifecycle categories: state of good repair (maintaining and repairing facilities and infrastructure); program expansion (adding new or expanding current facilities and infrastructure); and programmatic replacement (replacing existing facilities or equipment).
- Include status updates for each funded project upon the release of each CCP.
Include All Capital Projects in the Capital Projects Dashboard
- Include all FMS IDs and their full data, including planned and actual capital commitments and liquidations, in the Capital Projects Dashboard.
- Add School Construction Authority (SCA), HPD, and Office of Technology and Innovation (OTI) capital planning financial data to the Capital Projects Dashboard.
Standardize FMS ID Naming and Other Data Rules in FMS
- Incorporate indicators that denote if an FMS ID is a holding code, a loan program, an intergovernmental transfer, sponsored by multiple agencies, part of a larger project, or required city spending as part of a rezoning or other action.
- Remove embedded fiscal-year markers from recurring program FMS IDs and create a separate program-year field to improve long-term tracking. For instance, the FMS IDs for HPD loan programs such as the Extremely Low- and Low-Income Affordability Program are currently labelled by fiscal year: ELLA20, ELLA21, ELLA22. Those FMS IDs should be renamed as ELLA with a new, separated field added to denote the applicable fiscal year.
- Identify when an FMS ID draws funding from a holding-code ID and link it explicitly to that original code.
- Base planned commitments on genuine cost estimates and flag any amounts included solely for holding purposes.
Add Additional Variables to FMS Data to Improve Monitoring
- Provide more granular details in FMS on the funding source for planned and actual commitments and liquidations, including the specific non-City grants supporting each program where applicable, as is done in the expense budget. This is especially important at time when the Trump Administration is cancelling specific grant programs that were appropriated by Congress.
- Include smaller agencies that are not represented as a sponsor or managing agency in FMS data. For instance, Financial Information Services Agency (FISA) and Office of Payroll Administration (OPA) projects are reflected under a variety of sponsor and managing agencies, making it difficult to track their capital plans and spending.
Recommendations to Be Implemented in Future Phases
- Connect contract data to project management and financial data to give the City visibility into vendors, subcontractors, deliverables, and performance evaluations, enabling stronger vendor selection, better oversight, and more informed capital planning.
- Link Asset Information Management System (AIMS) to financial and project management data while dramatically improving its accuracy and completeness. Washington, D.C. serves as a good example.[21]
- Use the Capital Projects Dashboard as a comprehensive capital project management tool by conducting quarterly assessments of agency performance by project type, enabling targeted interventions for projects going off track as well as systemic agency-level and citywide reforms to address recurring institutional barriers revealed in the data.
Conclusion
New York City does not have a detailed grasp of its own capital program and the specific projects contained within. This is a consequence of the patchy and unreliable capital data maintained in the City’s centralized Financial Management System, split across disperse agency project management systems, and in the City’s unreliable Asset Information Management System. Efforts to create a capital projects dashboard are hamstrung by these capital data limitations. Put simply, the Dashboard cannot provide City employees or the public with information if that information does not exist.
The poor state of capital data also makes it challenging for fiscal monitors (such as the Comptroller’s Office) and the City itself to ensure New York City remains a good steward of taxpayer dollars. At a time when the City’s capital commitments are accelerating—largely to address the City’s acute affordable housing crisis, respond to a changing climate, complete the borough-based jails plan, add school capacity to comply with the class size mandate, and contribute to the MTA’s capital plan—and the Trump Administration continues to slash funding to blue states and cities, it is more important than ever that the City can measure and report on what City agencies plan to do, how much projects will cost, and whether projects are completed on time and on budget.
For this to happen, the City must fully build out agency-level capital data; include all capital projects in the Capital Projects Dashboard; standardize FMS ID naming and other data rules in FMS; add variables to FMS data to improve monitoring; and integrate capital, contract, and asset planning and management systems.
Acknowledgements
This fiscal note was authored by Bailey Schweitzer, Sr. Capital Budget Analyst. Archer Hutchinson, Creative Director, and Addison Magrath, Graphic Designer led the report design and layout. The author is thankful for the comments received on earlier drafts and is responsible for any errors.
[1] https://comptroller.nyc.gov/services/for-the-public/investing-in-nycs-infrastructure/building-on-time-and-on-budget/
[2] https://comptroller.nyc.gov/newsroom/audit-new-york-city-is-failing-to-accurately-identify-its-infrastructure-repair-needs/
[3] https://www.thecity.nyc/2025/10/01/trump-freeze-transit-billions-dei/
[4] The Office of the NYC Comptroller can only break out the reserve for unattained capital commitments for DEP projects due to the Capital Cash Flow report it receives upon the release of each Financial Plan.
[5] https://www.nyc.gov/assets/omb/downloads/pdf/exec25/typ5-25.pdf
[6] https://comptroller.nyc.gov/wp-content/uploads/documents/The-Need-for-Better-AIMS.pdf
[7] https://data.cityofnewyork.us/City-Government/Capital-Project-Detail-Data-Dollars/wa2y-rh4b/about_data
[8] https://www.osc.ny.gov/files/reports/pdf/report-1-2025.pdf
[9] https://intro.nyc/local-laws/2020-37
[10] https://www.nyc.gov/mayors-office/news/2023/11/mayor-adams-comptroller-lander-bring-transparency-accountability-capital-process-with
[11] The City also publishes tabular datasets on the City’s Capital Budget, CCP, and capital actuals on OpenData. These datasets, however, are not unique at the FMS ID. The first two datasets are granular at the budget line, which is a broader category than FMS ID. The actuals dataset rolls up to agency. Therefore, their use for analysis of the City’s capital program is limited.
[12] Since Capital Projects Dashboard OpenData datasets do not include information on sponsor agencies, this Office merged sponsor agency information from FMS data on the FMS ID. Approximately 8 percent of FMS IDs (accounting for just 12.6 percent of planned commitments in the Capital Projects Dashboard) had more than one associated sponsor agency and were therefore excluded from this and all further analyses in this fiscal note.
[13] While more granular SCA data is brought into the City’s FMS, it is maintained as a separate output from the City’s capital commitment plan. This data does not map to the SCA capital plans released as PDFs nor with the lump sum amount listed in the CCP. It therefore cannot be used for tracking purposes.
[14] http://nycsca.org/Community/Capital-Plan-Reports-Data
[15] https://intro.nyc/local-laws/2025-62
[16] https://intro.nyc/local-laws/2025-63
[17] https://capitaltracker.nycha.info/
[18] https://capitalplanning.nyc.gov/capitalprojects
[19] Managing agency is used rather than sponsor agency due to data quality challenges that arise when merging sponsor agency into the dataset
[20] https://www.nyc.gov/assets/ddc/downloads/publications/2025_Strategic_Blueprint.pdf
[21] https://cfo.dc.gov/sites/default/files/dc/sites/ocfo/page_content/attachments/Long-Range%20Capital%20Financial%20Plan%20Report%202024_Full%20Report_rev.pdf