Growing Unfairness The Rising Burden of Property Taxes on Low-Income Households
Introduction
This report examines and measures the impact of rising residential property taxes on New York City households over the 2005 -2016 period, providing a detailed analysis of how property tax increases have affected households at different levels of the income distribution.[1] Residential property owners in the City are well aware of the sharp rise in property taxes that has occurred over this period. Since 2005 residential property tax revenue has increased by more than 98 percent, growing on average by 6.4 percent per year and exceeding the average annual growth in overall tax revenue of 5.2 percent.[2] In contrast, household incomes over the same period have grown on average by only 2 percent per year. As a result, homeowners have seen their property tax burdens — the share of income devoted to payment of property taxes – rise considerably over this period. Not surprisingly, this has resulted in tax appeals jumping by more than 35 percent over the previous decade and a lawsuit claiming that the City’s property tax assessments systematically discriminate against lower income and minority households was recently filed.[3]
The increase in property taxes and property tax burdens had been in part mitigated by the concurrent appreciation in property values, which made individuals feel better off at least in terms of their household net worth. In addition to the boost from rising asset values, declining interest rates throughout most of the past 20 years contributed to lower mortgage payments so that overall homeowner costs (mortgage payments plus property taxes) rose at a considerably lower rate than property taxes alone, and more aligned with increases in income, helping to keep overall housing costs burdens in check.[4] Moreover, until this year, taxpayers who itemized their deductions could also deduct the full amount of property taxes from their federal taxes, helping to alleviate property tax burdens.
More recently, however, the effects of these mitigating factors have subsided. Interest and mortgage costs have begun to rise and while property values have stopped increasing in many neighborhoods, property taxes have continued to grow as a result of the lagged nature of property taxes.[5] The recent Federal tax law now limits the deductibility of state and local taxes to $10,000. As a result, property tax burdens will be felt more acutely by homeowners.
As shown in this report, the increasing property tax burden affects almost all segments of the income distribution, but the rise has been particularly pronounced for lower income households. The report also provides a comparison of increases in property taxes in New York City to surrounding areas. While property taxes are still comparatively low in NYC, the City’s growth rates have far outpaced the region’s over this timeframe.
Data and Methodology
Property tax burdens for New York City resident are computed using income tax records of resident tax filers. Since most NYC homeowners itemize their property taxes as deductions on their income tax forms, property taxes can be matched with incomes for individual filers to obtain the distribution of property tax burdens across filers.
This data also provides information on tax programs which provided benefits to property owners in the form of tax credits on the individual income tax form. These include tax credits, like the New York City Enhanced Property Tax Credit, more commonly referred to as the Circuit Breaker, or the New York State Residential Property Tax Credit. In addition to these credits applied to income taxes, there are other tax credits and abatements such as STAR, Enhanced STAR, Senior Citizen Homeowners Exemption, and the Coop/Condo Abatement, which also lower property tax bills. A summary of the major tax programs and their benefit is provided in this report.
The personal income tax data used in this report provides detailed information on income and property taxes that is otherwise unavailable (or limited) in sources such as the Census Bureau’s American Community Survey and New York City Housing and Vacancy Survey. The data does have several important limitations, however:
- The data does not provide the county of residence for New York City filers; it therefore does not allow for borough comparisons.
- The data also does not distinguish the property class of residential property, i.e. whether the property is a single family home (Class 1) or a coop/condo (Class 2). Where inferences can be made into why different property classes would impact households at different levels of income, this distinction will be made.
- Since renters cannot deduct property taxes paid, the report provides little information on burdens borne by renters, another key aspect of the Tax Equity Now lawsuit.[6]
Key Findings
While households in all income ranges have seen their property tax burdens increase over the 2000-2016 timeframe, the most significant impact has been on households with annual incomes below $50,000 as shown in the graph below, and to a lesser extent, for households in the $50,000 to $100,000 income range. Households with incomes between $250,000 and $500,000 bear the lowest average property tax burden; these household have also experienced the lowest increase in property taxes amongst all income ranges. An explanation for this is provided in greater detail in the discussion below on specific income ranges. The results highlight the regressive nature of property taxes in general.[7]
Property Taxes as a Percent of Income by Income Range, 2005-2016
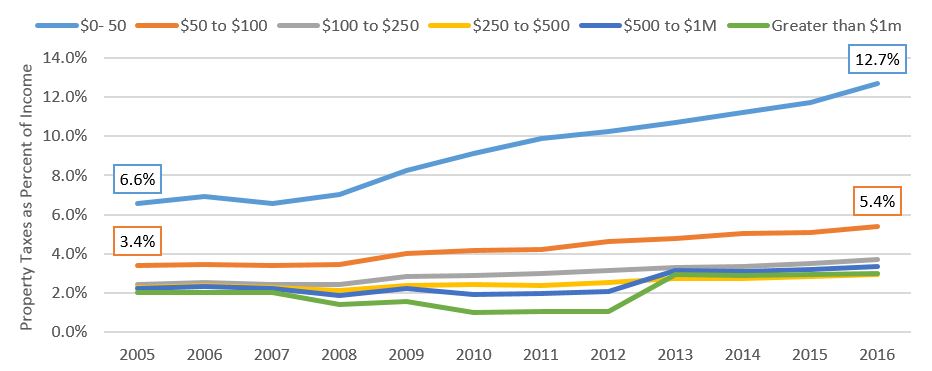
SOURCE: NYS Department of Taxation and Finance: 2005- 2016 PIT Population Study File, Office of the NYC Comptroller calculations.
NOTE: Income range in thousands of dollars.
The table below also illustrates how the pattern of increase in burdens over this period has been different for households at various levels of income, particularly for the highest income households – those with incomes greater than $500,000. Most low to middle income households have seen the burdens rise in a fairly steady and linear manner since 2008, the last time property tax rates were cut. For high income filers, there has been more fluctuation. This is not surprising given that fluctuation in both household income and property values is typically considerably greater for high income households.
Change in Median Property Tax and Income by Income Range, 2005 and 2016
| 2005 | 2016 | Pct. Change 2005-2016 | |||||
| Income Range (in thousands) |
Number of Filers |
Median Property Tax | Median Income | Median Property Tax | Median Income | Median Property Tax | Median Income |
| $0- $50 | 82,196 | $1,940 | $32,979 | $3,849 | $32,729 | 98% | -0.8% |
| $50 to $100 | 140,631 | $2,397 | $71,069 | $4,009 | $74,343 | 67% | 4.6% |
| $100 to $250 | 165,778 | $3,524 | $138,329 | $5,421 | $145,140 | 54% | 4.9% |
| $250 to $500 | 46,954 | $9,065 | $328,803 | $10,061 | $332,953 | 11% | 1.3% |
| $500 to $1M | 19,484 | $19,920 | $670,595 | $23,207 | $670,194 | 17% | -0.1% |
| > $1m | 10,552 | $57,939 | $1,965,486 | $83,183 | $2,532,309 | 44% | 28.8% |
SOURCE: NYS Department of Taxation and Finance: 2005- 2016 PIT Population Study File, Office of the NYC Comptroller calculations
NOTE: Income measured by Federal adjusted gross income.
Income less than $50,000
Households making less than $50,000 have seen their property tax burdens nearly double from 6.6 percent in 2005 to almost 13 percent in 2016. Property taxes have increased by 98 percent while median income has actually declined for these filers. For households at this income level, where there is little or no discretionary income, these increases impose significant constraints and sacrifices on household budgets. It is important to note that these results take into account tax credits and other programs intended to mitigate this impact. This group is likely to include a large number of senior households whose incomes may have been higher at the time they purchased their homes.[8]
Income between $50,000 and $100,000
Similar to low income households, homeowners in this income bracket have seen their burdens almost double over this timeframe, from 3.4 percent to 5.4 percent, as growth in property taxes has far outpaced income growth.
Income between $100,000 and $250,000
Homeowners in this income bracket saw their property tax burdens increase by more than a full percentage point from 2.4 percent in 2005 to 3.7 percent in 2016. While still a relatively small share of overall income, if this steadily increasing trend were to continue, property tax burdens would become even more problematic for these relatively well-to-do households.
Income between $250,000 and $500,000
Homeowners in this income bracket experienced the lowest growth in tax burdens and also have the lowest overall burden of any income group at 2.9 percent. One likely explanation for this is the shifting of population among higher income households that has occurred over this timeframe out of Manhattan and into Brooklyn in particular. Since property taxes are comparatively lower outside Manhattan, households in this segment would have experienced relatively lower increases in property tax burdens by moving away from high property taxes in Manhattan.
Income over $500,000
Property tax burdens for households in this income bracket were at three percent in 2016, but the trend over time for this group is much more erratic than for other groups. This greater fluctuation is due in part to the fact that income and property values for this group are much more volatile because of extremely large fluctuations in capital gains and prices of luxury homes.[9]
Property Tax Burdens Compared to Surrounding Areas
New York City property taxes, measured in relation to market values, have historically been low compared to surrounding areas. This reflects the fact that City relies on other taxes outside of property taxes to fund its overall budget, while surrounding jurisdictions depend to a far greater extent on property taxes to meet their budget needs. As shown below, while property taxes for most levels of income remain higher in surrounding areas, the relative burdens have narrowed particularly for low income households.
Median Property Tax by Income Range, NYC vs Surrounding Areas, 2005 and 2016
| Income | 2005 | 2015 | ||||
| NYC | LI | Westchester | NYC | LI | Westchester | |
| 0- 50k | $1,940 | $6,261 | $4,741 | $3,615 | $8,205 | $6,979 |
| 50k to 100k | $2,397 | $6,875 | $5,847 | $3,780 | $8,965 | $7,625 |
| 100k to 250k | $3,524 | $8,417 | $8,594 | $5,088 | $10,775 | $10,681 |
| 250k to 500k | $9,065 | $15,714 | $17,099 | $9,661 | $16,058 | $17,770 |
| 500k to $1M | $19,920 | $26,816 | $29,734 | $22,278 | $29,689 | $33,091 |
| Gt $1m | $57,939 | $59,131 | $63,976 | $82,455 | $77,534 | $89,317 |
SOURCE: NYS Department of Taxation and Finance: 2005- 2016 PIT Population Study File, Office of the NYC Comptroller calculations.
NOTE: Long Island includes Nassau and Suffolk Counties.
Increase in Median Property Tax by Income Range, NYC and Surrounding Areas, 2005 to 2016

Existing Property Tax Relief Programs
As noted, these results take into account various provisions designed to lower property taxes and property tax burdens. Some of the programs are available to any individual property owner provided they meet specific eligibility criteria. Other benefits are specific to certain types of properties that meet certain criteria.[10] A summary of the major programs for individuals is shown in the table below.
New York State and City Property Tax Credits
| Program | Eligibility | Average Benefit |
| NYC School Tax Credit | Income less than $250,000 | $63/$125 single/married (maximum credit) |
| STAR Property Exemption | Income less than $500,000 | $300 |
| Enhanced STAR | Age 65+; Income less than $86,000 | $600 |
| Senior Citizen Homeowners Exemption (SCHE) | Age 65+; Income less than $37,000* | Varies |
| NYC Enhanced Property Tax Benefit (Circuit Breaker) | Income less than $200,000 | $52 |
| NYS Real Property Tax Credit (Circuit Breaker) | Income Less than $18,000 | $375/$75 senior/non-senior (maximum credit) |
Source: NYS Department of Taxation and Finance, NYC Department of Finance
NOTE: *The eligibility threshold for SCHE was increased in FY 2018 to $50,000 for the maximum benefit, with a sliding scale reduction in benefits for incomes up to $59,000.
The shortcomings of these programs in their ability to lower tax burdens are related to either the restrictive eligibility requirements or the low amount of benefit offered or both. For instance, the average benefit offered to households from the recently introduced circuit breaker and Basic STAR are relatively small when compared to an overall property tax bill of $3,500 for incomes below $100,000, at $52 and $300 respectively. Other jurisdictions offer higher benefits to low income families through circuit breakers. Notably when the legislature expanded the NYC Enhanced Property Tax Benefit in New York City in 2015, the cost of the program was estimated at only $58 million in 2018. In comparison the Property Tax Relief Credit offered outside the City is estimated to cost $957 million.
Enhanced STAR offers a more generous benefit but this benefit is limited to seniors. The senior citizen homeowner’s exemption (SCHE) program, which potentially would deliver the greatest benefit to homeowners wanting to age in place, had a very narrow income eligibility threshold. Recently introduced legislation would expand this benefit to senior households at higher levels of income.[11]
Property Specific Benefits
In addition to these individual benefits which are available to any property owners who meet the eligibility criteria under the law, other property tax relief programs are available to specific properties that meet certain eligibility criteria. These include the coop/ condo abatement, the 421-a program and the J-51 exemption abatement.[12] We do not have data on the household income of the beneficiaries of these tax programs, so we cannot assess the tax burden reducing effects of these programs by range of household income.
Property Specific Tax Benefits
| 421-a | Coop/Condo Relief | J-51 Exemption and Abatement | |
| Number of Recipients | 73,394 | 270,563 | 117,836 |
| Total Tax Benefit ($ millions) | $1,216 | $429.4 | $266.2 |
SOURCE: New York City Department of Finance, Tax Expenditure Report 2016.
Implications and Recommendations
The rise in property tax burdens has numerous implications that should be cause for concern to policymakers. The increasing regressivity of the City’s real property tax raises questions of fairness and equity as lower income households pay more relative to their available resources than higher income households. While the expanded SCHE could provide some tax relief to seniors, other segments of the population would not benefit from this program, and in fact could bear a greater share of property tax burdens. As noted, the current circuit breaker program’s benefits are too small to provide any significant benefit to other non-senior households.[13]
The maximum combined benefit of the New York State and New York City circuit breakers is only $575 for non-seniors ($875 for seniors).[14] Of the 476,000 households who received the NYC Enhanced Property Tax Credit, only 3,888 received a credit of $400 or more and only 1,944 or less than 0.5 percent of all claimants received the maximum amount as shown in the chart below.
Distribution of NYC Enhanced Property Tax Credit 2016
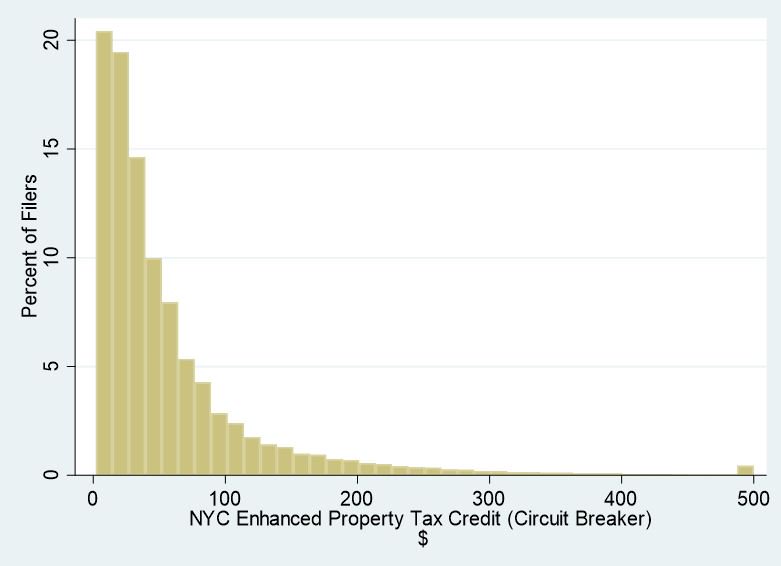
SOURCE: NYS Department of Taxation and Finance:2005- 2016 PIT Population Study File, Office of the NYC Comptroller calculations
Several of the 33 states that have circuit breakers offer higher average and maximum benefits. To illustrate this we simulated the property tax relief and associated tax burdens of circuit breaker programs in New York City, Maryland and Washington, D.C.[15] For comparison purposes, we used the representative NYC lower income household shown in the table on page 3, with income of $32,729 and paying property taxes of $3,849. The choice of lower income households intends to reflect where burdens are highest and where benefits are generally designed to be highest. As shown below, New York City’s circuit breaker provides only a small benefit of $114, far lower than the benefit provided in Maryland or DC. The associated tax burden even after factoring the circuit breaker benefit remains very high in New York City, at 11.4 percent.[16] In contrast, DC’s, and in particular Maryland’s benefit, contribute to a significant decline in tax burdens for lower income households[17]. New York City’s circuit breaker program instead provides generally very small benefits across households at a wider income range of up to $200,000. The net result is that while more households may receive this benefit, it has very little impact.
Circuit Breaker Benefits Compared
| NYC | Maryland | Washington, DC | |
| Income | $32,729 | $32,729 | $32,729 |
| Property tax | $3,849 | $3,849 | $3,849 |
| Circuit Breaker Benefit | $114 | $1,989 | $1,000 |
| Property tax after benefit | $3,735 | $1,860 | $2,849 |
| Tax Burden | 11.4% | 5.7% | 8.7% |
SOURCE: Office of the NYC Comptroller calculations.
While the courts and the property tax commission recently established by the Mayor and City Council Speaker consider the relative fairness of property taxes across property classes, policy makers should also consider how to address the increasing regressivity of property taxes. There are several ways this could be achieved:
- Expand the circuit breaker to offer benefits comparable to those offered under DC’s or Maryland’s program. The benefits should be targeted to provide much higher benefit amounts to lower income households where burdens are most acute.
- A variation of Maryland’s program combined with higher income eligibility of up to $100,000 would also provide greater benefits to moderate income households.
- Expand the current base STAR benefit exemption from $30,000 to $66,800 for all low income households making less than $50,000.[18]
- While the recently expanded SCHE should provide seniors with increased property tax relief, another option to consider is to allow seniors to defer property taxes. Many states offer this option to lower income seniors as a way to allow senior to remain in their homes. The deferred taxes becomes due at the time of sale by the owner or the estate.
- Require the NYC Department of Finance to publish annual reports on median tax burdens for all taxes using households at different levels of income. This would enable residents and policy makers to easily see trends and determine regressivity of taxes[19].
Conclusion
The benefits of property tax credits need to be expanded and increased in order to provide more significant reduction in property tax burdens. This could be achieved by either increasing the circuit breaker benefit, or increasing the STAR or a combination of both. As the courts and the recently established property tax commission consider the relative fairness of property taxes across property classes, policy makers should also consider how to address the increasing regressivity of property taxes.
Acknowledgements
This report was prepared by Steven Giachetti, Director of Revenue Estimation, Bureau of Budget; Preston Niblack, Deputy Comptroller for Budget.
Endnotes
[1] Other reports have focused on Class Burdens or differences in property taxes among varying types of residential properties (Class 1 single-family versus Class 2 coop and condo) due to the specific laws governing Class 1 and Class 2 property assessments and taxes in the City.
[2] Measured by the combined growth in Class 1 and Class 2 levies which also includes rental apartment buildings The growth rate has been comparable for both Class 1 and Class 2 properties averaging 6.2 and 6.5 percent respectively over this timeframe.
[3] Aaron Elstein: “A record number of New Yorkers are contesting their property tax bill,” Crain’s New York Business, April 10, 2017. http://www.crainsnewyork.com/article/20170410/REAL_ESTATE/170409894/a-record-number-of-new-yorkers-are-contesting-their-property-tax-bill. The lawsuit – Tax Equity Now NY LLC v. City of New York et al., Index No. 153759/2017 (Sup. Ct., NY County; Lebovits, J.) – was filed in March 2018. This report does not explicitly address the merits of the lawsuit regarding the impact on minority households (income tax data does not provide demographic details to address) but does highlight the increasing regressive aspect of property tax burdens.
[4] According to ACS data the median overall homeowner cost for NYC households with mortgages rose by 26 percent from 2005-2016, compared to a 70 percent increase in property tax increases
[5] https://streeteasy.com/blog/may-2018-market-reports/. Property tax assessments for most coops and condos are phased in over a 5 year period so that even when market values stop growing, the phase-in of prior year assessment increases can cause property taxes to grow.
[6] Limited information is available from renters claiming the NYC Enhanced Property Tax Credit
[7] Unlike income taxes, property taxes in NYS/NYC have a flat tax rate structure based on property values. Because home property values are much higher as a share of income for low-income families than for the wealthy, property taxes are generally regressive. A 2015 ITEP analysis found that nationwide, the poorest twenty per-cent of Americans paid 3.6 percent of their income in property taxes, compared to 2.6 percent of income for middle-income taxpayers and 0.7 percent of income for the wealthiest 1 percent of Americans
[8] Because non-taxable social security earnings and other sources of tax exempt income are not reflected in Federal Adjusted Gross Income, the level of burdens for seniors in this income group could be potentially biased upwards. This would not however change the upward trend pattern shown in the Exhibit
[9] Another data limitation is that beginning in 2010, itemized deductions were sharply curtailed for households with incomes above $1,000,000, limiting allowable NYS deductions to charitable deductions. As a result many households in the highest income cohorts were no longer able to itemize on the NYS returns and did not report property tax information. This potentially introduces an upward bias to the tax burden data for this cohort. The deductions were still reported for Federal purposes but we were unable to obtain the Federal data.
[10] In addition to the individual benefits which are available to any property owner who meets the eligibility criteria under the law, other property tax relief programs are available to specific properties that meet certain eligibility criteria. These include the coop/ condo abatement, the 421-a program and the J-51 exemption abatement. The 421-a and J-51 programs cover rental as well as for sale properties. We do not have data on the household income of the beneficiaries of these tax programs, so we cannot assess the tax burden reducing effects of these programs by range of household income.
[11] The recent revision to the SCHE program took effect beginning in FY 2018 and thus subsequent to the income tax data used in this report.
[12] The 421-a and J-51 programs cover rental as well as for sale properties.
[13] The income tax does not provide sufficient information on the age of a filer to differentiate burdens between seniors and non-seniors.
[14] The property tax is shown after STAR benefits which add about $300 for non-seniors and $600 for non-seniors. The STAR benefit is similar to the homestead exemptions offered in other States.
[15] For Maryland benefits see: https://dat.maryland.gov/realproperty/Pages/Homeowners%27-Property-Tax-Credit-Program.aspx. For DC Benefits see: https://otr.cfo.dc.gov/sites/default/files/dc/sites/otr/publication/attachments/48364_Schedule%20H_12.9.15.pdf
[16] The expanded SCHE for seniors would provide considerably higher benefits but only for seniors
[17] Maryland’s benefit in fact is capped to households with incomes lower than $60,000 and limited to the first $300,000 of assessed value
[18] This is the exemption currently provided to seniors only. The current STAR program also caps the yearly benefit increase to 2%.
[19] Colorado for instance publishes detailed information on tax burdens for all taxes in its income tax forms. See page 2 https://www.colorado.gov/pacific/sites/default/files/104Book.pdf