Improving Select Bus Service: Putting the Rapid in Bus Rapid Transit
Improving SBS
Select Bus Service was first introduced to New York City in 2008. Its express intention was to increase the speed, reliability, and capacity of bus service through a number of core enhancements. These included dedicated bus lanes, off-board fare collection, limited stop-spacing, and transit signal priority.
The introduction of bus rapid transit lines requires close collaboration between the MTA and City DOT. Designing bus lanes, penalizing private vehicles who encroach on these lanes, installing curbside fare-collection machines, building curb extensions to expedite boarding, implementing Transit Signal Priority on traffic lights along the route: each of these measures is the responsibility of the City.
It is little surprise, then, that the process of converting a local route to a bus rapid route is typically inaugurated by the City DOT. Before introducing a new line, the department will hold numerous meetings with local elected leaders, community boards, and neighborhood residents to discuss the benefits of SBS and the range of possible interventions.
Thus far, this process has resulted in the creation of fifteen SBS corridors throughout the five boroughs, with several more currently in development.
Chart 1: The number of SBS Routes, by year
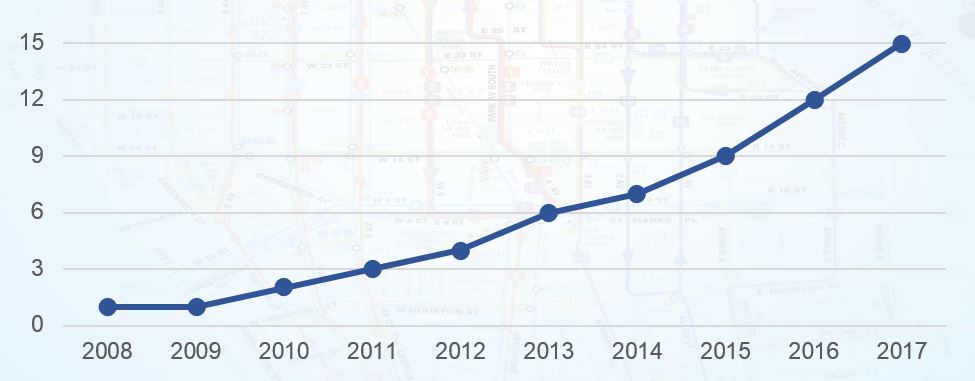
NYC DOT. “Select Bus Service Routes.”
Over the last decade, the SBS program has enjoyed a number of key achievements and introduced effective, replicable innovations that can be extended to local routes more broadly. Unfortunately, implementation has not always been robust, with many of its routes suffering from half-measures, design flaws, and poor maintenance, oversight, and enforcement. As a consequence, SBS has failed to deliver on its core goal: increased bus ridership.
Of the nine routes introduced prior to 2016, five experienced a ridership decline in comparison to the year prior to implementation (when it existed as a local and/or limited route). Overall, ridership declined by 0.2% on these nine lines (see Chart 2).
Chart 2: SBS ridership
| Route | Year Launched | Ridership the Year Prior to Launch | 2016 Ridership |
Ridership Change |
| M34/M34A | 2011 | 18,092 | 14,901 | -18% |
| M15 | 2010 | 53,073 | 44,797 | -16% |
| B44 | 2013 | 39,661 | 37,418 | -6% |
| M60 | 2014 | 17,013 | 16,751 | -2% |
| Q44 | 2015 | 28,139 | 27,712 | -2% |
| M86 | 2015 | 23,846 | 24,746 | 4% |
| Bx12 | 2008 | 42,219 | 48,124 | 14% |
| Bx41 | 2013 | 18,947 | 23,558 | 24% |
| S79 | 2012 | 8,969 | 11,378 | 27% |
| Total | 249,959 | 249,385 | -0.2% |
Post-2011: “Average Weekday Ridership” MTA New York City Transit and MTA Bus Company.
Pre-2011: NYCDOT and MTA. “Select Bus Service: Background and Context,” NYU Rudin Center. April 9, 2013.
But while these ridership numbers are discouraging, they are decidedly better than the performance of the system as a whole, where local bus ridership fell five percent from 2013 to 2016. Moreover, riders are generally pleased with Select Bus Service, as documented in a recent survey conducted by the Office of the New York City Comptroller.
SBS Survey
In April of 2018, the Comptroller’s Office polled 115 riders along 12 of the City’s 15 SBS corridors. While the core purpose of the survey was to learn more about Reduced-Fare Metrocard holders, it also inquired about SBS service more generally.
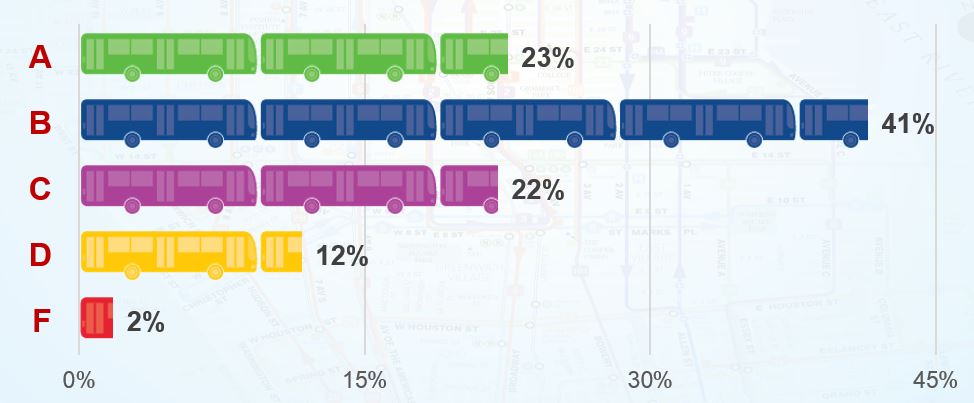
The survey revealed a relatively high level of satisfaction with Select Bus Service. Overall, 64 percent of respondents graded SBS service an A or a B. Only 14 percent, meanwhile, gave it a D or an F (see Chart 3).
Chart 3: How would you grade the quality of SBS service in recent months?
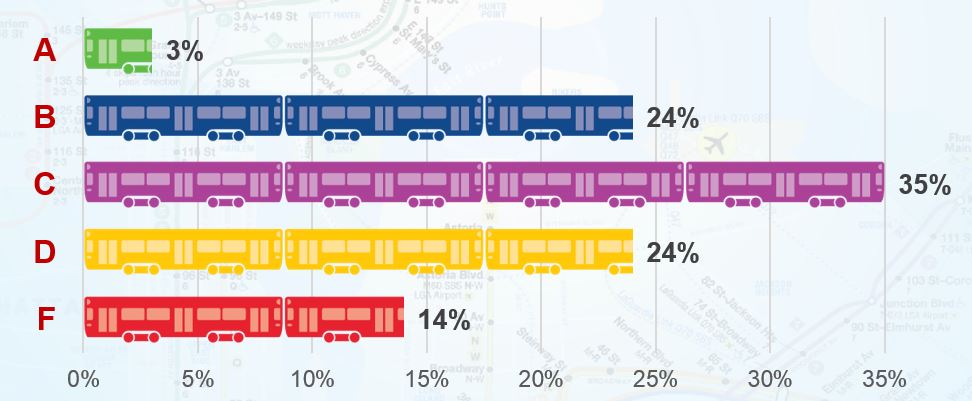
For the sake of comparison, this was far superior to grades for MTA subway service. Last summer, the Comptroller’s Office surveyed 1,227 riders at 143 stations along every subway line.[1] Of those polled, only 27 percent graded the subways an A or a B, while 38 percent gave it a D or an F. At a time when New Yorkers are generally dissatisfied with MTA service and operations, Select Bus riders represent an important and encouraging departure (see Chart 4).
Chart 4: How would you grade the quality of subway service in recent months?
Yet SBS service is far from perfect and there is significant room for improvement. This is particularly apparent when analyzing SBS average speeds and on-time performance. Select Bus routes travel only slightly faster than the average local route (8.9 mph versus 7.4 mph) and are identical in their on-time performance – a meager 62 percent (see Chart 5).[2]
Chart 5: On-time Performance and Speed of SBS routes
| SBS Route | Average Speed (mph) | On-Time Performance |
| B44 SBS | 8.3 | 65% |
| B46 SBS | 7.9 | 64% |
| BX6 SBS | 6.6 | 75% |
| BX12 SBS | 9.3 | 65% |
| BX41 SBS | 8.1 | 47% |
| M15 SBS | 6.4 | 38% |
| M23 SBS | 4.3 | 60% |
| M34A SBS | 4.3 | 67% |
| M34 SBS | 4.3 | 71% |
| M60 SBS | 10.3 | 37% |
| M79 SBS | 4.8 | 62% |
| M86 SBS | 4.9 | 74% |
| Q44 SBS | 8.7 | 54% |
| Q70 SBS | 11.3 | 62% |
| S79 SBS | 14.5 | 70% |
| SBS Average | 8.9 | 62% |
| Local Bus Average | 7.4 | 62% |
To an extent, this is unsurprising. The SBS program has always targeted popular local routes operating in congested areas. Bringing the speed and reliability of these slow routes up to the system average, then, is a mark of modest success. Still, given the investment of time and resources into converting and upgrading these corridors, the MTA and DOT must aspire to more.
To do so, they will have to contend with these underwhelming results and better understand why SBS routes have remained slow and unreliable. The reasons are, of course, numerous.
As documented in the Comptroller’s recent report on the state of the MTA bus system, The Other Transit Crisis, the installation of Transit Signal Priority (TSP) – which dynamically extends a green light or shortens a red light for approaching buses – has been excruciatingly slow.[3] As of July 2017, TSP was installed along the entirety of only three SBS routes and on small sections of two more. What is meant to be a core, fundamental feature of bus rapid transit is, in actuality, available only intermittently.
Moreover, many SBS routes do not follow their basic design standards. While the Authority aims to locate SBS bus stops 2,640 feet apart, this standard is sustained on only four routes and, on five others, stops are spaced less than 1,000 feet apart.[4] As a consequence, many SBS buses are forced to spend an excess amount of time pulling in and out of stops and on-boarding and off-boarding passengers.
Finally, a number of SBS routes do not have access to exclusive lanes during the entirety of their routes, forcing them to contend with traffic congestion. Moreover, even where bus lanes do exist, they are not sufficiently designed to repel general traffic and are too often under-enforced. As a consequence, cars, cabs, and delivery vehicles frequently and unlawfully drive and park in “exclusive” lanes—forcing SBS buses to slow-down, merge back into traffic, and contend with an endless stream of obstructions.
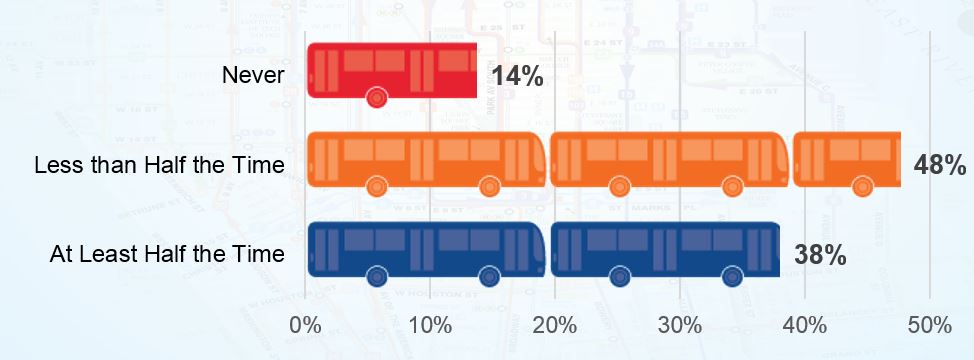
Those riders surveyed by the Comptroller’s Office were, of course, highly attuned to these deficiencies — despite their general satisfaction with SBS service. Among those polled, 38 percent reported that SBS routes run behind schedule at least half the time, while only 14 percent found their SBS buses were never off-schedule (see Chart 6).
Chart 6: How often do you experience SBS buses running behind schedule?
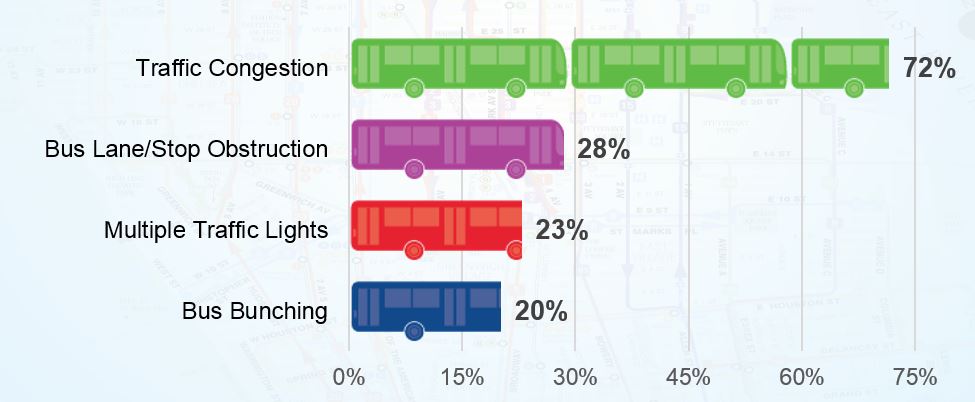
SBS riders linked these delays to a number of issues (see Chart 7). Over 70 percent of riders flagged “traffic congestion on streets” as a key factor for SBS delays, 28 percent credited “vehicles blocking the bus lane/stop,” and 23 percent noted that “buses get stuck at multiple traffic lights.”
Chart 7: What are the key factors causing delays on SBS buses?
Bus Lane and Bus Stop Violations
In New York City, there are strict laws regarding bus lanes and stops. These spaces are intended for the exclusive use of public transit vehicles and riders – with exceptions for emergency vehicles, turning vehicles, and certain times of the day. When bus lanes and stops are obstructed, buses are delayed and passengers are forced to arrive late for work, for appointments, for childcare pick-ups, and for activities with friends and family.
To deter illegal obstructions, the City relies on two tools: traffic officers and traffic cameras.
The NYPD Traffic Enforcement division is responsible for issuing tickets to vehicles standing in bus lanes and in bus stops. With some seasonal variation, the NYPD has been fairly consistent in their ticketing activities over the last year and a half, handing out approximately 24,800 tickets a month for bus stop violations, but only 1,800 for bus lane violations (see Chart 8).[5]
Chart 8: NYPD Traffic Enforcement Violations for Bus Lane and Bus Stop Violations
These bus lanes are also protected by traffic cameras, which issue the vast majority of relevant infractions. Since September 2016, cameras have identified 203,892 bus lane violations, compared to the 32,101 tickets issued by the NYPD. But while bus lanes are located along all 15 SBS corridors and in several congested sections of the city – like midtown and downtown Manhattan, southeastern Queens, and northern Staten Island – state legislation severely limits this proven enforcement method. As of late-2017, fixed location cameras were installed at only 94 locations along ten SBS routes.[6]
Whether officer or camera, the primary goal of traffic enforcement is to deter undesirable behavior. Ideally, a single ticket (or the fear of receiving one) will make drivers more conscientious and alert, preventing any future infractions.
In reality, this has not been the case. In the last 18 months, 783 vehicles have 5+ tickets for standing in a bus lane, 8,371 have 5+ tickets for standing in a bus stop, and 2,633 have 5+ tickets for camera-issued “bus lane violations.” And while these scofflaws make up only three percent of total offenders, they are responsible for 28 percent of all violations. To effectively reduce bus obstructions then, the City must do a better job counteracting repeat offenders.
Looking across all three infractions, 1,015 vehicles had between 25 and 49 violations in the last 18 months, 405 vehicles had between 50 and 99, and 185 received 100 tickets or more (see Chart 9). At the top of this list, one commercial vehicle had 870 violations in the last eighteen months, all for bus stop obstructions!
Chart 9: Bus Lane and Bus Stop Violations, Repeat Offenders
| Number of Violations | Type of Vehicle | Grand Total | |||
| Passenger | Commercial | Taxi/FHV | Other | ||
| 5-9 | 4,395 | 2,402 | 509 | 521 | 7,827 |
| 10-24 | 1,684 | 1,413 | 71 | 293 | 3,461 |
| 25-49 | 380 | 524 | 1 | 110 | 1,015 |
| 50-99 | 125 | 241 | 3 | 36 | 405 |
| 100+ | 39 | 132 | 0 | 14 | 185 |
| Total 5+ | 6,623 | 4,712 | 584 | 974 | 12,893 |
While delivery trucks and other commercial vehicles received only 20 percent of bus lane and bus stop tickets, they were the most likely to be high-frequency offenders. Among those vehicles that received 25 or more violations, 56 percent had commercial licenses.
As online shopping, grocery stores, and restaurants proliferate throughout the five boroughs, delivery vehicles have become more common and have had greater difficulty finding legal, curbside spots to drop off their wares. Too often, bus lanes and stops have become the solution to that problem – to the detriment of SBS and local bus service and all public transit riders.
Recommendations
Over the last decade, bus ridership in New York City has nosedived and many local routes have become less reliable, slower, and increasingly outdated. While Select Bus routes have performed slightly better, there is ample room for improvement. To ensure faster and more reliable service, the City and MTA should consider the following recommendations:
The City and State should dramatically improve bus stop and bus lane enforcement
To improve bus speeds and reliability, the City must double down on traffic enforcement. This will require a more aggressive police presence in the vicinity of bus lanes and bus stops, as well as more strategic, hot-spot enforcement in areas where violations have clustered.
The state legislature, meanwhile, should move to expand the use of camera enforcement. At the moment, fixed-location cameras are only authorized along 16 routes between 7am and 7pm.[7] This cap on routes and hours of operation should be lifted.
City DOT should upgrade the design of bus lanes
In cities throughout the world, bus lanes are physically separated from general traffic via bollard, curb, median, or an elevated road surface. These measures help prevent interference from cars and trucks, vastly improving the effectiveness of separated lanes.
Moving forward, the City should pursue similar measures in select locations. By leveraging traffic violation data – and street camera footage more generally – the City DOT can pinpoint priority areas and build physically protected lanes to deter scofflaws.
Expedite the implementation of Transit Signal Priority
From London to Los Angeles, Seattle to Sydney, Transit Signal Priority has proven to be an effective strategy for keeping buses moving through traffic lights and congested streets. New York, unfortunately, has fallen behind these peer cities – as well as Brussels, Dublin, Barcelona, Montreal, and Zurich – rolling out TSP at a much slower rate.
Not only must New York dramatically increase its pace of adoption, it should also explore more advanced technologies. In London, for instance, the Split Cycle Offset Optimization Technique balances bus priority with the movement of other vehicles, ensuring that TSP is not disruptive to general traffic. It also has the capability to identify buses that are running late and provide them with enhanced signal priority. New York City has long considered a similar upgrade, but has yet to do so.[8]
The City and MTA should take a more holistic approach to bus enhancements
As documented in the Comptroller’s recent report, The Other Transit Crisis, commuting patterns have changed dramatically in the last quarter century, as new employment hubs emerge throughout the city and ridership grows in the off-peak hours.[9] To accommodate these changes, the MTA should conduct a top-to-bottom review of its bus system and realign routes to better serve contemporary ridership patterns.
The City DOT should work side-by-side in these efforts, coordinating curb enhancements, traffic signal priority, and street improvements (like bus lanes and two-way streets) in conjunction with new and enhanced routes.
Ultimately, the City and MTA should not confine these important bus upgrades to SBS service. High peak and off-peak frequencies, all-door boarding, transit signal priority, curb extensions, efficient stop-spacing, and well designed, enforced, and strategically-located bus lanes should be characteristic of every local bus route, not just select bus service.
Acknowledgements
Comptroller Scott M. Stringer thanks Adam Forman, Chief Policy & Data Officer and the lead author of this report. He also recognizes the important contributions made by David Saltonstall, Assistant Comptroller for Policy; Angela Chen, Senior Web Developer and Graphic Designer; Jessica Silver, Assistant Comptroller for Public Affairs; Arelis Hernandez-Cruz, Director of Community Affairs; and Tyrone Stevens, Director of Communications.
Endnotes
[1] Office of the Comptroller. “The Human Cost of Subway Delays: A Survey of New York City Riders,” July 8, 2017.
[2] For individual routes: Bus Turnaround Coalition. “Bus Report Cards.” Data for October 2017.
For system averages: Speed data from “Bus Performance Dashboard” and OTP data compiled by the MTA for the year 2016.
Note: Speed is for peak and non-peak for local routes and on-time performance is for 2016. SBS routes from Bus Turnaround Campaign. All data from October 2017.
[3] http://www.nyc.gov/html/brt/downloads/pdf/brt-transit-signal-priority-july2017.pdf
[4] New York City DOT and MTA. “Introduction to Bus Rapid Transit Phase II.”
Note: Calculation does not include Q44
[5] NYC Open Data, “Open Parking and Camera Violations,” April 3, 2018.
[6] New York City DOT. “New York City Bus Lane Camera Enforcement: Program Review 2015-2017,” December 2017.
[7] Mundy, Deborah, Mark Trompet, Judith M Cohen, Daniel J Graham. “The Identification and Management of Bus Priority Schemes,” Imperial College of London. April 2017.
[8] Mundy. “The Identification and Management of Bus Priority Schemes,” April 2017.
[9] Office of the Comptroller. “The Other Transit Crisis,” November 2017.