Left in the Dark: How the MTA Is Failing to Keep Up With New York City’s Changing Economy
A Changing Economy, A Stagnant Transit System
Nurses and home health aides. Bank tellers and baristas. Shopkeepers and cashiers. Security guards and janitors. Waiters and cooks. Concierges and tour guides. Barbers and tailors. Musicians and actors. Ushers and ticket takers. Freight and dock workers.
For many of New York’s service sector workers, the traditional Monday-to-Friday, 9-to-5 work week holds little bearing. While others are just rolling out of bed, they are opening up shops, loading and unloading goods, staffing front desks, or caring for patients. Later in the evenings—long after others have gone home—they are locking up stores and restaurants, vacuuming and dishwashing, and finishing up in the dressing room.
Today, the healthcare, hospitality, retail, food services, and entertainment industries account for 40 percent of private sector jobs in New York City. And while these industries added more than 350,000 employees in the last decade, as this report from Comptroller Scott M. Stringer outlines, the Metropolitan Transit Authority (MTA) continues to operate their subways and buses as if they served a 9-to-5 clientele.[i] In the city that never sleeps, a growing number of New Yorkers are literally being left in the dark.
Despite emphasizing the “expansion of non-peak work travel” and “fewer traditional 9-to-5 jobs” in numerous planning documents and presentations, the MTA has failed to respond to changing ridership patterns in recent years.[ii] This divergence of supply and demand originated in 2010, when the MTA made service cuts in the wake of the Great Recession. While the city and state economy have roared back since that time, off-peak service has remained flat.
From 2000 to 2010, for instance, the number of train cars entering and exiting the Manhattan hub closely tracked passenger growth in the early morning. Since 2010, however, while ridership continued to surge between 5 a.m. and 7 a.m., the MTA did not respond accordingly—leaving riders to wait longer for more crowded trains (see Chart 1).
Chart 1: Subway service to and from the Manhattan hub has not kept pace with growing ridership in the early morning (5 a.m. to 7 a.m.)
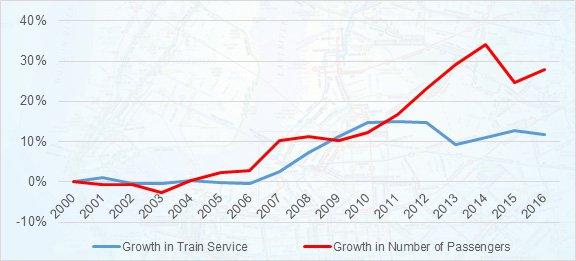
New York Metropolitan Transportation Council. “2016 Hub Bound Travel.”
The failure to respond to surging off-peak ridership has left many service workers in the lurch—compromising their quality of life and threatening their livelihoods. Indeed, arriving just a few minutes late can mean not just an inconvenience for their customers, but also a sharp reprimand, docked pay, or even termination.[iii]
More broadly, infrequent and unreliable subway service is detrimental to the city’s economy. As an earlier report by the Comptroller’s Office made clear, MTA subway delays cost the City an estimated $389 million a year in lost productivity for businesses and lost wages for workers, many of whom work in off-peak hours.[iv]
It is time for the MTA to more fully recognize that the city’s economy is changing and to respond accordingly. With more frequent service in off-peak hours, workers will be able to get where the need to go, when they need to get there.
Beyond the Nine-to-Five
The MTA’s underinvestment in off-peak service is acutely felt by service workers, immigrants, and people of color.
In fact, New Yorkers departing for work during “traditional” hours (7 a.m. to 9 a.m.) have very different economic profiles than “non-traditional” subway and bus commuters. Those commuting between 5 a.m. and 7 a.m. earn $7,000 less than their rush hour counterparts and are more likely to be foreign born, a person of color, without a bachelor’s degree, and working in the service sector (see Chart 2).
Chart 2: Economic profile of traditional and non-traditional subway and bus commuters
| “Traditional”
Commuters (depart 7 a.m. – 9 a.m.) |
“Non-Traditional” Commuters
(depart 5 a.m. – 7 a.m.) |
|
| Median Income | $42,300 | $35,000 |
| Bachelor’s Degree or Higher (Age 25+) | 52% | 31% |
| Foreign Born | 47% | 56% |
| Person of Color | 64% | 78% |
| Work in Healthcare, Hospitality, Retail, Food Services, or Cultural industries | 36% | 40% |
| Growth in the Last Quarter Century | 17% | 39% |
United States Census Bureau. American Community Survey 2012-2016 5-Year Estimates.
These non-traditional commuters represent a growing contingent of MTA ridership. In the last quarter century, for instance, the number of subway and bus commuters departing for work outside of “traditional hours” rose by 39 percent, from 254,922 to 355,019. The number of “traditional” commuters, meanwhile, grew by only 17 percent.[v] Traditional commuters now account for 53 percent of all transit commuters, down from 61 percent in 1990 (see Chart 3).
Chart 3: The share of subway and bus commuters departing for work during “traditional hours” (7 a.m. – 9 a.m.) is falling

United States Census Bureau. American Community Survey 2012-2016 5-Year Estimates.
These changes in commuting and working patterns are reflected, of course, in subway ridership trends and figures. In 1985, for instance, 49 percent of daily ridership into the Manhattan central business district occurred between 7 a.m. and 9 a.m. By 2015, this figure had dropped precipitously. Ridership is now more evenly dispersed throughout the day, with the 7 a.m. to 9 a.m. time period accounting for only 28 percent of Manhattan-bound ridership (see Chart 4).
Chart 4: Subway ridership into Manhattan hub, share entering from 7 a.m. to 9 a.m.

New York Metropolitan Transportation Council. “2016 Hub Bound Travel.”
Left in the Dark
The MTA, unfortunately, has failed to respond to these trends. From 2010 to 2016, ridership in and out of the Manhattan hub jumped by 14 percent in the early morning and by 13 percent in the evening. The number of trains supplied by the MTA, however, did not keep pace, falling by three percent between 5 a.m. to 7 a.m. and rising by a meager three percent between 7 p.m. to 11 p.m. (see Chart 5).
Chart 5: Subway service in and out of the Manhattan hub did not keep pace with growing ridership in the early morning and evening from 2010 to 2016
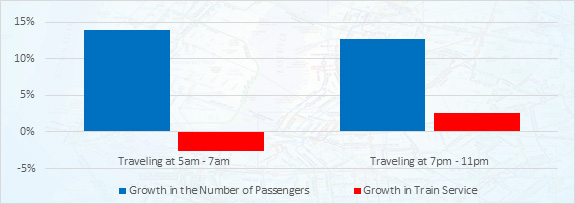
New York Metropolitan Transportation Council. “2016 Hub Bound Travel.”
And while the MTA may be restricted from increasing frequencies in peak hours due to aging infrastructure and underinvestment, these capacity constraints are less relevant in the early morning and late evening. In fact, the MTA runs 60 percent fewer trains from 5 a.m. to 6 a.m. than it does from 8 a.m. to 9 a.m. and 38 percent fewer from 9 p.m. to 10 p.m. (see Chart 6). Clearly, there is ample train and track capacity at these hours.
Chart 6: The number of trains beginning their route each hour
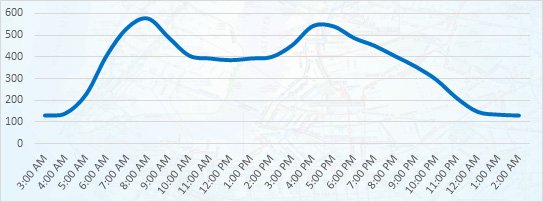
New York City Transit Authority. “Static Data Feeds: General Transit Feed Specification,” MTA.
This dramatic decline in off-peak subway service, of course, leads to significantly longer wait times for riders. During the morning rush hour, for instance, 87 percent of subway lines run more than six trains per hour and 36 percent run more than 12. That means that passengers will rarely wait more than five or ten minutes for a train—provided all goes well.
By contrast, in the evening (8:30 p.m. to 10:30 p.m.) and early morning (5:30 a.m. to 6:30 a.m.)—when a growing number of workers depend on public transit—subway service is significantly diminished. Just 47 percent of subway lines maintain headways of less than 10 minutes in the evening and only 10 percent maintain frequencies of less than 5 minutes. In the early morning, meanwhile, only 43 percent have headways of less than 10 minutes and zero have headways of less than five minutes (see Chart 7).[vi]
Chart 7: In the evenings and early mornings, few train lines offer frequent service
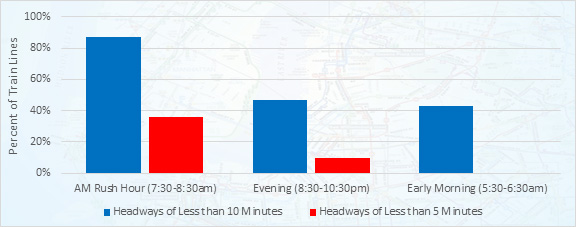
New York City Transit Authority. “Static Data Feeds: General Transit Feed Specification,” MTA.
Looking at individual lines, the biggest drop-offs in the early morning are on the 1, 6, 7, B, and W trains, where hourly throughput declines by more than 50 percent in the peak direction, as compared to the A.M. rush. In the evening hours, the 4, 5, A, B, and F lines experience a similar fall in service (see Chart 8).
Chart 8: Subway Line Frequencies
| Subway Line | Trains per Hour,
A.M. Rush (7:30-8:30a.m.) |
Trains per Hour,
Early Morning (5:30-6:30a.m.) |
Drop in Service | Trains per Hour,
Evening (8:30-10:30p.m.) |
Drop in Service |
| 1 | 18 | 8 | -56% | 12.5 | -31% |
| 2 | 12 | 8 | -33% | 6.5 | -46% |
| 3 | 11 | 7 | -36% | 6.5 | -41% |
| 4 | 15 | 9 | -40% | 7.5 | -50% |
| 5 | 12 | 9 | -25% | 5.5 | -54% |
| 6 (Local) | 15 | 7 | -53% | 11 | -27% |
| 7 (Local) | 26 | 11 | -58% | 15 | -42% |
| 6 (Express) | 12 | 3 | -75% | 0 | -100% |
| 7 (Express) | 13 | 2 | -85% | 4.5 | -65% |
| A | 14 | 9 | -36% | 6.5 | -54% |
| B | 10 | 4 | -60% | 5 | -50% |
| C | 8 | 5 | -38% | 5 | -38% |
| D | 10 | 6 | -40% | 5.5 | -45% |
| E | 15 | 8 | -47% | 8.5 | -43% |
| F | 14 | 8 | -43% | 6.5 | -54% |
| FS | 6 | 4 | -33% | 5 | -17% |
| G | 9 | 8 | -11% | 7.5 | -17% |
| GS | 24 | 9 | -63% | 12.5 | -48% |
| J | 9 | 5 | -44% | 6 | -33% |
| L | 19 | 10 | -47% | 15 | -21% |
| M | 17 | 12 | -29% | 11 | -35% |
| N | 8 | 6 | -25% | 6 | -25% |
| Q | 12 | 7 | -42% | 7 | -42% |
| R | 10 | 12 | 20% | 6 | -40% |
| W | 7 | 1 | -86% | 5.5 | -21% |
| Z | 4 | 0 | -100% | 0 | -100% |
New York City Transit Authority. “Static Data Feeds: General Transit Feed Specification,” MTA.
Fifteen neighborhoods, in particular, are adversely affected by paltry early morning service. Each of these neighborhoods shares the following key factors:
- a) Has more than 10,000 jobs in service industries with non-traditional hours,
- b) These industries account for over 50 percent of all local jobs, and
- c) Subway service between 5:30 a.m. and 6:30 a.m. is at least 40 percent less than the morning peak just an hour later (see Chart 9).
Chart 9: Neighborhoods with large service sectors, but a significant decline in subway service in the early morning
| Neighborhood | Retail, Restaurant, Health, Hotel, and Cultural Employment | Total Employment | Share | Trains per hour A.M. Rush (7:30-8:30a.m.) | Trains per hour Early Morning (5:30-6:30a.m.) | Decline in Service A.M. Rush to Early Morning |
| Lenox Hill-Roosevelt Island | 41,427 | 56,306 | 74% | 42 | 21 | -50% |
| Upper East Side-Carnegie Hill | 34,060 | 65,898 | 52% | 173 | 66 | -62% |
| Borough Park | 28,203 | 45,762 | 62% | 55 | 27 | -51% |
| Upper West Side | 21,054 | 35,902 | 59% | 64 | 31 | -52% |
| East Village | 19,590 | 24,902 | 79% | 63 | 26 | -59% |
| Forest Hills | 18,673 | 29,070 | 64% | 86 | 38 | -56% |
| Park Slope-Gowanus | 18,180 | 30,872 | 59% | 130 | 70 | -46% |
| Flushing | 18,039 | 29,055 | 62% | 38 | 17 | -55% |
| East Harlem South | 17,939 | 26,449 | 68% | 54 | 23 | -57% |
| Washington Heights South | 14,503 | 18,437 | 79% | 57 | 27 | -53% |
| Jamaica | 13,480 | 20,614 | 65% | 69 | 34 | -51% |
| Van Nest-Morris Park-Westchester Square | 13,328 | 20,264 | 66% | 20 | 11 | -45% |
| Chinatown | 12,543 | 20,246 | 62% | 88 | 38 | -57% |
| Midwood | 11,371 | 17,128 | 66% | 18 | 10 | -44% |
| Elmhurst | 11,232 | 14,608 | 77% | 136 | 54 | -60% |
Jobs: United States Census Bureau. “LEHD Origin-Destination Employment Statistics.” 2015.
Bus Frequencies: New York Transit Authority. “Static Data Feeds: General Transit Feed Specification,” MTA.
Among these fifteen neighborhoods, meanwhile, six experienced a decline of over 30 percent in evening subway service—just as shifts are ending, stores are closing, shows are being let out, and people are finishing up at the restaurant or bar (see Chart 10).
Chart 10: Neighborhoods with large service sectors, but a significant decline in subway service in the evening
| Neighborhood | Retail, Restaurant, Health, Hotel, and Cultural Employment | Total Employment | Share | Trains per hour A.M. Rush (7:30-8:30a.m.) | Trains per hour Evening (8:30-10:30p.m.) | Decline in Service A.M. Rush to Evening |
| Upper East Side-Carnegie Hill | 34,060 | 65,898 | 52% | 173 | 117.5 | -32% |
| Forest Hills | 18,673 | 29,070 | 64% | 86 | 59.5 | -31% |
| East Harlem South | 17,939 | 26,449 | 68% | 54 | 36.5 | -32% |
| Jamaica | 13,480 | 20,614 | 65% | 69 | 45.5 | -34% |
| Chinatown | 12,543 | 20,246 | 62% | 88 | 62 | -30% |
| Elmhurst | 11,232 | 14,608 | 77% | 136 | 91 | -33% |
Jobs: United States Census Bureau. “LEHD Origin-Destination Employment Statistics.” 2015.
Bus Frequencies: New York Transit Authority. “Static Data Feeds: General Transit Feed Specification,” MTA.
Inadequate off-peak service is not, of course, exclusive to the subway system. As documented in the Comptroller’s recent report, The Other Transit Crisis, bus routes also experience substantial declines in service throughout the day (see Chart 11). In fact, the ratio of peak-to-trough service is even more dramatic for buses (12:1) than it is for subways (4.5:1).
Chart 11: The number of buses beginning their route each hour

NYCT Bus and MTA Bus Company. “Static Data Feeds: General Transit Feed Specification,” MTA.
The decline in off-peak service produces longer wait times for buses. During the morning rush hour, for instance, 50 percent of routes run more than six buses per hour and 14 percent run more than 12 per hour. As a result, passengers can expect to wait less than five or ten minutes on those high-frequency lines.
In the early morning (5:30 a.m. to 6:30 a.m.) and evening (8:30 p.m. to 10:30 p.m.), however, only 22 percent and 9 percent of bus routes have wait times of less than 10 minutes, respectively. Meanwhile, only four percent of routes maintain frequencies of less than 5 minutes in the early morning and less than one percent of routes do so in the evening (see Chart 12).[vii]
Chart 12: In the early mornings and evenings, few bus routes offer frequent service

NYCT Bus and MTA Bus Company. “Static Data Feeds: General Transit Feed Specification,” MTA.
Recommendations
While New York City’s ailing transit system has received significant attention in recent months, much of the conversation has centered on failing infrastructure, overcrowding, disinvestment, and skyrocketing delays—particularly during rush hour.[viii] Lost in this debate is a broader conversation on shifting ridership trends and commuting patterns. Yet as the city’s service sector grows, its employment hubs become more diffuse, leisure patterns change, and tourism swells, a focus on off-peak transit service is long overdue.
While New York has long been known as the “city than never sleeps,” it is truer today than ever. Unfortunately, the MTA has not kept pace with these changes, as their subway and bus frequencies plummet after AM and PM rush hours. This should be rectified, with more frequent service to accommodate their growing off-peak ridership—and to lure those riders who avoid public transit on account of paltry off-peak service.
Importantly, this boost in off-peak frequencies should be coupled with a comprehensive review of MTA scheduling—or “vehicle headway”—guidelines. At the moment, these service standards are entirely reactive to existing ridership, providing additional service only when subways and buses are overcrowded. This fails to consider latent (or “induced”) demand that accompanies an increase in frequencies.
Moving forward, the MTA should amend their “vehicle headway” guidelines to allow for more sophisticated analyses of latent ridership. They could draw from data sources beyond current ridership—like cell phone data or business employee data—to better understand travel patterns and optimize service. This will allow the MTA to proactively enhance service in order to stimulate ridership.
Acknowledgements
Comptroller Scott M. Stringer thanks Adam Forman, Chief Policy & Data Officer and the lead author of this report. He also recognizes the important contributions made by David Saltonstall, Assistant Comptroller for Policy; Jacob Bogitsh, Policy Analyst for Economic Development; Archer Hutchinson, Web Developer and Graphic Designer; Angela Chen, Senior Web Developer and Graphic Designer; Zachary Schechter-Steinberg, Deputy Policy Director; Tammy Gamerman, Director of Budget Research; Tyrone Stevens, Press Secretary; and Devon Puglia, Director of Communications.
[i] New York State Department of Labor, “Quarterly Census of Employment and Wages.” 2006-2016.
[ii] MTA. “Looking Ahead: A Context for the Next Twenty Year Needs Assessment,” July 2013. http://web.mta.info/mta/news/books/docs/TYN_Vision_7-22-13.pdf.
[iii] “The Human Cost of Subway Delays: A Survey of New York City Riders,” Office of the New York City Comptroller. July 8, 2017.
[iv] “The Economic Cost of Subway Delays,” Office of the New York City Comptroller. October 1, 2017.
[v] United States Census Bureau. American Community Survey 2012-2016 5-Year Estimates.
[vi] In this analysis, each subway line is treated as two—or one for each direction. For instance, if Line W was frequent in both directions, Line X was frequent in one direction, and Line Y was frequent in neither direction, we would say that half of the subway lines run frequent service.
[vii] In this analysis, each bus route is treated as two—or one for each direction.
[viii] “The Human Cost of Subway Delays: A Survey of New York City Riders,” Office of the New York City Comptroller. July 8, 2017.