Making the Grade 2017
Executive Summary
New York City is home to the most diverse business community in the country, and the success of New York City’s minority- and women-owned businesses (M/WBEs) – which collectively employ almost 600,000 New Yorkers – is critical to the city’s economy.1 This is particularly the case in communities where business owners are confronting today’s deep affordability crisis while facing long entrenched economic disparities.
The City has the ability to confront both of these challenges by choosing to purchase goods and services from M/WBEs that are likely to use those funds to grow jobs, invest locally, and create wealth in all corners of the five boroughs.2 In addition, by contracting with a diverse array of businesses, the City fosters the competition needed to spend taxpayer dollars most efficiently. Consequently, a vibrant M/WBE program is vital for the fiscal and economic health of the City and its communities.
Since 2014, the Office of New York City Comptroller Scott M. Stringer has annually evaluated the performance of the City and its individual agencies on their spending with M/WBEs.3 Building on that previous work, this year’s report provides both an analysis of the City’s 2017 M/WBE performance and a more comprehensive review of the M/WBE program as a whole since 2014.
The City has made tangible progress since 2014. In 2015, Mayor de Blasio set a goal of awarding $16 billion to M/WBEs by 2025.4 Building on that commitment, in September 2016, the Mayor designated high-level City Hall personnel to oversee the M/WBE program and committed the City to awarding 30 percent of the dollar value of contracts to M/WBEs by 2021 while increasing the number of certified M/WBEs to 9,000 by 2019.5 In May 2017, the City announced that it was on its way to meeting the $16 billion goal and had grown the number of certified firms to over 5,000.6 And, more recently, the City’s Fiscal Year (FY) 2017 Agency Procurement Indicators Report found that the City had increased its M/WBE procurement awards from $463.5 million in FY 2015 to $1.037 billion in FY 2017.7
While these announcements demonstrate positive steps forward, this report finds that there is ample room for continued progress. Specifically, in FY 2017:
- The City procured a total of $21 billion in goods and services, of which slightly more than $1 billion, or only 4.9 percent, was awarded to M/WBEs.8
- Only 22 percent of New York City’s 5,259 certified M/WBEs received City spending.
- Overall, the City received a “D+” grade from the Comptroller’s Office, the same as in FY 2016. More specifically, the City earned a C grade with Asian American-owned firms, a D grade with Hispanic-owned firms and women-owned firms, and an F grade with Black-owned businesses.
- Compared to FY 2016, grades increased at 13 agencies, but decreased at seven agencies and stayed the same at 11 agencies. Overall, 42 percent of agencies saw their grade increase in the last year.
- Three agencies received an “A” grade, the Commission on Human Rights, the Department for the Aging, and the Department of Small Business Services, while four agencies received “F” grades, the Department of Buildings, the Department of Citywide Administrative Services, the Department of Sanitation, and the Department of Transportation. Notably, the combined amount spent overall for the three agencies that received an “A” grade is less than one percent of the dollars graded in FY 2017, while the 13 agencies that received either a “D” or “F” grade account for 89 percent of the City’s grade.
With the FY 2017 analysis complete, the Comptroller’s Office has analyzed the last four years of data on the City’s M/WBE program and found that:
- M/WBE awards, as a share of total City contracts, increased from 3.9 percent in FY 2014 to 4.9 percent in FY 2017, although a high of 5.3 percent was reached in FY 2015.
- Annual spending with M/WBEs increased to $554 million in FY 2017, a $208 million increase since FY 2014.
- The number of City-certified M/WBEs increased from 4,115 in FY 2015 to 5,259 in FY 2017 and the percentage of M/WBEs that received spending increased from 18 percent to 22 percent during this time.
- Compared to FY 2014, more City agencies are receiving “A” and “B” grades while fewer are receiving “D” and “F” grades in FY Specifically, in FY 2014, only two agencies earned an “A” or “B” while 21 received a “D” or “F,” compared to FY 2017, when 12 agencies earned an “A” or “B” and 13 received a “D” or “F.”
The City must continue to make progress to meet its important goal of awarding 30 percent of the dollar value of contracts to M/WBEs by 2021. Indeed, City leadership on this issue is of national importance, as New York and the nation face the potential for federal disinvestment in programs that support M/WBEs, including a proposal by President Trump to eliminate the Minority Business Development Agency (MBDA) and cut funding for the Small Business Administration (SBA).9 For that reason, this report also makes a number of policy recommendations that will help the City attain the Mayor’s goals and increase its spending with M/WBEs. Specifically, this report calls on the City to take the following steps:
- The City should assess large contracts with upcoming renewals and consider re- bidding those contracts to create new M/WBE opportunities. A number of the City’s largest contracts will reach their conclusion in the coming years, presenting an opportunity for the City to evaluate whether they should be renewed or re-bid. That decision is made on a case-by- case However, through re-bidding and “debundling” them into smaller contracts, greater procurement opportunities could exist for M/WBEs. For instance, in FY 2017, the City’s largest vendors received $2.3 billion in City spending. These vendors collectively hold 148 contracts ending over the next four years with a combined total value of $4.5 billion.10 Local Law 1 already requires the City to review new procurements over $10 million to examine whether they should be “debundled.” Although this law does not require the City to conduct the same review of large renewal contracts, the City should still determine whether it is appropriate to exercise renewal or to re-bid at the point of expiration.
- A working group composed of all certifying bodies and relevant stakeholders from the City and State should convene to streamline the M/WBE certification process and move towards a single platform for certification. Currently, there are more than 10 institutions that certify businesses in New York City that are owned by minorities, women, or other historically disadvantaged groups. Even with recent improvements, the redundancy within the various certification processes poses a barrier to firms seeking to certify across multiple government agencies. The City should work with other certifying entities to simplify the process and make it easier for M/WBEs to become certified across multiple government The Office of the New York City Comptroller will work collaboratively with interested parties to pursue this goal.
- Every City agency should hire a full time Chief Diversity Officer to focus exclusively on M/WBE accountability. Local Law 1 requires every agency to designate an executive officer as an M/WBE Officer, but the application of this requirement is uneven, and it does not require the M/WBE Officer to focus full time on supplier In order to drive compliance, each agency should hire a Chief Diversity Officer (CDO). Similar to the M/WBE Officer, the CDO would report directly to the agency head. However, M/WBE accountability would be the full time focus of the CDO, rather than just one part of their larger portfolio. This directive could be given by City Hall, or could be accomplished through City Council legislation to create long term sustainability beyond any one administration.
As with previous years, these findings are based on a review of 32 City agencies: 31 mayoral agencies and the Office of the Comptroller. The grades are based on actual spending with M/WBEs during the fiscal year rather than the value of contracts awarded, because the value of contracts may or may not result in real dollars being spent over time. Therefore, the grades represent an assessment of the City’s real-time utilization of M/WBEs, rather than an estimate of future year M/WBE spending.
History of New York City’s M/WBE Program
New York City’s M/WBE program has its roots in the 1990s when the City commissioned its first disparity study to evaluate the availability of M/WBEs capable of performing work for the City and determine whether those businesses were underutilized in City procurement. The M/WBE program has evolved over time and is currently enshrined in Local Law 1 of 2013.
Recent Progress
In 2016, the City announced the creation of the Mayor’s Office of M/WBEs and set the goal of doubling the number of certified M/WBEs from 4,500 to 9,000 by 2019 and awarding 30 percent of the dollar value of City contracts to M/WBEs by 2021.20 Since that time, the City has taken several actions that have helped grow the number of certified firms to over 5,000 and increase the amount awarded to M/WBEs to $1.037 billion in FY 2017.21 These steps include:
- Awarding Contracts: In January 2017, the New York City Department of Housing Preservation and Development (HPD) announced that eight M/WBE teams had been selected to lead the construction of six new affordable housing developments on City-owned.22 While these agreements do not count towards Local Law 1 M/WBE goals because of their procurement methods, they still result in M/WBEs receiving City contracts.
- Creating Community Partnerships: February 2017, new community partnerships were announced to help M/WBEs certify or re- certify with the City and improve their profiles in the City’s M/WBE Directory. The directory provides agency contracting officers with a searchable list of certified businesses that includes contact information and details on the goods or services these firms could provide to the City.23
- Providing Financing: In March 2017, the City launched a Contract Financing Loan Fund to enable M/WBEs to apply for low-interest contract financing loans of up to $500,000, increasing the ability of firms to gain access to 24 The City disbursed $865,575 between the launch in March 2017 and the end of FY 2017.25
- Improving Certification: Also in March 2017, the City reduced the number of duplicative and unnecessary tax documents applicants needed to submit to become certified. To further expedite the certification process, the City also created a separate, simplified certification application for small businesses owned and operated by a sole propietor26
In addition to these New York City-led initiatives, the New York State Legislature and New York City Council also passed legislation that has the potential to increase opportunities for M/WBEs and the City.27
- The New York State Legislature passed a bill that eliminates the requirement that M/WBEs have a personal net worth of less than $3.5 million in order to participate in the State M/WBE program.28 This is in line with New York State’s most recent disparity study, released subsequent to this passage, which disputes the assumption that high personal net worth ensures more equal access to business 29 As the study found, M/WBEs experience discrimination in the credit market regardless of personal net worth, creating a barrier to obtaining the capital that is necessary for completing government contracts. The bill would allow these firms to benefit from programs designed to combat that discrimination and increase business capacity. This legislation will also have a tremendous impact on minority asset managers, who often function as investors with both the City and the State.
- The New York State Legislature passed a bill that will allow the Procurement Policy Board to raise New York City’s micropurchase spending threshold for goods and services to $150,000 from the current threshold of $20,000.30 This will allow for shorter procurement timelines that are more aligned with firm sizes, giving M/WBEs a better chance to compete.
- The New York City Council passed a bill explicitly prohibiting discrimination against firms owned by minorities, women, or LGBTQ individuals when they bid on contracts. This codifies anti- discrimination protections to every business owner who bids on City contracts.31
M/WBE Contract Awards
As shown in Chart 1 below, M/WBE awards, as a share of total City procurement, increased from 3.9 percent in FY 2014 to 4.9 percent in FY 2017, although it reached a high of 5.3 percent in FY 2015.
Chart 1:
M/WBE Share of City Procurement, FY 2007 – FY 2017
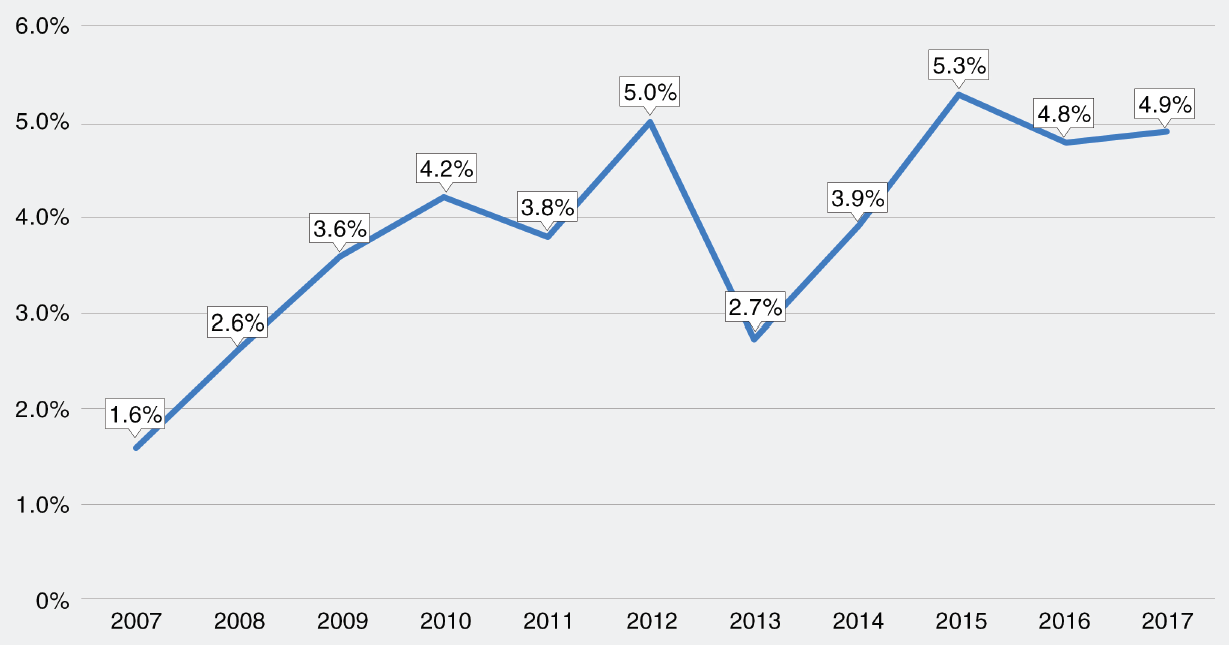
Source: Mayor’s Office of Contract Services Agency Procurement Indicators: Fiscal Years 2007 to 2017, and OneNYC: Minority and Women-Owned Business Enterprise Bulletin, Sept. 2015.
In FY 2017, the City awarded $1.037 billion to M/WBE firms, up from $696.5 million in FY 2016 and $463.5 million in FY 2015.32 Similarly, annual spending with M/WBE firms has also increased, growing to $554 million in FY 2017, a $208 million increase since FY 2014.33 While these increases represent important progress, the share of City procurement awarded to M/WBE firms remains under five percent of total procurement.
Spending and Certification
While the City has worked aggressively to certify new M/WBEs, there remains a low correlation for M/WBEs between certification and securing City business. As shown in Chart 2 below, the number of City-certified M/WBEs increased from 4,115 in FY 2015 to 5,259 in FY 2017 while the number of M/WBEs that received spending increased from 18 percent to 22 percent during this time.
Chart 2:
Certified M/WBEs Receiving Spending: FY 2015, FY 2016, and FY 2017
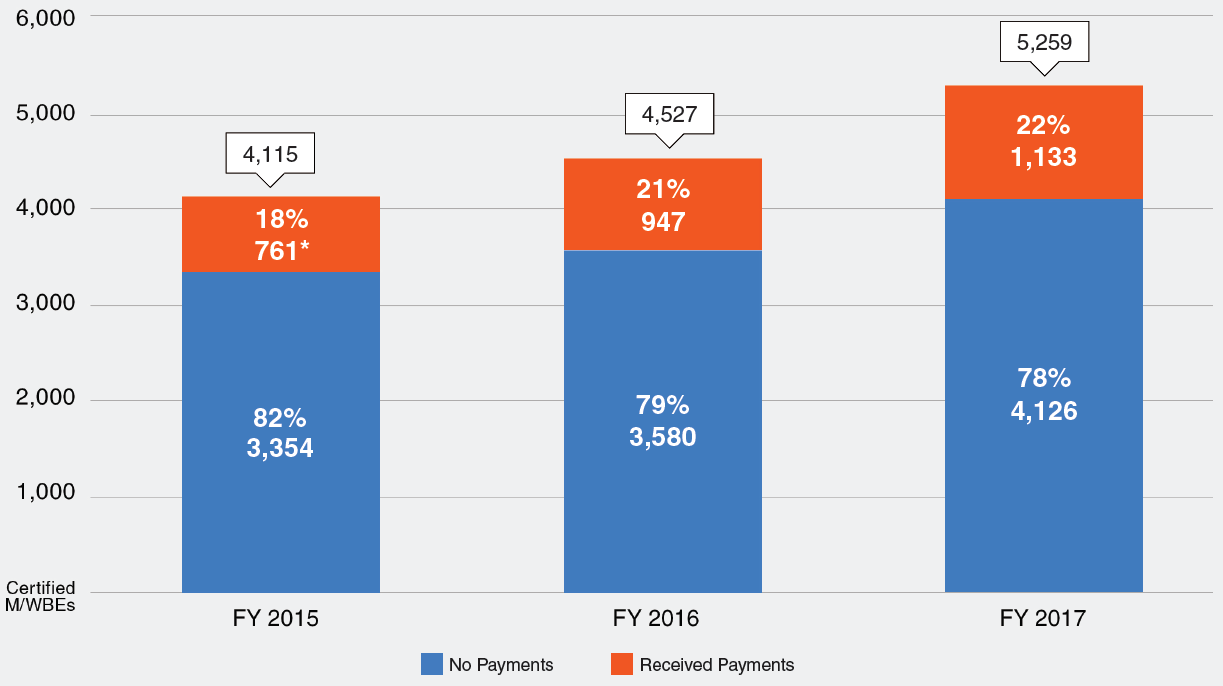
Table 1:
M/WBE Prime and Sub-vendors FY 2015, FY 2016, and FY 2017
| Year | Number Certified M/WBEs | Prime Vendors | Sub-vendors** | Prime and Sub-vendors |
| FY 2015 | 4,115 | 668 | 121 | 28 |
| FY 2016 | 4,527 | 741 | 272 | 66 |
| FY 2017 | 5,259 | 889 | 329 | 85 |
*M/WBEs that received payments is a unique count, taking into account the M/WBEs who worked as both prime vendors and sub-vendors. Source: Small Business Services Online M/WBE Database and Checkbook NYC. Checkbook NYC data is drawn from the NYC Financial Management System. Payments made to subcontractors but not reported do not appear.
As shown in Table 1, of the 5,259 M/WBEs that received City spending in FY 2017, 889 received prime vendor payments while only 329 received sub-vendor payments. 85 M/WBEs that received prime vendor payments also received sub-vendor payments.34
Citywide Grades
As with prior Making the Grade reports, the 31 mayoral agencies graded are subject to Local Law 1 M/WBE participation goals. The grades are based on actual spending within FY 2017, rather than on the value of contracts awarded, which may or may not result in payments being received by M/WBEs.35
Overall, the City’s grade for FY 2017 remains unchanged at “D+.” The City earned a “C” grade with Asian American-owned firms, a “D” grade with Hispanic-owned firms and women-owned firms, and an “F” grade with Black-owned businesses. The City earned a “D” in FY 2014 and received a “D+” in both FY 2015 and FY 2016.
Agency Grades
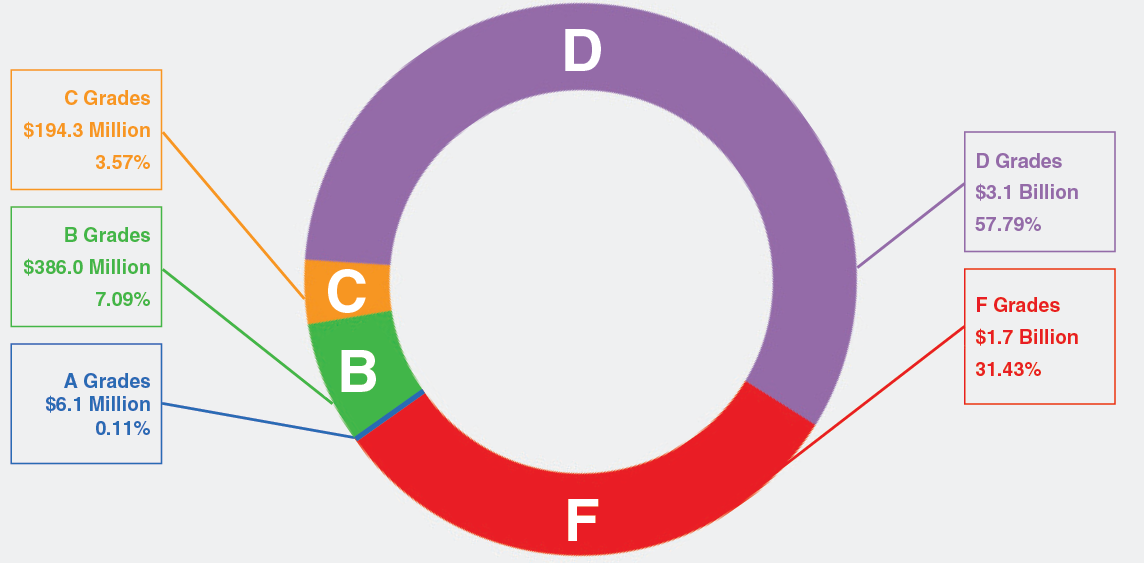
In FY 2017, of the 31 mayoral agencies, three received an “A,” nine received a “B,” six received a “C,” and 13 received a “D” or “F” grade. Although a number of agencies increased their spending with M/WBEs, the combined amount spent by the three agencies that received an “A” is less than one percent of the dollars graded in FY 2017, while the 13 agencies that received either a “D” or “F” grade account for 89 percent of the City’s grade. For this reason, as shown in Chart 3, the city’s overall grade remained a “D+” despite an increase in M/WBE spending by several agencies.
Chart 3:
Composition of Citywide M/WBEE Grades by Eligible Spending, FY 2017
 Source: Checkbook NYC.
While not a mayoral agency, the Comptroller’s Office has graded annually in this report and received a “B” in FY 2017. Table 2 provides each agency’s assigned grade and compares grades from FY 2017 to the last three fiscal years (FY 2014, FY 2015, and FY 2016). Additional information about individual agency grades is available in Appendix A.
Table 2:
Comparison of FY 2017, FY 2016, FY 2015 and FY 2014 Grades
| Agency Name | FY17 | FY16 | FY15 | FY14 | FY16 -FY17 Change |
| Commission on Human Rights | A | B | C | C | 1 |
| Department for the Aging | A | B | C | D | 1 |
| Department of Small Business Services | A | B | F | D | 1 |
| Civilian Complaint Review Board | B | D | C | C | 2 |
| Department of Consumer Affairs | B | B | C | D | No Change |
| Department of Cultural Affairs | B | C | C | B | 1 |
| Department of Health and Mental Hygiene | B | C | C | C | 1 |
| Department of Housing Preservation and Development | B | A | A | D | 1 |
| Department of Parks and Recreation | B | C | C | D | 1 |
| Department of Youth and Community Development | B | C | C | C | 1 |
| Landmarks Preservation Commission | B | C | B | B | 1 |
| NYC Taxi and Limousine Commission | B | D | D | D | 2 |
| Administration for Children’s Services | C | C | C | C | No Change |
| Business Integrity Commission | C | F | D | D | 2 |
| Department of City Planning | C | B | C | C | 1 |
| Department of Probation | C | D | D | C | 1 |
| Fire Department | C | C | D | D | No Change |
| Office of Administrative Trials and Hearings | C | D | C | D | 1 |
| Department of Correction | D | C | D | D | 1 |
| Department of Design and Construction | D | D | C | D | No Change |
| Department of Environmental Protection | D | D | F | F | No Change |
| Department of Finance | D | C | D | F | 1 |
| Department of Homeless Services | D | D | D | D | No Change |
| Department of Information Technology and Telecommunications | D | D | D | F | No Change |
| Human Resources Administration | D | D | D | D | No Change |
| Law Department | D | C | D | C | 1 |
| Office of Emergency Management | D | D | D | D | No Change |
| Department of Buildings | F | F | D | D | No Change |
| Department of Citywide Administrative Services | F | D | D | D | 1 |
| Department of Sanitation | F | F | F | F | No Change |
| Department of Transportation | F | D | D | D | 1 |
| Office of the Comptroller | B | B | C | C | No Change |
Overall, in FY 2017, 13 grades increased, 11 remained the same, and seven declined, meaning that 42 percent of agencies increased their grade since FY 2016. Three agencies—the Commission on Human Rights, the Department for the Aging, and the Department of Small Business Services—received an “A” grade for the first time while the sole “A” grade recipient of FY 2016—the Department of Housing Preservation and Development—fell to a “B” in FY 2017.
Nine agencies—the Department of Environmental Protection, the Department of Homeless Services, the Department of Information Technology and Telecommunications, the Human Resources Administration, the Office of Emergency Management, the Department of Buildings, the Department of Citywide Administrative Services, the Department Sanitation, and the Department of Transportation— have received “D” or “F” grades in each of the last four years. In FY 2017, three agencies dropped from a “C” to a “D,” the Department of Correction, the Department of Finance, and the Law Department. Similarly, the Department of Citywide Administrative Services and the Department of Transportation fell from a “D” to an “F,” while the Department of Buildings and Sanitation failed to raise their FY 2016 “F” grade and remained at that level in FY 2017.
As shown in Chart 4 below, FY 2017 marked the highest number of “A” and “B” grades awarded in the previous four years. However, the number of agencies receiving an “F” grade also grew. The number of agencies receiving a “C” or “D” grade declined, as was also the case in FY 2016.
Chart 4:
Agency Letter Grades, FY 2014, FY 2015, FY 2016, and FY 2017
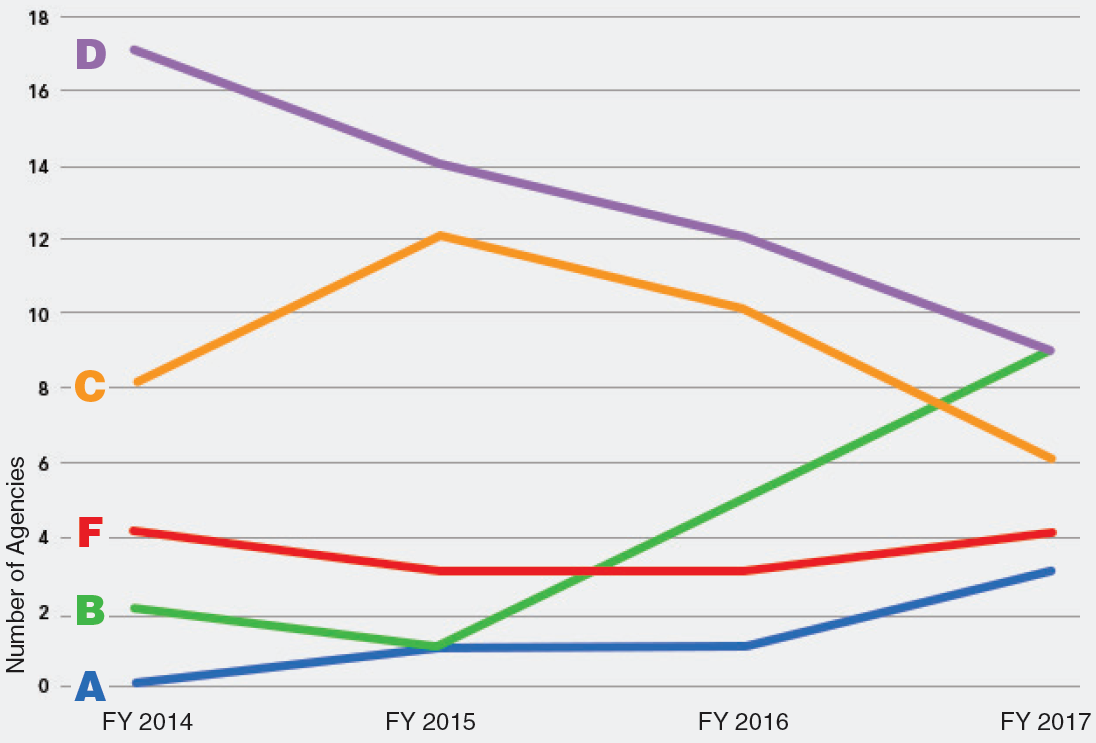
Since FY 2014, more City agencies are receiving “A” and “B” grades while fewer are receiving “D” and “F” grades. In FY 2014, two agencies earned an “A” or “B” while 21 received a “D” or “F” compared to FY 2017, when 12 agencies earned an “A” or “B” and 13 received a “D” or “F.”
The improvement in grades reflects the fact that agencies have increased their spending with M/WBEs in the last four years. Specifically, 13 agencies have seen their M/WBE spending increase by more than ten percent since FY 2014 while only six have seen the annual percent of M/WBE spending fall during this time.
Methodology
To calculate each grade, the Comptroller’s Office relied on Checkbook NYC, its online transparency website, which uses information entered into the City’s centralized Financial Management System (FMS) by agency staff. The FY 2017 spending data for each agency was extracted, analyzed by the population and industry categories established in Local Law 1, and then compared against the Local Law 1 Citywide M/WBE participation goals.
As with each year’s report, grades for FY 2017 are based on total spending by each agency across the four Local Law 1 industry categories and the Local Law 1 defined groups within each industry classification. It is important to note, however, that while the industry classifications and groups set forth in Local Law 1 were applied, this is not intended to be a Local Law 1 compliance report. Rather, it is a report detailing overall agency spending with M/WBEs in FY 2017, expressed both in dollars and as a percentage of total agency spending.
Certain spending not subject to Local Law 1—such as payroll, human services, and land acquisition— was removed from the grade calculations, along with categories where specific agencies had no relevant business (i.e., construction participation goals were removed from the calculation of agencies that perform no construction). The results were then weighted to account for the agency’s spending in different industry categories (professional services, standard services, construction, and goods).
For example, if an agency spent 50 percent of its procurement budget on construction, then 50 percent of its grade is based on meeting the construction participation goals under Local Law 1. After weighting, scores were assigned a value and converted into a letter grade. While certain additional exclusions do exist, they are limited in number and do not mirror the exempted procurement award methods listed in Local Law 1. Rather, the exclusions are based on the availability (or lack thereof) of M/WBEs to meet agency procurement requirements within a particular award method or contract type.
The worksheets used to calculate each agency grade appear in Appendix B and a complete explanation of the report’s methodology can be found in Appendix D. Subcontract data for each agency can be found in Appendix C
Strategies to Increase M/WBE Utilization
This report has now analyzed four fiscal years of agency data, observing some progress but little overall growth in procurement awards with M/WBEs.To accelerate the City’s growth, this report includes several recommendations that the City can pursue as part of its efforts to achieve 30 percent utilization of M/WBEs.
Recommendation: The City should assess large contracts with upcoming renewals and consider re-bidding those contracts to create new M/WBE opportunities. A review of disparity studies conducted by the U.S. Minority Business Development Agency, which included New York City, found that 60 percent of M/WBEs named large project sizes as a barrier to public contracting.36 Indeed, in the past three years, the City awarded 100 contracts above $25 million, and only two were awarded to M/WBEs.37 A number of these large contracts will reach their conclusion in the coming years, presenting an opportunity for the City to evaluate whether they should be renewed or re-bid. While that decision is made on a case-by-case basis, through re-bidding and “debundling” them into smaller contracts, more procurement opportunities could exist for M/WBEs. In addition, the City may consider asking prime vendors to voluntarily allocate more work to M/WBE subcontractors.
For instance, in FY 2017, the City’s largest vendors received $2.3 billion in City spending, as demonstrated in Table 3 and Chart 5. However, only $95.4 million of that, or 4.2 percent, was spent with M/WBEs, including one M/WBE prime vendor receiving $72,676,147 and 69 M/WBE sub-vendors collectively receiving $22,754,162.38 These top vendors hold 148 contracts that are ending within the next four years, with a combined total value of $4.5 billion.39 Therefore, substantial opportunity to increase M/WBE spending exists in the coming years.
Table 3:
Largest Businesses Receiving City Dollars in FY 2017*
| Prime Vendor Name | Prime Minority Status | All Spending | M/WBE Prime Spending | M/WBE Sub Spending | Percent M/WBE Spending |
| Liro Program & Construction Management, PC | Non-Minority | $158,697,452 | $0 | $3,385,801 | 2.1% |
| CDW Government LLC | Non-Minority | $154,279,390 | $0 | $0 | 0.0% |
| Waste Management Of New York LLC | Non-Minority | $148,571,894 | $0 | $0 | 0.0% |
| Ace American Insurance Co. | Non-Minority | $145,186,098 | $0 | $0 | 0.0% |
| Leon D. Dematteis Construction Corp. | Non-Minority | $135,443,804 | $0 | $0 | 0.0% |
| Telesector Resources Group Inc. A Verizon Services Group | Non-Minority | $102,353,142 | $0 | $0 | 0.0% |
| FJC Security Services, Inc. | Non-Minority | $98,645,160 | $0 | $0 | 0.0% |
| Mill Basin Bridge Constructors LLC | Non-Minority | $93,742,292 | $0 | $5,610,580 | 6.0% |
| Citnalta Construction Corp. | Non-Minority | $86,931,204 | $0 | $0 | 0.0% |
| Arnell Construction Corp. | Non-Minority | $86,727,982 | $0 | $0 | 0.0% |
| International Business Machines Corp. | Non-Minority | $84,864,121 | $0 | $0 | 0.0% |
| Tishman Construction Corporation of NY | Non-Minority | $83,094,977 | $0 | $1,182,385 | 1.4% |
| Apple Inc. | Non-Minority | $75,085,906 | $0 | $0 | 0.0% |
| Adam’s European Contracting Inc. | Women | $72,676,147** | $72,676,147 | $0 | 100% |
| SLSCO LP | Non-Minority | $72,067,823 | $0 | $3,378,465 | 4.7% |
| Covanta Sustainable Solutions LLC | Non-Minority | $71,774,211 | $0 | $0 | 0.0% |
| FJ Sciame Construction Co Inc. | Non-Minority | $69,943,232 | $0 | $0 | 0.0% |
| Tully Construction Co. Inc. | Non-Minority | $68,526,045 | $0 | $2,399,653 | 3.5% |
| John Picone Inc. | Non-Minority | $64,857,223 | $0 | $533,773 | 0.8% |
| Koch Skanska, Inc. | Non-Minority | $64,825,156 | $0 | $881 | 0.0% |
| EW Howell Co LLC | Non-Minority | $64,118,734 | $0 | $0 | 0.0% |
| Welsbach Electric Corp. | Non-Minority | $60,762,863 | $0 | $147,550 | 0.2% |
| Kiewit-Shea Constructors, AJV | Non-Minority | $59,512,249 | $0 | $24,890 | 0.0% |
| Restani Construction Corp. | Non-Minority | $58,324,011 | $0 | $52,557 | 0.1% |
| WDF Inc. | Non-Minority | $58,187,732 | $0 | $5,142,198 | 8.8% |
| Volmar Construction Inc. | Non-Minority | $58,156,226 | $0 | $895,429 | 1.5% |
| Total | $2,297,355,074 | $72,676,147 | $22,754,162 | 4.2% |
Source: Checkbook NYC. *Checkbook NYC Data is drawn from the NYC Financial Management System. Payments made to subcontractors but not reported do not appear. **Adam’s European Contracting Inc. received $21,043,908 in City spending in FY 2017 as a non-minority firm before certifying as a woman- owned firm in October 2017. Once certified as an M/WBE, the company received $51,632,239, totaling $72,676,147 for FY 2017.
Chart 5: M/WBE Share of Spending among Largest Vendors, FY 2017
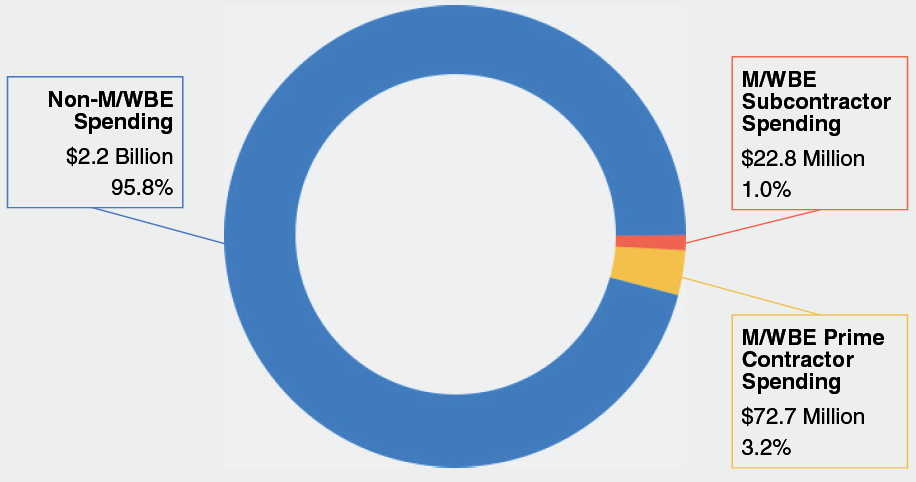
Source: Checkbook NYC.
*Checkbook NYC Data is drawn from the NYC Financial Management System. Payments made to subcontractors but not reported do not appear.
Although not all of these contracts have renewal terms, the renewal or expiration of these contracts may be an opportune time to engage large vendors and encourage an increase in M/WBE utilization, depending on the circumstances. For that reason, where appropriate, the City should have an ongoing dialogue with its largest vendors to ensure that M/WBE opportunities are thoroughly considered. While contracts are not renegotiated when renewed, nothing would prevent a vendor from voluntarily increasing M/WBE utilization. During this process, large vendors who have not engaged M/WBE subcontractors should be formally encouraged to do so.
In addition, if not being renewed, the City should explore the opportunity to re-bid and then debundle these large contracts into smaller contracts. Local Law 1, as well as its precursor, Local Law 129, requires the City Chief Procurement Officer (CCPO) to review new procurements valued over $10 million to evaluate whether it is practicable and fiscally advantageous to debundle them.40 However, this has not led to a decrease in large-scale contracts. In fact, there has been a slight increase in the number of large contracts approved by the City every year since FY 2014, as noted in Chart 6.41 This strategy could be particularly effective for agencies with “F” grades, given that in FY 2017, three of the four agencies with failing grades procured $3.9 billion in large contracts.42
Chart 6:
Large Contract Approvals FY 2014, FY 2015, FY 2016, and FY 2017
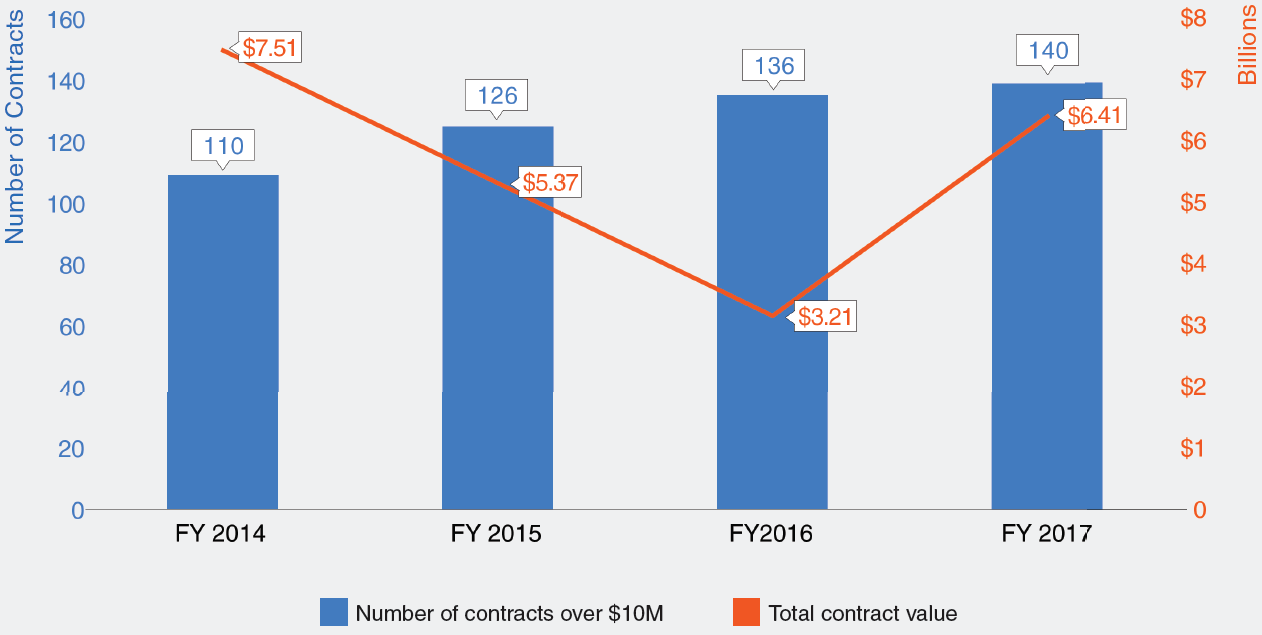
Source: MOCS Agency Procurement Indicators: Fiscal Years 2014 to 2017
Although Local Law 1 does not require the City to conduct the same debundling review of large renewal contracts, the City should still determine whether it is appropriate to exercise renewal or to re-bid at the point of expiration. This is especially true for those contracts that were let prior to Local Law 1 or Local Law 129. Under those circumstances where the CCPO has previously determined that it was not practicable or advantageous to debundle a contract, or where competition among M/WBEs would not be enhanced, it is worth revisiting such a determination at the time of renewal. This is because the facts or circumstances supporting the CCPO’s previous decision could have changed over the course of the contract. For example, a procurement could have been approved five years ago under the premise that it was one indivisible project with only one vendor available. There might now be more firms available to conduct that work, including M/WBEs; the City may find that the nature of the services have changed; or the project may now require multiple procurements, rather than one indivisible procurement.
With M/WBEs already struggling to compete for larger procurements, debundling contracts as appropriate could create greater opportunities for M/WBEs.43 This would require a comprehensive agency-level spending analysis that identifies the future buying power of New York City including all contracts with upcoming renewals, separate from agencies’ annual Local Law 63 procurement plans. In addition, in order to allow sufficient time for the competitive process, agencies would need to conduct a market analysis of available M/WBEs at least one year prior to contracts’ renewal or rebidding, under the leadership of an agency Chief Diversity Officer.
Recommendation: A working group composed of all certifying bodies and relevant stakeholders from the City and State should convene to streamline the M/WBE certification process and move towards a single platform for certification. Currently, there are more than 10 institutions that certify businesses in New York City who are at least 51 percent owned by minorities, women, or other historically disadvantaged groups. These institutions include the US Small Business Administration, NY NJ Supplier Diversity Council, National Gay and Lesbian Chamber of Commerce, United States Business Leadership Network, Women’s Presidents Organization, Empire State Development, Port Authority of New York and New Jersey, New York School Construction Authority, Metropolitan Transportation Authority, and New York City Department of Small Business Services.
The existing M/WBE certification programs face a number of challenges that must be addressed in order to increase M/WBE utilization. At the outset, each individual certifying agency has its own separate, multi-month process for approving applications. For example, anecdotal reports indicate that the average processing time is three to four months with the New York City Department of Small Business Services, three months with the Port Authority of New York and New Jersey, and one to two months with the U.S. Small Business Administration. Further, if after multiple rounds of review, a business is denied M/WBE certification from the City due to an incomplete application, that business is barred from reapplying for three months.
M/WBE firms seeking to become certified at the local, state, and federal level must complete separate applications for each level of government. Although attempts toward universal certification have been made in the past, underlying rules or laws governing each agency’s certification process prevent multiple agencies from using the same application. Fast Track applications and memoranda of understanding with third party certification bodies have been created, but M/WBEs are still required to complete multiple lengthy applications that often ask for similar information. Consequently, the redundancy within the various certification processes poses an additional barrier to firms seeking to certify across multiple government agencies, which is particularly true for M/WBEs in industries that work with multiple levels of government. For example, in the technology industry, M/WBEs may need to certify with both the City and the State because City agencies often select vendors from pre-negotiated State lists.
To address these challenges, a working group should be convened of all certifying bodies and relevant stakeholders to streamline the certification process through technology and move toward a universal certification system. By improving certification programs, the City would encourage more M/WBE firms to become certified and have access to a stronger and more diverse pool of M/WBEs, which would foster competition and help grow the City’s economy.
In addition, the working group could develop solutions to other certification challenges such as the City’s Emerging Business Enterprise (EBE) Program, which was designed to ensure the inclusion of businesses that are socially and economically disadvantaged. In FY 2014, the EBE Program had only certified three businesses, and has only added four businesses since.44 An opportunity exists to support a diverse group of business owners who may be eligible for the program, including businesses owned by Lesbian, Gay, Bisexual, or Transgender (LGBT) persons, people with disabilities, and veterans. Growing the number of EBE-certified firms could be done by targeting these business owners directly, many of whom already have certifications that are not currently recognized by the City but are recognized in the private sector and by other states and municipalities.
Recommendation: Every City agency should hire a full time Chief Diversity Officer (CDO) to focus exclusively on M/WBE accountability. This report has previously recommended that the City hire a Citywide CDO to report directly to the Mayor in order to drive compliance and focus exclusively on M/WBE strategy, spending, reporting, and accountability. At the agency level, Local Law 1 also requires agency heads to designate a direct report, such as a deputy commissioner or other executive officer, to be held accountable for the agency’s M/WBE initiatives.45 While each agency may have made this designation, the City should take a more aggressive approach. Each agency should have a full-time, executive-level CDO. This role will be essential to agencies’ analysis of contracts for re-bidding and debundling. This directive could be given by City Hall, or could be accomplished through City Council legislation to create long term sustainability beyond any one administration.
This is critical because the current application of the Local Law 1 requirement for M/WBE Officers is uneven and does not require full time focus on supplier diversity. In reality, most executive-level M/WBE officers charged with increasing M/WBE utilization hold additional agency-wide responsibilities, making M/WBE utilization just one part of their portfolios. The responsibilities of M/WBE Officers are often passed to staff who do not have direct influence on agency policy. In addition, among agencies where CDOs are already in place, responsibilities are not uniform. Some CDOs are focused on employee diversity and others are focused on supplier diversity.
A full-time, executive-level CDO would be particularly effective for agencies with the largest procurement budgets and lowest M/WBE spend, such as the Department of Sanitation. The agency received an “F” grade for four consecutive years and spent less than four percent of its M/WBE-eligible dollars with M/WBEs in FY 2017. Notably, the Department of Sanitation procured more than any other agency in FY 2017 and awarded the City’s largest contract this fiscal year, which was valued at $2.75 billion and had no M/WBE goals.46
One example of successful deployment of a CDO is within the Department of Design and Construction (DDC). While DDC still has significant room for improvement, earning a “D” grade for two consecutive years, the agency has increased its M/WBE spend by $470 million since it brought on a CDO in FY 2014. DDC’s CDO, who reports directly to the Commissioner, focuses exclusively on M/WBE utilization and is responsible for ensuring that the agency complies with and is accountable to the City in its M/WBE program. In addition, since 2014, the number of employees working under the direction of the CDO has grown from four to 15.
Data and Methodology
Comptroller Stringer is committed to boosting M/WBE procurement in City agencies. A core part of that effort is improving transparency through an annual evaluation of the City’s performance on M/WBE spending.
This report focuses on 31 mayoral agencies that account for the vast majority of M/WBE spending. In addition, the Comptroller’s Office has been graded.
While both the Police Department (NYPD) and the Department of Investigation (DOI) are required to submit utilization plans under Local Law 1 (LL 1) and have significant spending, neither are given grades due to a prior agreement under which their individual vendor data is not included in Checkbook NYC for security reasons. As Checkbook NYC is the source of all agency spending data analyzed in this report, these agencies cannot be included.
As with gradebooks in FY 2015 and FY 2016, all certified M/WBE subcontractor payments subject to LL 1 entered into PIP by prime vendors are included in the agency letter grade calculations. M/WBE subcontractor payments default to the industry and contract characters of the prime contracting vendor.
As described below, agency grades are the result of a six-step process that compares agency spending with M/WBE certified vendors to total agency procurement spending in four industry categories established by Local Law 1: Construction, Professional Services, Standard Services, and Goods (contracts less than $100,000). The ratio of M/WBE spending to total spending is then compared to the specific citywide participation goals laid out in LL 1 to determine a final grade based on performance.
Data
Availability
The FY 2017 spending transactions for prime vendors and their subcontractors used in this report were downloaded from Checkbook NYC. The analysis calculates spending by the agency listed as the contracting agency—the agency that registered a given contract and is directly responsible for not only setting contract specific participation goals, but also monitoring the contractor’s progress in meeting those goals.
Responsibility for Completeness
The Checkbook NYC data used in this report originated from the City’s Financial Management System (FMS). In a significant percentage of spending, no award category was available in FMS, making it difficult to identify the industry in which the spending took place.
To correct for any missing data, the Comptroller’s Office examined data from the expense category field in FMS and matched entries with industry data where possible. Using expense category data is less reliable than contract type and award category data, but including it provides a more accurate overall picture of agency spending than not including it. A percentage of spending could not be classified using this method and was therefore excluded from the calculations.
Methodology
The following methodology was used to calculate each agency’s grade. Each agency’s individual grade calculation can be found in Appendix B.
Step 1:
To calculate the FY 2017 M/WBE-eligible spending per industry, or the denominator, the transactions for Construction, Professional Services, Standard Services, and Goods (less than $100,000) were added and totaled. Transactions labeled Individuals & Others, Human Services, Unknown, or Unclassified, as well as expense categories, contract types, and award methods that met specific criteria were not included.Those criteria cover transactions that are not subject to LL1, do not represent true procurement opportunities, and where there is no M/WBE availability.
Step 2:
The analysis includes a weighted-average proportional to the spending in a given industry. For example, if 75 percent of an agency’s M/WBE-eligible disbursements are Professional Services, 15 percent Standard Services, five percent Construction, and five percent Goods (less than $100,000), then the final grade is most influenced by the Professional Services spending, as that is where the agency spends the greatest amount.
For each industry—Construction, Professional Services, Standard Services, and Goods (less than $100,000) — the spending is divided by Step 1 to determine the percentage of total eligible spending in a given industry category.
Step 3:
To calculate the FY 2017 LL 1 spending with M/WBE vendors, or the numerator, the transactions for each industry—Construction, Professional Services, Standard Services, and Goods (less than
$100,000)—were added and totaled for Black American, Asian American, Hispanic American, and Women, respectively.
Step 4:
The FY 2017 LL 1 M/WBE spending as a percent of the eligible spending is calculated by dividing M/WBE spending (Step 3) by total eligible spending (Step 1) per industry and M/WBE category.
Step 5:
To determine M/WBE spending as a percentage of relevant LL 1 participation goals, Step 4 was divided by the LL 1 participation goals. For example, if an agency spent four percent of its FY 2017 construction funds with a certain M/WBE category when the LL 1 goal is 8 percent, then that agency only reached 50 percent of the target. Note that Asian American Professional Services is not calculated since Local Law 1 has no goal for that category.
Step 6:
Each M/WBE category was assigned a score based on its weighted-average across the four industries using the following formula:
| 80% – 100% | 5 |
| 60% – 79% | 4 |
| 40% – 59% | 3 |
| 20% – 39% | 2 |
| 0% – 19% | 1 |
Next, the average of the four numbers was assigned a grade using the following formula:
| 4.25 – 5.00 A | A |
| 3.25 – 4.00 B | B |
| 2.25 – 3.00 C | C |
| 1.25 – 2.00 D | D |
| 0.00 – 1.00 F | F |
Grading Scale Rationale
The goal of this report is to drive behavioral change in agency procurement practices. With this in mind, assigning letter grades allows agencies to easily see where their efforts to do business with M/WBEs have succeeded or failed – creating a simple metric to help bring positive changes to procurement practices.
The model here is designed to reflect the principle that agencies must focus on hitting participation goals across all M/WBE categories in industries that make up their procurement. It does not provide high grades for agencies that did exceptionally well in one category yet perform poorly in others.
Acknowledgments
Comptroller Scott M. Stringer thanks Wendy Garcia, Chief Diversity Officer; Jessica Silver, Assistant Comptroller for Public Affairs and Chief of Strategic Operations; Patricia Dayleg, Policy and Outreach Diversity Officer; Zachary Steinberg, Deputy Policy Director; and David Saltonstall, Assistant Comptroller for Policy for their leadership in researching and writing this report.
Comptroller Stringer recognizes the important contributions to this report made by:
Diana Benjamin, Deputy Chief Diversity Officer; Edward Sokolowski, Executive Director of Systems Development and Program Management; Troy Chen, Executive Director of App Development and Web Administration; Archer Hutchinson, Graphic Designer; Stephen Giannotti, Deputy CIO, Applications & Development, Information Systems; Mike Bott, Assistant Comptroller for Technology/Chief Information Officer; Sofiya Minsariya, Summer Intern; Jouly Lajara, Summer Intern; Elizabeth Bird, Policy Analyst; Lisa Flores, Deputy Comptroller for Contracts and Procurement; Christian Stover, Bureau Chief, Contract Administration; Kathryn Diaz, General Counsel; Marvin Peguese, Deputy General Counsel; Amedeo D’Angelo, Deputy Comptroller for Administration; Bernarda Ramirez, Division Chief, Procurement Services; and Alaina Gilligo, First Deputy Comptroller.
Endnotes
- S. Census Bureau. “Statistics for All U.S. Firms by Industry, Gender, and Race for the U.S., States, Metro Areas, Counties and Places: 2012.” 2012 Survey of Business Owners (SB1200cCSA01). The Comptroller’s Office has documented the persistent economic disparities in New York City in numerous publications including in the 2016 “Making the Grade” report and a report titled “The New Geography of Jobs: A Blueprint for Strengthening NYC Neighborhoods.” Both reports can be found on the Comptroller’s website at: http://comptroller.nyc.gov/wp-content/uploads/documents/Making-the-Grade-2016.pdf and http://comptroller.nyc.gov/reports/the-new-geography-of-jobs-a-blueprint-for-strengthening-nyc-neighborhoods/.
- http://www.nmsdc.org/wp-content/uploads/Economic_Impact_Report_FINAL.pdf
- https://comptroller.nyc.gov/reports/making-the-grade/overview/
- The City’s $16 billion goal under the OneNYC program includes certain non-mayoral agencies. See: https://www1.nyc.gov/assets/mocs/downloads/pdf/MWBEReports/OneNYC%20MWBE%20Bulletin%20FY2015%20and%20FY2017.pdf
- http://www1.nyc.gov/office-of-the-mayor/news/775-16/mayor-de-blasio-bold-new-vision-the-city-s-m-wbe-program/#/0
- http://www1.nyc.gov/office-of-the-mayor/news/343-17/de-blasio-administration-reaches-5-000-city-certified-m-wbes
- https://www1.nyc.gov/assets/mocs/downloads/pdf/MWBEReports/2017_AgencyProcurementIndicators.pdf
- https://www1.nyc.gov/assets/mocs/downloads/pdf/MWBEReports/2017_AgencyProcurementIndicators.pdf
- https://www.whitehouse.gov/sites/whitehouse.gov/files/omb/budget/fy2018/com.pdf and https://www.washingtonpost. com/graphics/politics/trump-presidential-budget-2018-proposal/?utm_term=.ea4e643a7c29
- Checkbook NYC. Top vendors excludes human services, unions, government agencies, and other quasi- governmental entities. See: http://checkbooknyc.com/
- City of Richmond J. A. Croson Co. 488 U.S. 469 (1989)
- http://www.nytimes.com/1992/02/11/nyregion/dinkins-plan-gives-minority-concerns-more-in-contracts.html
- http://www.nytimes.com/1994/01/25/nyregion/giuliani-revamps-minority-program-on-city-contracts.html
- http://legistar.council.nyc.gov/View.ashx?M=F&ID=665596&GUID=DD91681B-1401-4DF8-8F55-6A06AAF0C5E1
- http://www.nyc.gov/html/ddc/downloads/pdf/obo/law05129.pdf
- http://legistar.council.nyc.gov/View.ashx?M=F&ID=2375736&GUID=327B6D05-3876-4522-B09C-45B75CE54AB1
- http://legistar.council.nyc.gov/View.ashx?M=F&ID=2262141&GUID=A43AAEF2-26EA-4033-887F-A035ADC0B967
- http://www1.nyc.gov/office-of-the-mayor/news/652-15/de-blasio-administration-over-1-6-billion-minority-women-owned-business
- http://www1.nyc.gov/office-of-the-mayor/news/775-16/mayor-de-blasio-bold-new-vision-the-city-s-m-wbe-program/#/0
- http://www1.nyc.gov/office-of-the-mayor/news/775-16/mayor-de-blasio-bold-new-vision-the-city-s-m-wbe-program/#/0
- http://www1.nyc.gov/office-of-the-mayor/news/343-17/de-blasio-administration-reaches-5-000-city-certified-m-wbes
- http://www1.nyc.gov/office-of-the-mayor/news/019-17/mayor-bill-de-blasio-m-wbe-firms-win-bids-build-hundreds-affordable-homes-six/#/0
- http://www1.nyc.gov/office-of-the-mayor/news/069-17/mayor-de-blasio-new-partnership-boost-m-wbe-contracting-opportunities
- http://www1.nyc.gov/office-of-the-mayor/news/169-17/de-blasio-administration-new-revolving-loan-fund-help-m-wbes-gain-access-capital
- https://www1.nyc.gov/assets/mocs/downloads/pdf/MWBEReports/FY17%20MWBE%20Compliance%20Report.pdf
- http://www1.nyc.gov/office-of-the-mayor/news/169-17/de-blasio-administration-new-revolving-loan-fund-help-m-wbes-gain-access-capital
- These New York State and City bills have passed both houses of the State legislature and the City Council respectively. They are currently awaiting final approval from the Office of the New York State Governor and the Office of the New York City
- http://nyassembly.gov/leg/?term=2017&bn=A02819 and https://www.nysenate.gov/legislation/bills/2017/S3018
- The New York State Disparity study notes that limiting the size of eligible businesses criterion was considered to be a means to avert a legal challenge. It calls the personal net worth certification criterion excessive. It recommends that certain assets be removed, i.e. life insurance, pension benefits, stock investments, and other personal property requirements. https://esd.ny.gov/sites/default/files/Vol_%20III_NYS_PersonalNetWorth.pdf
- http://nyassembly.gov/leg/?bn=A08508&term=2017 and https://www.nysenate.gov/legislation/bills/2017/S6513/amendment/B
- http://legistar.council.nyc.gov/LegislationDetail.aspx?ID=2895217&GUID=1613D9B6-3995-4194-9CBF- 2DE496AF4702
- https://www1.nyc.gov/assets/mocs/downloads/pdf/MWBEReports/2017_AgencyProcurementIndicators.pdf
- The FY 2014 Making the Grade report found that the City spent a total of $346.4 million with M/WBEs. See: https://comptroller.nyc.gov/wp-content/uploads/documents/Making_the_Grade.pdf
- Checkbook NYC. See: http://checkbooknyc.com/
- While Local Law 1 compliance reports measure progress towards goals in agency utilization plans, they are based on projected spending off the registered value of contracts that can often span multiple years, rather than actual spending with M/WBEs, which is a less meaningful measure of success.
- https://www.mbda.gov/sites/mbda.gov/files/migrated/files-attachments/ContractingBarriers_pdf
- According to the City’s Procurement Indicators Report, in FY 2017 there was one contract for $29.9 million awarded to an M/WBE, in FY 2016 there was one contract for $34.9 million awarded to an M/WBE, and in FY 2015 there were no contracts above $25 million awarded to M/WBEs. See: https://www1.nyc.gov/site/mocs/resources/publications.page
- Checkbook NYC; excludes human services, unions, government agencies, and other quasi-governmental entities. See: http://checkbooknyc.com/
- Checkbook NYC. See: http://checkbooknyc.com/
- Local Law 1 of 2013 http://www.nyc.gov/html/ddc/downloads/pdf/obo/NYC_Local_Law_1.pdf
- According to the City’s Procurement Indicator’s Report there were 110 large contracts awarded in FY 2014, 126 large contracts awarded in FY 2015, 136 large contracts awarded in FY 2016 and 140 large contracts awarded in FY See: https://www1.nyc.gov/site/mocs/resources/publications.page
- According to the City’s Procurement Indicator’s Report Appendix J, the Department of Citywide Administrative Services had $309.2 million in large contracts approved, the Department of Transportation had $496.3 million in large contracts approved, and Department of Sanitation had $3.1 billion in large contracts approved. See: https://www1. nyc.gov/site/mocs/resources/AppendicesIndicatorsFY17.page
- https://www1.nyc.gov/assets/mocs/downloads/pdf/MWBEReports/2017_AgencyProcurementIndicators.pdf
- New York City Department of Small Business Services Directory, current as of 10/17/2017 http://mtprawvwsbswtp1-1.gov/Search.aspx
- http://www.nyc.gov/html/ddc/downloads/pdf/obo/NYC_Local_Law_1.pdf
- https://www1.nyc.gov/assets/mocs/downloads/pdf/MWBEReports/2017_AgencyProcurementIndicators.pdf