
A Message from New York City Comptroller Brad Lander

Dear Reader,
As I conclude my term as New York City Comptroller, I am proud to share that the New York City Retirement Systems have made historic progress in advancing equity and inclusion across our investment portfolio.
When I entered office four years ago, our systems did not transparently report or even clearly track how many of our assets were managed by Minority- and Women-Owned Business Enterprises (MWBEs). We fixed that right away, because you can’t manage what you don’t measure. And then we really got to work.
Over the past four years, the percentage of U.S.-based actively managed assets invested with MWBE managers has grown from 11.6% (in Fiscal Year 2022) to 14.6% (at the end of Fiscal Year 2025). That’s a growth rate of over 25% over my term.
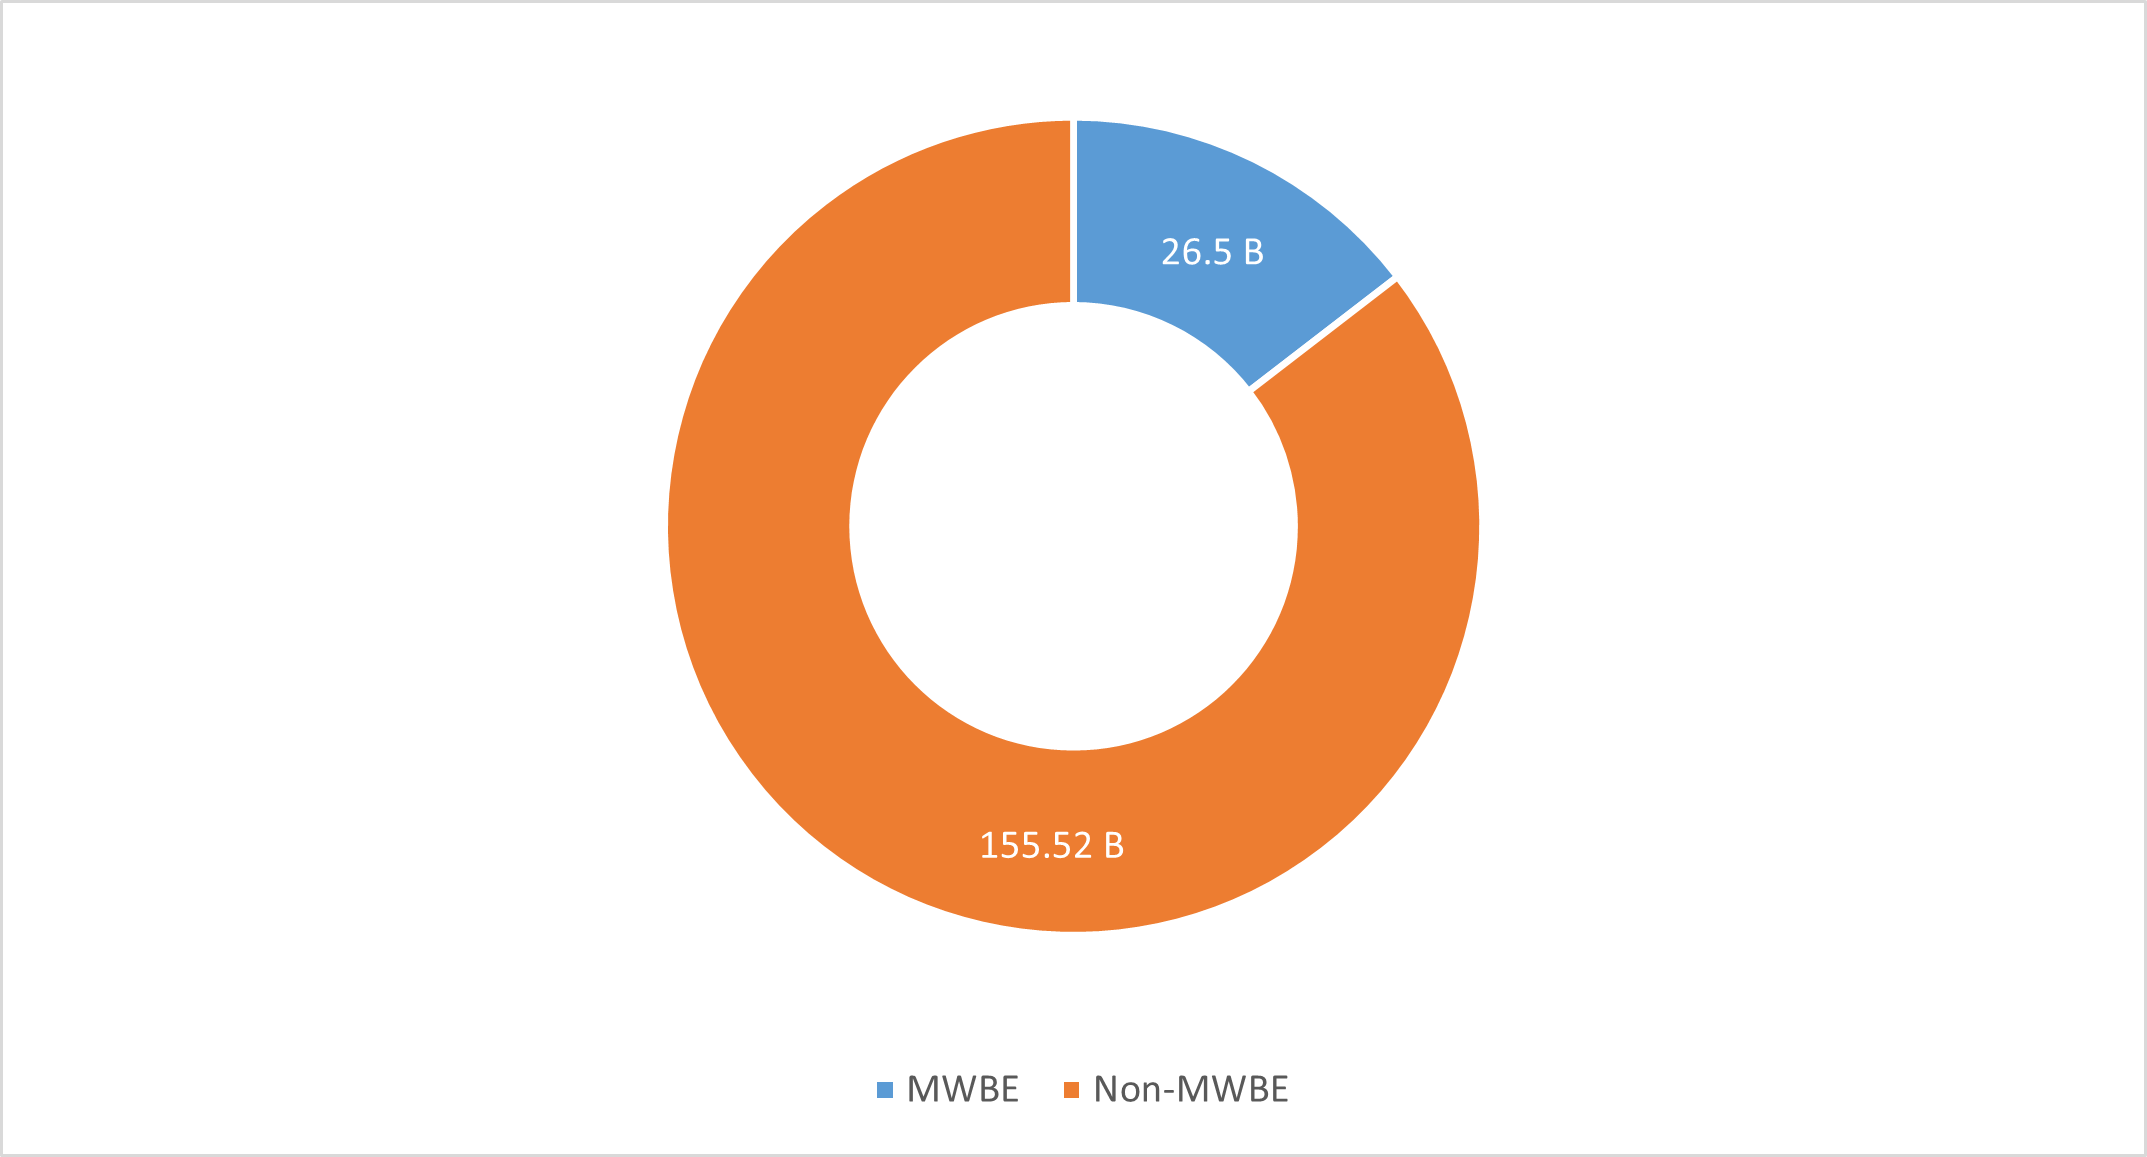
This achievement represents extraordinary growth. Since 2022, we have increased MWBE assets under management by $10 billion, bringing the total to $26.5 billion, and expanded investments with Emerging Managers to $13.02 billion.
In FY 2025, we doubled allocations to women of color, signaling both momentum and a deliberate effort to close one of the most pronounced equity gaps in the market.
Across asset classes, our diverse and emerging managers have delivered strong performance—particularly in private markets, where MWBE firms continue to outperform benchmarks with an average Public Market Equivalent (PME) spread of 7%.
It is a testament to the sustained effort, partnership, and conviction of our Bureau of Asset Management team (led in this MWBE and Emerging Manager work over the past four years by the terrific Taffi Ayodele), the trustees of our five Systems, and the talented asset managers who partner with us. Together, we have demonstrated that diversity and performance go hand in hand.
These results are not just numbers—they reflect a shift in how we achieve fiduciary excellence. A portfolio that includes a broader range of talent, perspectives, and ownership is a portfolio that performs better for the nearly 800,000 New Yorkers who depend on us for their retirement security.
As I pass the torch to Comptroller-Elect Mark Levine, I am confident that his team will build on this momentum and lead the systems to new heights.
It has been the honor of my career to serve as New York City Comptroller, and I am proud of the enduring foundation we have built together—one that proves that doing the right thing can also deliver the best results.
Sincerely,
Brad Lander
New York City Comptroller
A Message from Valerie Red-Horse Mohl, Deputy Chief Investment Officer, Responsible Investing
 At the New York City Retirement Systems, our mandate is to deliver strong, risk-adjusted returns for beneficiaries. A broader, more inclusive sourcing process expands the set of managers and strategies we evaluate, which seeks to enhances diversification and increases the likelihood of finding top performers. I have found that different life experiences, educational backgrounds, and work histories create a variety of perspectives that can lead to better investment decisions and more creative solutions. The five New York City retirement systems are leaders in championing equity and diversity in the investment management industry and as a result, we believe this report demonstrates that we realize added value and improve financial outcomes when investing in overlooked and underrepresented fund managers.
I was thrilled to join this team earlier this year and have witnessed the commitment to excellence under Brad Lander’s leadership and look forward to continuing our dedication to MWBEs and emerging managers under Comptroller-elect Mark Levine. Our progress is strong, and we believe the data presented here shows we are on the right path. Diverse and emerging managers continue to deliver competitive, and strong risk-adjusted returns.
We have more work to do, and we have built an expanded team that will work tirelessly to meet our future goals while creating value and improved financial returns for the Systems. As a Native American, I am honored and thrilled to work in one of the most diverse and culturally rich cities in the word. I believe that our investment strategies can reflect our constituents and our city while first and foremost achieving our mandate to making enhanced financial returns is remarkable and I am excited about what the future holds under the new administration. It is an exhilarating time and my team and I hope to create pathways to not only reach our near-term aspirational goals but to set best practice standards for many generations to come.
Osiyo,
Valerie Red-Horse Mohl
Deputy Chief Investment Officer, Responsible Investing
A Message from Taffi Ayodele, Head of Diverse and Emerging Manager Strategy
Dear Reader,
 As we close out this reporting cycle, I am proud to share that the five New York City retirement systems have reached 14.6% of U.S.-based actively managed assets invested with MWBE managers, nearly meeting our goal of 15% by 2025. While just shy of our target, this milestone represents a major accomplishment and underscores the progress we have made under Comptroller Brad Lander’s leadership.
Since 2022, MWBE allocations have grown by $10 billion, totaling $26.5billion, with Emerging Manager allocations rising to $13.02 billion. The results to date are clear: diverse and emerging managers continue to deliver competitive, and often strong, returns—particularly across private markets, where, to date, outperformance over benchmarks remains consistent and robust.
This year also marks an important breakthrough: almost doubling allocations to women of color, one of the most underrepresented groups in asset management. This progress is a direct reflection of our intentional strategy to expand opportunity where it has historically been most limited.
I want to extend my gratitude to Comptroller Brad Lander for his steadfast commitment to transparency and inclusion, which ensured that diversity became a cornerstone of the City’s investment philosophy. I also thank the Bureau of Asset Management team, our Trustees, consultants, and program partners for their collaboration and diligence in ensuring that our portfolio reflects both excellence and equity.
Looking ahead, we remain focused on the next chapter under Comptroller-Elect Mark Levine and a new Chief Investment Officer. Together, we will seek to continue building on this strong foundation—expanding opportunities for smaller and first-time managers, deepening partnerships with high-performing diverse firms, and accelerating progress toward our 20% goal by 2029.
Reaching 14.6% is not a finish line— we believe it is proof that we are on the right path. With continued commitment, transparency, and partnership, I am confident we will not only meet but exceed the goals we set for the future.
Sincerely,
Taffi Ayodele
Head of Diverse and Emerging Manager Strategy
A Message from Deputy Comptroller for Public Finance F. Jay Olson
Dear Reader,
 The Comptroller’s Public Finance Bureau, working closely with the Mayor’s Office of Management and Budget, oversees the City’s debt program and issuance of municipal bonds for capital projects. Debt issuance funds parks, schools, bridges, sidewalks, and the rest of the City’s infrastructure throughout the five boroughs. These capital projects benefit all New Yorkers, and MWBEs are an integral part of the debt issuance process, serving as underwriters, advisors, and counsel.
Through its extensive debt issuance program, the City provides growth opportunities for MWBE firms, including the Public Finance Bureau’s decades-old policies to partner with MWBE firms in the various roles in the capital financing process to help foster their growth. Over the years, the Comptroller’s Office has developed and expanded financing policies and practices to help ensure that MWBE underwriters can grow their capital and staff and compete with bulge bracket firms. These policies have fostered continued reinvestment and growth that has allowed MWBE firms to expand their footprint not only in New York City, but nationally as well.
MWBEs provide their expertise in underwriting, financial advisor, and counsel teams to all of New York City’s major bond issuers, and the City continually looks for ways to expand MWBE contribution to the debt issuance program. Providing opportunities for MWBE firms to grow their size and capabilities is essential to the long-term health of the City and further demonstrates that New York City’s greatest strength lies in its diversity.
Beyond reflecting the City’s population and its values of equity and inclusion, MWBEs provide valuable ideas to improve the City’s financial position and debt financing. From additional distribution channels to reach more investors, to innovative financing ideas and alternative credit structures that improve borrowing efficiency, MWBEs are a critical part of the City’s debt program.
Responsible debt management ensures New York City’s strength and vibrancy for future generations. By continuing its longstanding partnership with MWBE firms, the Comptroller’s Office works to ensure that future is shaped by all New Yorkers.
Sincerely,
F. Jay Olson
Deputy Comptroller for Public Finance
Overview of the New York City Retirement Systems and the Bureau of Asset Management (BAM)
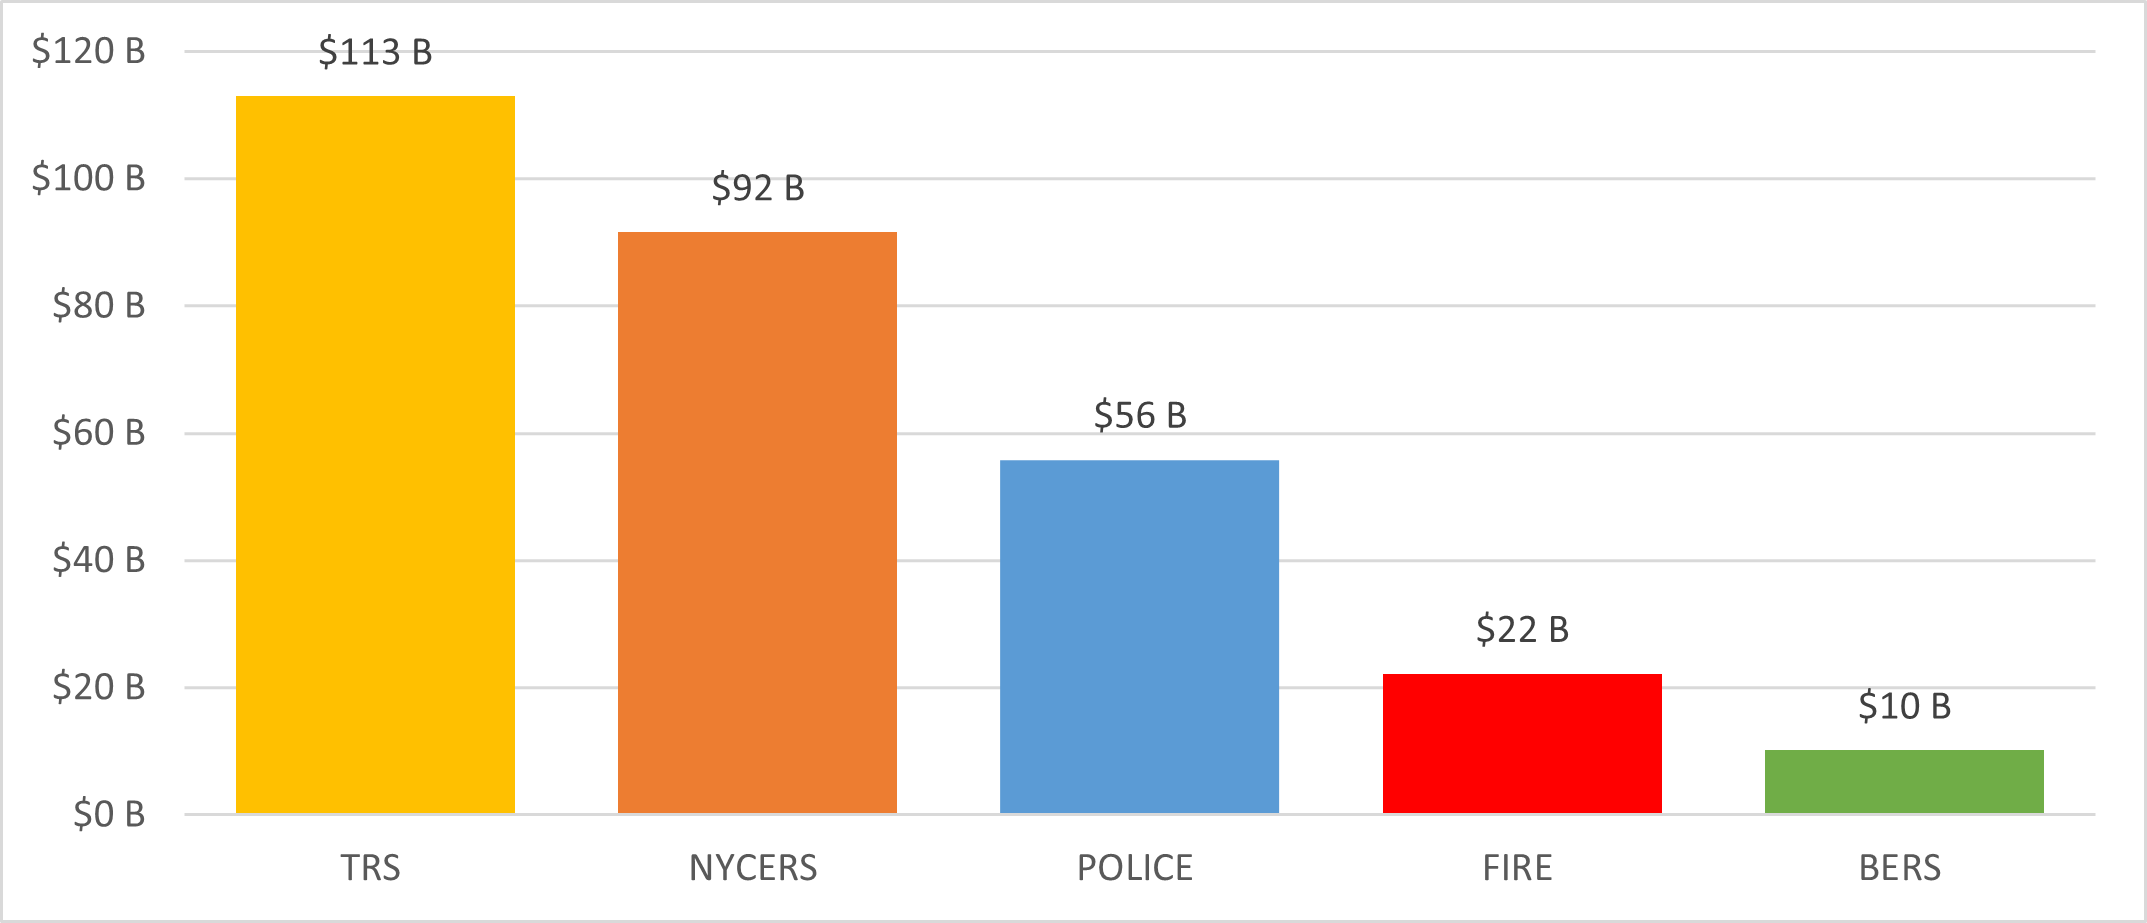
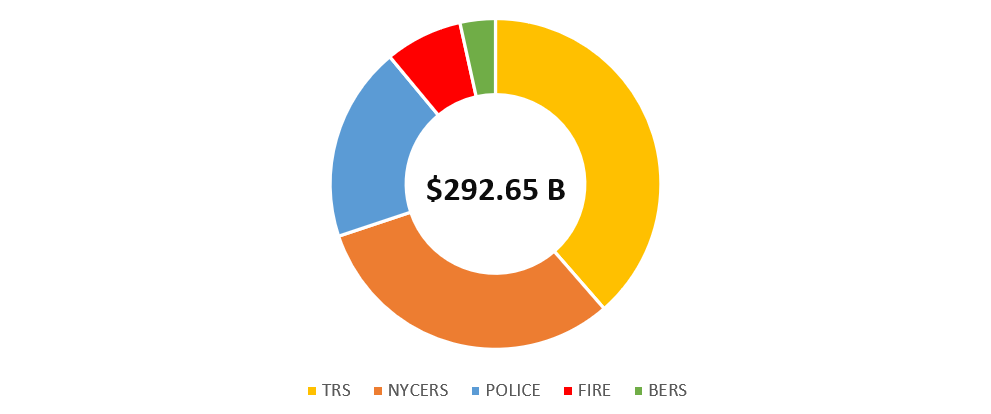
The New York City retirement systems, referred to hereafter as “the Systems,” are the City of New York’s five public pension funds serving nearly 800,000 members and beneficiaries.
As of June 30, 2025, the Systems in aggregate have approximately $294.61 billion[1] in assets under management, constituting the third largest public pension plan in the U.S. The five pension funds comprising the Systems are the Teachers’ Retirement System of the City of New York (TRS), the New York City Employees’ Retirement System (NYCERS), the New York City Police Pension Fund (POLICE), the New York City Fire Pension Fund (FIRE), and the New York City Board of Education Retirement System (BERS).
The New York City Comptroller is by law the custodian of City-held trust funds and the assets of the New York City retirement systems and serves as Trustee on each of the funds. The Comptroller is also delegated to serve as investment advisor by all five pension boards. In this role, the Comptroller provides investment advice, implements Board decisions, and reports on investment performance.
The Comptroller’s Bureau of Asset Management oversees the investment portfolio for each system and related defined contribution funds and works closely with the Board of Trustees of each pension fund and their consultants on matters of asset management and allocation for each System. The Systems’ portfolios are managed predominantly by external investment managers, and are largely invested in publicly traded securities, with additional allocations to private equity, real estate, infrastructure, hedge funds, and alternative credit (opportunistic fixed income) investments.
Systems’ Fund Value
NAV in Billions (as of 6/30/2025)
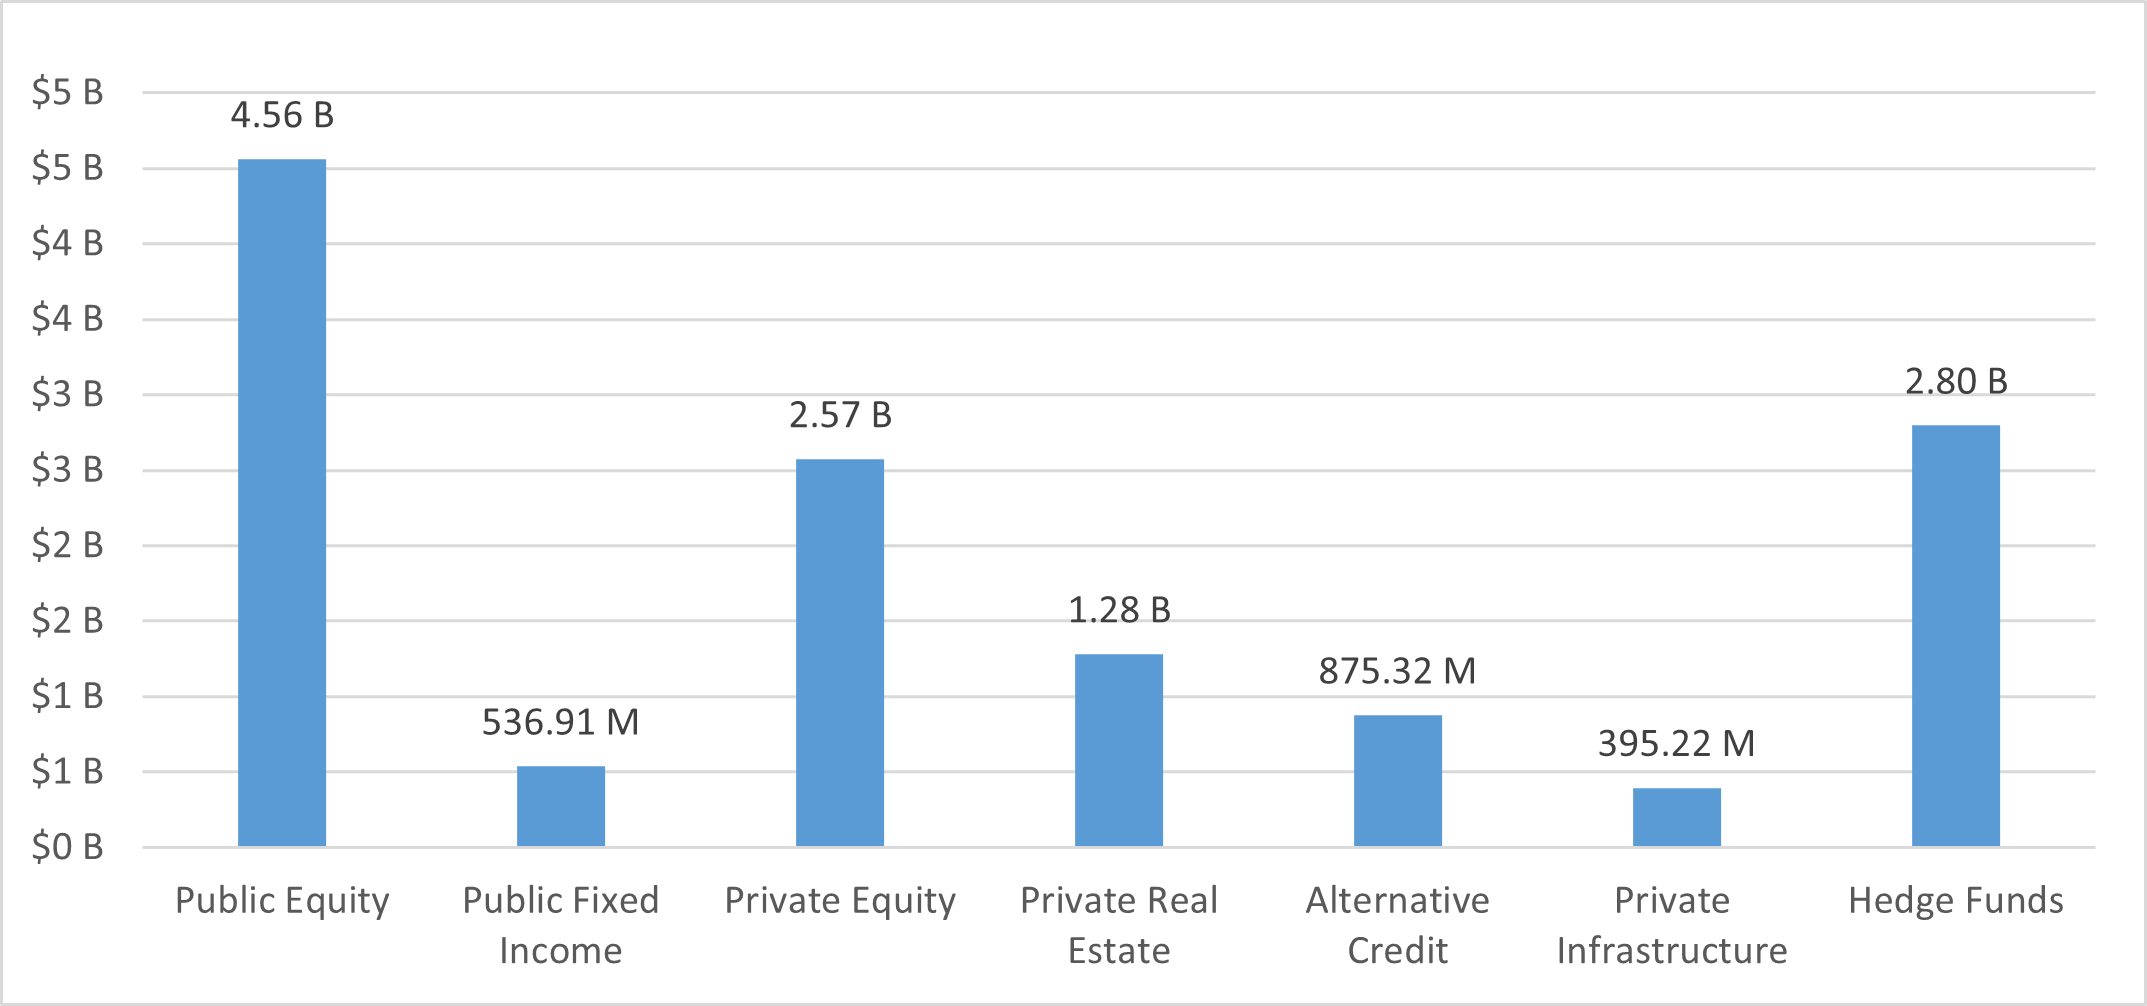
Net Asset Value by Asset Class
| TRS | NYCERS | POLICE | FIRE | BERS | Total | |
|---|---|---|---|---|---|---|
| Public Equity | $52,948.84 | $38,970.73 | $21,248.05 | $10,172.14 | $4,439.38 | $127,779.14 |
| Fixed Income | $36,506.73 | $29,751.92 | $17,487.75 | $6,361.30 | $2,576.11 | $92,683.81 |
| Private Equity | $4,802.60 | $4,713.47 | $2,856.02 | $1,011.12 | $1,202.26 | $14,585.47 |
| Real Estate | $8,862.20 | $8,834.92 | $5,575.40 | $1,927.14 | $834.99 | $26,034.65 |
| Alternative Credit | $6,306.56 | $6,347.07 | $3,587.86 | $1,321.65 | $565.60 | $18,128.74 |
| Infrastructure | $3,513.01 | $2,962.40 | $1,602.63 | $546.99 | $500.76 | $9,125.79 |
| Hedge Funds | $0.86 | $3,485.37 | $832.26 | $4,318.49 | ||
| Total | $112,939.94 | $91,581.37 | $55,843.08 | $22,172.60 | $10,119.10 | $292,656.09 |
Overview of Diversity, Equity and Inclusion in Asset Management,
As of June 30, 2025
MWBE and Emerging Managers
The Bureau of Asset Management and the New York City retirement systems have a longstanding commitment to prudently increase their capital allocation to MWBE (minority- and/or women-owned) Managers and Emerging Managers.
The Systems have $26.5 billion in investments with or committed to MWBE managers as of June 30, 2025. Those investments amount to 14.6% of U.S.-based actively managed assets.
BAM and the Systems also have a program of investing in Emerging Managers to seek the best performing managers, including MWBE managers, that do not typically have access to large institutional investors.
The Systems have a total of $13.02 billion in investments with or committed to Emerging Manager firms as of June 30, 2025, representing 5.78% of Global-actively managed assets, increased from $10.36 billion in 2024.
MW/DVBE Broker Dealer Program
In 2008, BAM, on behalf of the Systems, established the Minority- and Women-Owned Business Enterprise (MWBE) Brokerage Program, which was expanded to include Disabled Veteran-Owned businesses in 2019 and is now the MW/DVBE Brokerage Program. The program is designed to support opportunity for brokerage firms owned and operated by minorities, women, and disabled veterans to conduct the purchase, sale or exchange of traded securities, consistent with best execution, for external investment managers in Public Equity and Public Fixed Income investing on behalf of the Systems.
Since the inception of the program BAM has maintained a MW/DVBE Brokerage Firm List (“Brokerage List”) on behalf of the Systems, which was designed to assist the Systems’ investment managers with identifying MW/DVBE brokerage firms with relevant experience, organizational stability, regulatory controls, trading capacity and certifications for potential utilization. Investment managers are encouraged to include firms from the Brokerage List in executing trades on behalf of the Systems and to make good faith efforts to achieve certain utilization goals recommended by BAM and approved by Trustees. These goals range from 5% to 30% depending on the sub-asset class and cover U.S. Equity, Non-U.S. Equity, Government & Agencies (Fixed Income), Mortgages (Fixed Income), U.S. Corporate Bonds and High Yield Fixed Income. In choosing to allocate to a manager, the Systems delegate to their investment managers full discretion to select all the brokerage firms that execute trades on their behalf. The Systems and Comptroller require all purchases and sales of securities for the Systems to be made on the basis of best execution.
BAM identifies firms for the Brokerage List by periodically soliciting expressions of interest and evaluating firms. The Brokerage List has 14 firms as of January 2025 and is intended for reference only, not as an exclusive, approved or recommended list of brokers, and does not guarantee trading activity. However, all public equity and public fixed income managers are monitored and engaged throughout the year and encourage to increase their utilization of MW/DVBE brokers.
Diversity, Equity, and Inclusion in Manager Due Diligence
Since 2015, BAM, on behalf of the Systems, has conducted due diligence and annual monitoring of the diversity, equity and inclusion (DEI) policies, practices and characteristics of all investment managers across asset classes. We believe strong diversity, equity and inclusion helps to avoid limitations of groupthink and as shown by extensive research, is correlated with better decision-making, risk management and financial performance. The lack of diversity in the asset management industry and the broader racial and gender wealth gap also present a systemic risk to the economy and markets that can affect the returns we seek to generate for our beneficiaries. New York City government’s workforce is among the most diverse in the nation with people of color representing nearly two thirds and women comprising nearly half of the workforce. However, the diversity of investment professionals across the asset management industry is vastly less than that of the Systems’ beneficiaries. It is our fiduciary duty to evaluate how investment managers are seeking the best talent available and supporting DEI in their organizations and the investments they manage on behalf of the Systems and to encourage them to address the business case for DEI and the systemic risks of socioeconomic inequality.
BAM includes as part of its ESG due diligence process an evaluation of every investment manager’s approach to DEI including the quality of their DEI policies; accountability for DEI; efforts to improve DEI in recruitment, promotion and retention; incorporation of DEI in performance reviews and compensation mechanisms; supplier diversity; efforts to build a diverse pipeline for the investment industry and other factors. In addition, BAM looks at the diversity of the managers’ investment committees, investment professionals and progress over time. BAM includes a summary of these topics in the investment memoranda to the BAM Investment Committee and the Systems’ Boards of Trustees.
In addition to assessing the organizational DEI policies, practices, and processes of managers, BAM systematically evaluates how managers integrate consideration of financially material DEI issues in the managers’ investment process, including pre-investment diligence, portfolio management, engagement and value creation. For private markets managers, BAM asks for the diversity of portfolio companies using the Institutional Limited Partners Association (ILPA) Diversity Metrics Template. Where applicable, BAM evaluates whether and how managers engage their portfolio companies to improve DEI such as monitoring workforce diversity and seeking diversity on their boards. Where BAM identifies material risks, BAM seeks to engage managers as appropriate to encourage best practices on DEI.
MWBE Managers and Asset Values
Values denote invested and committed assets with US-based MWBEs as of June 30, 2025, as a percentage of US-based actively managed assets.
US Actively Managed Assets by Demographic
US Actively Managed Assets
MWBE Exposure by Demographic
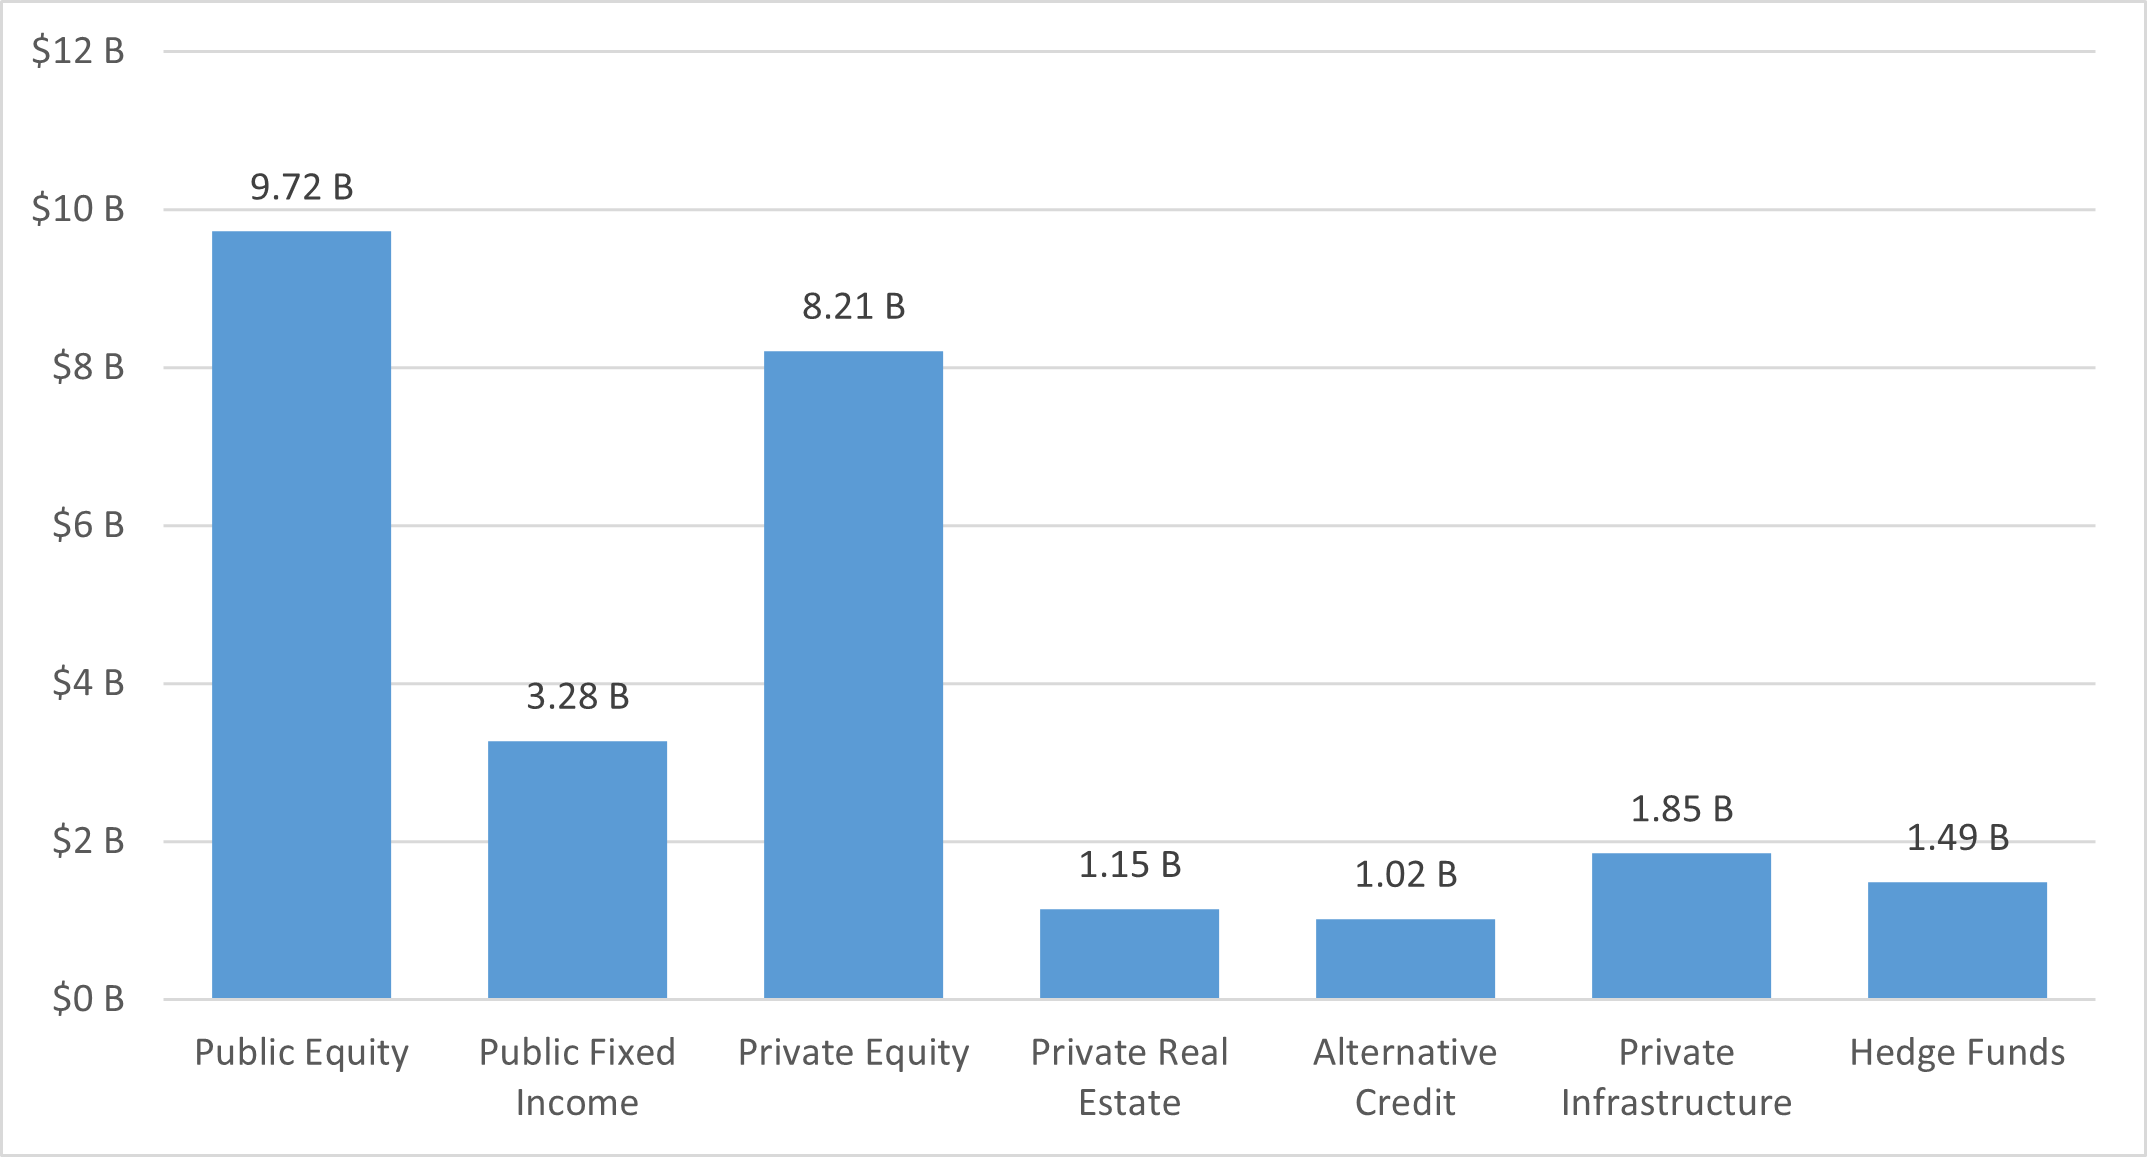
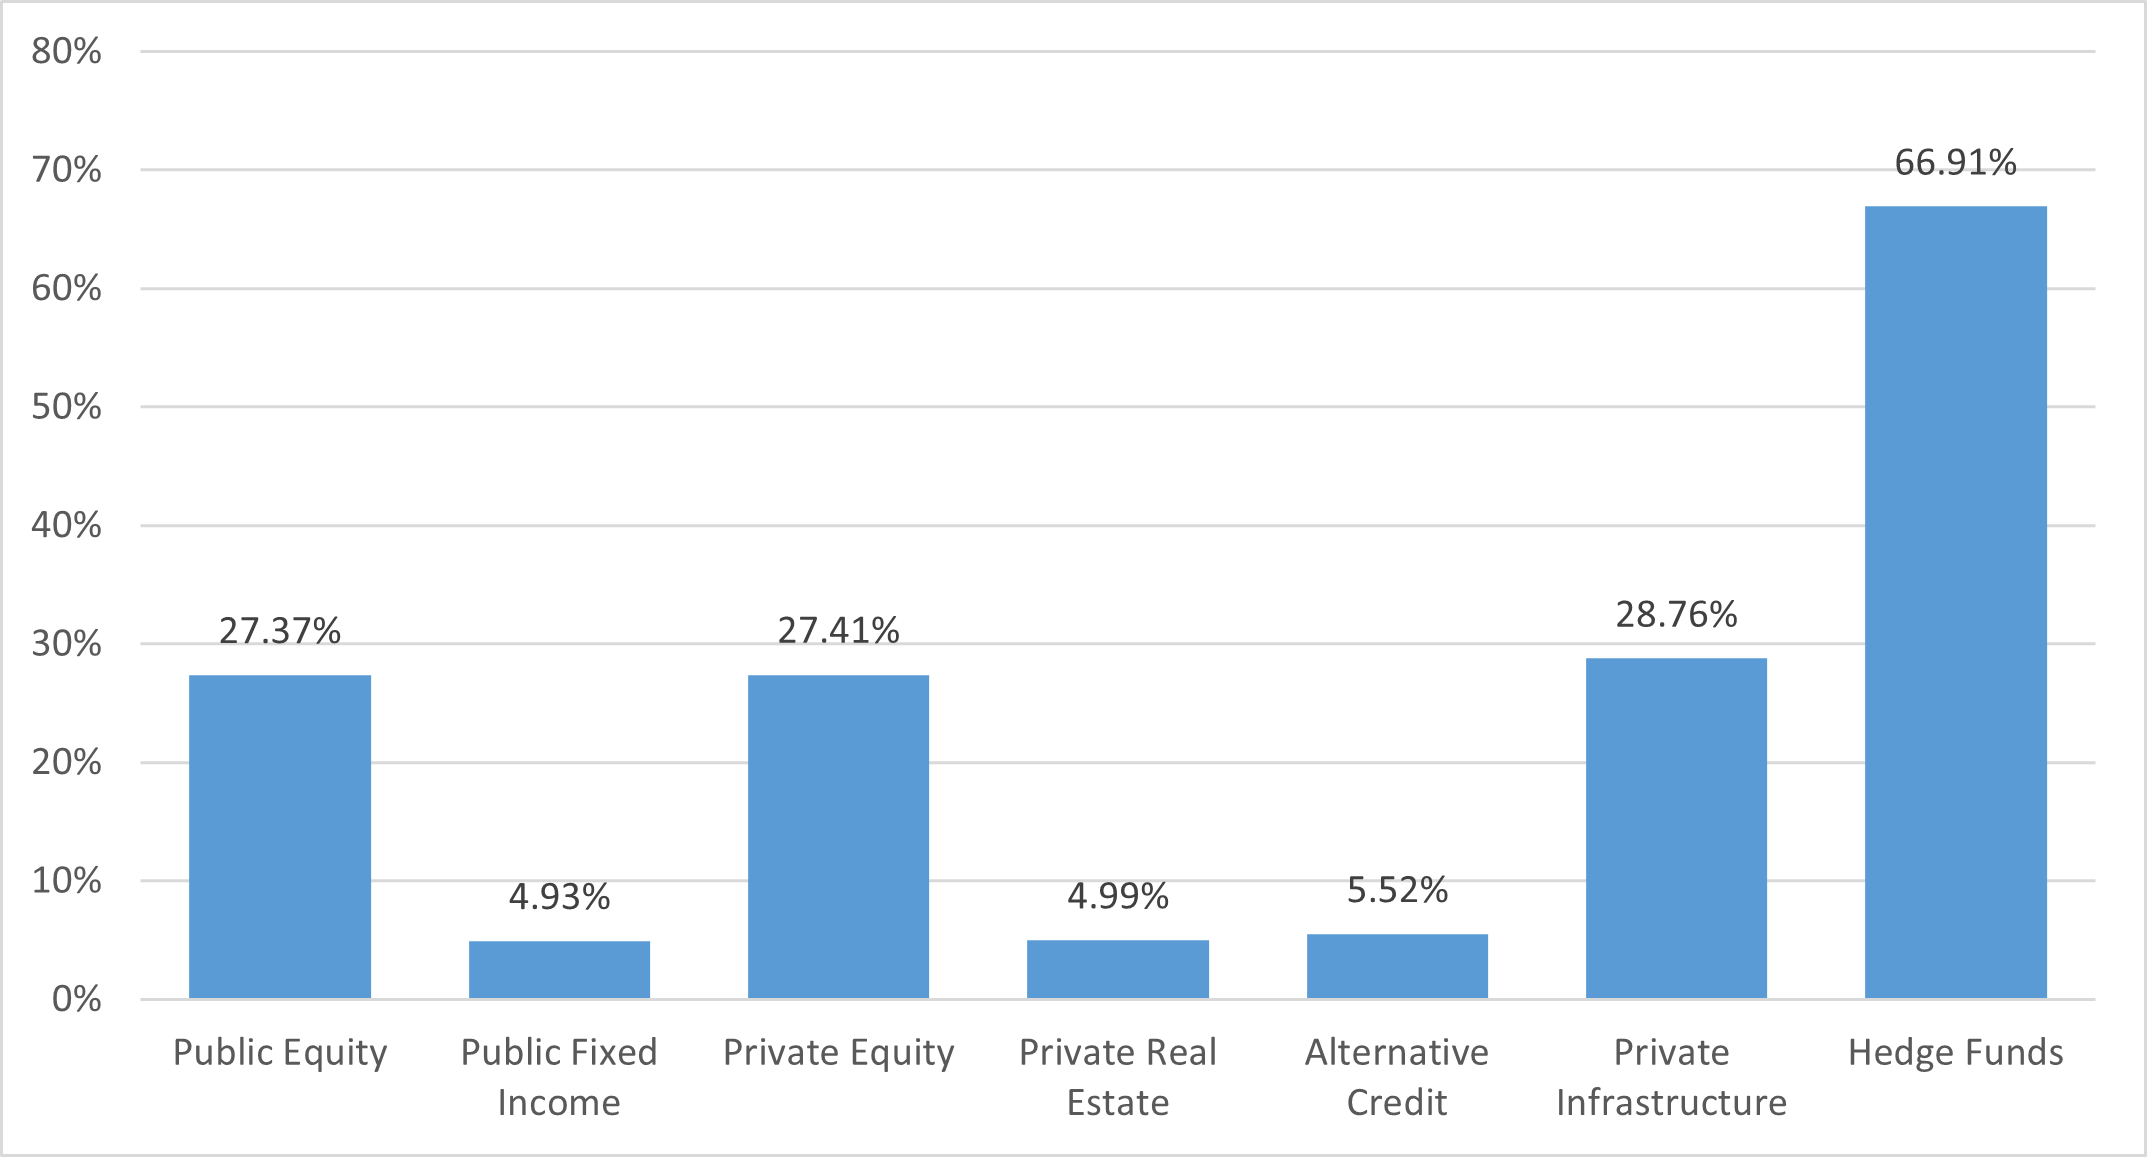
MWBE Exposure by Asset Class
MWBE Exposure by System
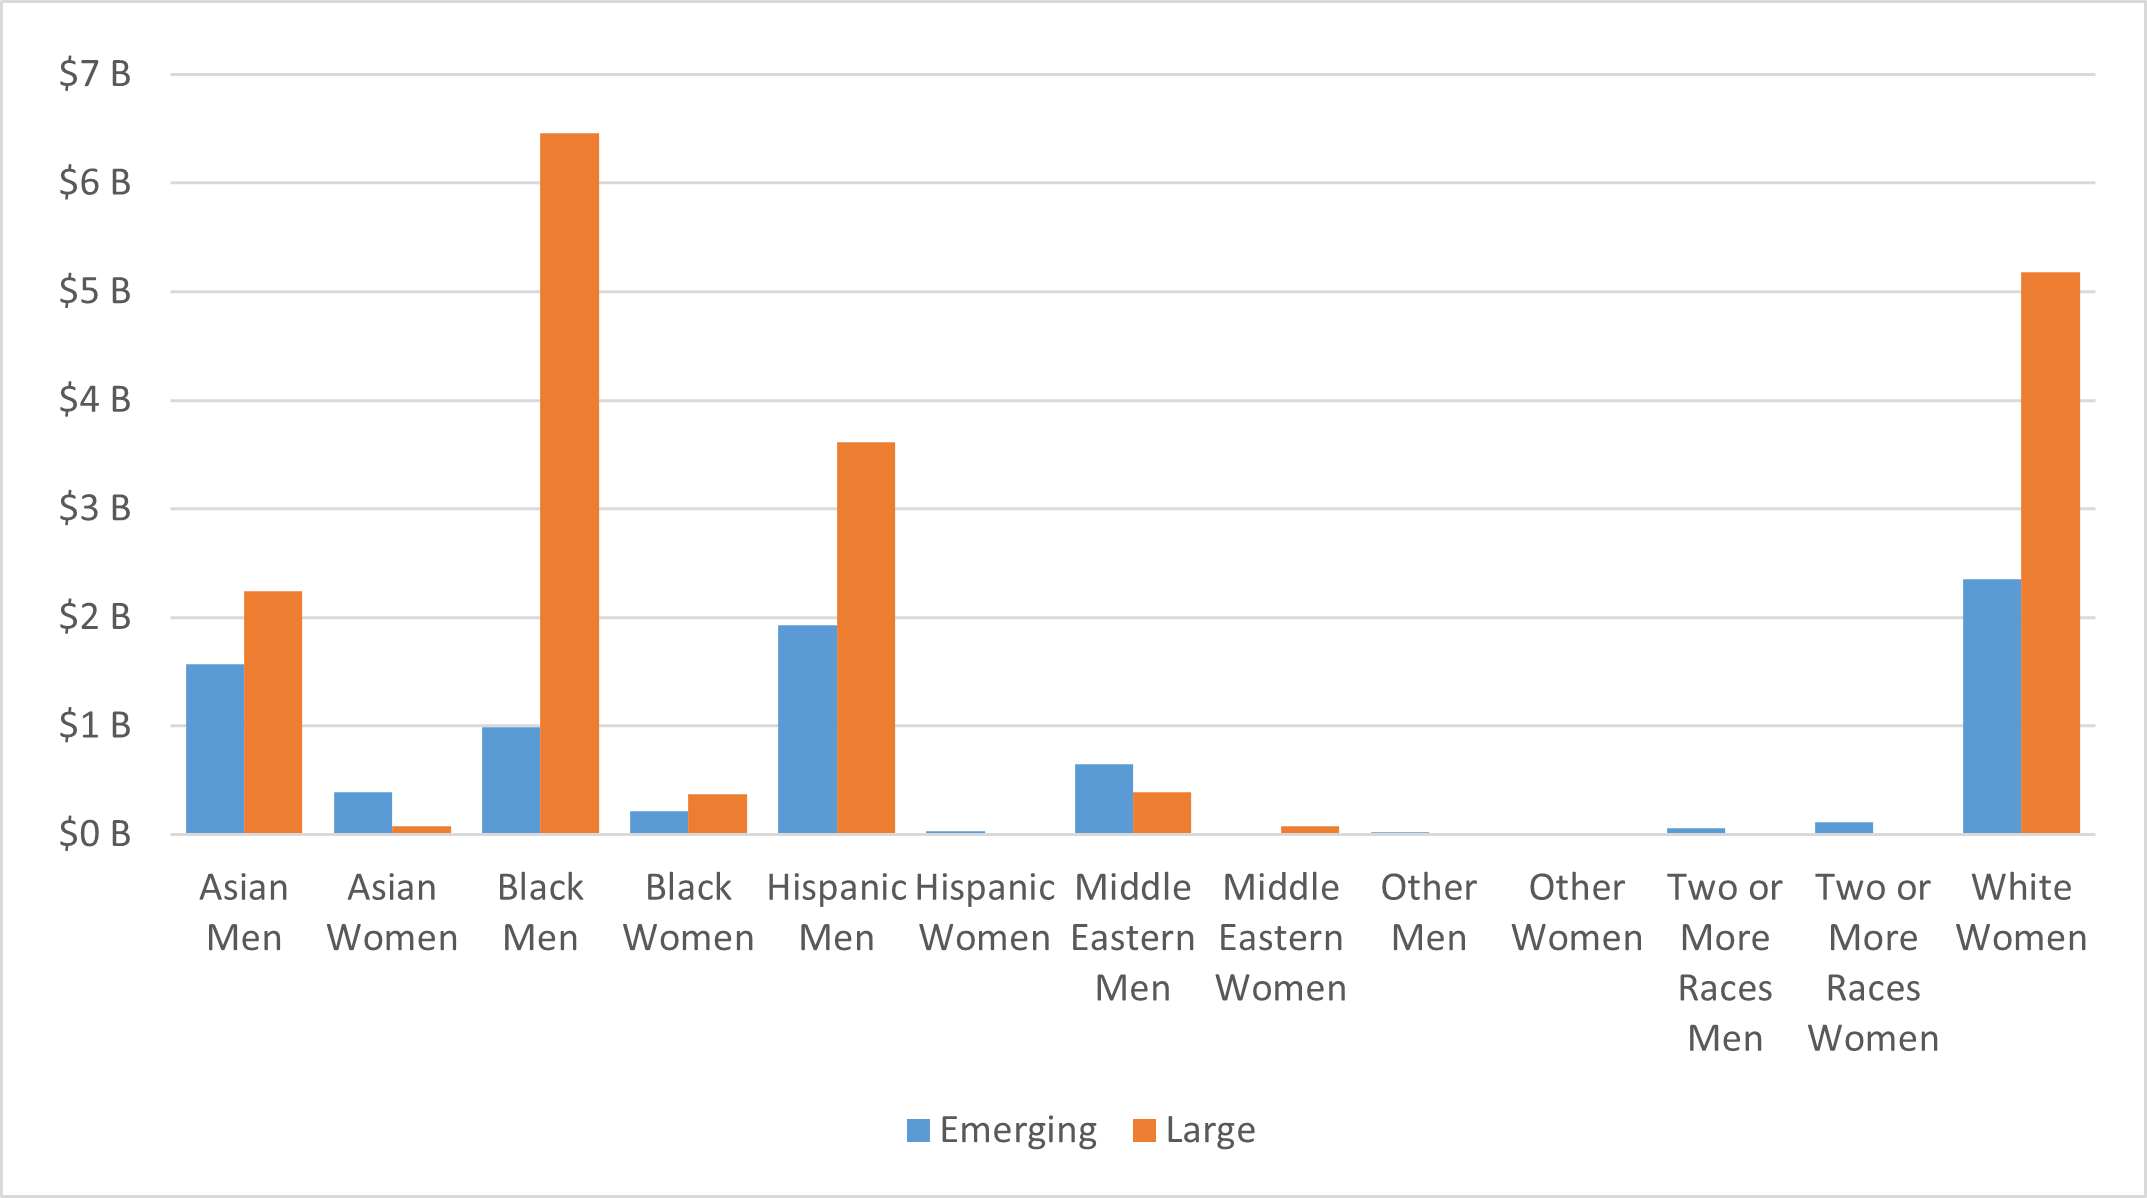
MWBE Exposure by Manager Size

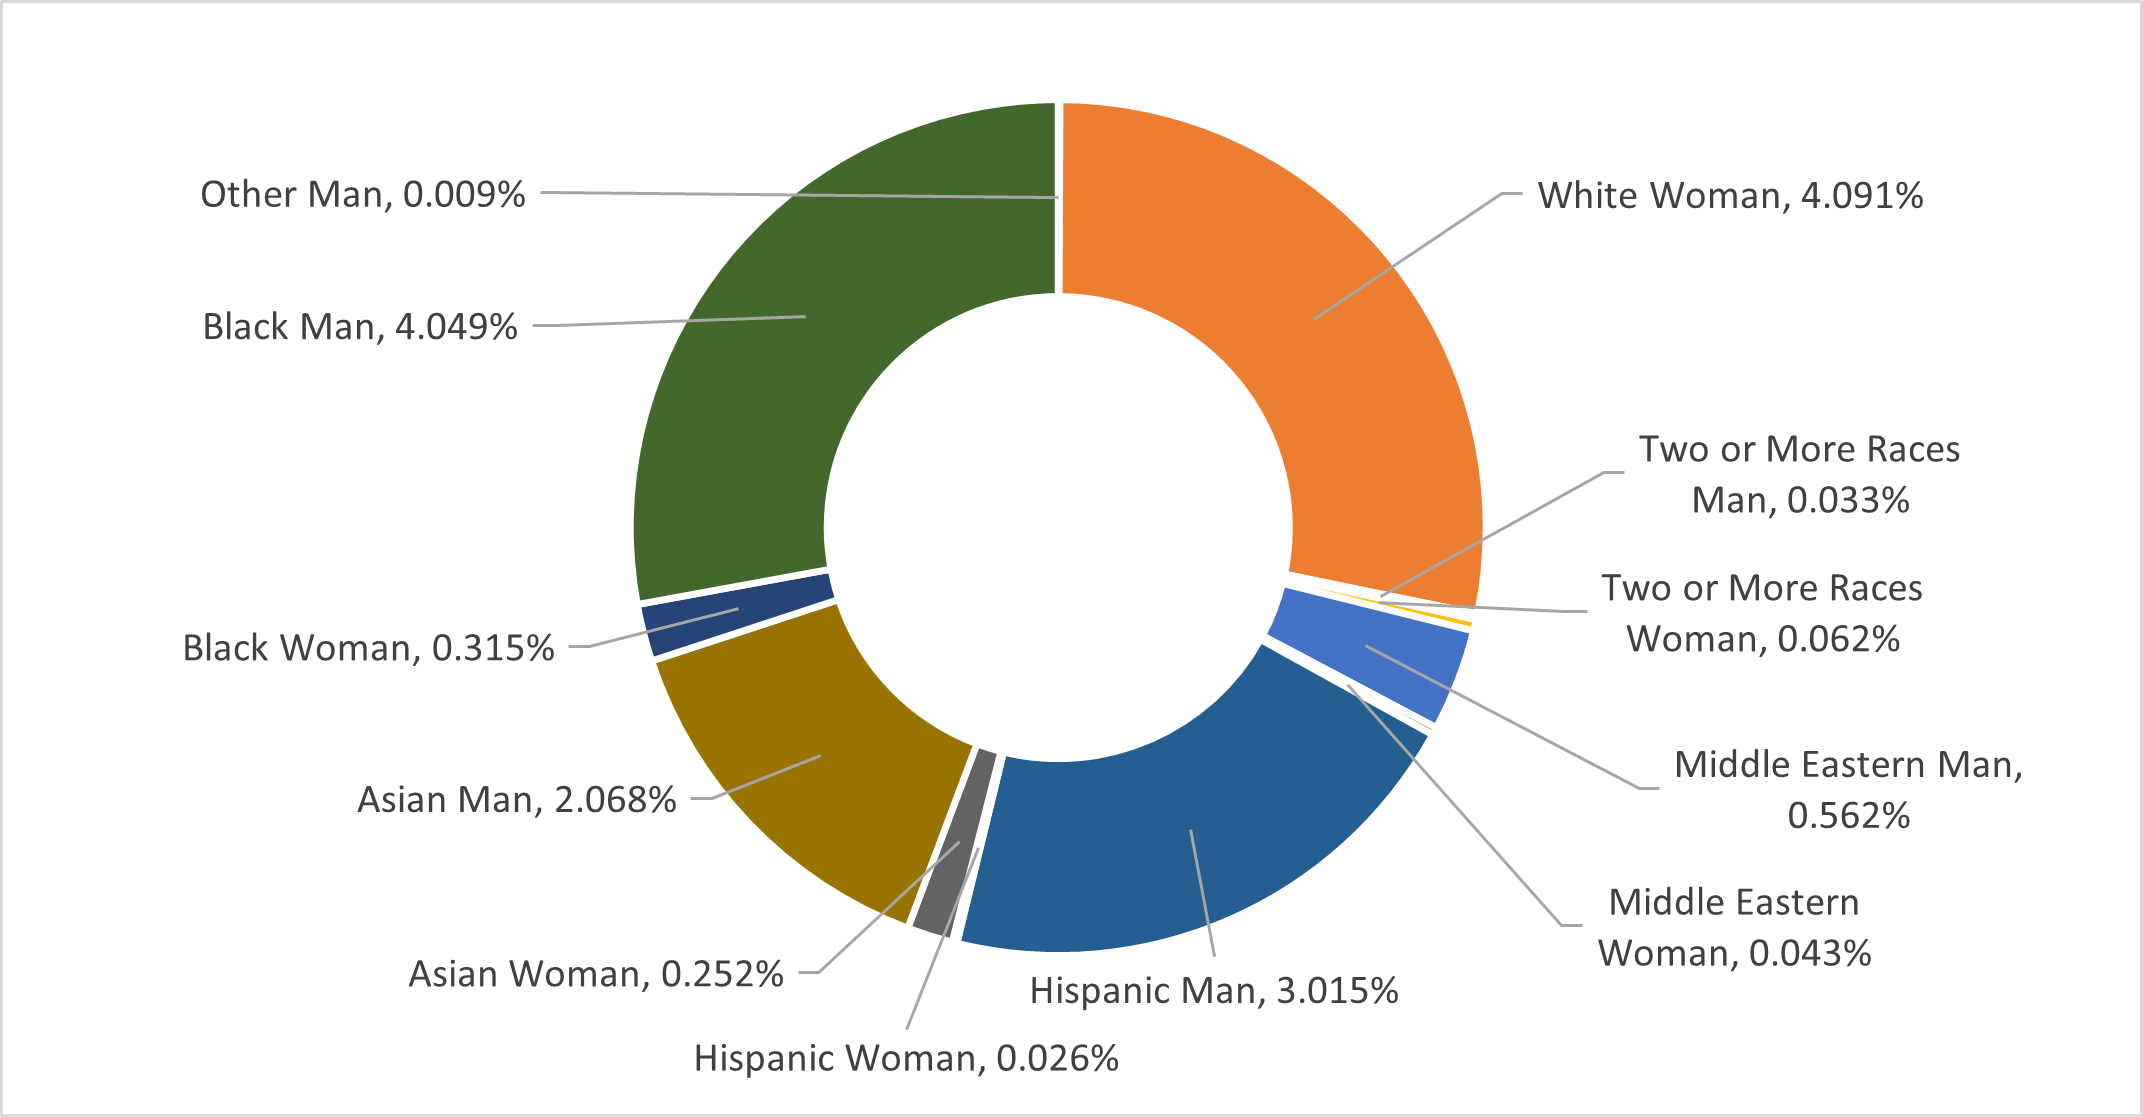
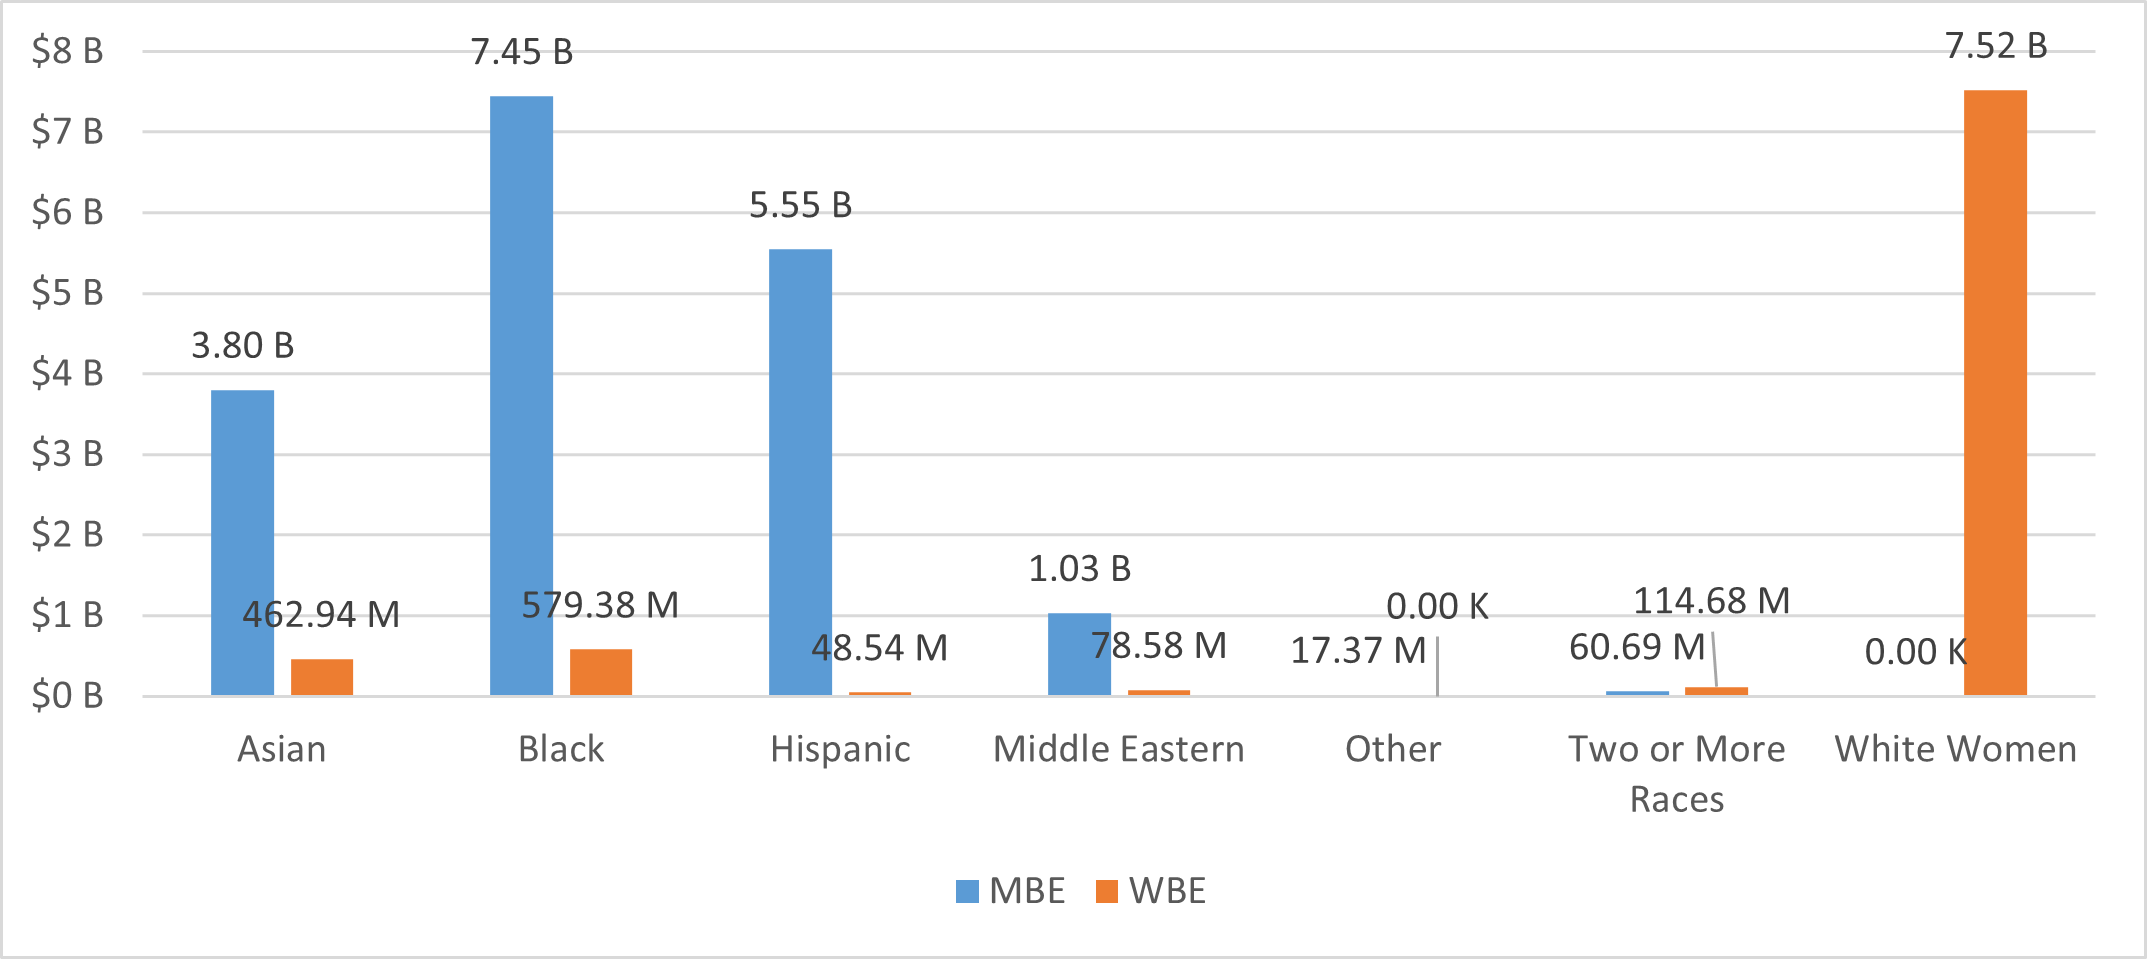
MWBE Exposure by Demographic
Women remain significantly underrepresented in the asset management industry, including within the Systems’ portfolio. In FY 2025, the Systems doubled their allocations to women of color, signaling both momentum and a deliberate effort to close one of the most pronounced equity gaps in the market.
MWBE Exposure by Demographic: Exposure
MWBE Exposure by Demographic: % of MWBE

*Asset management firms described as MBE are substantially owned by non-white males. Firms described as WBE are substantially owned by women.
Firms with Substantial MWBE Ownership
Substantial Ownership in the 105 MWBE fund managers (including sub-managers) in the Systems’ portfolio can be broken down as follows:
Substantial Ownership

* Firms included in the chart are those with substantial MWBE ownership, defined as at least 33% ownership by women and/or people of color. A firm may be counted in multiple categories if it meets the 33% ownership threshold for more than one group.
US Actively Managed Assets by Gender*
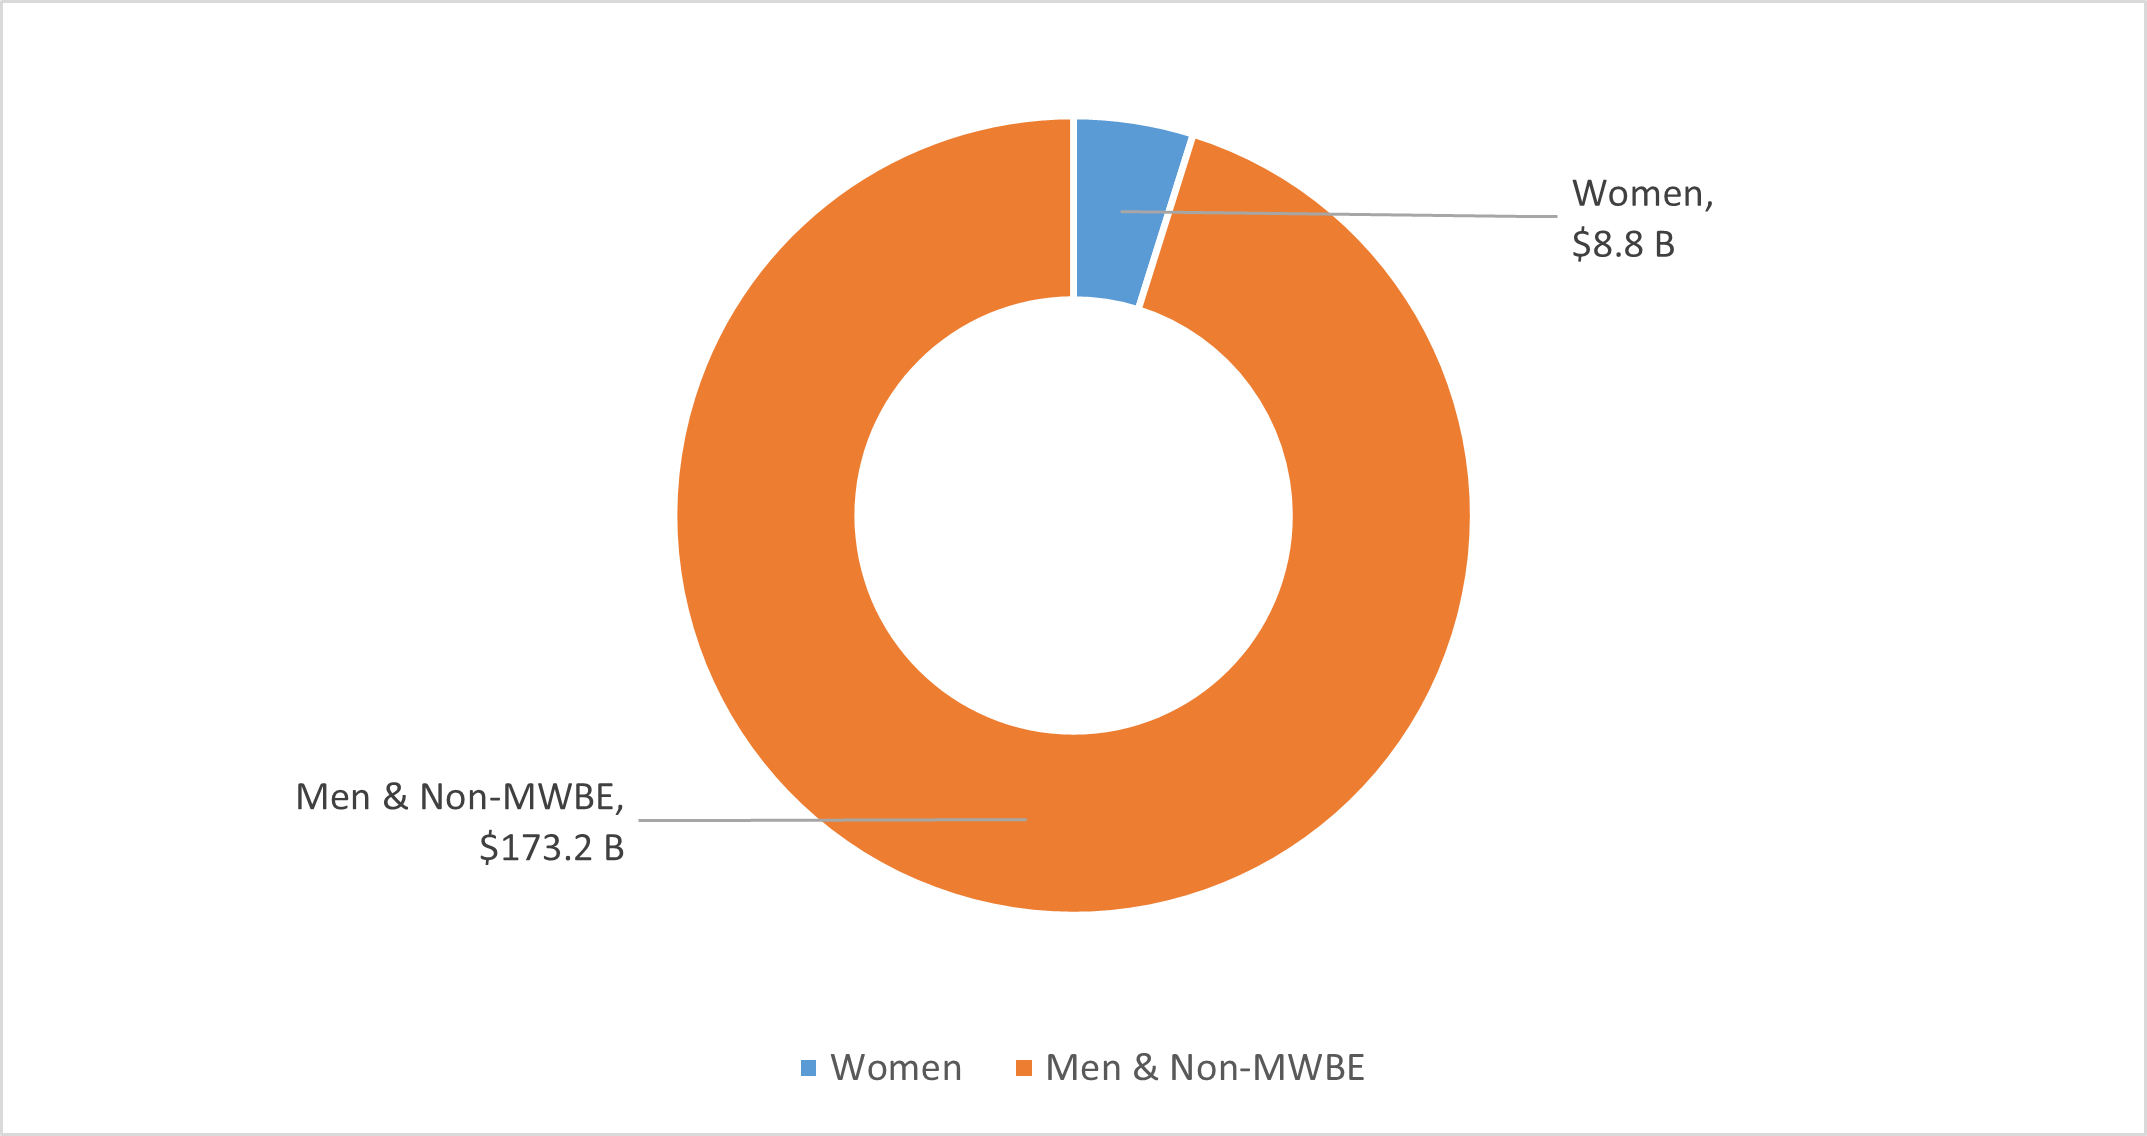
MWBE Exposure by Gender
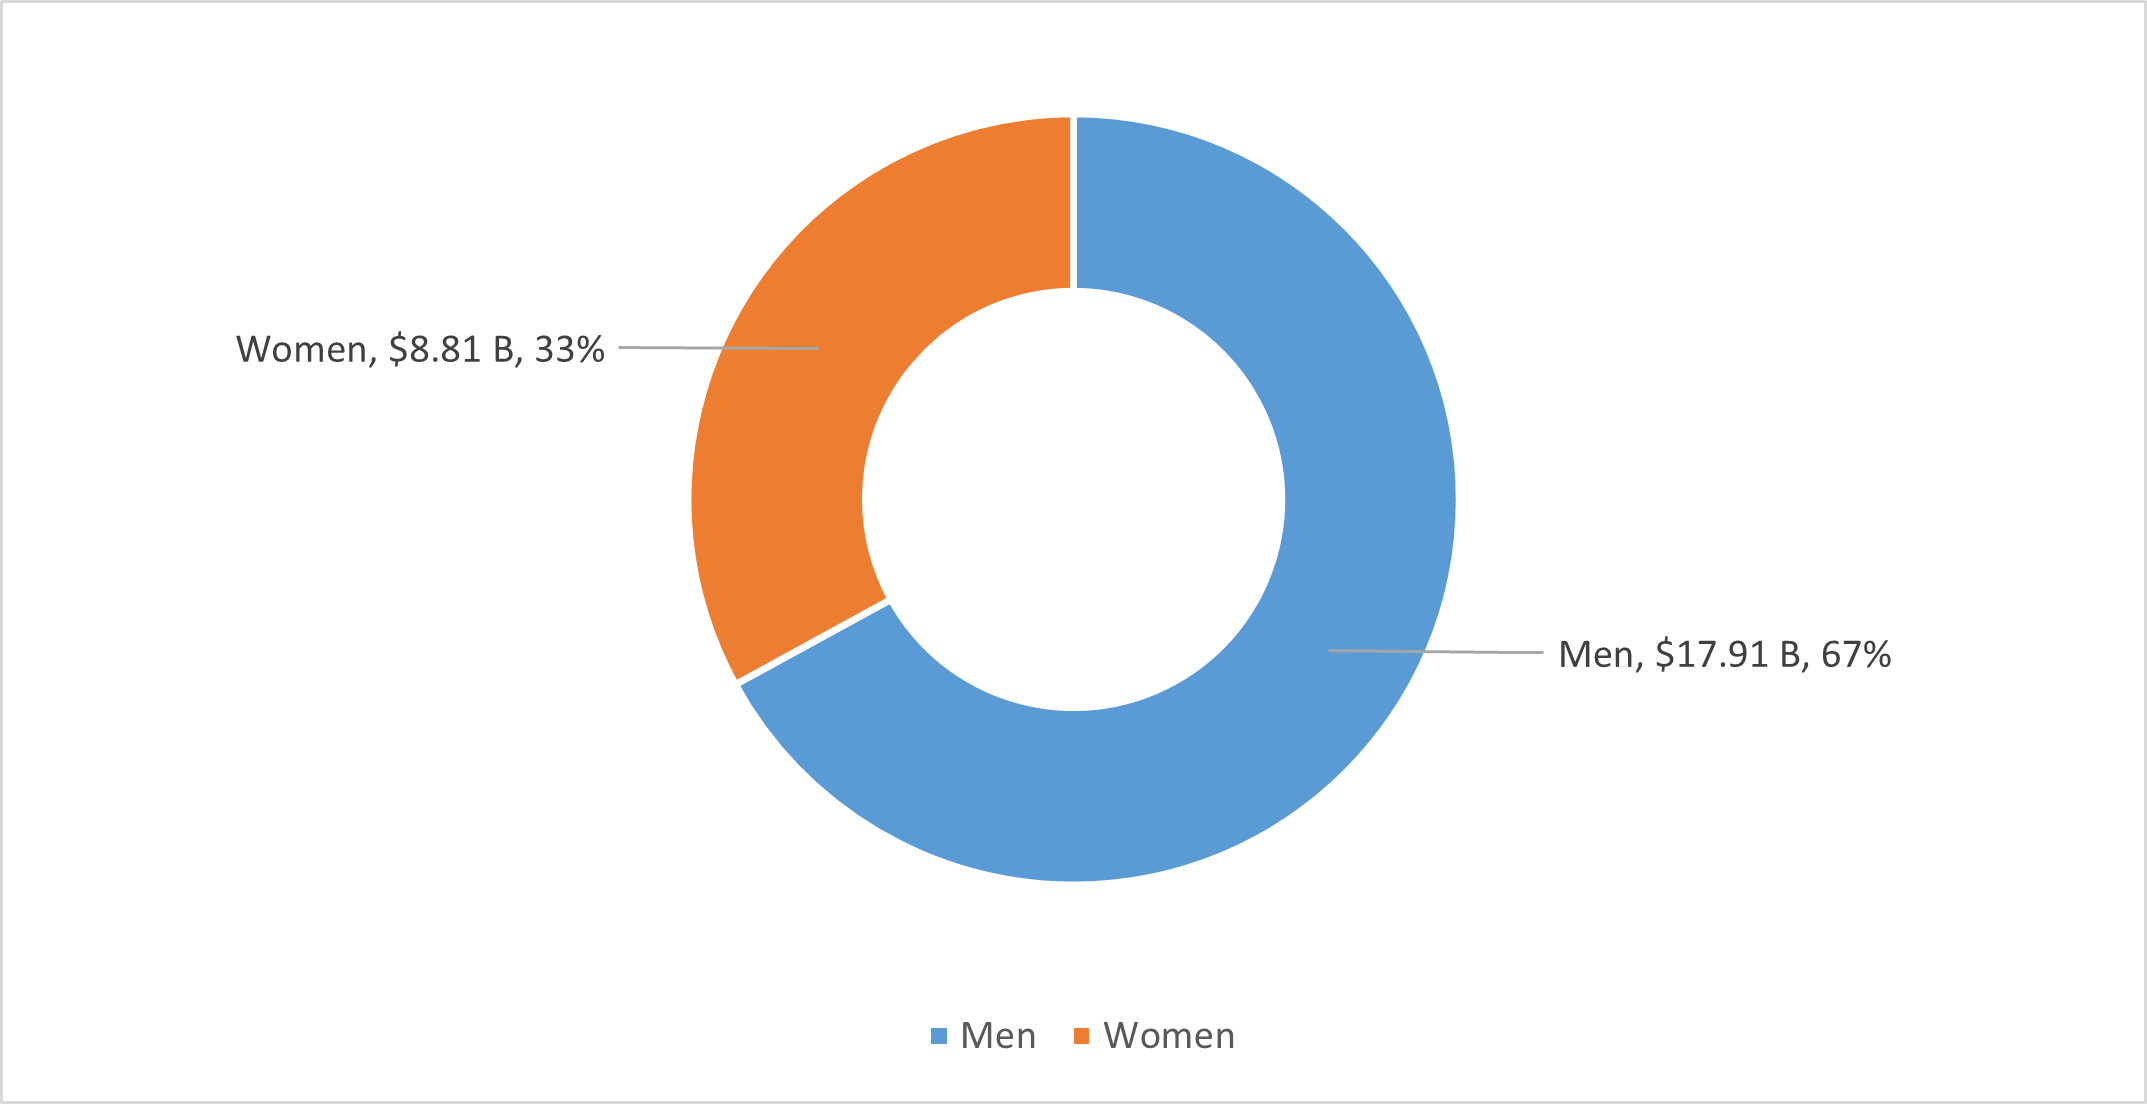
*Gender: Asset management firms described as MBE are substantially owned by non-white males. Firms described as WBE are substantially owned by women
MWBE Exposure by Demographic and Emerging Manager Status
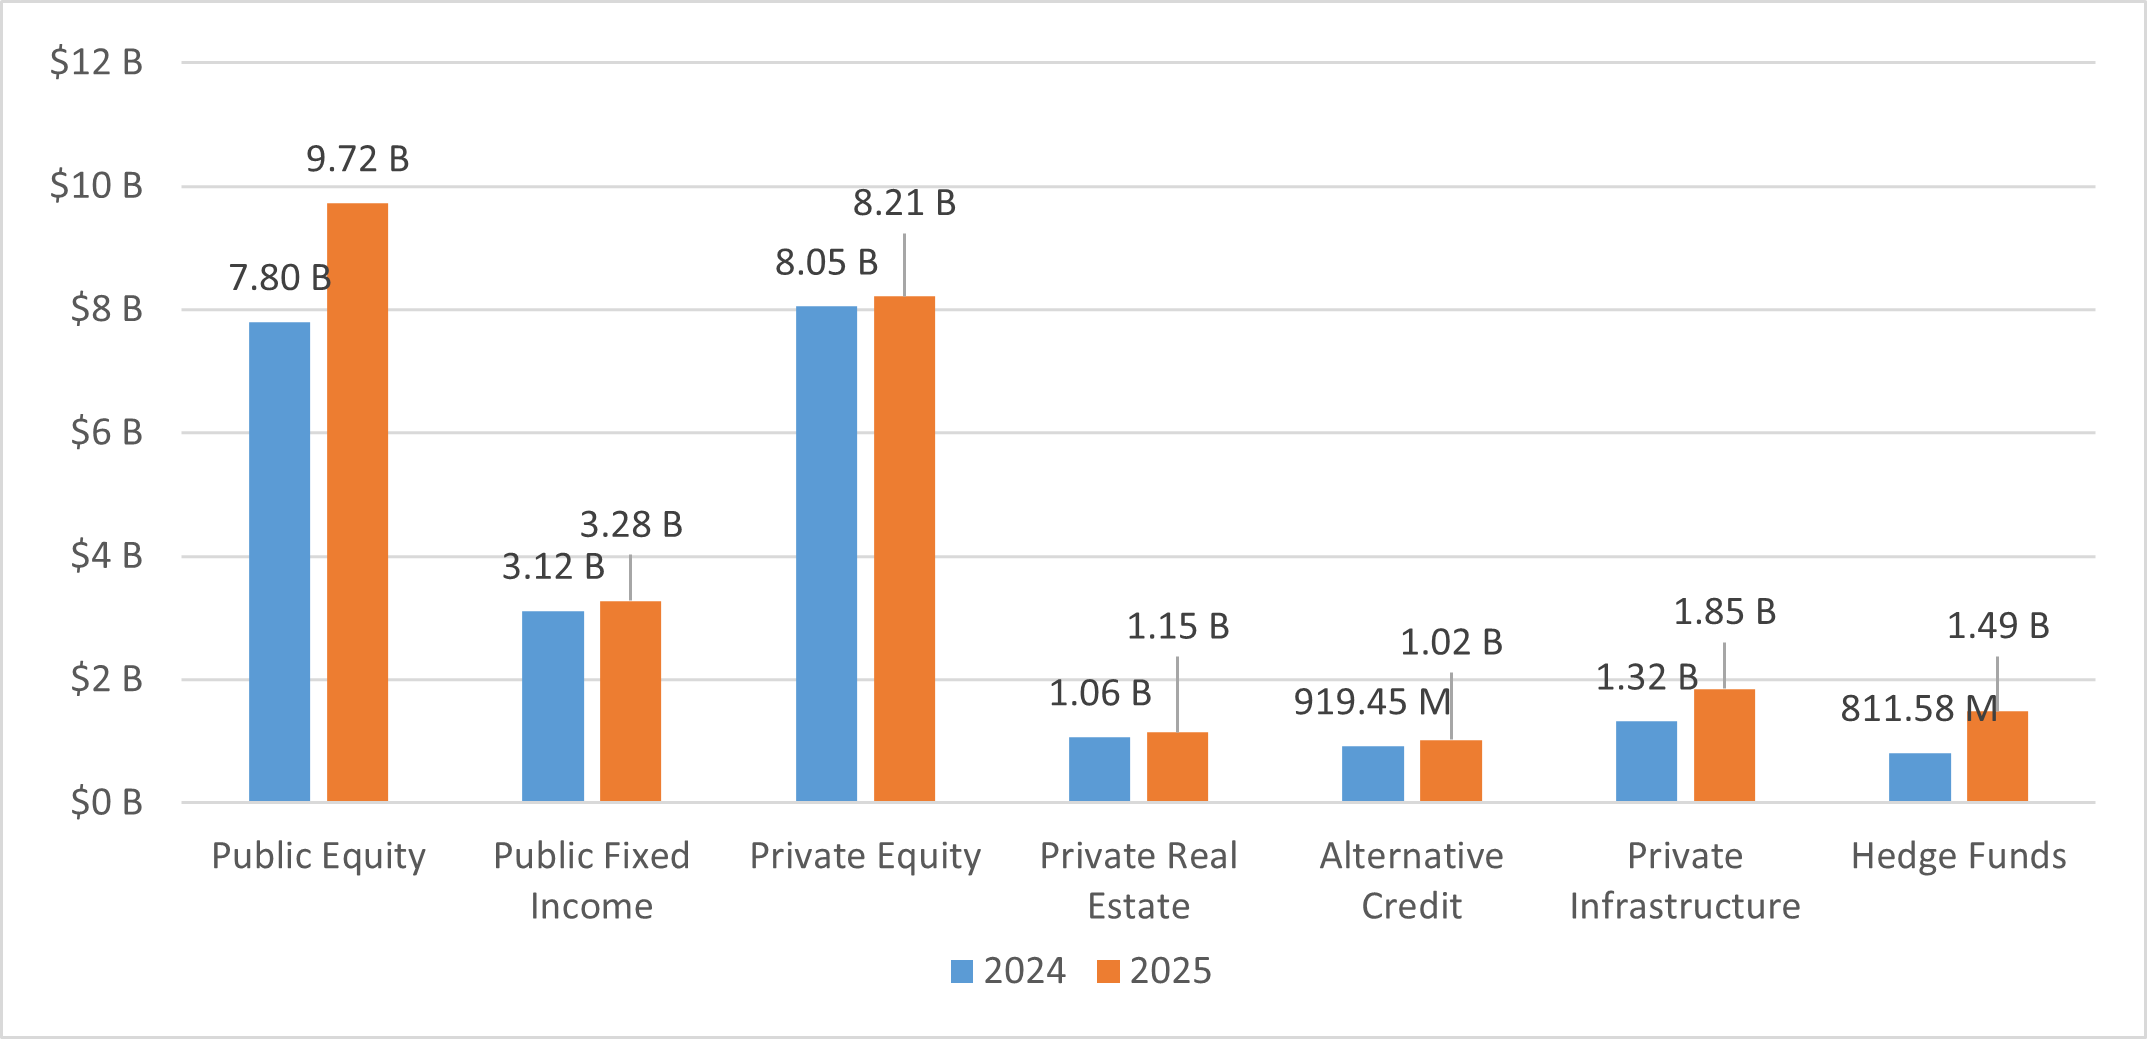
MWBE Exposure by Asset Class Change (2024-2025)
MWBE exposure has grown in nearly every asset class, partially due to increased allocations to emerging managers in Private Equity, Private Real Estate, Alternative Credit and Hedge Funds.
MWBE Exposure by Asset Class Change (2024-2025)
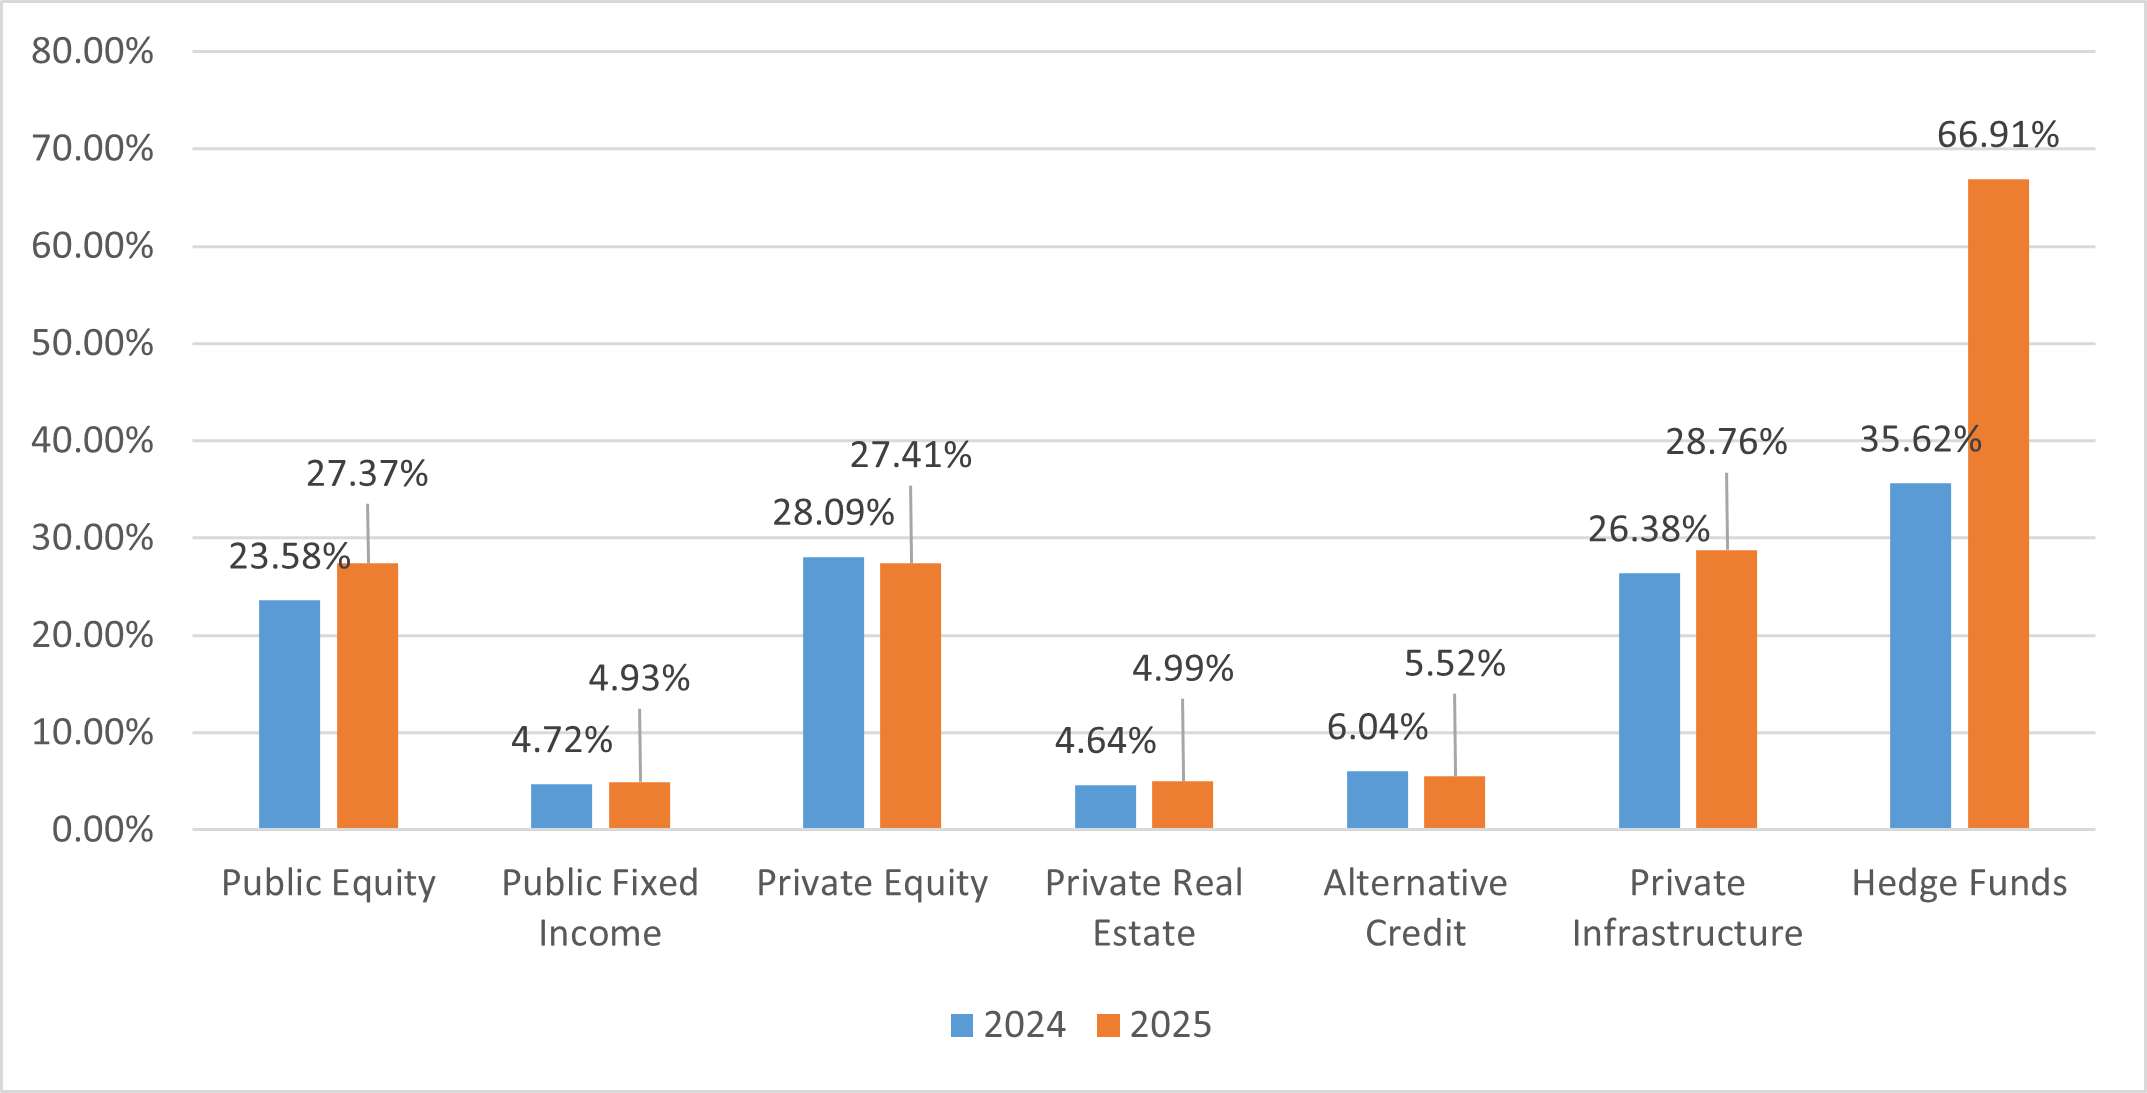
MWBE Exposure by Asset Class Change Percentage (2024-2025)
Key Definitions for MWBE Investments
Effective July 1, 2024, the New York City Retirement Systems adopted updated definitions for Minority- and/or Women-Owned Business Enterprises (MWBEs). These standards apply across all asset classes—including direct investments, co-investments, and Fund-of-Funds—and align with industry norms for ownership and control.
- Majority-Owned MWBE Manager (Public or Private Markets)
A U.S.-based firm that is 51% or more owned and controlled by U.S. citizens or residents who are women and/or members of minority groups, including African American/Black, Asian American, Hispanic/Latinx, Middle Eastern/North African, Indigenous Peoples, or individuals identifying with Two or More Races. These individuals must hold investment decision-making and/or executive leadership authority.
- Substantially-Owned MWBE Manager (Private Markets)
A U.S.-based private markets firm that is at least 33% owned and controlled by women and/or members of minority groups, as defined above, who also hold demonstrable investment or executive authority.
- Diverse Economics MWBE Manager (Private Markets)
A U.S.-based private markets firm where women and/or members of minority groups have at least 33% participation in fund economics or carried interest, even if ownership falls below control thresholds.
For relationships established prior to July 1, 2024, the previous 25% ownership and control standard will be recognized as a legacy designation.
In addition, the Systems have adopted an aspirational goal of 3% of total AUM for Veteran-Owned (VBE) firms, reflecting the Comptroller’s ongoing commitment to inclusion across all segments of the asset management industry.
Outreach Efforts for MWBE and Emerging Managers
The System’s commitment to and ongoing pursuit of strong performing diverse and emerging managers is evidenced as follows:
Annual Diverse and Emerging Managers Conference
The Annual Diverse and Emerging Managers Investment Conference, hosted by BAM in partnership with the Systems, provides an opportunity to gain insight into the guiding principles and priorities of the Systems for making and increasing investments with diverse and emerging managers. The conference also provides a unique opportunity for potential managers to meet with staff from BAM and other investment partners. The conference highlights the work BAM does on behalf of the Systems to strengthen diversity among our asset managers and the economic value creation that diversity brings. The conference features asset class-specific panel discussions and speed networking sessions that provide diverse and emerging managers the opportunity to meet one-on-one with BAM’s investment team, the Systems’ Emerging Manager Program partners, and each System’s consultants. The Head of Diverse and Emerging Manager Strategy is responsible for overseeing all aspects of the conference planning and execution.
Outreach
The team within Responsible Investing which includes the Deputy Chief Investment Officer, the Head of Diverse and Emerging Manager Strategy and the Investment Officer for Responsible Investing all attend industry conferences and events throughout the year to:
- Promote the Systems’ Emerging Manager Programs
- Strengthen the pipeline of new investment managers
- Nurture relationships with existing mangers
- Provide thought leadership on DEI and Emerging Manager Programs
Database
BAM maintains a database of diverse and emerging managers by asset class. The purpose is to log each manager meeting to enable manager information to be tracked over time. This database has 2,000+ manager contacts, as of September 2025.
Building a Pipeline
BAM has an open-door investment meeting policy; therefore we encourage managers to contact us and request meetings at least once a year. Managers should contact BAM directly and not through any third party capital introduction or placement agent services. Manager engagement is based on the stage of the entrepreneur or fund:
Step 1 – Assess manager stage
Step 2 – Commence follow-up based on manager stage
- Pre-deal/Pre-fund:
- Share EM Program requirements
- Talk founder through team, track record, ODD, resources, fundraising, and scalability
- Seedless Sponsor:
- Introduce to relevant EM Program Partner
- Talk founder through team, track record, ODD and fund formation
- Fund I, II, III or IV:
- Introduce to relevant EM Program Partner and other allocators
- Understand fundraising goals and targets
- If potential candidate for Direct Emerging, introduce to asset class team and relevant System consultants
- Large/Established Manager:
- Introduce to asset class team, System consultants, and other allocators
- Understand fundraising goals and targets
- Receive feedback from EM Program partner, other allocators, asset class heads, and System consultants
Step 3 – Allocate, Track and Report
- Emerging Manager Program Partners
- Track allocations and performance of diverse and emerging managers
- Strong performance can lead to additional allocations or underlying sub-managers may transition to direct allocations
- Consultants
- BAM staff works with the Systems’ consultants to identify and evaluate MWBE firms for consideration in the System’s Fund-of-Fund programs, Direct Emerging Manager Programs and in the Core Portfolio
Emerging Managers
In Fiscal Year 2024–2025, the Systems increased exposure to Emerging Managers by almost $3 billion. The FY 2025 total Emerging Manager exposure is $13.02 billion, up from $10.36 billion in FY 2024. These increases can be attributed to strong performance in equities and the continued deployment of re-up capital by our Emerging Manager Program Partners, who allocated to both new and existing emerging managers throughout FY 2025.
Total EM Exposure
Emerging Manager % of Asset Class Total Exposure

Emerging Manager Program Partners Allocations to Diverse Managers, FY 2025
| Asset Class | EM Program Manager Name | % MWBE Allocation |
|---|---|---|
| Public Equity | Bivium | 74% |
| Leading Edge | 85% | |
| Legato | 45% | |
| Xponance | 65% | |
| Fixed Income | Bivium | 68% |
| Private Equity | Neuberger Berman | 42% |
| Real Estate | GCM Grosvenor | 56% |
| Private Credit | GCM Grosvenor | 70% |
| Infrastructure | Blackrock | 31% |
As of June 30, 2025
* = MWBE owned
Emerging Manager Program Descriptions and Contact Information
Public Equity
Bivium, Leading Edge, and Xponance Programs
- Focus on international equity
- No more than $5 billion of firm-wide assets under management
Legato Program
- Focus on US small cap equity
- No more than $2 billion of firm-wide assets under management
| ram | Name | |
|---|---|---|
| Bivium | Judy Lui | Research@biviumcapital.com |
| Leading Edge | Carolyn Diaz Roberts | info@leia.net |
| Xponance | Cesar Gonzales Jr. | CGonzales@xponance.com |
| Legato | Diana Tamhankar | InvestmentTeam@legatocm.com |
Public Fixed Income
Direct Developing Manager Program
- Larger firms that have transitioned out of the Emerging Manager program as well as managers with similar characteristics that are otherwise sourced
Bivium Program
- No more than $10 billion of firm-wide assets under management
| Program | Name | |
| Bivium | Judy Lui | Research@biviumcapital.com |
Private Equity
Direct Emerging Manager Evergreen Program
- Funds up to $3 billion in size, being raised by firms with up to $5 billion in AUM and with less than 10 years of an institutional track record
- Focus on buyout, growth equity, and secondaries strategies
- Firms with institutional-quality back offices and strong operational controls
External (Neuberger Berman) First Time Funds Program
- First institutional fundraise, raising up to $1 billion
| Program | Name | |
| Neuberger Berman | Ethan Cooper | northbound@nb.com |
Real Estate
GCM Grosvenor Emerging Manager SMA II
- Firms with less than $3 billion in total assets under management
- Raising institutional Fund I, II, III, or IV
- Currently targeting fund size of $1 billion or less
| Program | Name | |
| GCM Grosvenor | Peter Braffman | realestate@gcmlp.com |
Alternative Credit
GCM Grosvenor Early-Stage Program
- For open-end vehicles — Less than $1 billion in assets under management, an operational track record of less than 3 years, and the first open-end institutional-grade fund raised at current independent organization
- For closed-end vehicles — No more than $1.5 billion in assets under management and an operational track record of less than 6 years, and raising Funds I, II, or III
| Program | Name | |
| GCM Grosvenor | Marc Iyer | miyer@gcmlp.com |
Infrastructure
BlackRock Infrastructure Solutions
- Raising Fund I, II, or III
- No more than $1.5 billion in aggregate capital commitments
| Program | Name | |
| BlackRock | Melissa Ding | GroupBISEmergingManagers@blackrock.com |
Hedge Funds
Direct Program
- Firms with less than $1 billion in assets under management or less than a 3-year track record at time of funding
- Discretionary and systematic macro, commodities, credit, long/short equity, event driven, tactical trading, relative value strategies and focus on low net exposure funds
MWBE and Emerging Managers Performance
Emerging and MWBE managers have historically generated alpha for the five New York City retirement systems since 2015. In Public Markets, 5- and 10-year net excess returns remain positive. In Private Markets, MWBE firms in the Systems’ portfolio continue to outperform their respective benchmarks, with an average PME Spread of 7%—an increase from the ~5% average reported over the past two fiscal years, which we believe underscores not only strengthened performance across multiple asset classes but also the broader value proposition of diversity as a driver of differentiated insight, disciplined risk-taking, and strong returns.
Note that the Public Market Equivalent (PME) Spread is a measure of the opportunity cost of investing in Public Market Equivalents. A positive PME spread indicates outperformance, excluding fees. The performance below is as of June 30, 2025. Note that past performance is not indicative of future results.
*Please note that different PME methods were used for each asset class.
Public Equity
| 1 Year Net Excess % | 3 Year Net Excess % | 5 Year Net Excess % | 10 Year Net Excess % | |
|---|---|---|---|---|
| Emerging Managers — Small Cap | 3.82% | 1.70% | 3.86% | N/A |
| Emerging Managers — International Equity | 2.38% | 1.46% | 0.62% | N/A |
| Direct MWBE Small Cap | -1.83% | -5.99% | -7.75% | 1.47% |
| Direct MWBE Mid Cap | -8.63% | -7.42% | N/A | N/A |
| Direct MWBE International Equity | 5.31% | 6.27% | 5.36% | 1.47% |
The above returns are composites based on manager allocations at the end of the current investment period. Benchmark performance is calculated using a weighted composite benchmark of each individual manager. N/A indicates that the specific strategy was launched after the listed date.
Public Fixed Income
| 1 Year Net Excess % | 3 Year Net Excess % | 5 Year Net Excess % | 10 Year Net Excess % | |
|---|---|---|---|---|
| Emerging Managers* | 0.28% | N/A | N/A | N/A |
| MWBE | -0.32% | -0.29% | 0.21% | 0.32% |
The above returns are composites based on manager allocations at the end of the current investment period. Benchmark performance is calculated using a weighted composite benchmark of each individual manager.
* The Emerging Manager Program was funded in November 2022
Private Equity
| Net IRR | Net TVPI | PME Spread** | |
|---|---|---|---|
| Emerging Managers* | 18.90% | 1.49x | 3.30% |
| Direct MWBEs | 12.56% | 1.43x | 14.75% |
Performance shown for fund commitments made since 2015
* Includes all Direct Emerging Manager programs and Neuberger Berman NYC-NorthBound First-Time Funds Program
**PME Spread is the difference between the Net IRR and a Public Market Equivalent benchmark (Russell 3000), using the PME+ method
Real Estate
| Net IRR | Net TVPI | PME Spread** | |
|---|---|---|---|
| Emerging Managers* | 1.80% | 1.04x | -6.00% |
| Direct MWBEs | 10.61% | 1.26x | 9.42% |
2015 marks the year in which the real estate emerging manager program was re-launched
*Emerging managers are allocated to using a Fund of Fund structure. Performance is net at the submanager level, but gross of any Fund of Fund fees.
**The Public Market Equivalent used to calculate the PME Spread was 50% Russell 3000 & 50% US Barclays Aggregate bond index using the PME+ method
Alternative Credit
| Net IRR | Net TVPI | PME Spread*** | |
|---|---|---|---|
| Emerging Managers* | 17.6 % | 1.6x | 9.7% |
| Direct MWBEs** | 8.7% | 1.36x | 3.0% |
This program was incepted in 2007
*The composite here are two GCM Grosvenor SMAs. Emerging managers, inception of this mandate is 2020, are allocated to using a Fund of Fund structure. Performance is net at the submanager level, and net of any Fund of Fund fees.
**The composite of direct MWBEs include Brightwood and Charlesbank as of 2Q25.
***The Public Market Equivalent used to calculate the PME Spread was 50% JPM Global High Yield Index + 50% Credit Suisse Leveraged Loan Index using the Direct Alpha method.
Infrastructure
| Net IRR | Net TVPI | PME Spread** | |
|---|---|---|---|
| Emerging Managers* | 12.06% | 1.22x | 0.00% |
| Direct MWBEs | 9.06% | 1.41x | 1.32% |
2020 marks the year in which the infrastructure emerging manager program was launched
*Emerging managers are allocated to using a Fund of Fund structure. Performance is net at the submanager level, but gross of any Fund of Fund fees
**The Public Market Equivalent used to calculate the PME Spread was 50% Russell 3000 Index & 50% Barclays US Aggregate Index using the PME+ method
Hedge Funds
| 10 Year Net Return | |
|---|---|
| Emerging Managers | 4.26% |
| MWBEs | 6.16% |
Emerging Managers Program Expansion Initiative
Since 2015, emerging and MWBE managers have consistently delivered excess historcial returns net of fees across all five systems. We believe increasing our exposure to these managers allows us to leverage their depth of expertise and supports our goals of financial stability, prudent diversification, and dynamic asset management.
Our decision to expand the Emerging Manager programs reflects both their historical success and our belief that diversity—in gender, ethnicity, backgrounds, and firm size—enhances portfolio performance. By incorporating a wide range of asset managers, including diverse and emerging players, we seek to strengthen the Systems’ resilience to market changes and economic shifts. We believe this strategy supports a well-diversified portfolio that helps manage risk effectively and maximizes long-term returns for our beneficiaries.
Aligned with our fiduciary duty to seek the best risk-adjusted returns, we continue to toward our aspirational goal of having 20% of U.S.-based actively managed assets with MWBE managers by 2029.
Fiscal Year 2025 Program Expansions
The following Emerging Manager program expansion was approved by at least a subset of the five pension funds in the second half of 2024 and are reflected in this year’s report:
- GCM Grosvenor OFI Emerging Manager SMA III
Program Expansions Fiscal Year 2026 and Beyond
The investment staff will continue to work with consultants to identify, report, track and evaluate what they believe are high performing diverse and emerging managers for consideration in the Systems portfolios. The following strategies have been highlighted and will each be diligenced and presented to the boards for discussion and potential approval in fiscal year 2026 and beyond:
- Expanding the Direct Emerging Manager Program to other private markets asset classes
- Expanding the Fixed Income Emerging Manager Program to include Direct Emerging
- Exploring opportunities to invest in Venture Capital within the Private Equity Emerging Manager Program
Breaking Down the Data by Asset Class (MWBE and Emerging)
- The demographic categories assigned to each manager was based off of the ownership data reported by the manager
- MBE designates a firm majority or substantially owned by a male member of a minority group (Asian, Black, Hispanic, Middle Eastern or Native American)
- WBE designates a firm majority or substantially owned by a woman
- Amounts shown below are total exposure, including both net asset value and unfunded commitments.
Public Equities
| ASSET CLASS TOTAL | ||||||||
|---|---|---|---|---|---|---|---|---|
| BERS | FIRE | NYCERS | POLICE | TRS | Total | |||
| 315.49 M | 578.77 M | 3.15 B | 1.67 B | 3.84 B | 9.56 B | |||
| LARGE MWBE FIRMS | ||||||||
| Firm Name | BERS | FIRE | NYCERS | POLICE | TRS | Total | MWBE STATUS | MWBE % |
| 216.05 M | 385.98 M | 2.03 B | 1.20 B | 2.52 B | 6.36 B | |||
| Brown Capital Management | 44.18 M | 87.78 M | 352.94 M | 484.90 M | Black | 100% | ||
| Causeway Capital Management | 341.80 M | 1.86 B | 831.62 M | 1.99 B | 5.03 B | WBE | 100% | |
| Earnest Partners | 216.05 M | 168.11 M | 279.40 M | 180.11 M | 843.66 M | Black | 65% | |
| EMERGING MWBE FIRMS | ||||||||
| BERS | FIRE | NYCERS | POLICE | TRS | Total | |||
| 99.44 M | 192.79 M | 1.12 B | 466.71 M | 1.32 B | 3.20 B | |||
| Bivium | 343.54 M | 415.88 M | 759.42 M | |||||
| ARGA Investment Management | 105.49 M | 127.14 M | 232.63 M | Asian | 100% | |||
| Cedar Street Asset Management | 23.02 M | 27.94 M | 50.96 M | Asian | 50% | |||
| Channing Capital Management | 101.84 M | 123.71 M | 225.55 M | Two or More Races WBE | 100% | |||
| Global Alpha Capital Management, Ltd | 21.68 M | 26.58 M | 48.26 M | Asian | 57% | |||
| Promethos Capital | 91.52 M | 110.51 M | 202.03 M | WBE | 75% | |||
| Leading Edge | 388.44 M | 232.90 M | 453.37 M | 1.07 B | ||||
| Ativo Capital Management | 68.63 M | 41.77 M | 80.30 M | 190.70 M | Asian, Black, Hispanic | 100% | ||
| Frontier Global Partners | 49.52 M | 29.73 M | 58.26 M | 137.51 M | Asian, Hispanic | 69% | ||
| Haven Global Partners | 77.88 M | 45.96 M | 90.29 M | 214.13 M | Asian, Black WBE | 72% | ||
| Promethos Capital | 74.98 M | 45.32 M | 87.43 M | 207.73 M | WBE | 75% | ||
| Redwood Investments | 56.25 M | 33.18 M | 64.17 M | 153.60 M | WBE | 100% | ||
| Solstein Capital | 61.18 M | 36.94 M | 72.92 M | 171.04 M | Hispanic WBE | 100% | ||
| Legato | 9.04 M | 16.25 M | 90.11 M | 54.33 M | 89.22 M | 258.95 M | ||
| Altravue Capital | 4.51 M | 8.22 M | 45.20 M | 27.27 M | 44.70 M | 129.90 M | Asian, Black WBE | 90% |
| Lisanti Capital Growth | 2.23 M | 3.97 M | 21.83 M | 13.11 M | 21.67 M | 62.81 M | WBE | 52% |
| Nicholas Investment Partners | 2.30 M | 4.06 M | 23.08 M | 13.95 M | 22.85 M | 66.24 M | WBE | 56% |
| Xponance | 90.40 M | 176.54 M | 298.83 M | 179.48 M | 361.22 M | 1.11 B | ||
| ARGA Investment Management | 15.52 M | 26.27 M | 43.99 M | 33.07 M | 65.45 M | 184.30 M | Asian | 100% |
| Foresight Global Investors | 19.75 M | 42.13 M | 70.65 M | 37.59 M | 70.73 M | 240.85 M | Asian | 95% |
| Gillman Hill Asset Management | 11.00 M | 21.73 M | 36.81 M | 21.65 M | 44.24 M | 135.43 M | WBE | 93% |
| Haven Global Partners | 15.38 M | 30.35 M | 50.87 M | 28.56 M | 60.98 M | 186.15 M | Asian, Black, Hispanic WBE | 82% |
| Martin Investment Management | 12.49 M | 24.15 M | 42.53 M | 26.04 M | 53.95 M | 159.16 M | WBE | 53% |
| Pensera Global Investors | 8.13 M | 15.96 M | 27.02 M | 16.30 M | 32.96 M | 100.37 M | Hispanic | 64% |
| Ravenswood Partners | 8.12 M | 15.94 M | 26.96 M | 16.28 M | 32.90 M | 100.21 M | Asian | 90% |
Public Fixed Income
| ASSET CLASS TOTAL | ||||||||
|---|---|---|---|---|---|---|---|---|
| BERS | FIRE | NYCERS | POLICE | TRS | Total | |||
| 308.05 M | 85.41 M | 2.15 B | 291.00 M | 437.63 M | 3.21 B | |||
| LARGE MWBE FIRMS | ||||||||
| Firm Name | BERS | FIRE | NYCERS | POLICE | TRS | Total | MWBE STATUS | MWBE % |
| 231.53 M | 85.41 M | 1.96 B | 291.00 M | 284.29 M | 2.85 B | |||
| Advent Capital Management | 1.35 B | 1.35 B | Black, Middle Eastern | 94% | ||||
| GIA Partners | 37.15 M | 201.72 M | 73.27 M | 95.89 M | 408.03 M | Asian, Hispanic | 87% | |
| LM Capital Group | 32.52 M | 351.92 M | 72.25 M | 127.70 M | 584.39 M | Hispanic, Middle Eastern | 90% | |
| Loop Capital Asset Management | 114.46 M | 114.46 M | Asian, Black, Hispanic | 82% | ||||
| Pugh Capital Management | 231.53 M | 15.74 M | 51.37 M | 31.02 M | 60.70 M | 390.36 M | Asian, Black WBE | 82% |
| EMERGING MWBE FIRMS | ||||||||
| BERS | FIRE | NYCERS | POLICE | TRS | Total | |||
| 76.52 M | 0.00 K | 197.19 M | 0.00 K | 153.34 M | 364.26 M | |||
| Bivium | 76.52 M | 197.19 M | 153.34 M | 364.26 M | ||||
| Barksdale Investment Management | 23.00 M | 23.00 M | 46.01 M | Asian WBE | 51% | |||
| Ducenta Squared Asset Management | 23.52 M | 29.33 M | 52.85 M | Asian | 94% | |||
| Integrity Fixed Income Management | 39.52 M | 23.21 M | 28.99 M | 91.72 M | WBE | 51% | ||
| New Century Advisors | 37.00 M | 31.49 M | 33.34 M | 101.84 M | WBE | 58% | ||
| Ramirez Asset Management | 33.17 M | 38.67 M | 71.84 M | Hispanic | 95% |
Private Equity
| ASSET CLASS TOTAL | ||||||||
|---|---|---|---|---|---|---|---|---|
| BERS | FIRE | NYCERS | POLICE | TRS | Total | |||
| 441.41 M | 676.62 M | 2.64 B | 1.60 B | 2.86 B | 8.21 B | |||
| LARGE MWBE FIRMS | ||||||||
| Firm Name | BERS | FIRE | NYCERS | POLICE | TRS | Total | MWBE STATUS | MWBE % |
| 343.31 M | 564.81 M | 2.08 B | 1.37 B | 2.26 B | 6.62 B | |||
| Clearlake Capital Group | 71.60 M | 133.20 M | 446.42 M | 288.88 M | 520.57 M | 1.46 B | Asian, Hispanic | 78% |
| Grain Management | 1.56 M | 2.60 M | 10.93 M | 7.80 M | 10.93 M | 33.82 M | Black | 100% |
| One Rock Capital Partners | 41.37 M | 55.32 M | 149.71 M | 94.19 M | 179.84 M | 520.44 M | Asian | 51% |
| Reverence Capital Partners | 33.24 M | 18.63 M | 75.65 M | 66.34 M | 63.76 M | 257.62 M | Hispanic | 60% |
| Stellex Capital Management | 37.75 M | 23.13 M | 91.02 M | 58.10 M | 90.42 M | 300.42 M | Black | 51% |
| Thoma Bravo | 50.83 M | 133.35 M | 461.45 M | 301.66 M | 541.73 M | 1.49 B | Hispanic | 17% |
| Valor Equity Partners | 15.72 M | 26.51 M | 111.79 M | 75.50 M | 96.33 M | 325.85 M | Hispanic | 94% |
| Vista Equity Partners | 91.23 M | 172.06 M | 735.98 M | 475.23 M | 752.97 M | 2.23 B | Black | 50% |
| EMERGING MWBE FIRMS | ||||||||
| BERS | FIRE | NYCERS | POLICE | TRS | Total | |||
| 98.10 M | 111.82 M | 557.62 M | 231.66 M | 598.74 M | 1.60 B | |||
| Base10 | 23.91 M | 23.91 M | Black | 100% | ||||
| Grain Management | 6.66 M | 3.59 M | 6.66 M | 16.91 M | Black | 100% | ||
| Integrum Capital | 14.91 M | 30.46 M | 108.15 M | 61.37 M | 132.43 M | 347.32 M | Black | 29% |
| Knox Lane | 4.73 M | 5.06 M | 31.19 M | 10.47 M | 34.57 M | 86.02 M | Asian | 33% |
| Lee Equity | 4.49 M | 4.83 M | 30.05 M | 10.16 M | 33.71 M | 83.24 M | Asian, Hispanic | 46% |
| Lightbay Investment | 4.07 M | 4.07 M | 24.40 M | 8.13 M | 27.11 M | 67.77 M | Asian | 40% |
| OceanSound Partners | 21.84 M | 65.81 M | 19.53 M | 89.68 M | 196.86 M | Hispanic | 51% | |
| Reverence Capital Partners | 8.04 M | 8.04 M | 48.23 M | 16.08 M | 53.59 M | 133.98 M | Hispanic | 60% |
| Stellex Capital Management | 3.18 M | 3.18 M | 20.27 M | 6.76 M | 22.26 M | 55.65 M | Black | 51% |
| Valor Equity Partners | 14.61 M | 13.31 M | 80.50 M | 26.61 M | 89.37 M | 224.40 M | Hispanic | 94% |
| Vista Equity Partners | 2.60 M | 14.41 M | 5.59 M | 16.02 M | 38.62 M | Black | 50% | |
| Neuberger Berman | 13.49 M | 14.85 M | 134.60 M | 60.31 M | 100.00 M | 323.26 M | ||
| Avance Investment | 493.02 K | 493.02 K | 5.17 M | 2.19 M | 3.79 M | 12.13 M | Hispanic | 75% |
| Banneker Partners | 655.76 K | 655.76 K | 6.87 M | 2.91 M | 5.04 M | 16.13 M | Black | 100% |
| Bharcap Partners | 866.71 K | 866.71 K | 9.08 M | 3.85 M | 6.66 M | 21.32 M | Asian | 73% |
| Coalesce Capital | 1.35 M | 1.73 M | 12.16 M | 6.09 M | 9.30 M | 30.63 M | WBE | 100% |
| Elevation Labs | 459.85 K | 459.85 K | 4.82 M | 2.04 M | 3.53 M | 11.31 M | Asian | 33% |
| Equality Asset Management | 1.24 M | 2.11 M | 8.67 M | 5.77 M | 7.22 M | 25.00 M | Asian | 33% |
| Ethos Capital | 902.63 K | 902.63 K | 9.46 M | 4.01 M | 6.93 M | 22.20 M | Two or More Races | 50% |
| Examinetics | 195.71 K | 195.71 K | 2.05 M | 868.97 K | 1.50 M | 4.81 M | WBE | 100% |
| Fingerpaint Marketing | 831.34 K | 831.34 K | 8.71 M | 3.69 M | 6.38 M | 20.45 M | Asian | 33% |
| Identity Digital | 745.45 K | 745.45 K | 7.81 M | 3.31 M | 5.73 M | 18.34 M | Two or More Races | 50% |
| Impel | 538.43 K | 538.43 K | 5.64 M | 2.39 M | 4.14 M | 13.25 M | Asian | 100% |
| Insurvia | 552.32 K | 552.32 K | 5.79 M | 2.45 M | 4.24 M | 13.59 M | Asian | 73% |
| Knox Lane | 860.17 K | 860.17 K | 9.01 M | 3.82 M | 6.61 M | 21.16 M | Asian | 33% |
| Newforma (Ethos | 296.94 K | 296.94 K | 3.11 M | 1.32 M | 2.28 M | 7.30 M | Two or More Races | 50% |
| Precision Aviation | 872.84 K | 872.84 K | 9.15 M | 3.88 M | 6.70 M | 21.47 M | Asian, Black, Hispanic, Indigenous, Middle Eastern, Two or More Races, Other | 75% |
| Preservation Capital | 150.73 K | 255.93 K | 1.05 M | 700.02 K | 876.03 K | 3.03 M | Asian | 100% |
| Project Vision | 84.66 K | 84.66 K | 887.22 K | 375.89 K | 650.18 K | 2.08 M | Hispanic | 75% |
| Red Arts | 1.02 M | 1.02 M | 10.73 M | 4.55 M | 7.87 M | 25.19 M | Black | 100% |
| Wavecrest Growth | 651.38 K | 651.38 K | 6.83 M | 2.89 M | 5.00 M | 16.02 M | Asian | 100% |
| WM Partners | 724.44 K | 724.44 K | 7.59 M | 3.22 M | 5.56 M | 17.82 M | Hispanic | 100% |
* Note that we have excluded exposure data for TRS, Police and Fire for JPM as we do not have the System-level breakdown
**MWBE status reported as of the time the fund commitment was made
Private Real Estate
| ASSET CLASS TOTAL | ||||||||
|---|---|---|---|---|---|---|---|---|
| BERS | FIRE | NYCERS | POLICE | TRS | Total | |||
| 54.98 M | 52.95 M | 401.81 M | 136.70 M | 499.56 M | 1.15 B | |||
| LARGE MWBE FIRMS | ||||||||
| Firm Name | BERS | FIRE | NYCERS | POLICE | TRS | Total | MWBE STATUS | MWBE % |
| 26.73 M | 0.00 K | 51.32 M | 21.38 M | 60.94 M | 160.37 M | |||
| Basis Management Group | 26.73 M | 51.32 M | 21.38 M | 60.94 M | 160.37 M | Black, Middle Eastern WBE | 100% | |
| EMERGING MWBE FIRMS | ||||||||
| BERS | FIRE | NYCERS | POLICE | TRS | Total | |||
| 28.25 M | 52.95 M | 350.49 M | 115.32 M | 438.62 M | 985.64 M | |||
| Artemis Real Estate Partners | 28.25 M | 44.24 M | 176.64 M | 99.50 M | 226.02 M | 574.65 M | Asian WBE | 56% |
| Basis Management Group | 3.36 M | 13.94 M | 7.79 M | 15.91 M | 41.00 M | Black WBE | 51% | |
| GCM Grosvenor Real Estate | 5.35 M | 159.91 M | 8.03 M | 196.69 M | 369.99 M | |||
| Alpaca | 388.71 K | 9.87 M | 583.07 K | 12.33 M | 23.17 M | Hispanic | 60% | |
| American Value Partners | 431.09 K | 3.90 M | 646.64 K | 5.80 M | 10.78 M | WBE | 51% | |
| Arc | 7.51 M | 8.40 M | 15.91 M | Black | 100% | |||
| Basis Management Group | 9.31 M | 10.41 M | 19.72 M | Asian, Black WBE | 100% | |||
| Brasa | 483.96 K | 27.29 M | 725.95 K | 32.14 M | 60.64 M | Hispanic | 100% | |
| Grandview | 799.67 K | 17.62 M | 1.20 M | 22.37 M | 41.98 M | Asian, Black | 55% | |
| Griffith V | 371.64 K | 3.36 M | 557.47 K | 5.00 M | 9.29 M | WBE | 98% | |
| Hillcrest EY&I | 7.66 M | 8.57 M | 16.23 M | Black WBE | 100% | |||
| Locust Point | 10.75 M | 12.02 M | 22.77 M | Other WBE | 66% | |||
| MCB GP | 5.10 M | 5.71 M | 10.81 M | Black | 53% | |||
| OlivePoint | 508.16 K | 4.60 M | 762.24 K | 6.83 M | 12.70 M | Hispanic | 67% | |
| Pennybacker Credit | 6.17 M | 6.90 M | 13.08 M | Asian, Hispanic | 50% | |||
| Proteus MHP | 594.06 K | 5.38 M | 891.09 K | 7.99 M | 14.85 M | Asian | 100% | |
| Raith | 202.00 K | 8.89 M | 303.00 K | 10.62 M | 20.01 M | Asian | 48% | |
| Redcar II | 5.09 M | 5.70 M | 10.79 M | Asian | 50% | |||
| SREI Industrial | 1.17 M | 10.63 M | 1.76 M | 15.80 M | 29.37 M | Asian, Black | 100% | |
| Stillwater Asset Management, LLC | 399.43 K | 3.61 M | 599.14 K | 5.37 M | 9.99 M | WBE | 100% | |
| Sundance Bay | 3.08 M | 3.44 M | 6.52 M | Asian, Black WBE | 27% | |||
| Ethos Investco | 10.09 M | 11.29 M | 21.38 M | Black WBE | 51% |
Alternative Credit
| ASSET CLASS TOTAL | ||||||||
|---|---|---|---|---|---|---|---|---|
| BERS | FIRE | NYCERS | POLICE | TRS | Total | |||
| 85.00 M | 72.78 M | 322.57 M | 197.51 M | 343.83 M | 1.02 B | |||
| LARGE MWBE FIRMS | ||||||||
| Firm Name | BERS | FIRE | NYCERS | POLICE | TRS | Total | MWBE STATUS | MWBE % |
| 42.29 M | 26.43 M | 31.72 M | 69.94 M | 172.88 M | 343.25 M | |||
| Brightwood Capital | 38.22 M | 125.31 M | 163.52 M | Asian, Black, Hispanic, Two or More Races WBE | 61% | |||
| Charlesbank Capital Partners | 42.29 M | 26.43 M | 31.72 M | 31.72 M | 47.58 M | 179.73 M | Asian | 44% |
| EMERGING MWBE FIRMS | ||||||||
| BERS | FIRE | NYCERS | POLICE | TRS | Total | |||
| 42.72 M | 46.35 M | 290.85 M | 127.58 M | 170.94 M | 678.44 M | |||
| Brightwood Capital | 42.72 M | 14.24 M | 119.97 M | 51.13 M | 228.05 M | Asian, Black, Hispanic, Two or More Races WBE | 61% | |
| GCM Grosvenor Private Credit | 32.11 M | 170.88 M | 76.45 M | 170.94 M | 450.39 M | |||
| Altura Capital | 3.85 M | 1.69 M | 4.41 M | 9.95 M | Hispanic | 100% | ||
| Charlesbank Capital Partners | 4.36 M | 12.00 M | 5.45 M | 10.36 M | 32.17 M | Asian WBE | 33% | |
| Comvest Special | 13.11 M | 5.76 M | 15.03 M | 33.91 M | Asian, Hispanic | 35% | ||
| Crayhill Principal | 5.46 M | 23.57 M | 10.59 M | 22.77 M | 62.39 M | Hispanic | 51% | |
| HG Vora | 4.37 M | 12.02 M | 5.46 M | 10.38 M | 32.22 M | Asian | 100% | |
| Hollis Park | 4.26 M | 1.87 M | 4.89 M | 11.02 M | Black | 86% | ||
| Kah Capital Management | 4.34 M | 11.95 M | 5.43 M | 10.32 M | 32.04 M | Black, Middle Eastern | 100% | |
| Paceline Equity | 9.28 M | 45.47 M | 20.37 M | 44.91 M | 120.02 M | WBE | 51% | |
| Reverence Capital Partners | 14.01 M | 6.16 M | 16.07 M | 36.24 M | Hispanic | 60% | ||
| TELEO Capital, | 4.30 M | 30.66 M | 13.66 M | 31.81 M | 80.42 M | Hispanic | 33% |
Private Infrastructure
| ASSET CLASS TOTAL | ||||||||
|---|---|---|---|---|---|---|---|---|
| BERS | FIRE | NYCERS | POLICE | TRS | Total | |||
| 5.58 M | 125.27 M | 627.42 M | 356.13 M | 735.91 M | 1.85 B | |||
| LARGE MWBE FIRMS | ||||||||
| Firm Name | BERS | FIRE | NYCERS | POLICE | TRS | Total | MWBE STATUS | MWBE % |
| 0.00 K | 122.96 M | 585.67 M | 334.01 M | 686.93 M | 1.73 B | |||
| Global Infrastructure Management | 77.16 M | 402.37 M | 233.21 M | 466.93 M | 1.18 B | Black | 25% | |
| I Squared | 45.80 M | 183.30 M | 100.80 M | 220.00 M | 549.90 M | Asian, Middle Eastern | 51% | |
| EMERGING MWBE FIRMS | ||||||||
| BERS | FIRE | NYCERS | POLICE | TRS | Total | |||
| 5.58 M | 2.31 M | 41.75 M | 22.12 M | 48.98 M | 120.74 M | |||
| BlackRock | 5.58 M | 2.31 M | 41.75 M | 22.12 M | 48.98 M | 120.74 M | ||
| American Triple I Partners | 624.15 K | 3.43 M | 1.72 M | 4.28 M | 10.05 M | Asian, Black, Hispanic | 95% | |
| Hull Street Energy | 1.85 M | 10.19 M | 5.10 M | 12.70 M | 29.83 M | WBE | 40% | |
| Sandbrook Climate | 2.31 M | 11.05 M | 6.77 M | 10.72 M | 30.85 M | Hispanic | 40% | |
| Tallvine Partners | 3.10 M | 17.07 M | 8.54 M | 21.28 M | 50.00 M | Hispanic, Middle Eastern | 38% |
**MWBE status reported as of the time the fund commitment was made
Hedge Funds
| ASSET CLASS TOTAL | ||||||||
|---|---|---|---|---|---|---|---|---|
| BERS | FIRE | NYCERS | POLICE | TRS | Total | |||
| 0.00 K | 286.88 M | 0.00 K | 1.20 B | 0.00 K | 1.49 B | |||
| LARGE MWBE FIRMS | ||||||||
| Firm Name | BERS | FIRE | NYCERS | POLICE | TRS | Total | MWBE STATUS | MWBE % |
| 0.00 K | 43.64 M | 0.00 K | 327.46 M | 0.00 K | 371.10 M | |||
| SCGE Management | 127.48 M | 127.48 M | Asian | 90% | ||||
| SRS Investment Management | 43.64 M | 199.99 M | 243.63 M | Asian | 100% | |||
| EMERGING MWBE FIRMS | ||||||||
| BERS | FIRE | NYCERS | POLICE | TRS | Total | |||
| 0.00 K | 243.25 M | 0.00 K | 873.85 M | 0.00 K | 1.12 B | |||
| AlphaQuest | 129.98 M | 473.75 M | 603.73 M | Middle Eastern | 90% | |||
| Gemsstock Ltd | 101.85 M | 363.94 M | 465.79 M | Hispanic | 26% | |||
| Standard General | 11.42 M | 36.16 M | 47.58 M | Asian | 51% |
Overview of the Bureau of Public Finance
The Public Finance Bureau manages all aspects of City capital borrowing for the Comptroller, acting jointly with the Mayor’s Office of Management and Budget (“OMB”), as required under State law. In this role, it promotes New York City’s short-term and long-term financial health by establishing and enforcing fiscally responsible debt practices, monitoring the City’s portfolio of outstanding bonds, and securing the lowest risk-appropriate borrowing cost on debt of the City and its affiliated entities. In addition, the Bureau directs interactions with ratings agencies, investors, and municipal market financial services firms on behalf of the Comptroller.
The Comptroller, through the Bureau of Public Finance, and the Mayor, through the Office of Management and Budget, share the responsibility for issuing bonds through the City’s General Obligation (“GO”), Transitional Finance Authority (“TFA”) and Municipal Water Finance Authority (“NYW”) credits (collectively, the “Issuers” or the “City”), the three main vehicles for financing capital spending. New York City and its related entities are in aggregate one of the largest municipal bond issuers in the nation. In Fiscal Year 2025, the City sold over $25 billion of debt for new capital projects or refinancing of outstanding bonds for debt service savings.
Public Finance provides leadership and support on issues that relate to debt or to City Issuers. The Deputy Comptroller and other senior staff may represent the Comptroller’s office as speakers at municipal market conferences and events and in testimony at the City Council on related topics.
The Bureau of Public Finance’s MWBE Program
The Bureau of Public Finance consistently promotes MWBE vendors’ access and growth, so that MWBE firms can capitalize on opportunities in public finance. After reimbursement of the actual construction cost of City infrastructure, bond underwriting fees represent the largest portion of the Issuers’ yearly spending, and the Public Finance Bureau contracts with MWBE firms for the financial advisor and specialized legal counsel roles as well.
Bond Underwriting
Beginning in the 1990’s, New York City began to implement measures to promote MWBE participation in its bond transactions. As part of these efforts, in 2002, the City created the “special bracket tier” for underwriters, which aims to elevate firms that are looking to serve as a lead underwriter on a NYC transaction. Firms assigned to the special bracket are those that are not generally familiar with the inner workings of a NYC bond sale. Firms in the special bracket are given an opportunity to serve as a co-senior managing underwriter on a City bond issue, providing them with additional exposure and experience to help grow their firms’ capabilities.
The special bracket has played a key role in promoting MWBE firms and led to the City appointing its first MWBE underwriter as book-running senior manager in 2004 on a NYW transaction. At the time, the City was one of the first large issuers to rely on these smaller firms to run sizeable bond issues. All of the City’s current MWBE book-running senior managers have been promoted from the special bracket, and since its creation the City has issued more than $55 billion of bonds underwritten by MWBE firms serving in the book-running senior manager role.
From Fiscal Years 2021 through 2025, the City has issued more than $22 billion of GO and TFA bonds for which MWBE firms served in the book-running senior manager role. Between Fiscal Years 2021 and 2025, MWBE firms in the GO and TFA underwriting syndicate and selling group have earned more than $78.1 million in takedown (the primary form of compensation for underwriters), representing an average of more than 30% of total takedown paid over that period.
| Fiscal Year: | 2021 | 2022 | 2023 | 2024 | 2025 | Total |
| Total Fee ($) | 39,985,413 | 32,898,386 | 41,198,471 | 49,310,651 | 81,237,731 | 244,630,651 |
| MWBE Fees ($) | 13,661,512 | 9,993,627 | 12,776,647 | 12,985,771 | 28,682,039 | 78,099,596 |
| MWBE % | 34.17% | 30.38% | 31.01% | 26.33% | 35.31% | 31.93% |
Financial and Swap Advisors
The GO and TFA credits have each had a least one MWBE advisor since 2006 that provides advisory and price guidance services on every transaction, as well as general advisory services for non-transaction-related issues. Additionally, the GO and TFA credits have had a MWBE swap advisor since 2011.
From Fiscal Years 2021 through 2025, the GO and TFA financial and swap advisors have earned nearly $4.1 million in fees representing an average share of more than 40% of fees paid over that period.
| Fiscal Year: | 2021 | 2022 | 2023 | 2024 | 2025 | Total |
| Total Fees ($) | 1,869,095 | 1,678,494 | 2,143,641 | 1,689,281 | 2,675,605 | 10,056,116 |
| MWBE Fees ($) | 710,214 | 687,944 | 843,433 | 709,139 | 1,123,970 | 4,074,699 |
| MWBE % | 38.00% | 40.99% | 39.35% | 41.98% | 42.01% | 40.52% |
Bond, Underwriter and GO Disclosure Counsel
For many years, the GO and TFA credits have had at least one MWBE firm serving in a counsel position. MWBE firms have been appointed to serve as bond counsel, underwriters’ counsel and GO Disclosure counsel.
From Fiscal Years 2021 through 2025, MWBE counsel working on City bond transactions have earned more than $5.9 million in fees representing an average of more than 22% of fees paid over that period.
| Fiscal Year: | 2021 | 2022 | 2023 | 2024 | 2025 | Total |
| Total Fees ($) | 5,137,800 | 4,070,700 | 5,703,400 | 4,799,450 | 6,545,000 | 26,256,350 |
| MWBE Fees ($) | 1,095,800 | 932,000 | 1,260,400 | 1,101,950 | 1,482,000 | 5,872,150 |
| MWBE % | 21.33% | 22.90% | 22.10% | 22.96% | 22.64% | 22.36% |
The Bureau has been able to meaningfully increase participation by MWBE firms in the City’s financings, which benefits the MWBE firms directly through the fees they earn, as well as indirectly by increasing their ranking on industry “league tables” and ensuring their visibility in the municipal market.
The Bureau of Public Finance has an open-door policy in which any firm that wishes to discuss their capabilities and offer their services related to the issuance of bonds can meet with the Bureau of Public Finance as well as members of OMB and the Law Department. Many MWBE firms have and continue to take advantage of this long-standing policy which has provided firms with an opportunity to gain access and a better understanding of the City’s financing programs.
The RFP process is the primary avenue for any firm to be appointed to a role in one of the City’s financings. Underwriter and Financial Advisor RFPs are managed jointly by the Comptroller’s Office and OMB; Bond Counsel and Disclosure Counsel RFPs, which follow Procurement Policy Board rules, are managed by the Law Department with the participation and concurrence of the Comptroller’s Office and OMB. All RFPs and procurements are done on multi-year cycles, typically ranging from 3 to 5 years, except for selling group members, which may be added at any time by filling out a questionnaire.
Since 2009 there have been several RFPs and procurements for each of these roles, and it has been a long-standing policy goal of the Comptroller’s Office to look for ways to increase MWBE participation.
Highlights of the most recent procurements the City has undertaken are below:
- Underwriters: In August 2020, the City completed its most recent underwriter RFP, appointing nine senior managing underwriters, three of which (33%) are MWBE firms, for GO/TFA bonds and five senior managing underwriters, two of which (40%) are MWBEs, for NYW bonds. This represents an increase from the previous selection process in 2016, where 30% of GO and TFA senior managers and 33% of NYW senior managers were MWBEs. In addition, 32% and 30% of GO/TFA and NYW co-managing underwriters, respectively, are MWBE firms.
In 2016 the City, TFA, and NYW changed their policies on how underwriters are compensated to provide for a “special designation” of certain small firm co-managers, most of which are MWBEs, resulting in these firms receiving at least 10% of the total takedown (the per bond underwriting compensation representing most of the total fees paid to underwriters). As a result of this special designation policy, these firms received several million dollars in underwriting fees since the policy was implemented.
The City has also promoted MWBE firms from the selling group to serve in the syndicate. Selling group members are firms that place orders for individual accounts, bank trusts, and investment advisors during the retail order period for bonds. While selling group members cannot enter orders during the institutional order period, any firm that is part of the syndicate or selling group may be “designated” (i.e., compensated) on institutional orders. Per the order period rules, designations are typically split between the firm entering the order and at least 4 additional firms in the syndicate or selling group. MWBEs add value to the bond sale process by providing new distribution channels and bringing in new investors and the City tries to ensure that their orders are filled during the allotment process.
- Financial and Swap Advisor: In March 2024, the City completed its most recent financial advisor RFP. Nine firms submitted responses for consideration to be financial advisors to the City and its related issuers. Following a competitive process, the City appointed two co-financial advisors to each of its three main credits (GO, TFA, and NYW). MWBEs make up half of the financial advisor firm pairings for each of the City’s three main credits.
In addition, the GO and NYW credits each selected a firm to serve as an advisor for special projects away from transaction-based assignments related to the City and Authority, respectively. Accounting for Hudson Yards Infrastructure Corporation and TSASC, Inc., which were also part of the procurement process, MWBE firms represent half of the financial advisor firm assignments awarded.
The City’s current swap advisor is currently an MWBE firm and was selected pursuant to a procurement process in 2019.
- Bond, Underwriter and GO Disclosure Counsel: In August 2025, the City completed a procurement for outside counsel that selected Bond Counsel, established a pool of Underwriter’s Counsel for each of the Issuers, and expanded the Special Disclosure Counsel roles to the City’s TFA and NYW credits, an assignment that previously only existed for the GO credit.
The counsel RFP resulted in an MWBE firm being appointed to a co-counsel position for each Bond Counsel and Disclosure Counsel assignments, as well as established a pool of qualified small firms to be selected as underwriter counsel, all of which are MWBE firms.
The City has come a long way since it first adopted policies that have promoted growth of MWBE firms participating in the City’s financings and our partnership with those firms has proved to be effective over the years. New York City is not the only issuer that has taken an active role of promoting MWBE firms in their bond transactions, but it has been a leader in the adopting policies that have proven to be effective over the years, with many other large issuers adopting similar policies that have continued to provide growth opportunities for MWBE firms.
Certification and Participation Process
During the RFP process, MWBE firms are encouraged to apply and share their MWBE ownership status in their response. The City gives additional consideration to MWBEs in its RFP selection criteria across its Issuers. For NYW, the relevant jurisdiction for MWBE certification is the State of New York; for all other Issuers, the relevant jurisdiction for MWBE certification is the City. Additional information on City MWBE certification is available through the NYC Department of Small Business Services.
Acknowledgements
The Comptroller thanks the Bureau of Asset Management for their diligent efforts to grow the office’s work with diverse and emerging managers. Special thanks go to Taffi Ayodele, Head of Diverse and Emerging Manager Strategy, Joseph Ironhawk Little, Investment Officer, Mark Pendarvis, Investment Officer, Daniel Haas, Senior Investment Officer, Kate Visconti, BAM Chief of Staff, and Shaquana DeVissiere, Press Secretary for their work to author this report and compile the data on the New York City Retirement Systems’ holdings with MWBEs and Emerging Managers. The data was provided with the assistance of asset class leadership including John Merseburg, Head of Public Equity; Robert Feng, Head of Public Fixed Income; Jennifer Gao and John Ahn, Interim Co-Heads of Private Equity; Neil Messing, Head of Hedge Funds; John Gluszak, Head of Real Estate; Petya Nikolova, Deputy CIO and Head of Infrastructure; and Tina Suo, Head of Alternative Credit. Thanks are also due to Jimmy Yan, Head of ESG Integration; John Adler, Chief ESG Officer; Francesco Brindisi, Executive Deputy Comptroller; Valerie Red-Horse Mohl, Deputy Chief Investment Officer and Head of Responsible Investing; Jay Olson, Deputy Comptroller for Public Finance; Timothy Martin, Assistant Comptroller for Public Finance; and Bureau of Public Finance staff for their assistance and contributions to this report, and to Archer Hutchinson, Creative Director, who led the design of this report.
Disclosures
Information presented is current as of the date of this publication only. Past performance does not guarantee the future performance of any manager or strategy. The performance results and historical information provided herein may have been adversely or favorably impacted by events and economic conditions that will not prevail in the future. Therefore, these results are not indicative of the future performance of any strategy, index, fund, manager or group of managers. This program does not constitute investment advice and should not be viewed as a recommendation to purchase or sell any investment product included herein.
Footnote
[1] Net Asset Value as of June 30, 2025