New York City Fine Revenues Update
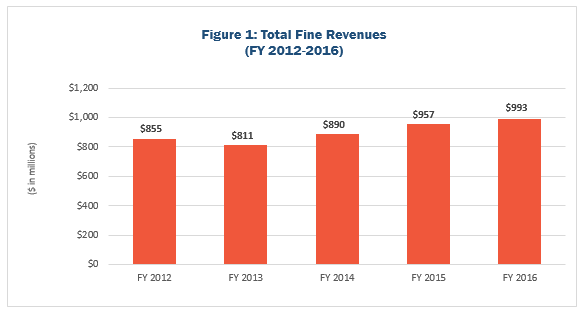
New York City imposes fines for violations of various City laws and regulations, including regulations related to parking, building codes, consumer affairs, and public health and safety. In FY 2016, the City collected $993 million in fines, an increase of 3.7 percent over FY 2015. Revenue from fines increased 35 percent in the last decade and 16 percent over the last four years. As Figure 1 shows, from FY 2012 to FY 2016, fines revenue increased $138 million from $855 million in FY 2012 to $993 million in FY 2016.[1]
By far the largest category of fines continues to be parking violations, raising $565 million in FY 2015 and $545 million in FY 2016, or 59 percent and 55 percent of total revenues from fines in FYs 2015 and 2016 respectively. “Quality of Life” violations such as littering and noise pollution, sidewalk violations and public health and safety violations generated another $184 million. The next largest source of fine revenue is camera fines. Cameras are placed throughout the City to photograph vehicles running through red lights, speeding through school zones or driving, parking or standing in bus lanes. Red light, bus lane and speed camera fines combined, generated $96 million in FY 2016. Building permit penalties and restaurant violations generated $60 million and $27 million respectively.
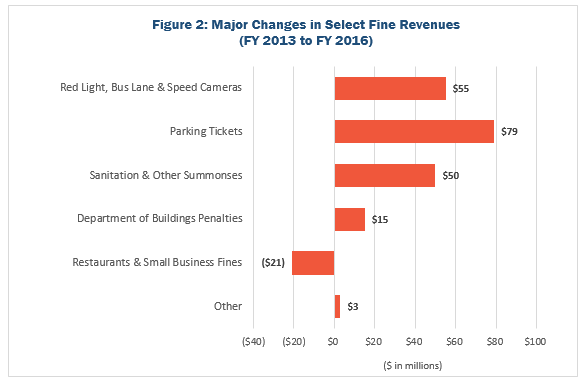
Revenue from fines increased 22 percent during the current administration from $811 million in FY 2013 to $993 million in FY 2016. Revenue from fines related to the Mayor’s Vision Zero program, such as camera fines, have risen steadily while others, such as revenues from moving violations, have only recently begun to rise. Figure 2 shows major changes in selected revenue from fines from FY 2013 to FY 2016. The largest source of increase in revenues was from parking fines, which rose $79 million over this period. Revenues from camera violations, such as those captured by red light, bus lane and speed cameras, rose by a combined $55 million. Over the same period, revenues from restaurants and other small business violations decreased by $21 million. This is consistent with the Mayor’s “Small Business First” initiative to reduce the regulatory burden on small businesses. This decrease was more than offset by a sharp increase in revenues from “Quality of Life” summonses, which increased by $50 million.
Parking Tickets
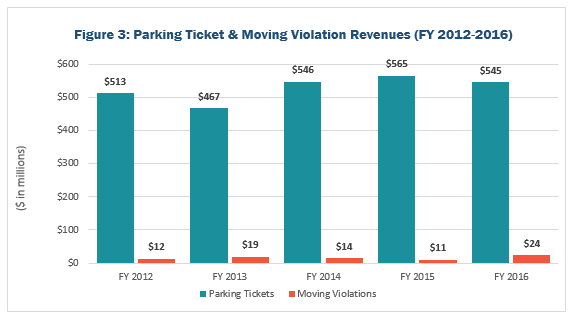
Since FY 2012, parking ticket revenues have increased 6 percent, from $513 million in FY 2012 to $545 million in FY 2016.
The City has 85,000 parking spaces served by Muni Meters and issues anywhere from 9 million to 11 million parking tickets a year. Revenues from parking fines are collected by the City’s Department of Finance. Parking tickets can range from $35 (parking at a broken meter in certain areas) to $515 (intercity bus unauthorized passenger pickup or discharge). Ticket costs vary by violation code, area, and number of offenses. Although the City collects over half a billion in parking fines every year, millions of dollars in parking fines go uncollected or get written off each year. In FY 2016, over $600 million worth of outstanding parking tickets were either written off or deemed uncollectible.
Except for automated moving violations, such as speed and red light violations captured on camera (discussed below), moving violations issued by a police officer, including speeding tickets seat belt and cell phone violations, generate substantially less revenue for the City than parking tickets. Revenues from moving violations averaged only 3 percent of total parking ticket revenues over the last 5 years. The City issues about 10 times more parking tickets than moving violations to the 1.4 million people who own and drive cars in the City. In addition, unlike parking ticket revenues, the bulk of moving violation revenues are retained by New York State to cover the cost of adjudication.
Vehicle Camera Violations
Revenues from vehicle violations captured on camera, such as speeding and red light violations, have also shifted significantly in recent years. The City’s red light camera program began in 1994 with 15 cameras, and has grown significantly. Since 2010, cameras have been installed at 150 intersections. Red light camera revenues peaked in FY 2011 at $71 million and have been falling since as the number of tickets dropped, likely due to increased motorist awareness.
Bus lane cameras began operation in 2010 with initial state approval for cameras along six MTA Select Bus Service (SBS) routes. Revenues from bus lane camera violations peaked in FY 2015 ($16.6 million) and then dropped 33 percent in FY 2016 to $11 million. In September 2015, New York State legislation expanded authorization to 16 routes. Currently, the City’s MTA has activated cameras along 10 bus routes.
In 2013, the State also allowed the City to install cameras to photograph speeding vehicles in 20 school zones and then further expanded the authority to 140 zones in 2014. Currently, the City’s Department of Transportation (DOT) is permitted to operate 240 cameras during school hours. The City uses 40 mobile cameras and another 200 in fixed locations. In conjunction with Mayor de Blasio’s Vision Zero traffic safety initiative, in calendar year 2016, the City issued around 1.4 million tickets to drivers speeding in school zones.
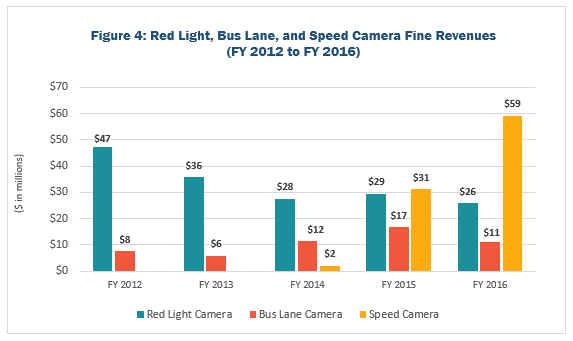
Camera revenues should continue to grow in the coming years, as the City’s Vision Zero initiative continues to address traffic safety. As shown in Figure 4, while revenues from red light cameras fell 45 percent from $47 million in FY 2012 to $26 million in FY 2016, revenues from speed and bus lane cameras have more than made up the difference. From FY 2012 to FY 2016, revenues from bus lane cameras increased 45 percent from $7.7 million to $11.1 million. Speed cameras began producing revenues in FY 2014 and by FY 2016 generated $59.2 million. Altogether, camera-generated fine revenue increased 75 percent from $55 million in FY 2012 to $96 million in FY 2015.
Retail and Restaurants
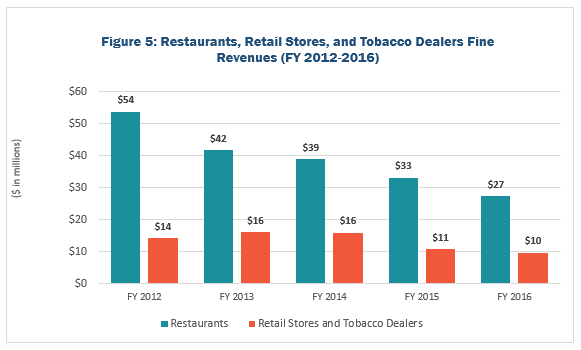
Following implementation of Mayor de Blasio’s 2014 Small Business Relief Package, small business fines dropped. In FY 2016, revenue from fines placed against retail stores and tobacco dealers totaled $10 million, 33 percent less than collections of $14 million in FY 2012. Restaurant fines had risen sharply following the implementation of letter grades in 2010, with fines increasing 47 percent in just two years from $36 million in FY 2010 to $54 million in FY 2012. In 2013, the City Council and Mayor de Blasio reached an agreement to reduce fines for minor violations and waive penalties for restaurants with a small number of offenses. After these changes, the amount of annual restaurant fine revenue was similar to collections prior to adoption of the grading system.[2]
Quality of Life Fines
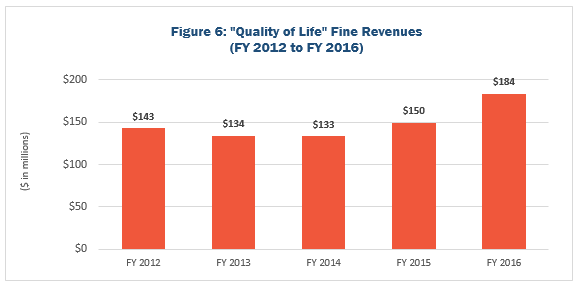
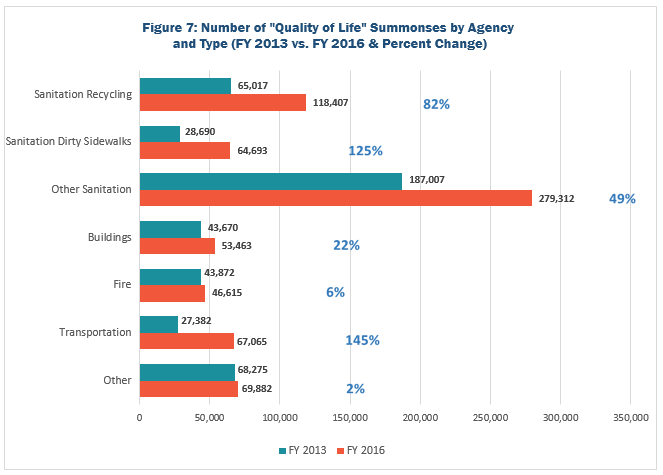
“Quality of Life” fines are imposed by a variety of agencies and adjudicated by the City’s Environmental Control Board (ECB) hearing division of the Office of Administrative Trials and Hearings (OATH). Revenues from these fines increased by 29 percent from $143 million in FY 2012 to $184 million in FY 2016 (See Figure 6).[3] The City issued approximately 700,000 quality of life violations in FY 2016 – a 51 percent increase in summonses since FY 2013. Approximately two-thirds of the summonses were issued by the Department of Sanitation (DSNY) for improper waste disposal, dirty sidewalks, and other trash or public cleanliness infractions (See Figure 7).
Other quality of life infractions in this broad category include illegal operation of a motorized scooter, building and fire code violations, bicycle riding restrictions, and unauthorized vending. Since FY 2013, recycling summonses and dirty sidewalk violations have climbed by 82 percent and 125 percent respectively. Department of Buildings quality of life summonses such as violation of construction safety rules also increased 22 percent while transportation related fines rose 145 percent.
Acknowledgements
Prepared by Marcia Murphy, Principal Revenue Economist. • Published by the New York City Comptroller’s Office, Bureau of Budget. • Lawrence Mielnicki, Chief Economist • Preston Niblack, Deputy Comptroller for Budget
Endnotes
[1] All revenue data is from the Office of the City of New York Comptroller, Comprehensive Annual Financial Report and the New York City Financial Management System. Additional data comes from the New York City Mayor’s Office of Operations, Mayor’s Management Report; New York City Office of Administrative Trials and Hearings, Environmental Control Board Tribunal Data.
[2] Restaurant fines represented 88 percent of Department of Health and Mental Hygiene summonses in FY 2016.
[3] Typically approximately one-third of ECB collections in a given year are for past-due obligations.