New York City’s Economy Has Become More Diversified: So What?
Summary
For many years, policymakers and others have expressed concern about the overreliance of the City’s economy – and budget – on the securities industry, the volatility of which has been felt in the City’s economic and budgetary fortunes. City policy under several mayors has sought to reduce the City’s vulnerability to the ups and downs of the industry, while at the same time recognizing that its exceptionally high compensation levels have helped provide the means to fund a broad range of social services and other programs.
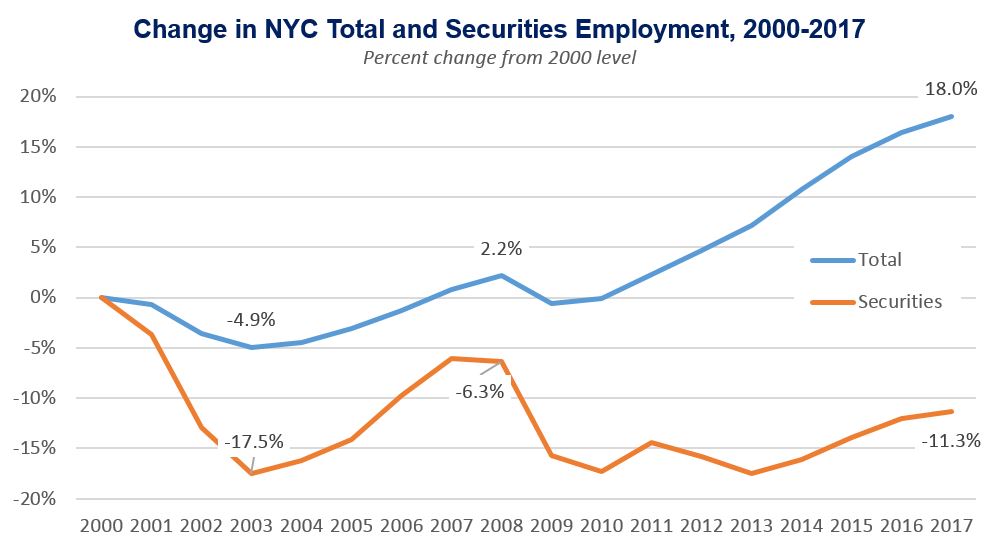
In fact, the securities industry as a source of employment has been in long-term decline. After each of the last two recessions, the sector has failed to regain its previous employment levels – even as average compensation in the sector has continued to grow faster than average pay in other sectors. Since the Great Recession, employment in the securities industry remains more than 11 percent below the all-time high reached in 2000. At the same time, the City has gained 624,000 jobs since the end of the Great Recession, reaching an all-time high of 4.1 million jobs – 18 percent higher than in 2000.
This growth in non-securities jobs has in fact resulted in modestly greater diversification of New York City’s employment base. But diversification in and of itself is not a panacea. One must ask if a more diversified economy will help alleviate some of the ills ascribed to overreliance on one sector. In particular, does a more diversified economy mean greater resiliency against economic ups and downs? More stable job growth? Greater opportunity for more New Yorkers? Better pay?
In this analysis we find that, while the City’s economy has become more diversified, it has yet to deliver an economy that is substantially less vulnerable to economic downturns, or is providing more good-paying jobs to New Yorkers.
In particular, we find that
- New York City employment has become modestly more diversified since 2000;
- Nonetheless, the City’s economy remains less diversified than many other metropolitan areas across the nation;
- In terms of sheer numbers, most of the diversification has been into sectors with relatively low average pay;
- The more diversified employment mix of the economy in 2016 is likely to result in higher average job growth in the future;
- But the volatility of future employment and wages is not likely to be substantially less, since many of the new jobs are in sectors equally vulnerable to broader economic fluctuations.
No amount of diversification can completely insulate the City from the broader economic fortunes of the national and international economies. To help address the remaining weaknesses in its economy, the City must continue to pursue, not diversification for its own sake, but targeted growth to build on existing areas of strength that can provide future growth, while ensuring that its workforce has access to quality education and training so that City residents can take advantage of the jobs of the future.
Introduction
For many years, and in particular in the wake of the Great Recession of 2008-09, concerns have been expressed about the overreliance of the City’s economy – and budget – on the securities industry. As the saying went, “when Wall Street sneezes, the City catches cold.” Many observers have hoped that the City could diversify its economy, on the theory that the City would be less vulnerable to economic shocks.[1]
Figure 1. Growth in Securities Industry Employment Lags Overall New York City Employment Growth
SOURCE: Comptroller’s Office analysis of New York State Department of Labor data. Securities data is for NAICS sector 523
In fact, as shown in Figure 1, employment in the securities industry remains below its 2008 level, and remains more than 12 percent below the all-time high reached in 2000. This lackluster employment growth has occurred despite a strong rebound in stock market indices and stands in contrast to overall City employment, which is well above the level reached in 2008 and almost 18 percent higher than it was in 2000.[2] As one observer noted as far back as 2010, Wall Street has been “an enormous cash engine, but it can no longer provide enough jobs.”[3] The performance of the City’s overall economy in terms of job creation has been cited as an indicator of the City’s increasing economic diversification, a result that has been broadly characterized as beneficial.
The theoretical advantage of a more diversified economy is that it spreads risk: A diversified economy is less vulnerable to industry-specific or “idiosyncratic” shocks. A diversified economy is more insulated from the risk that factors such as changing consumer tastes or new technologies that cause employment in a particular industry to contract sharply or disappear. Economic history provides many examples of the falling fortunes of one-industry towns.
Conversely, a more diversified economy spreads risk. That is, to the extent that one or more sectors are susceptible to exogenous macroeconomic shocks of one kind or another, the losses in terms of economic output, employment, and tax revenues are mitigated by the fact that no particular sector dominates the economy.[4]
It is not necessarily a given, however, that a more diversified economy is less volatile or susceptible to general macroeconomic risk. For example, City A could have employment heavily concentrated in two relatively stable employment sectors, such as education and government, while City B could have employment spread across a more diverse set of sectors, such as travel/tourism, finance and real estate, and durable goods manufacturing. In the latter case, all these sectors are closely correlated with discretionary consumer spending and therefore more susceptible to macroeconomic shocks such as a sharp increase in interest rates or a spike in oil prices. A more diversified economy such as City B is not necessarily a less volatile economy.[5] Atlanta and Washington D.C. provide examples of these different types of economies. Although D.C. is not as diversified as Atlanta, because of the singularly large presence of the federal government, it is generally considered a more stable economy from a macroeconomic perspective.
Two other questions to consider about diversification are whether it results in higher average employment growth, and whether it brings higher paying jobs. Some of the fastest growing areas in the country, both in terms of pay and jobs, have been in some of the least diversified local economies, such as San Jose and Denver, both heavily concentrated in tech industries. Reducing the financial services sector’s relative presence in New York City does not necessarily mean that jobs in growing sectors will be better-paying jobs.
Another counterpoint to the notion that diversification is inherently beneficial to an economy is supported by the economic theory and evidence on the benefits from clustering of industries. A high concentration in an industry may be a strength in terms of fostering productivity, innovation and growth.[6] A “perfectly” diversified economy may not have any strong industry clusters that would attract talent and investment, and lead to higher rates of growth. At times, the City has seemed to subscribe to clustering theory, seeking to promote certain sectors it saw as promising future growth.[7]
The discussion of the success of the City’s changing job composition and diversification therefore needs to be analyzed in terms of the outcomes that it has produced. In this brief, we address five questions about economic diversification:
- Has the City economy become more diversified?
- Will greater diversification result in lower volatility in employment and wage growth?
- Will greater diversification lead to higher average employment growth?
- Has greater diversification been associated with higher pay?
- Has greater diversification strengthened the City’s future growth prospects?
Only by framing it in terms of these quantifiable measures is it possible to evaluate the benefits of the City’s changing job composition, and to begin to formulate a direction and goals for ensuring a robust economic future.
Key Findings for New York City
The City’s economy has become more diversified
New York City’s economy has become modestly more diversified over the last decade-and-a-half.
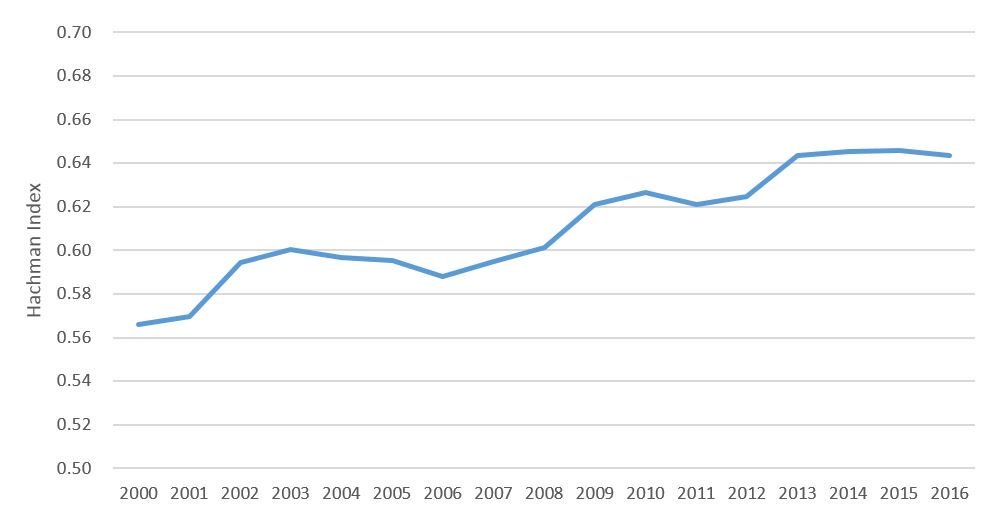
We measure diversification using the Hachman index. The index is constructed based on a measure of local industry concentration known as a location quotient – the ratio of a given sector’s share of local employment to its share in overall national employment. The value of the Hachman index ranges from zero (least diversified) to 1 (most diversified).[8] We found that overall employment in the City became modestly more diversified between 2000 and 2016, with the Hachman index rising from .55 to .64. More recently, diversification has appeared to stall, although as can be seen in the chart, the overall upward trend has not been steady over short time periods.
Figure 2: The City Economy Has Become Modestly More Diversified
SOURCE: Comptroller’s Office analysis of New York State Department of Labor data.
The growing diversification of the City’s industry sector composition has also been accompanied by a modest increase in the spread of earnings, with the Hachman Index based on wages rising from .38 to .43 between 2000 and 2016.
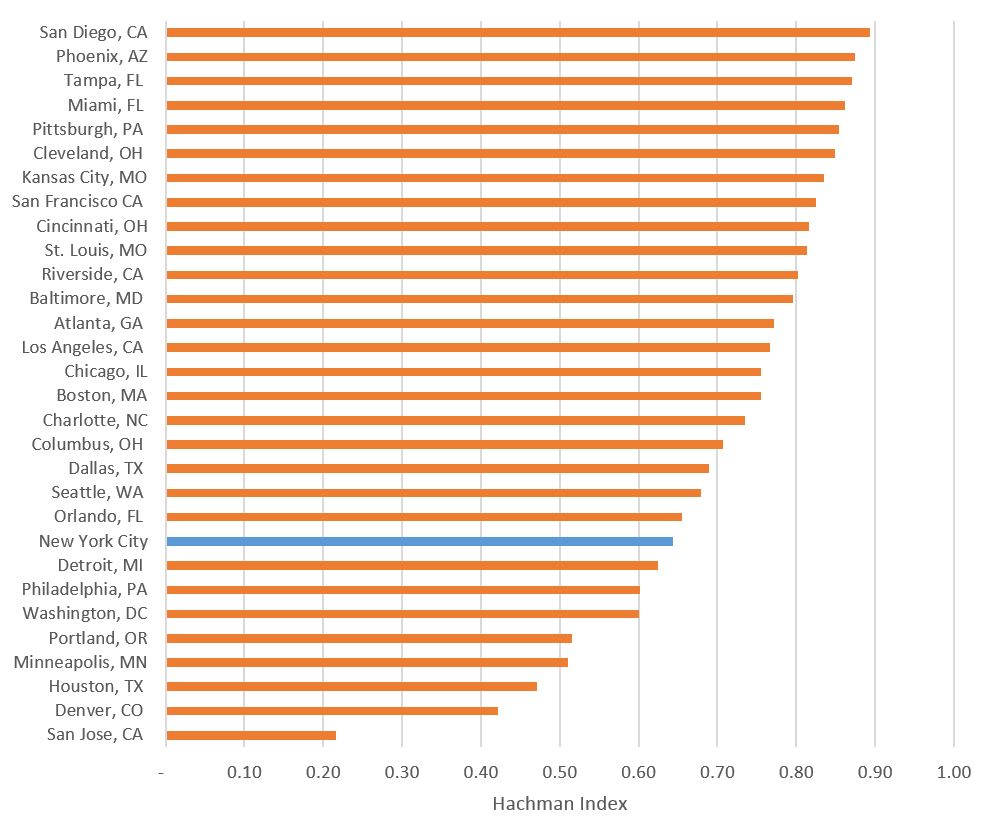
However, while the City has become more diversified, it remains significantly less so than other major metropolitan areas. As shown in Figure 3, the City ranked 22nd among the 30 largest metro areas in terms of diversification.
Figure 3: The City Is Less Diversified than Many Other Major Metropolitan Areas
SOURCE: Comptroller’s Office analysis of Bureau of Labor Statistics data.
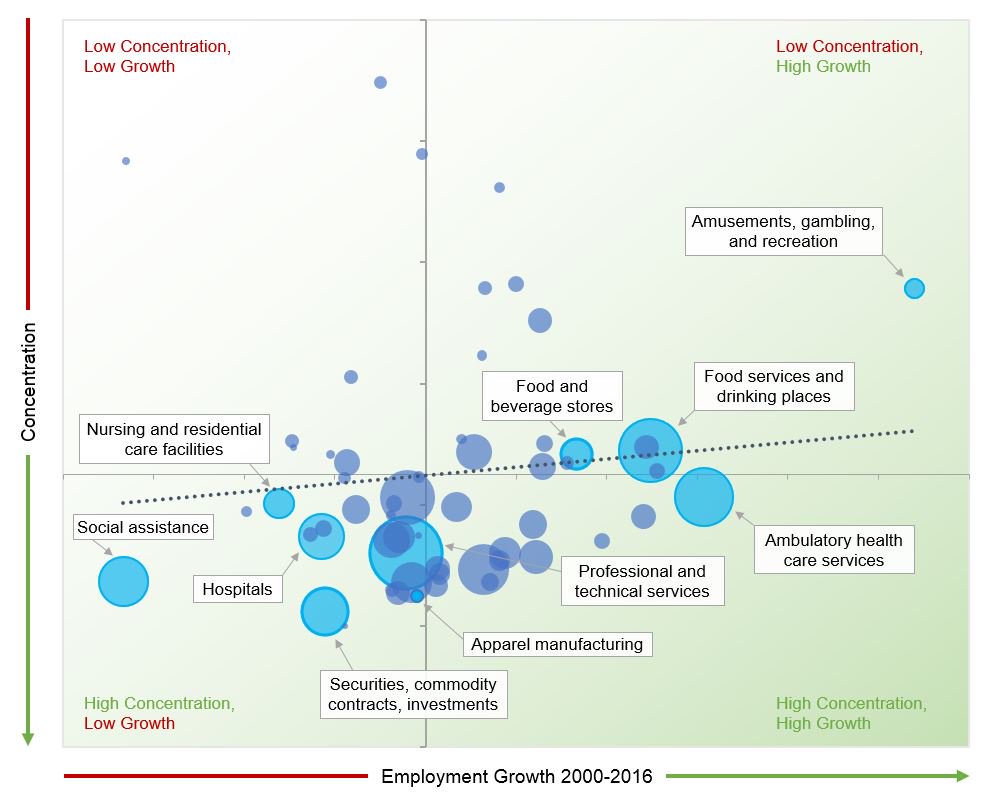
The City’s increased diversification over this time frame occurred because of faster growth in the least concentrated industries (as measured by their location quotient) and lower growth in more concentrated industries. Figure 4 plots growth in employment by sector from 2000 to 2016 (the horizontal axis) against the change in the degree of concentration (the vertical axis). The size of the circles represents the relative size of the sectors. Because the results are influenced by the size of the sectors, the largest sectors are called out. As shown, some of the most highly concentrated industries, such as securities and social assistance, grew relatively slowly over this period, while food services and ambulatory health care, which had relatively low concentrations in 2000, were among the fastest growing sectors. Smaller sectors such as apparel and amusement and gambling, also contributed to the overall result. In contrast, professional services, one of the largest sectors, did not contribute significantly to the result, landing in the middle in terms of both growth and location quotient.[9]
Figure 4: Diversification of the City Economy by Sector
SOURCE: Comptroller’s Office analysis of New York State Department of Labor data.
Diversification has not diminished the City economy’s vulnerability to economic downturns, but has resulted in less earnings volatility
The City’s reliance on the securities industry has often been cited as a negative factor because of the large employment and compensation swings associated with this sector. This contributes to a high degree of sensitivity in the City’s economy to the ups and downs of financial markets and to income and sales tax revenue volatility, amplified by the economic spillover effects of these highly-compensated jobs.
Employment Volatility
In general, increased diversification is considered to be beneficial to a local economy because it can help insulate the economy from shocks and downturns.[10] In New York City’s case, however, despite the increase in economic diversification, the current composition of employment is expected to result in only minimally less volatility in overall employment growth in the event of another economic downturn. Employment volatility, measured by the standard deviation of annual employment growth, declined minimally, from 2.2 percent in 2000 to 2.1 percent in 2016.[11]
While this result is somewhat surprising, examining the results for all sectors in greater detail provides insight into this outcome. Although historically volatile sectors have diminished in importance over the period, increased diversification has meant substituting one set of volatile sectors for another. Specifically, some of the fastest growing sectors such as food services and drinking places that contributed to the greater diversification also have high employment volatility. The 3.3 percent employment growth volatility for food services, for example, while lower than the 4.6 percent for the securities sector, is still significantly higher than the overall average of 2.1 percent. Moreover, because food services and similarly volatile sectors represent significantly larger shares of total employment than the smaller securities sector, the overall volatility of employment has not diminished. This shift does signal that the City’s economy is likely marginally less vulnerable to financial market instability, but slightly more vulnerable to broader economic downturns.
Earnings Volatility
The result for wage volatility is only slightly more encouraging: a small decline from a 5.3 percent growth volatility in wages in 2000 to 5.0 percent in 2016 (again measured by the standard deviation of wage growth). This result is driven both by the fact that the share of earnings for the securities sector, though declining from 20.5 percent in 2000 to 18.3 percent in 2016, is still very significant, as well as by the sensitivity of some growth sectors to broader economic cycles.
The City’s increased diversification is correlated with higher expected employment growth
While the results with respect to employment and wage volatility are disappointing, the outlook for employment growth is somewhat better, thanks to the City economy’s changing job composition since 2000. Using projected sectoral growth rates, we estimate average annual job growth of 1.4%, compared to 1.1% if the City’s employment composition had remained unchanged.[12]
While this result suggests that the current distribution of employment should result in higher job growth in the future, it does not necessarily mean that the diversification of the City’s economy has been the cause of higher growth.[13] The composition of the City’s economy has changed because some sectors have grown faster – and thus become a larger share of total employment than those that have grown more slowly (or declined). Coincidentally, this has resulted in a more diversified economic base. It need not have done so: if different sectors had grown more, the result might have been a less diversified economy, and/or one that was less heavily weighted in sectors with higher expected growth rates. Tech sector jobs have grown very rapidly in San Jose, for example, and are projected to continue to grow – but that has been neither a cause nor a result of diversification there.
Greater diversification has not brought higher average pay
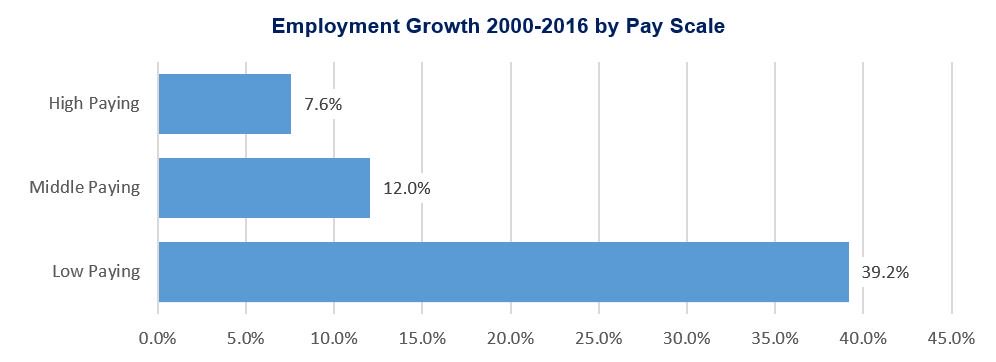
While employment may be expected to grow at a faster rate on average than if the City economy had not diversified, employment diversification has primarily been driven by low-paying sectors. As shown in Figure 5, while the number of jobs at all levels of pay have grown, employment growth at the lowest end of the pay scale far exceeded growth in the middle and high ends. This has resulted in lower overall average earnings per worker than if the sectoral distribution of employment had remained unchanged between 2000 and 2016.
While the volatility in securities sector jobs may not in and of itself be desirable, jobs in this industry pay on average $375,000, four times higher than the average of $86,000 for all sectors. Because of the smaller share of very highly-compensated finance industry jobs, and the rise in lower-paying jobs, the average wage in the City in 2016 was 7.0% lower than it would have been if the composition of jobs had remained unchanged from 2000: $86,000, compared to $92,000.
Figure 5: Low-Paying Jobs Have Grown Most Rapidly
SOURCE: Comptroller’s Office analysis of New York State Department of Labor data.
NOTE: High-paying jobs are those in the highest quartile of the pay distribution corresponding to an annual pay of more than $100,000; middle-paying jobs are those in the 25th to 75th percentile of the pay distribution with pay between $45,000 and $100,000; while low-paying jobs are those in the lowest quartile of the distribution, corresponding to pay below $45,000.
Greater diversification has come at the expense of high-value export sectors
This result is not altogether surprising given what clustering theory suggests about high-paying versus low-paying jobs. High-paying industries in the City such as securities, printing and publishing, insurance, and other financial services sector jobs tend to be concentrated in sectors that are considered to be “traded” or “export” sectors.[14] Generally, traded sectors serve a customer base that extends beyond the local market, and may benefit from clustering effects that increase the returns and wages in these industries. Notable examples of traded industries include finance and media in New York, biotech and information in Silicon Valley, and film and television in Los Angeles. In contrast, local industries include sectors such as personal services (barbers, nail salons, and dry cleaners, for example) and retail (grocery stores and pharmacies), which serve a local customer base and are common to most areas (and hence have low location quotients). Some sectors such as education may have both a traded component (universities) and local component (elementary schools).
In the U.S., traded sectors account for roughly one-third of all jobs but make up almost half of all pay.[15] In New York City, traded industries represented 40 percent of employment in 2000 and 61 percent of all pay in 2000. From 2000 to 2016, however, overall traded jobs declined by nearly 45,000, while local jobs increased by over 612,000 (Table 1). By 2016, traded industry sectors had declined to 32 percent of employment and 58 percent of pay. This change in the relative shares between traded industries and local industries helps to explain the wage tradeoff that has occurred in New York City, since local sector jobs on average pay only about one-third what traded sector jobs earn.
Table 1: Changes in Traded and Local Sector Employment, 2000-2016
| Net Job Gains/(Losses) 2000-2016 | Average Wage 2016 | |
| Local Sector Jobs | 612,205 | $53,024 |
| Traded Sector Jobs | (44,748) | $153,953 |
SOURCE: Comptroller’s Office analysis of New York State Department of Labor data.
A more detailed breakout of NYC traded sectors is shown in Table 2. The data confirms the findings of other reports that have highlighted significant job gains in high paying tech sectors of the economy, such as “other information services,” which includes employment in web search portals and other new media jobs associated with the Internet.[16] While the boom in tech has been beneficial to the City, these gains have not been sufficient to offset the total job losses in other traded sectors – notably in manufacturing. Moreover, the growth in some traded sectors may come at the expense of older traded sectors. For example, tech and new media have largely come at the expense of publishing and print jobs, which have historically been an important – and generally high-paying – export cluster for New York.
Table 2: Changes in Traded Sector Employment, 2000-2016
| Sector | (Losses)/Gains | Average Wage, 2016 |
| Apparel manufacturing | (43,638) | $53,552 |
| Securities, commodity contracts, investments | (16,780) | $375,332 |
| Publishing industries, except internet | (16,193) | $128,086 |
| Merchant wholesalers, durable goods | (15,422) | $84,600 |
| Telecommunications | (15,294) | $134,352 |
| Miscellaneous manufacturing | (13,070) | $57,593 |
| Printing and related support activities | (10,448) | $56,897 |
| Data processing, hosting and related services | (7,610) | $165,200 |
| Textile mills | (5,679) | $89,934 |
| Credit intermediation and related activities | (5,134) | $184,964 |
| Fabricated metal product manufacturing | (4,178) | $57,375 |
| Insurance carriers and related activities | (3,735) | $159,171 |
| Merchant wholesalers, nondurable goods | (3,401) | $90,408 |
| Electrical equipment and appliance mfg. | (3,236) | $63,892 |
| Paper manufacturing | (3,086) | $57,364 |
| Chemical manufacturing | (2,724) | $111,764 |
| Furniture and related product manufacturing | (2,635) | $53,665 |
| Machinery manufacturing | (1,937) | $56,591 |
| Air transportation | (1,843) | $85,225 |
| Textile product mills | (1,810) | $61,025 |
| Plastics and rubber products manufacturing | (1,745) | $41,269 |
| Transportation equipment manufacturing | (1,412) | $58,002 |
| Lessors of nonfinancial intangible assets | (1,225) | $130,292 |
| Leather and allied product manufacturing | (1,157) | $52,641 |
| Heavy and civil engineering construction | 1,249 | $115,443 |
| Scenic and sightseeing transportation | 2,100 | $36,979 |
| Electronic markets and agents and brokers | 2,275 | $114,874 |
| Food manufacturing | 3,019 | $34,847 |
| Museums, historical sites, zoos, and parks | 3,612 | $56,607 |
| Motion picture and sound recording industries | 3,646 | $107,150 |
| Performing arts and spectator sports | 8,871 | $107,544 |
| Private higher education services | 5,708 | $88,578 |
| Accommodation | 11,832 | $61,768 |
| Management of companies and enterprises | 16,021 | $180,990 |
| Other information services | 32,651 | $158,212 |
| Professional and technical services (Legal, Research, Management, Marketing and PR ) | 49,270 | $138,876 |
SOURCE: Comptroller’s Office analysis of New York State Department of Labor data.
NOTE: Only sectors with gains/losses exceeding 1,000 are shown.
Conclusions
Greater diversification of the City’s economy – primarily in order to reduce overreliance on the highly remunerative but volatile securities sector – has often been cited as a goal by City policymakers and observers alike. While New York City’s economy had indeed modestly diversified by 2016, compared to 2000, we have to ask what benefits that diversification has brought, and whether pursuing diversification for its own sake is the best approach to creating an economy that is best positioned to benefit all of the City’s residents and workers.
The diversification of the last decade-and-a-half has produced some benefits. For one, it has been accompanied by robust growth in employment, creating more jobs in the City than ever before, and an unemployment rate that has fallen to its lowest level in more than a decade. Moreover, future job growth is likely to continue to benefit from the composition and structure of current employment – more so than if the composition of employment had remained what it was in 2000.
But diversification has not resulted in an economy that is significantly less volatile in terms of employment or wages. Employment growth is not likely to be less volatile because it has occurred in sectors that are not substantially less vulnerable to economic downturns than the securities sector – although the nature of that vulnerability may differ somewhat.
At the same time, even as securities industry employment continues its secular decline, the sector remains very important to overall wages in the City, resulting in only a modest decline in wage volatility. Average wages are lower as the economy has diversified away from securities into less well-paid sectors. In particular, high-value traded sectors have lost ground, as local sector employment has surged ahead. But local sector employment is neither as well-paying as traded sector jobs, nor will it provide the engine for future economic growth.
These results have important implications for future growth in the City’s economy and tax base. How should City policymakers respond to these changes? Is diversification worth pursuing for itself? Or should we take a different, more nuanced approach to economic development? We offer some initial conclusions on these questions.
- The economy is dynamic, and growth sectors will change. The City should continue to actively and strategically promote sectors where it has existing natural strengths or clusters and encourage further growth in traded sectors with strong growth potential. In addition to tech jobs, professional and business services continue to be important areas of strength, as does high-end health-care, and higher education. Nor should the City abandon the securities sector, which, even as its role in the local economy declines relatively, will continue to provide a wide array of good-paying jobs – not just to investment bankers and traders, but also to IT specialists and others.
- The City’s income distribution is becoming more U-shaped over time as well – with more high-income and low-income households, and fewer middle-income households. The City needs to ensure that it focuses on job growth in middle-income, middle-skill occupations.
- The City needs to ensure that it is providing training to its workforce in the skills that will be needed for growth. Not only are certain sectors likely to grow, but certain occupations will be in high demand, and the City should carefully evaluate the employment needs of these sectors and work in partnership with employers to provide appropriate education and training.
The challenges of building a growth economy in the face of broader global and national forces – including new federal policies that disfavor knowledge-based economies – should not be underestimated. Nonetheless, and in particular in the absence of federal policies that would help guide the national economy in the right direction, the City must take a thoughtful and data-driven approach to building an economy with broad-based benefits for all New Yorkers.
Appendices
Appendix A: Measuring Diversification
Methodology
A measure frequently used in the economic literature on diversification is the Hachman Index, a metric based on location quotients (LQ). The location quotient for an industry in a location compares the share of employment in that industry locally to the share for that industry for the nation as a whole.
For instance in New York City, securities employment in 2016 accounts for 4.18 percent of total employment, while in the nation it accounts for 0.65 percent of employment. NYC’s location quotient is therefore calculated as 6.47 (4.18/0.65). The LQ indicates that securities is over 6 times more concentrated in New York than in the U.S. as a whole.
The inverse of concentration (1/LQ), provides a measure of dispersion or diversification. To obtain an overall measure of diversification, each industry’s location quotient is weighted by its share of total employment. The weighted sum provides the overall level of concentration and the inverse provides a measure of diversification called the Hachman Index. An index closer to 1 indicates a more diversified economy.[17]
To illustrate the concept of location quotients and diversification we compared NYC to other large metro areas. Shown on the following page are the results for San Jose/Silicon Valley and New York, two relatively undiversified economies, compared to Atlanta and Dallas, two relatively more diversified economies.
As shown in the figures, New York City and San Jose are less diversified than cities such as Dallas and Atlanta. The size of the circles and intensity of red measures high location quotients. In a perfectly diversified economy the circles would have equal size and color. While Dallas and Atlanta also have strong concentration in some industries (in particular, air transportation, as Dallas is the headquarters for American Airlines and Atlanta for Delta), these are still far less dominant than the securities and tech industries are in New York and San Jose, respectively.
San Jose, Silicon Valley
Dallas
Atlanta
New York City
Data Limitations
The Hachman Index used in the analysis is based on 3-digit NAICS level data to define sectors and their location quotient. The NAICs data provides finer level of industry classifications, up to 6 digits. These higher levels of classification allow, for instance, to distinguish 3-digit food manufacturing NAICS 311 into finer industry categories, such as Sugar and Confectionery Product Manufacturing (NAICS 3113) from Fruit and Vegetable Preserving and Specialty Food Manufacturing (NAICS 3114). The limitations in the use of finer level of NAICS data arise from rules that prevent the BLS from disclosing confidential information. These are more likely to arise the finer the level of detail. At the 3-digit NAICS level we encountered a few industries that could not be disclosed. This potentially biases the results. However these industries accounted for roughly 1 percent of total employment – sufficiently small that, in our view, the overall results and trends were not biased to any significant degree.
The other choice, which would avoid non-disclosure issues, would be to use a higher level of aggregation, such as 2-digit NAICS. This level of aggregation does not distinguish industries sufficiently to draw meaningful conclusions regarding diversification. For example the location quotient for overall manufacturing, NAICS Code 31-33, could be similar in two cities. One city could have manufacturing activity exclusively concentrated in automobile manufacturing, while another city could have employment spread across many manufacturing sectors, such as food, automobiles, and pharmaceuticals. Using only the 2-digit level, the location quotient for the two cities would be the same but arguably the latter City is more diversified. In practice, the 3-digit level is the lowest level of disaggregation before non-disclosure issues limit the usefulness of the data.
A full table of New York City sectors by 3-digit NAICS code, including employment, wages, and location quotients for 2000 and 2016, is available here:
https://comptroller.nyc.gov/wp-content/uploads/documents/Diversification_Data_Table.xlsx.
Appendix B: Diversification and Employment Growth Rates and Volatility
Utilizing annual employment and wage data for Metropolitan Statistical Areas (MSA) of the United States available from the U.S. Bureau of Labor Statistics, we calculated average annual employment and wage growth over time, as well as the standard deviation of employment and wage growth as a proxy for volatility of growth, and regress these against the value of that MSA’s Hachman index at the beginning of the period
In each analysis, we compare results using two periods: 1990 to 2016 and 2000 to 2016, using as observations those MSAs for which at least 70% of total employment can be assigned to a 3-digit NAICS code (see the discussion in Appendix A on Data Limitations). We also test results using MSAs weighted for total employment. In each regression, the independent variable is the beginning-period Hachman index.
Impact of Diversification on Employment and Wage Growth
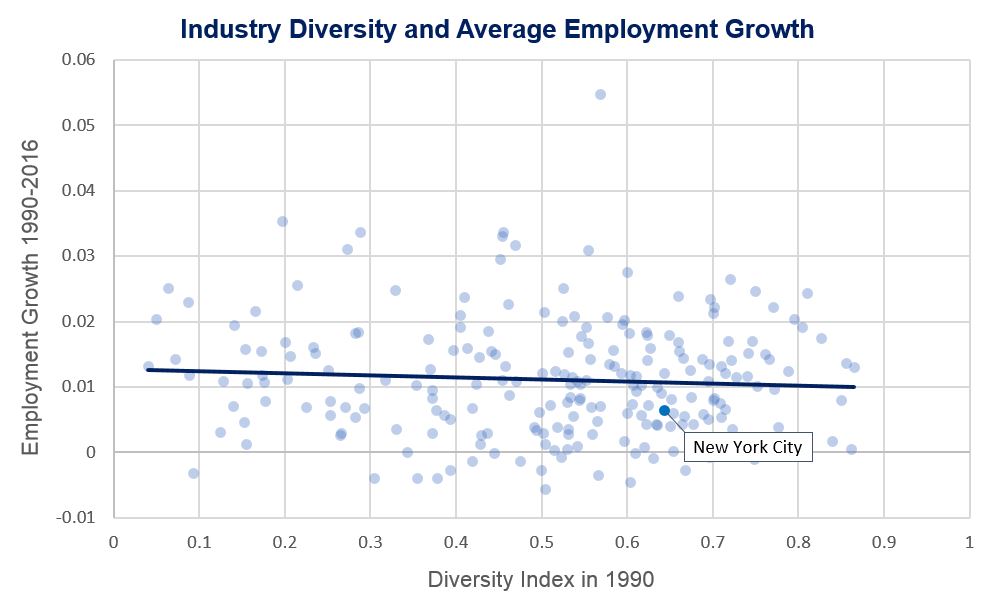
We begin by testing average annual employment and wage growth. A graphical representation of our results for employment growth is shown in Figure B.1. The dots represent MSAs plotted by employment growth from 1990 to 2016 (vertical axis) and their diversity index in 1990 (horizontal axis). The figure suggest that on average, more diversified cities do not have higher or lower long term growth rates. While some more diversified cities have experienced higher growth, others did not. We show these results in regression format next.
Figure B.1. Diversification is not correlated with higher employment growth
SOURCE: Comptroller’s Office analysis of Bureau of Labor Statistics data.
Regression Results: Employment Growth
Table A.1 presents regression results where annual employment growth over the period 1990-2016 in the first two models, and for 2000-2016 in the second pair of models, is the dependent variable. The value of the Hachman index at the beginning of the time period is the independent variable. Models 1b and 2b use size-weighted values of the MSAs. All specifications fail to establish a significant relationship between the Hachman index and employment growth.
| Table B.1: Dependent Variable: Annual Average Employment Growth | ||||
| 1990-2016 | 2000-2016 | |||
| Model 1a | Model 1b | Model 2a | Model 2b | |
| Hachman Index | -0.003 | -0.005 | -0.003 | -0.001 |
| (-0.98) | (-1.58) | (-0.86) | (-0.20) | |
| Constant | 0.0127*** | 0.0124*** | 0.00785*** | 0.00637*** |
| (-7.54) | (-6.27) | (-4.02) | (-3.41) | |
| N | 223 | 223 | 200 | 200 |
| R-Squared | 0.004 | 0.011 | 0.004 | 0.000 |
t statistics in parentheses
* p<0.10, ** p<0.05, *** p<0.01
Regression Results: Wage Growth
We also look at the relationship between diversification and wage growth (Table B.2). The dependent variable in this model is average annual wage growth between sample years and the independent variable is the Hachman index at the beginning of the time period. As with our results for employment growth, we find no significant relationship between annual wage growth and diversification measured by the Hachman index.
| Table B.2: Dependent Variable: Average Annual Wage Growth | ||||
| 1990-2016 | 2000-2016 | |||
| Model 1a | Model 1b | Model 2a | Model 2b | |
| Hachman Index | 0.0062 | 0.00128 | 0.00167 | 0.00373 |
| (1.63) | (0.36) | (0.34) | (1.11) | |
| Constant | 0.0380*** | 0.0402*** | 0.0316*** | 0.0301*** |
| (20.63) | (18.20) | (13.54) | (14.91) | |
| N | 214 | 214 | 197 | 197 |
| R-Squared | 0.012 | 0.001 | 0.001 | 0.006 |
t statistics in parentheses
* p<0.10, ** p<0.05, *** p<0.01
More formal tests of the relationship of diversification on employment growth and volatility which also take into account other explanatory variables such as population growth, educational attainment, and productivity also yield a similar conclusion.[18]
Impact of Diversification on Employment and Wage Volatility
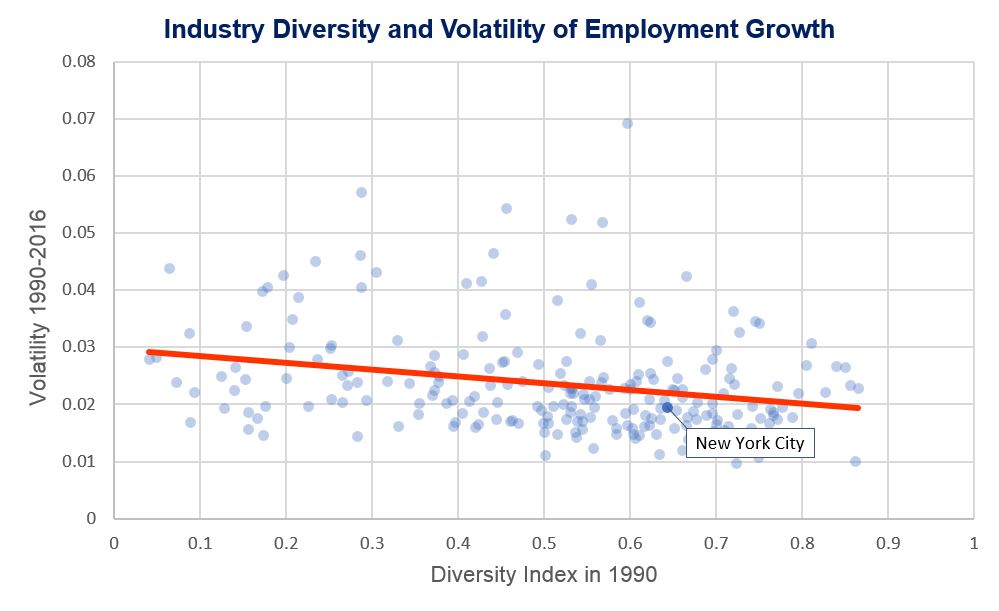
In contrast to our finding of no statistically significant relationship between employment or wage growth and diversification, as measured by the Hachman index, our analysis of more than 200 metropolitan statistical areas in the nation finds that there is a statistically significant negative correlation between the Hachman index and employment and wage volatility, measured by the standard deviation of annual employment growth, as illustrated in Figure B.2. In short, diversification does seem to dampen the volatility of employment and wage changes over the business cycle.
Figure B.2. Diversification is negatively correlated with volatility of employment growth
SOURCE: Office of the Comptroller analysis of Bureau of Labor Statistics data.
Regression Results: Employment Volatility
The dependent variable in this model is the standard deviation of employment growth and the independent variable is the Hachman index at the beginning of the time period. Again, we examine two periods, using unweighted and weighted total MSA employment.
Both specifications show a statistically significant negative relationship between diversification and the volatility of employment growth. The R-squared value for the 1990-2016 period (models 1a and 1b) is 0.065 which means that variation in Hachman Index explains 6.5 percent of variation in volatility of employment growth between metropolitan areas between 1990 and 2016. The R-squared for the 2000-2016 period (models 2a and 2b) is 0.044 meaning Hachman Index explains 4.4 percent of variation. While diversification does contribute to reduced volatility of employment growth, there are many other factors that affect volatility that are not addressed in this analysis.
| Table B.3: Dependent Variable: Standard Deviation of Annual Employment Growth | ||||
| 1990-2016 | 2000-2016 | |||
| Model 1a | Model 1b | Model 2a | Model 2b | |
| Hachman Index | -0.0119*** | -0.00825*** | -0.0133*** | -0.0134*** |
| (3.92) | (2.94) | (3.02) | (3.77) | |
| Constant | 0.0297*** | 0.0276*** | 0.0312*** | 0.0325*** |
| (17.88) | (14.68) | (12.56) | (13.53) | |
| N | 223 | 223 | 200 | 200 |
| R-Squared | 0.065 | 0.038 | 0.044 | 0.067 |
t statistics in parentheses
* p<0.10, ** p<0.05, *** p<0.01
Regression Results: Wage Volatility
Our final regression model employs the standard deviation of total wage growth as the dependent variable between sample years (Table A.4). All six specifications show a statistically significant negative relationship between diversification and volatility of wage growth further suggesting that diversification has a moderating effect on volatility of wages. R-squared for our preferred specifications, 0.041 for 1990-2016 period and 0.068 for 2000-2016 period respectively, suggest that there are many other factors that play a role on volatility of wages.
| Table B.4 Dependent Variable: Standard Deviation of Annual Wage Growth | ||||
| 1990-2016 | 2000-2016 | |||
| Model 1a | Model 1b | Model 2a | Model 2b | |
| Hachman Index | -0.0164*** | -0.0222** | -0.0241*** | -0.0232*** |
| (-3.00) | (-2.38) | (-3.77) | (-4.49) | |
| Constant | 0.0411*** | 0.0497*** | 0.0444*** | 0.0474*** |
| (15.54) | (8.58) | (14.52) | (15.26) | |
| N | 214 | 214 | 197 | 197 |
| R-Squared | 0.041 | 0.026 | 0.068 | 0.094 |
t statistics in parentheses
* p<0.10, ** p<0.05, *** p<0.0
New York City
We examined whether New York City’s employment diversification over the last decade and a half will yield a more stable jobs outlook, with less vulnerability to fluctuations in the economy. We tested the impact of the City’s employment diversification over the last 25 years by looking at the variance in growth rates for more than 80 New York City industry sectors over the period 1991-2016. This period includes three business cycles, each with their own distinctive cause and policy response. We first calculated a variance-covariance matrix for annual employment growth between 1990-2016 (as growth of one particular industry usually correlates with growth of another, covariance between industries need to be accounted for); and then we constructed two scenarios, one adding elements of variance-covariance matrix weighted by the 2000 shares of employment by industry, and another one weighting the elements by the 2016 shares of employment. The first scenario shows us what the employment growth volatility would be if we kept 2000 industry employment shares whereas the second scenario gives the employment growth volatility with 2016 industry shares. We find that employment volatility declined minimally, from 2.2 percent in 2000 to 2.1 percent in 2016. Wage volatility declined slightly more, from a 5.3 percent growth volatility in 2000 to 5.0 percent in 2016.
Acknowledgments
This analysis was prepared by Steven Giachetti, Chief of Revenue Estimation, and Selçuk Eren, Senior Economist.
We wish to thank Jaison Abel, Jason Bram, Michael Jacobs, Raymond Majewski, Yaw Owusu-Ansah, and Cole Rakow for their thoughtful comments on earlier drafts. The views expressed in the paper do not necessarily represent the views of these readers or of the institutions with which they are affiliated. Additionally, we thank Tammy Gamerman and Jennifer Conovitz of the Office of the Comptroller for their helpful reviews.
Published by the Office of New York City Comptroller Scott M. Stringer
Lawrence Mielnicki, Ph.D., Chief Economist
Preston Niblack, Deputy Comptroller for Budget
[1] See, for example, Joel Kotkin, “Why New York City Needs a New Economic Strategy,” Newsweek, Jan. 1, 2010. http://www.newsweek.com/why-new-york-city-needs-new-economic-strategy-70889. Mayor Bloomberg also articulated a goal of diversifying the City’s economy following the recession: http://www1.nyc.gov/office-of-the-mayor/news/341-09/mayor-bloomberg-latest-steps-diversify-city-s-economy-weekly-radio-address. The Partnership for New York City, in its 2013 NYC Jobs Blueprint, advocated both diversification and strengthening the securities sector: http://pfnyc.org/wp-content/uploads/2017/02/NYC-Jobs-Blueprint-Partnership-for-New-York-City-2013.pdf.
[2] https://www.nytimes.com/2017/04/05/business/dealbook/wall-street-jobs-banking-trump.html
[3] Kotkin, op.cit.
[4] This, of course, is only true to the extent that a City’s sectors are independent of one another in terms of risk.
[5] This is analogous to the finance concept of Beta (β) risk, a measure of whether a particular asset class is more volatile than the market as a whole. In this example, education and government can be thought of has having a low or negative β coefficient.
[6] Michael E. Porter, The Competitive Advantage of Nations, New York: Free Press, 1990.
[7] See Partnership for New York City, NYC Jobs Blueprint, op. cit.
[8] See Appendix A for methodological details and data. A value of 1.0 for the Hachman index would indicate a local economy that exactly mirrors the U.S. economy in its sectoral composition, while a value of zero would indicate a local economy entirely consisting of a single industry sector.
[9]Growth rates are the relative growth rates in each sector for New York City compared to the U.S. The data for all 3 digit sectors is provided here https://comptroller.nyc.gov/wp-content/uploads/documents/Diversification_Data_Table.xlsx.
[10] An examination of 200 U.S. metropolitan areas over the period 1990 to 2016 shows that greater industry diversity is negatively correlated with employment volatility – that is, a more diversified local economy shows smaller fluctuations in employment through the business cycle than a less diversified one. See Appendix B.
[11] See Appendix B for methodology.
[12] To analyze the impact of diversification on the City’s average employment growth, we used projected sectoral growth rates from the New York State Department of Labor. Each sector’s projected growth was weighted by its 2016 share of total City employment. This was compared to the result obtained when using 2000 shares.
[13] Previous research in this area provides mixed results as to whether increased employment diversification per se leads to higher long-term growth. See for example Alison Felix, “Industrial Diversity, Growth and Volatility in the Seven States of the Tenth District”, Kansas City Federal Reserve Bank Economic Review, Fourth Quarter 2012, pp. 55-78 (https://www.kansascityfed.org/PUBLICAT/ECONREV/PDF/12q4Felix.pdf). Our own analysis of more than 200 metropolitan statistical areas in the nation shows no statistically significant correlation between the Hachman Index and average employment growth over the last quarter century (see Appendix B).
[14] See Delgado, Bryden, and Zyontz, “Categorization of Traded and Local Industries in the US Economy,” at http://clustermapping.us/content/cluster-mapping-methodology
[15] Ibid.
[16] See, for example, Office of the New York State Comptroller, New York City’s Tech Industry Expands, https://osc.state.ny.us/osdc/rpt2-2015.pdf, June 2014.
[17] The Hachman Index uses the national economy as a benchmark to gauge diversification. This measure is only meaningful to the extent that the nation is a diversified economy, as is the case for the U.S. A Hachman index value of 1 therefore indicates a local economy exactly as diversified as the national economy.
[18] See for instance: Alison Felix, “ Industrial Diversity, Growth and Volatility in the Seven States of the Tenth District”, Kansas City Fed, op.cit. (note 12).