New York City’s Labor Market: Evidence From The Recent Expansion
Key Findings
- New York City was not as severely impacted by the Great Recession as the rest of the nation, and has had a strong recovery.
- Payroll employment is up 14% compared to the pre-recession peak
- The job mix has shifted, however, toward lower-paying jobs, and more part-time work.
- Wage growth was relatively strong for high-paying sectors, but flat for lower-paying industries.
- Self-employment has grown during the recovery, particularly in certain sectors.
- City residents have also benefited: the City’s unemployment rate is at an historic low, and more New Yorkers are working.
- The unemployment rate remains above its pre-recession level for older workers, but has declined dramatically for workers without a high-school diploma, males, and Hispanics.
Introduction
The “Great Recession” of 2008 and 2009 was the worst economic downturn to face the nation since the Great Depression of the 1930s. New York City, compared to the rest of the nation, fared reasonably well: the recession hit later and was shallower in terms of job losses, and the expansion has been more robust.
By any measure, the New York City economy has been a job-producing machine in the seven years since the recession. There are about 14% more payroll jobs in the City as of 2016 than there were even before the recession in 2008. As of the first quarter of 2017, the City’s unemployment rate is at its lowest point in the four decades of modern employment data collection, and its labor force participation rate is hovering around its highest point since 1976.
These headline statistics, however, while undoubtedly positive, don’t tell the whole story. While there is no doubt that City residents are enjoying unprecedented levels of employment, many of the jobs created since the recession are relatively low-paying. Moreover, while nearly every segment of the population is better off than they were prior to the recession, not everyone has benefitted equally: low-paid workers have seen no gains in real incomes; workers without a college degree are still suffering relatively high unemployment; and thousands more City residents are working part-time jobs in 2016 than in 2008.
In this report, we examine the City’s experience in the Great Recession and the recovery, as measured by payroll job creation, and by how different segments of the City’s population and labor force have fared. In the first section, we look at job creation in the City, primarily using the Bureau of Labor Statistics Current Employment Statistics, which measures payroll jobs in the City, regardless of whether those jobs are held by residents or commuters. We then turn to the experience of the City’s resident population during the past decade, using the Local Area Unemployment Statistics, Current Population Survey, and American Community Survey.[1]
New York City’s Recession: Shorter and Shallower than the Nation
Chart 1 shows that the last recession was not as bad for the City as it was for the US as a whole. While it took NYC three years to recover the jobs it lost in the last recession, it took the US over six years.
Chart 1. Cumulative Job Gains 2007 – 2016: NYC and U.S.
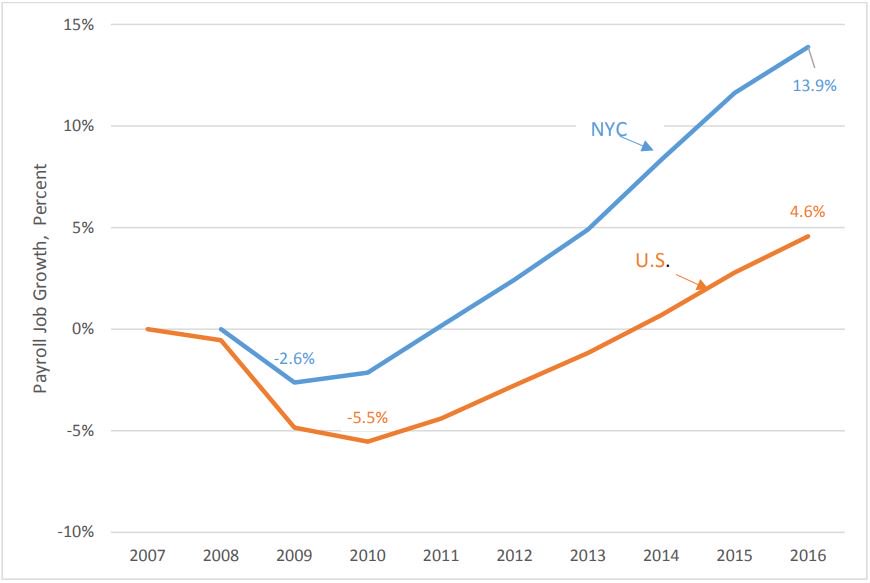
SOURCE: Computed by the NYC Comptroller’s Office based on data from NYS Department of Labor; U.S. Bureau of Labor Statistics.
Nationally, the recession hit the job market one year earlier than the City (2007 vs. 2008), and lasted longer. The City bottomed out in 2009, while the U.S. didn’t reach the trough until 2010. The City’s employers shed 100,100 jobs from the peak of the business cycle in 2008 to the trough in 2009 – a decrease of 2.6% – but then added 629,500 jobs from 2009 to 2016, a gain of 17.0%. The net gain from the pre-recession peak in 2008 was 529,400 jobs, or 13.9%.
US employment declined 5.5% from the peak in 2007 to its trough in 2010, shedding 7.6 million jobs, and added 13.9 million jobs from 2010 to 2016, a gain of 10.7%. The net gain from the U.S. pre-recession peak in 2007 was 6.3 million jobs, or 4.6%, or just one-third the New York City rate.
More Lower-Paying Jobs Created in the Recovery
Table 1 shows how different industries in the City performed in terms of job losses and gains during the last recession and the subsequent recovery. Education and health services were the only sectors that did not lose jobs during the Great Recession in 2008 and 2009, while professional and business services and financial activities each lost over 30,000 jobs. During the recovery (from 2009 to 2016), education and health services, professional and business services, and leisure and hospitality added the most jobs.
Table 1. Job Changes by Industries, NYC, 2008-2016
| Jobs in thousands | 2008 – 09 | 2009 – 16 | Net Change, 08-16 | |||
| ‘000s | % | ‘000s | % | 000s | % | |
| TOTAL | (100.1) | -2.6% | 629.5 | 17.0% | 529.4 | 13.9% |
| Private | (103.0) | -3.2% | 644.1 | 20.5% | 541.1 | 16.7% |
| Construction | (12.0) | -9.0% | 25.5 | 21.1% | 13.5 | 10.2% |
| Manufacturing | (14.0) | -14.6% | (5.4) | -6.6% | (19.3) | -20.2% |
| Wholesale and Retail Trade | (17.6) | -3.9% | 64.0 | 14.9% | 46.4 | 10.3% |
| Transp., Warehousing & Utilities | (4.3) | -3.4% | 12.8 | 10.5% | 8.5 | 6.7% |
| Information | (4.3) | -2.5% | 27.4 | 16.6% | 23.1 | 13.6% |
| Financial Activities | (30.7) | -6.6% | 31.9 | 7.4% | 1.2 | 0.3% |
| Professional & Business Services | (34.2) | -5.7% | 154.2 | 27.1% | 120.0 | 19.9% |
| Educational & Health Services | 16.3 | 2.2% | 177.6 | 23.6% | 193.9 | 26.3% |
| Leisure & Hospitality | (1.7) | -0.6% | 129.1 | 41.8% | 127.4 | 41.1% |
| Other Services | (0.5) | -0.3% | 27.0 | 16.8% | 26.5 | 16.5% |
| Government | 2.9 | 0.5% | (14.6) | -2.6% | (11.7) | -2.1% |
SOURCE: Computed by the NYC Comptroller’s Office based on data from NYS Department of Labor.
While job growth was strong, private-sector job gains from 2008 to 2016 were mostly concentrated in lower paying sectors (61.5%). Higher paying jobs took a bigger hit during the recession, declining by 54,000 jobs or more than half of all the private-sector job losses from 2008 to 2009 (Table 2). Although job gains during the recovery have exceeded recession losses across the board, lower-paying sectors gained the greatest number of jobs from 2009 to 2016, adding 359,000 or about 56% of all private-sector job gains, followed by medium-wage jobs (21.5%), and high-wage jobs (17.1%).[2] As a result, there has been a continued shift toward lower-paying jobs.
Table 2. Change in Jobs by Wage Level, NYC, 2008-2016
| Jobs in thousands | |||||||
| 2008 – 2009 | 2009 – 2016 | Net Change, 08-16 | |||||
| Number | Share | Number | Share | Number | Share | ||
| High-Wage | (54) | 52.5% | 146 | 22.7% | 92 | 17.1% | |
| Medium-Wage | (23) | 22.3% | 139 | 21.6% | 116 | 21.5% | |
| Low-Wage | (26) | 25.2% | 359 | 55.7% | 333 | 61.5% | |
| Total Private | (103) | 100.0% | 644 | 100.0% | 541 | 100.0% | |
SOURCE: Computed by NYC Comptroller’s Office from NYS Department of Labor data.
NOTE: See footnote 2 for wage level definitions.
Moreover, between 2009 and 2015 (when the latest data is available), lower-wage jobs in the City saw no gain in average real (inflation-adjusted) wage, while wages rose 9.3% in the high-wage sector and 7.4% in medium-wage employment.
Employment and Unemployment Among NYC Residents
The City’s residential employment – jobs held by NYC residents (wherever the job was located) – took longer to recover compared to the City’s payroll jobs – jobs located in NYC regardless of the residence of the employee. However, like payroll jobs, the City’s residential employment recovered faster than the nation’s (Chart 2). It took NYC’s residential employment five years to recover to its pre-recession peak in 2008, compared to seven years nationally. The City’s residential employment fell by 131,900 or 3.6% from 2008 to 2010, but then increased by 350,500 by 2016, a gain of 9.8%, for a net gain of 218,600 jobs or 5.9% above the peak in 2008. By comparison, US residential employment fell by 7.0 million or 4.8% from 2007 to 2010, but then it increased by 12.4 million, a gain of 8.9%, by 2016, for a net gain of 5.4 million jobs or 3.7% above its 2007 peak.
Chart 2. Cumulative Residential Employment Growth 2007 – 2016, NYC and US
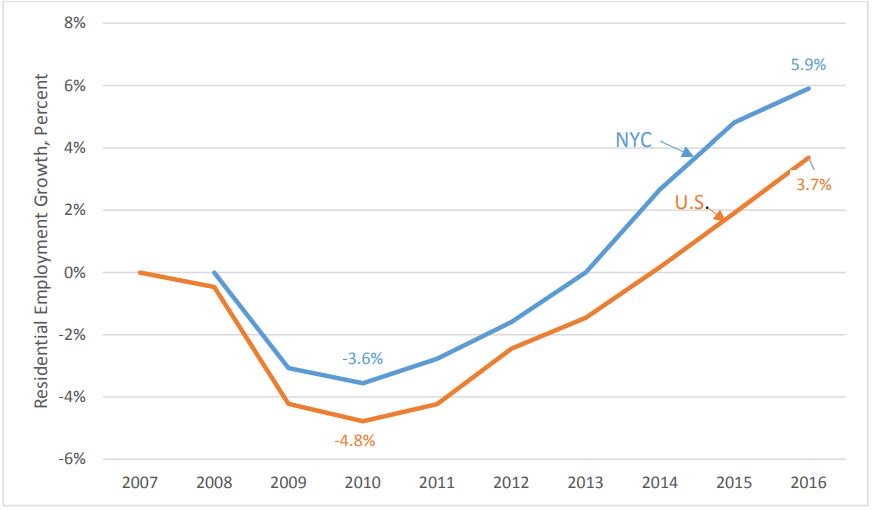
SOURCE: Computed by the NYC Comptroller’s Office based on data from NYS Department of Labor and U.S. Bureau of Labor Statistics.
Commuters and Employment
New York City, as the major Mid-Atlantic metropolis, provides opportunities for employment from residents of neighboring communities. Workers may choose to commute from their home communities to the City for many reasons ranging from the availability of jobs in NYC, to lower cost of living outside the City, to simple preference or ease of commute.
Table 3. NYC Commuters by Industry, 2008 vs. 2015
| 2008 | 2015 | Change, 2008-2015 | ||||
| Jobs in thousands | Number | Share | Number | Share | Number | Share |
| TOTAL | 813.3 | 21.3% | 898.7 | 21.1% | 85.4 | -0.2% |
| Private | 683.0 | 21.0% | 775.0 | 20.9% | 92.0 | -0.1% |
| Construction | 34.4 | 25.9% | 35.7 | 25.6% | 1.3 | -0.3% |
| Manufacturing | 23.4 | 24.5% | 18.9 | 24.3% | (4.5) | -0.2% |
| Wholesale and Retail Trade | 73.4 | 16.4% | 81.0 | 16.3% | 7.6 | -0.1% |
| Transp., Warehousing & Utilities | 28.5 | 22.5% | 28.5 | 21.5% | – | -1.0% |
| Information | 47.0 | 27.7% | 57.8 | 30.6% | 10.8 | 2.9% |
| Financial Activities | 151.8 | 32.7% | 161.7 | 35.2% | 9.9 | 2.5% |
| Professional & Business Services | 154.9 | 25.7% | 178.4 | 25.5% | 23.5 | -0.2% |
| Educational & Health Services | 121.2 | 16.5% | 147.9 | 16.5% | 26.7 | 0.0% |
| Leisure & Hospitality | 36.6 | 11.8% | 47.3 | 11.1% | 10.7 | -0.7% |
| Other Services | 20.9 | 13.0% | 24.0 | 13.0% | 3.1 | 0.0% |
| Government | 154.3 | 27.4% | 141.2 | 25.7% | (13.1) | -1.7% |
SOURCE: Computed by NYC Comptroller’s Office based on data from NYS Department of Labor and U.S. Census Bureau American Community Survey.
NOTE: See Appendix for methodology.
Table 3 shows that commuters held slightly more than 21% of all payroll jobs in the city both before and after the recession. Broadly speaking, industries with the highest percentage of commuters – including financial activities, information, government, construction, and professional and business services – pay more ($124,000 in 2015, on average) than those with the high shares of City residents, such as education and health services, wholesale and retail trade, other services, and leisure and hospitality ($49,000 on average).
Self-Employment
Somewhat over 11 percent of City residents are self-employed. At the peak of the previous business cycle, in 2008, they made up 11.4% of the City’s total private residential employment (i.e., excluding government). That share increased slightly to 11.6% in 2010, when residential employment was at its lowest, and stayed at the level through 2015 (the latest available data). The industries with the largest shares of self-employed workers are other services[3] (28.1%), construction (21.9%), and transportation, warehousing, and utilities (17.4%).
Some sectors that experienced relatively large growth in the self-employed during the recession, such as construction and transportation, warehousing and utilities, saw only a slight downturn in self-employment during the recovery, maintaining most of the growth in self-employment through 2015. Other sectors saw more growth in self-employment during the recovery, notably the “other services” and information sectors, likely reflecting a longer-term shift toward the “gig economy” in those sectors. The booming leisure and hospitality sector added over 127,000 jobs from the end of the recession through 2016, entirely as employees, reducing the share of self-employment more than any other sector.
Table 4. NYC Self-Employment by Industry, 2008 vs. 2015
| 2008 | 2015 | Change, 2008-2015 | ||||
| Jobs in thousands | Number | Share | Number | Share | Number | Share |
| Total Private | 380,859 | 11.4% | 413,042 | 11.6% | 32,183 | 0.2% |
| Construction | 34,393 | 18.3% | 42,231 | 21.9% | 7,838 | 3.6% |
| Manufacturing | 9,860 | 7.1% | 7,753 | 6.9% | (2,107) | -0.2% |
| Wholesale and Retail Trade | 46,165 | 10.9% | 40,673 | 9.6% | (5,492) | -1.3% |
| Transp. Warehousing & Utilities | 32,210 | 13.9% | 40,692 | 17.4% | 8,482 | 3.5% |
| Information | 13,794 | 9.3% | 17,259 | 12.4% | 3,465 | 3.1% |
| Financial Activities | 28,548 | 8.0% | 24,542 | 7.5% | (4,006) | -0.5% |
| Professional and Business Services | 73,770 | 16.8% | 84,382 | 16.5% | 10,612 | -0.3% |
| Educational & Health Services | 55,882 | 6.2% | 59,400 | 6.0% | 3,518 | -0.2% |
| Leisure & Hospitality | 46,520 | 14.4% | 43,630 | 10.2% | (2,890) | -4.2% |
| Other Services | 42,139 | 21.1% | 55,244 | 28.1% | 13,105 | 7.0% |
SOURCE: Computed by NYC Comptroller’s Office based on data from NYS Department of Labor and U.S. Census Bureau American Community Survey.
NOTE: Private sector employment only. See Appendix for methodology.
Resident Employment Trends
The NYC unemployment rate reached a high of 9.5% in 2010, before falling to 5.2% in 2016, slightly above the 5.0% rate in 2007 prior to the recession. As of March 2017, the unemployment rate had fallen even further, to 4.0%, its lowest level since the government began collecting modern statistics in 1976 (Chart 3).
The falling unemployment rate is explained both by a decline in the number of unemployed and a rise in the number of New Yorkers labor force.[4] Since 2010, the number of unemployed New Yorkers decreased by 162,400. At the same time, the labor force increased by 188,100, resulting in a total increase of 350,500 in the number of employed NYC residents.
In fact, the labor force participation rate (LFPR) among New York City residents (the percent of New Yorkers aged 16 and over either working or looking for work) reached a record high of 60.3% in 2016. The City’s LFPR is steadily converging with the U.S. rate – although primarily because the U.S. rate has continued a steady decline since the recession (Chart 4).
Chart 3. Unemployment Rate, 2005 – 2016, NYC and US

SOURCE: NYS Department of Labor U.S. Bureau of Labor Statistics.
Chart 4. Labor Force Participation Rate, 2005 – 2016, NYC and US
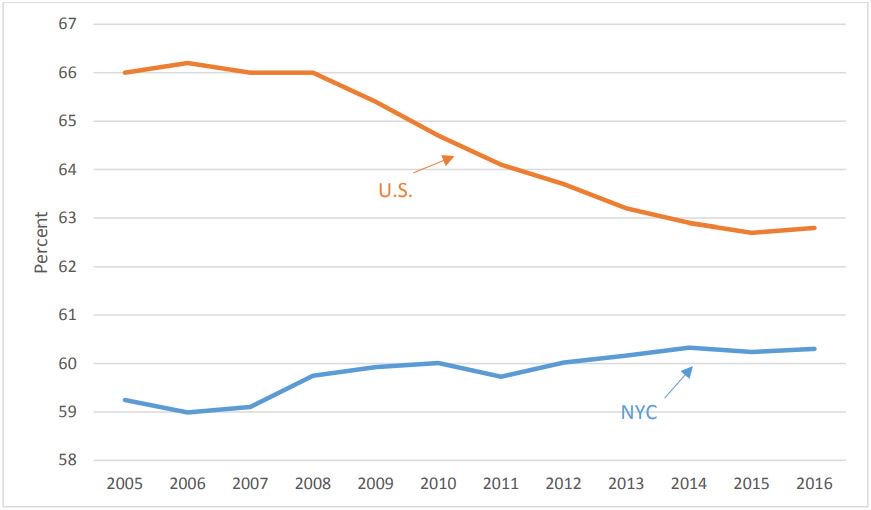
SOURCE: NYS Department of Labor; U.S. Bureau of Labor Statistics.
Gains Not Evenly Distributed
Broadly speaking, employment statistics point to a milder recession and a stronger and more vibrant expansion in New York City than in the nation as a whole. Both City payroll jobs and resident employment have exhibited unprecedented strength. There are, however, caveats to these generally positive numbers. In addition to, and perhaps partly as a function of, the prevalence of lower-paying jobs created in the recovery, not all segments of the population have shared equally in the recovery’s benefits.
To begin with, the decline in the City’s unemployment rate was not uniformly distributed among the various demographic groups underlying the total (Table 5). Blacks continued to have the highest unemployment rate in 2016. The unemployment rate among Blacks was also the most sensitive to economic fluctuations. The “Asian and other” category showed the least sensitivity to the economy. Nonetheless, all groups except Whites have recovered and improved beyond their 2007 levels, with a particularly notable improvement for Hispanics.
Unemployment for the youngest age cohort (16-24 years old) is traditionally higher than for their elders, which remained true through the Great Recession and recovery, although the rate is now below its 2007 level. Prime working age adults – those between 25 and 54 years old – have recovered fully, and the unemployment rate for this cohort is also below its 2007 level. Those 55 and older, however, who generally fared somewhat better than their younger colleagues during the recession, have not returned to their pre-recession rate.
Perhaps most surprisingly, the unemployment rate for those without a high school diploma was significantly lower by 2016 than it was prior to the recession in 2007, showing greater improvement than either high-school or college graduates. As is typically the case, college graduates (“B.A. or higher”) have the lowest unemployment rate and were less impacted by the Great Recession. In contrast, workers with “no high school (HS) diploma” exhibit the highest unemployment rate and were more sensitive to the economic downturn.
Table 5. NYC Unemployment Rate by Subpopulation
| 2007 | 2009 | 2016 | 1Q2017 | |
| Total | 5.2% | 9.5% | 5.3% | 4.4% |
| Male | 5.5% | 10.4% | 5.5% | 4.3% |
| Female | 4.9% | 8.5% | 5.0% | 4.6% |
| by race/ethnicity: | ||||
| Black | 7.3% | 14.9% | 6.7% | 7.1% |
| White | 3.0% | 6.1% | 3.9% | 3.2% |
| Hispanic | 7.0% | 11.2% | 6.9% | 4.9% |
| Asian & other | 4.4% | 6.6% | 4.1% | 3.4% |
| by age: | ||||
| 16-24 yrs old | 13.8% | 21.7% | 13.6% | 11.2% |
| 25-54 yrs old | 4.2% | 8.5% | 4.2% | 3.7% |
| 55 yrs and older | 3.3% | 6.0% | 4.7% | 4.0% |
| by education: | ||||
| No HS diploma | 10.4% | 14.3% | 7.9% | 6.8% |
| HS, some college | 5.6% | 10.7% | 7.0% | 5.9% |
| BA or higher | 2.9% | 6.5% | 3.1% | 2.7% |
SOURCE: Computed by the NYC Comptroller’s Office based on data from the U.S. Census Bureau Current Population Survey.
The strong decline in the unemployment rate for non-high school graduates is also reflected in the number of unemployed. The number of unemployed residents without a high-school diploma fell by more than 13,000 or 27.5%, between 2008 and 2016, while it increased by about 3,000 or 2.3% for high school graduates and by over 12,000 or 24.9% for those with a bachelor’s degree or higher.
The improvement in employment among high-school dropouts compared to high-school graduates may have something to do with the growth of lower wage jobs in New York City over the course of the expansion. The wages and types of work offered in the low wage category may not have been acceptable to graduates who were expecting better employment opportunities, and may have decided to leave the labor force and complete their post-secondary education in order to improve their prospects. Notably, the number of people in the labor force with a bachelor’s degree or higher increased by 405,925 or 26.0%, between 2008 and 2016.
In contrast, among those with a high school diploma and some college, the unemployment rate did not return to its prerecession level because the number of unemployed actually increased 2.3%, while the labor force fell 5.4%.
Wage Growth Among City Residents
As Table 6 shows, average real wages (wages adjusted for inflation) for City residents fell 1.7% between 2008 and 2010, but increased 13.2% from 2010 to 2015 (the latest year for which this data is available) for a net gain of 11.3% from 2008 to 2015. The net gain was similar for male, female, Whites and Blacks. However, Hispanics and Asians & others had 15.1% and 16.1% net increase respectively.
Table 6. Percent Change in NYC Average Real Wages by Demography
| 2008 – 2010 | 2010 – 2015 | 2008 – 2015 | |
| Total | -1.7% | 13.2% | 11.3% |
| Male | -3.5% | 15.5% | 11.4% |
| Female | 1.3% | 10.3% | 11.8% |
| Whites | -4.6% | 16.4% | 11.1% |
| Blacks | 3.2% | 7.7% | 11.2% |
| Hispanics | 2.6% | 12.2% | 15.1% |
| Asians & Others | 2.1% | 13.7% | 16.1% |
SOURCE: Computed by the NYC Comptroller’s Office based on data from the U.S. Bureau of Labor Statistics and the U.S. Census Bureau American Community Survey.
The only groups that saw their real wages fall between 2008 and 2010 were males and White workers. During the recovery, however, males and Whites had the biggest real wage gains, bringing their wage growth over the period 2008 to 2015 to par with most other demographic cohorts.
Broader Definitions of Un- and Under-employment
Looking beyond the commonly-cited official unemployment rate reveals other important dynamics in the labor market, including measures of underemployment such as people working part-time who would prefer to work full-time, and those who stopped looking for work out of discouragement over their job prospects. While part-time work typically increases during a recession, the trend towards more part-time work continued in many industry sectors during the recovery. And many discouraged workers have only recently begun to re-enter the workforce.
The Bureau of Labor Statistics (BLS) counts anyone who is working as employed. This includes workers who are working part-time but would prefer to be working full time. During a recession, companies may prefer to hire part-time workers instead of full-time, both because future demand may be uncertain, and because part-time workers are cheaper insofar as they do not share in the company’s benefits. As the economy deteriorated from 2008 to 2009 and economic uncertainty increased, companies may have opted for part-time employees instead of full-time, while others may have cut back on hours for existing employees. During the expansion, we would have expected this trend to reverse itself.
But rather than return to its pre-recession level, the number of part-time workers continued to increase during the recovery in several sectors (Table 7). For example, from 2009 to 2016, the number of part-time workers in professional and business services increased by 14,734 (38.5 percent), in retail trade by 12,085 (17.4 percent), in information by 3,324 (37.7 percent), and in construction by 1,912 (12.1 percent).
Table 7. Change in NYC Part-Time Workers by Industry, 2008-2016
| 2008 – 2009 | 2009 – 2016 | Net Change, 08-16 | ||||
| Number | % Chng | Number | % Chng | Number | % Chng | |
| Total | 26,983 | 6.0% | 1,984 | 0.4% | 28,967 | 6.4% |
| Private | 32,175 | 8.0% | 4,050 | 0.9% | 36,225 | 9.0% |
| Construction | 354 | 2.3% | 1,912 | 12.1% | 2,266 | 14.7% |
| Manufacturing | 5,674 | 65.4% | (4,491) | -31.3% | 1,183 | 13.6% |
| Wholesale Trade | (919) | -14.4% | 334 | 6.1% | (585) | -9.1% |
| Retail Trade | 7,903 | 12.9% | 12,085 | 17.4% | 19,988 | 32.5% |
| Transportation and utilities | 4,782 | 29.9% | (5,940) | -28.6% | (1,158) | -7.2% |
| Information | 1,930 | 28.0% | 3,324 | 37.7% | 5,254 | 76.3% |
| Financial Activities | (8,813) | -34.2% | 611 | 3.6% | (8,202) | -31.9% |
| Professional & Business Svc | (7,571) | -16.5% | 14,734 | 38.5% | 7,163 | 15.6% |
| Educational Services | (366) | -1.0% | (4,029) | -10.6% | (4,395) | -11.5% |
| Health Care & Social Svc | 12,670 | 15.5% | (5,292) | -5.6% | 7,378 | 9.0% |
| Leisure and Hospitality | 13,486 | 21.9% | (5,466) | -7.3% | 8,020 | 13.0% |
| Bars and Restaurants | 14,517 | 45.1% | (1,783) | -3.8% | 12,734 | 39.5% |
| Other Services | 2,735 | 7.5% | (4,587) | -11.7% | (1,852) | -5.1% |
| Government | (5,294) | -11.5% | (1,963) | -4.8% | (7,257) | -15.8% |
SOURCE: Computed by the NYC Comptroller’s Office based on data from the U.S. Census Bureau Current Population Survey.
Over the entire period, the number of part-time workers in the City’s private sector increased by 9.0 percent, with substantially higher numbers of part-time workers in many sectors in 2016 than prior to the recession, notably retail trade (+32.5%), bars and restaurants (+39.5%), healthcare and social services (+9%), professional and business services (+15.6%), and information (+76.3%).
While some workers may be working fewer hours than they would prefer, others may have dropped out of the workforce altogether. While the vast majority of the roughly 40% of the population not in the labor force are retirees, students, stay-at-home parents, and others who choose not to work, a small share, which the BLS refers to as “marginally attached to the labor force,” consists of those who say they are willing and able to work but have not recently sought work.[5] They make up less than 1% of the civilian non-institutional population above 16 years of age in 2016, the same as in 2007 and 2008.
The BLS reports an alternative unemployment rate, called the U6 rate, which adds to the traditional unemployed (individuals not working but who have actively looked for work in the past 4 weeks) individuals working part-time who would rather be working full-time, and the marginally attached. Many economists contend that this is a better measure of unemployment, because it captures untapped potential labor supply. In general, the broader U6 measure follows the approximate path of the traditional U3 measure over the business cycle but is roughly 4 to 6 percentage points higher (Table 8).
Table 8. Alternative Measures of Unemployment: NYC
| 2007 | 2009 | 2016 | |
| U3: Official Unemployment Rate | 5.2% | 9.5% | 5.3% |
| U4=U3+Discouraged Workers | 5.7% | 10.4% | 5.6% |
| U5=U3+Marginally Attached | 6.5% | 11.4% | 6.6% |
| U6=U5+Involuntary Part-time | 8.9% | 15.6% | 9.5% |
SOURCE: Computed by the NYC Comptroller’s Office based on data from the U.S. Census Bureau Current Population Survey.
Analyzing the U6 measure by race and ethnicity we see a marked difference in the spread of this statistic between Whites and Asians on the one hand, and Blacks and Hispanics on the other. In the pre-recession period the spread was between 5 and 7 percentage points. At the peak of the Great Recession in NYC in 2009, this spread widened to between 10 and 12 percentage points. By 2016, it was again approaching its pre-recession level. However, for every group except “Asian and other”, the rate remained above its 2007 level, notably for Whites (+1.4%) and Blacks (+1.5%). This may be indicative of the nature of the recovery in NYC and the rise in the number of part-time jobs.
Table 9. U-6 Rate of Unemployment by Ethnicity
| 2007 | 2009 | 2016 | |
| Total | 8.9% | 15.6% | 9.5% |
| Black | 11.4% | 22.2% | 12.9% |
| Hispanic | 11.5% | 19.9% | 12.2% |
| White | 5.7% | 9.9% | 7.1% |
| Asian & other | 8.2% | 11.5% | 6.9% |
SOURCE: Computed by the NYC Comptroller’s Office based on data from the U.S. Census Bureau Current Population Survey.
Conclusion
An analysis of payroll jobs and the labor force shows that the Great Recession and subsequent expansion has been markedly different in NYC vis-à-vis the nation as a whole. Not only was the recession milder (from the point of view of employment) but the expansion occurred sooner and was more robust. The City’s employment picture by 2016 was strong, both from the perspective of payroll job creation, and from the perspective of [NYC residential employment. The robust growth in payroll jobs drew in more non-residents workers, while still affording plenty of employment opportunities to City residents.
Nonetheless, in several respects, the employment picture looks different from before the recession. The majority of new jobs created in the City during the recovery are relatively low-paying, and more of them are part-time. Wage growth was relatively strong for high-paying sectors, but flat for lower-paying industries. The unemployment rate remains above its pre-recession level for older workers – but has declined dramatically for workers without a high-school diploma, males, and Hispanics. As the national economic recovery matures, the dynamics of the labor force will bear close attention.
Prepared by Lawrence Mielnicki, Chief Economist;
Farid Heydarpour, Principal Economist; Orlando Vasquez, Economist
Published by the NYC Comptroller’s Office, Bureau of Budget
Preston Niblack, Deputy Comptroller for Budget
Appendix: Data Series Used in the Analysis[6]
Household vs. Establishment Series
Statistics on nonagricultural employment, hours of work, and earnings are compiled from two major sources: household interviews and reports from employers.
Data based on household interviews are obtained from the Current Population Survey (CPS), a sample survey of the population 16 years of age and over. The survey is conducted each month by the U.S. Bureau of the Census on behalf of the Bureau of Labor Statistics and provides comprehensive data on the labor force classified by such characteristics as age, sex, race, family relationship, marital status, occupation, and industry attachment. The survey also provides data on the characteristics and past work experience of those not in the labor force. The information is collected by trained interviewers from a sample of about 50,000 households located in 792 sample areas. These areas are chosen to represent all counties and independent cities in the U.S., with coverage in 50 States and the District of Columbia. The data collected are based on the activity or status reported for the calendar week including the 12th of the month.
Data based on establishment records are compiled each month from mail questionnaires and telephone interviews by the Bureau of Labor Statistics, in cooperation with State agencies. The Current Employment Statistics (CES) survey is designed to provide industry information on nonfarm wage and salary employment, average weekly hours, average hourly earnings, and average weekly earnings for the Nation, States, and metropolitan areas. The employment, hours, and earnings data are based on payroll reports from a sample of over 390,000 establishments employing over 47 million nonfarm wage and salary workers, full or part time, who receive pay during the payroll period which includes the 12th of the month. The household and establishment data complement one another, each providing significant types of information that the other cannot suitably supply. Population characteristics, for example, are obtained only from the household survey, whereas detailed industrial classifications are much more reliably derived from establishment reports.
Data from these two sources differ from each other because of variations in definitions and coverage, source of information, methods of collection, and estimating procedures. Sampling variability and response errors are additional reasons for discrepancies. The major factors which have a differential effect on the levels and trends of the two data series are as follows.
Employment coverage
The household survey definition of employment comprises wage and salary workers (including domestics and other private household workers), self-employed persons, and unpaid workers who worked 15 hours or more during the reference week in family-operated enterprises. Employment in both agricultural and nonagricultural industries is included. The establishment survey covers only wage and salary employees on the payrolls of nonfarm establishments.
Multiple jobholding
The household survey provides information on the work status of the population without duplication, since each person is classified as employed, unemployed, or not in the labor force. Employed persons holding more than one job are counted only once. In the figures based on establishment reports, persons who worked in more than one establishment during the reporting period are counted each time their names appear on payrolls.
Unpaid absences from jobs
The household survey includes among the employed all civilians who had jobs but were not at work during the reference week—that is, were not working but had jobs from which they were temporarily absent because of illness, vacation, bad weather, child care problems, labor-management disputes, or because they were taking time off for various other reasons, even if they were not paid by their employers for the time off. In the figures based on payroll reports, persons on leave paid for by the company are included, but those on leave without pay for the entire payroll period are not.
Earnings
The household survey measures the earnings of wage and salary workers in all occupations and industries in both the private and public sectors. Data refer to the usual earnings received from the worker’s sole or primary job. Data from the establishment survey generally refer to average earnings of production and related workers in mining and manufacturing, construction workers in construction, and nonsupervisory employees in private service-producing industries.
Commuter Data
The best estimate of jobs in NYC comes from the Bureau of Labor Statistics (BLS) Current Employment Statistics (CES) series. This series measures the jobs where they occur, not who is working at them. In order to estimate residents and commuters we have relied on an additional data set. The American Community Survey (ACS) surveys households and, among other information, asks where the household members are working. The ACS allows the identification of both commuters coming into the City to work (in-commuters) and City residents commuting outside (out-commuters). While CES data has continuity, the ACS does not. The ACS data is benchmarked every ten years and comparing a year in one decade with a year in another decade could be misleading. So, to create continuity in the data, we calculate the percent of the commuters in each industry and then multiply those factors to CES data for each respective industry.
[1] The Appendix provides more detail on the sources, definitions, and methods used in this report.
[2] We define low-, medium- and high-wage sectors with reference to the average wages, plus and minus one-third. By this definition, high-wage jobs, such as those in the securities industry, pay above $119,000 a year; medium-wage jobs, such as those in construction, pay $60,000 to $119,000 a year; and low-wage jobs, such as those in bars and restaurants, pay less than $60,000 a year. The average annual salary of a worker in New York City in a low-wage sector job was about $42,000, in a medium-wage sector about $75,000, and in a high-wage sector about $187,000, as of 2015.
[3] The “other services” category includes a wide range of non-governmental activities, including equipment and machinery repairing, promoting or administering religious activities, grantmaking, advocacy, and providing drycleaning and laundry services, personal care services, death care services, pet care services, photofinishing services, temporary parking services, and dating services. www.bls.gov/iag/tgs/iag81.htm.
[4] The most commonly reported, “headline” unemployment rate, the U3, is defined as the ratio of the total number of persons reporting they were out of work and actively looked for work within the last 4 weeks (the unemployed) divided by the number of persons working plus the unemployed (the labor force).
[5] Persons “marginally attached to the labor force” are those who want and are available for work, and who have looked for a job sometime in the prior 12 months (or since the end of their last job if they held one within the past 12 months), but were not counted as unemployed because they had not searched for work in the 4 weeks preceding the survey. A subset of those who are “marginally attached to the labor force” are what the BLS calls “discouraged workers.” Discouraged workers are individuals who are out of work and have given up looking for work because they believe there are no jobs available, or none for which they would qualify.
[6] https://www.bls.gov/lau/lauhvse.htm, revised October 16, 2001