
A Message from the Comptroller
 Dear New Yorkers,
The climate crisis is not “coming” — it’s already here. The summer of 2023 was the hottest ever on earth. Floods, wildfires, and heat waves have become commonplace across the globe. Without bold action, they will become more frequent and catastrophic in the coming years and decades – with profound consequences for our communities, our economy, and our portfolio. Climate change is putting trillions of dollars of assets at risk of destabilization.
As universal investors, invested broadly across the global economy, NYCERS has nowhere to hide from the impacts of higher temperatures, rising seas, and more frequent disasters on property and infrastructure, crop yields, supply chains, insurance premiums, and the many other impacts of climate crisis.
Climate risk is a financial risk. And that’s why bold action to confront climate risk – especially reducing emissions financed by our investments – is consistent with our fiduciary duty to mitigate financial risks, including by taking advantage of investment opportunities and reducing the contributions our investments make to climate change. The transition to clean energy presents enormous investment opportunities, as solar, wind, renewable power, new technologies to reduce reliance on fossil fuels, and climate solutions scale up across the planet.
Last year, NYCERS issued its Net Zero Implementation Plan to decarbonize its portfolio, achieve net zero greenhouse gas emissions, and support climate transition on the timeline of the Paris Accords. The plan builds on our divestment from fossil fuel reserve owners, through disclosure, active engagement with our asset managers and portfolio companies to push for science-based targets and for diligent follow-through, and by significantly expanding our investments in climate solutions.
This report describes our work over the past year. While we are proud of the many steps we have taken, we are sober about the fact that our financed emissions increased over the past year (after declines the prior three years), reflecting the same trend in the global economy.
As we publish this report, we gravely fear another trend: large American financial institutions are back-tracking on climate commitments. Last week, in a win for climate deniers, BlackRock, State Street, JPMorgan, and PIMCO withdrew from Climate Action 100+, a key resource for engagement with the largest emitters in the NYCERS portfolio. Bank of America reneged on its commitment to stop financing new coal mines, coal-burning power plants and Arctic drilling projects. Since the Paris Accords, U.S. banks have pumped over $1 trillion of investment into the expansion of fossil fuel infrastructure.
To be clear, that is regression rather than progress. NYCERS will not be able to achieve net zero on its own. We will either succeed in building a broader coalition to reduce emissions … or we will collectively burn up trillions of dollars as the world blows past 2 degrees of warming in the coming years.
But that clarity only increases our resolve for ambitious action. Together, we can and must achieve the emission reductions – not just in our portfolios, but in the real world – that are necessary to prevent climate change from destroying trillions of dollars of economic value, prematurely ending millions of lives, and fundamentally and irreversibly altering the natural world that all life depends on.
With the primary attention to satisfying the fiduciary duties owed to NYCERS and its members, in the spirit of insistent partnership, and with high ambition for collective action on the timetable required,

Brad Lander
New York City Comptroller
Executive Summary
This is the first annual report of the progress that NYCERS is making under the Net Zero Implementation Plan (“Plan”) the Board adopted on February 15, 2023 to achieve net zero portfolio GHG emissions by 2040.
The Plan commits NYCERS to:
- annual disclosure of our GHG emissions and progress towards our emissions reduction targets;
- engagement with our portfolio companies and asset managers to make progress towards net zero
- increased investments in climate change solutions
- divestment from fossil fuel reserve owners and private markets investments in the production, exploration or extraction of fossil fuels.
Consistent with its fiduciary duties to invest solely in the interests of its participants and beneficiaries and to maximize long-term investment returns in order to fund the pension benefits earned, the Board remains committed to its stated Investment Belief that its role as a fiduciary obligates it to “mitigate the risks, take advantage of opportunities, and reduce the contributions our investments make to climate change.”
This report details the activities and progress of the past year, and plans for 2024, in portfolio company and investment manager engagement, investments in climate solutions, fossil fuel divestment, and Just Transition, as well as disclosure of our Scopes 1, 2 and 3 carbon footprint and related metrics.
Summary of 2023 Accomplishments
Climate Solutions: One of the key pillars of the Net Zero Plan is to grow NYCERS’ investments in climate solutions. NYCERS has an interim target of $4 billion in climate solutions by 2025, with an ultimate goal of $17 billion by 2035.
- In 2023, NYCERS increased investments in climate solutions by $804 million of total exposure. Those investments are detailed below.
- With a current total exposure of $3.54 billion in climate solutions, NYCERS is well on track to reaching its $4 billion target by 2025.
Asset Manager Engagement: As a universal investor with virtually 100% externally managed assets, NYCERS must work with our asset managers to decarbonize our portfolio and drive decarbonization at portfolio companies. Building upon Comptroller Lander’s letter to BlackRock in 2022 underscoring the importance of addressing climate risks to investments, the Bureau of Asset Management (“BAM”) sent a letter to all asset managers communicating NYCERS’ clear and ambitious expectations regarding net zero commitments and implementation plans. To set a baseline and track managers’ decarbonization progress over time, BAM developed and distributed a robust ESG questionnaire to all NYCERS asset managers regarding net zero and science-based target (SBT) commitments, the collection of carbon emissions data, and physical climate risk assessments.
- BAM received a response from asset managers representing 95% of assets under management (AUM).
- The questionnaire results show that 39% of NYCERS’ investment funds that comprise 40% of total AUM currently measure and report Scopes 1 and 2 emissions.
- The questionnaire results also indicate that 21% of investment funds that comprise 33% of NYCERS’ AUM have adopted a net zero goal or intend to adopt one in the next 18 months.
- BAM is using the questionnaire results along with the NYCERS carbon footprint to focus engagement on active managers that are contributing the most to NYCERS’ portfolio GHG emissions without requisite policies and processes in place to reduce real world emissions.
- BAM established a new asset manager due diligence process that incorporates an enhanced ESG evaluation, which has resulted in surfacing major ESG concerns earlier in the asset manager selection process and allows BAM to identify such issues for trustees.
Science-Based Targets: The NYCERS Net Zero Plan highlights the importance of companies and asset managers setting science-based targets (SBTs) as a first step for creating a clear roadmap toward a net zero portfolio by 2040. This past year, BAM initiated robust engagement with portfolio companies and asset managers to adopt SBTs, with a goal of achieving SBTs for 70% of NYCERS’ Scopes 1 and 2 public equity and corporate bonds financed emissions by 2025. As a result of these efforts, NYCERS has made significant progress toward that goal.
- The percent of NYCERS’ financed emissions in Scopes 1 and 2 that are covered by science-based targets has doubled from 16.7% to 38.6% (including commitments to adopt science-based targets). This is a significant increase, but not clearly on track for our goal of 70% by 2025.
- Because utilities represent one of the highest emitting sectors in the NYCERS portfolio, BAM targeted 35 utility companies to push to adopt SBTs.
- On behalf of NYCERS and the other NYC Systems with net zero goals, the Comptroller’s Office co-convened the UN Recognition and Accountability Framework Asset Owner Consultation with the UN Framework Convention on Climate Change, and the Office now serves as the Science-Based Targets Thematic Lead for Climate Action 100+.
Climate Banking Engagement: In the years since the Paris Accords, U.S. banks have lent well over a trillion dollars to the expansion of fossil fuels. To push these lenders to engage more urgently in climate transition, consistent with their own net zero commitments, NYCERS filed shareholder proposals at five major U.S. banks urging adoption of 2030 interim GHG emissions reduction targets based on absolute emissions in addition to emissions intensity. Four of the five went to a vote and received 13.5% shareholder support on average. In 2024 NYCERS is filing shareholder proposals for the banks to disclose the ratio of financing through equity and debt underwriting and project finance in low-carbon energy supply relative to that in fossil-fuel energy supply.
Just Transition: A Just Transition toward a low-carbon economy must not recreate the inequities of the fossil fuel economy, but instead deliver tangible labor and environmental justice benefits. However, a widely adopted, holistic Just Transition framework for investors does not yet exist. BAM is recommending an initial approach to a Just Transition definition and framework to inform NYCERS investment decision-making, consistent with fiduciary duties, that identifies concrete investor strategies to advance Just Transition priorities.
Private Markets Divestment Policy: NYCERS’ Plan makes clear that real economy decarbonization must include an approach to keeping fossil fuels in the ground. NYCERS completed a full divestment from fossil fuel reserve owners in public markets in 2022. In the Plan NYCERS announced a new policy to expand its exclusion of fossil fuel exploration, extraction and production to private markets investments, which has now been implemented in our private markets limited partnership agreement side letters.
Disclosure: After showing substantial declines from 2019 to 2022, our GHG emissions for the year ended June 30, 2023 increased substantially, reflecting the uptick in global emissions that accompanied the post-pandemic surge in economic activity. Our portfolio GHG emissions as of 2023 are lower than the baseline year of 2019, but higher than they were in 2022.
- Scopes 1 and 2:
- After average annual 8.5% declines in Scopes 1 and 2 financed emissions intensity from 2019-22, it increased by 12.4% in Fiscal Year (FY) 23.
- Overall, our Scopes 1 and 2 financed emissions intensity has decreased 11.57% as of June 30, 2023 since December 31, 2019.
- The benchmark’s carbon footprint increased less than NYCERS’ portfolio – actively managed equity was a major source of difference, contributing almost ten times more to increase in financed emissions as passively managed equity contributed.
- Scope 3:
- Scope 3 financed emissions intensity increased 65.4% in FY 23.
- Last year, NYCERS Scope 3 financed emissions intensity was 29% lower than the benchmark. Now it is 6% higher. Again, actively managed equity contributed more than half of the total increase in Scope 3 financed emissions.
These increases in portfolio GHG emissions over the past year are a genuine concern. While NYCERS knew, that the road to Net Zero would not be linear, and that the post-pandemic economy would not sustain the emissions declines of prior years, we must acknowledge that this is regression, not progress.
NYCERS is pleased with the progress we made during the first year actively implementing our Plan, while recognizing that achieving decarbonization of the real-world economy is a huge challenge. We are committed to playing our part by engaging with our portfolio companies and asset managers, investing our capital in climate solutions that will generate the appropriate risk-adjusted returns, pushing for a Just Transition, and fully disclosing the greenhouse gas emissions for which our investments are responsible, as much as possible and consistent with our fiduciary duties.
NYCERS hopes this report will engage readers and inspire other investors to join us in our efforts to prevent climate change from further harming the planet on which we all depend to create long-term, sustainable economic growth.
| Summary of 2023 NYCERS Net Zero Actions |
|---|
| DISCLOSE Emissions and Risk |
| As of June 30, 2023, NYCERS’ Scope 1 and 2 financed emissions intensity (tons of financed emissions / million dollars invested (FE/$m)) was 76.4, marking an increase of 12.42% from June 30, 2022. NYCERS is almost 20 percentage points away from its 2025 interim emissions reduction target of 32%, compared to the December 2019 baseline. |
| Utilities, Energy, and Industrials remain the highest emitting sectors in both the NYCERS portfolio and the blended benchmark; the top 70% financed emissions are attributed to 108 companies in the NYCERS portfolio, compared to 197 companies in the benchmark. |
| As of June 30, 2023, NYCERS’ Scope 3 financed emissions intensity was 431.5, marking an increase of 65.38% from June 30, 2022. |
| ENGAGE for Alignment and Action |
| As of June 30, 2023, 22.8% of NYCERS’ absolute Scope 1 and 2 financed emissions in public equity and corporate bonds are covered by science-based targets validated by the SBTi with an additional 15.8% committed to setting science-based targets with SBTi within the next two years. This results in 38.6% of absolute Scope 1 and 2 financed emissions in NYCERS’ public equity and corporate bonds portfolio being covered by SBTi-approved science-based targets or commitments to set such targets in the next two years. Our goal is 70% of Scope 1& 2 portfolio emissions with science-based targets by 2025. |
| On behalf of NYCERS, the Comptroller has engaged with 35 utilities without SBTs representing 18.8% of Scopes 1 & 2 financed emissions. |
| On behalf of NYCERS, the Comptroller is serving as thematic lead for Climate Action 100+ on topic of science-based targets and net zero. |
| 39% of investment funds that comprise 40% of NYCERS’ total AUM stated they measure and report Scope 1 and 2 emissions for the investments of the fund/product they manage for the System. 21% of investment funds that comprise 33% of NYCERS’ AUM stated they have adopted a net zero goal or intend to adopt one in the next 18 months. Our goal is 100% of public and private markets managers to have net zero goals or science-based targets and an accompanying implementation plan by 2025. |
| INVEST in Climate Change Solutions |
| As of June 30, 2023, NYCERS has a total of $3.54 billion in invested and unfunded commitments in climate change solutions across all asset classes. Our goal is $4 billion by 2025. |
| DIVEST to De-Risk |
| NYCERS added language in its private markets side letter for managers to commit to exclude investments in the production, exploration, ownership, or extraction of fossil fuels. |
Section 1: Invest in Climate Change Solutions
One of the key pillars of the Plan is to grow NYCERS’ investments in climate solutions. NYCERS has a goal of investing a total of $17 billion in climate change solutions by 2035, and an interim goal of $4 billion by 2025, consistent with our fiduciary duties and our investment objectives. As of June 30, 2023, NYCERS has a total of $3.54 billion in invested and unfunded commitments in climate change solutions across all asset classes, an increase of 29.4% or $804 million over year end 2022. Since NYCERS is close to achieving its 2025 target of $4 billion, the Board is considering increasing its interim goal. This result comes as global leaders closed the annual United Nations Climate Change Conference (COP28) with a commitment to “laying the ground for a swift, just and equitable transition, underpinned by deep emissions cuts and scaled-up finance.”
Examples of climate solutions investments NYCERS has made include:
- Intersect Power, a clean energy company bringing innovative and scalable low-carbon solutions to its customers in retail and wholesale energy markets.
- Form Energy, which is developing, manufacturing, and commercializing a new class of cost-effective, multi-day energy storage systems that will enable a reliable and fully renewable electric grid year-round.
- Nextracker, which provides intelligent solar tracker solutions for utility-scale and distributed generation projects to transform photovoltaic (PV) plant performance.
Details of NYCERS’ climate solutions investments along with definitions by asset class are in Appendix A.
| NYCERS – Climate Solutions Investments ($million) – Jun 30, 2023 | |||||||||
|---|---|---|---|---|---|---|---|---|---|
| Total Portfolio | Public Equity Active | Public Equity Passive | Public Fixed Income | Alternative Credit | Private Equity | Real Estate | Infrastructure | ||
| 2Q 2023 (1Q23 data for infrastructure) – Including unfunded commitments in climate exposure | |||||||||
| 06/30/23 total NAV | 80410 | 17895 | 18196 | 24741 | 3603 | 8252 | 5870 | 1853 | |
| 06/30/23 climate exposure | 3538 | 703 | 1190 | 490 | 132 | 122 | 481 | 420 | |
| 06/30/23 climate % | 4.4% | 3.9% | 6.5% | 2.0% | 3.7% | 1.5% | 8.2% | 22.7% | |
| NYCERS – Climate Solutions Investments ($million) – Dec 31, 2022 | |||||||||
| Total Portfolio | Public Equity Active | Public Equity Passive | Public Fixed Income | Alternative Credit | Private Equity | Real Estate | Infrastructure | ||
| 4Q 2022 (2Q22 data for real estate; 3Q22 data for infrastructure) – Including unfunded commitments in climate exposure | |||||||||
| 12/31/22 total NAV | 76499 | 16497 | 16694 | 24700 | 3326 | 7989 | 5775 | 1518 | |
| 12/31/22 climate exposure | 2734 | 645 | 831 | 377 | 29 | 133 | 398 | 320 | |
| 12/31/22 climate % | 3.6% | 3.9% | 5.0% | 1.5% | 0.9% | 1.7% | 6.9% | 21.1% | |
| Analysis of Changes from Dec 2022 to Jun 2023 | |||||||||
| Total Portfolio | Public Equity Active | Public Equity Passive | Public Fixed Income | Alternative Credit | Private Equity | Real Estate | Infrastructure | ||
| Total NAV % Change | 5.1% | 8.5% | 9.0% | 0.2% | 8.3% | 3.3% | 1.7% | 22.1% | |
| Climate exposure % Change | 29.4% | 8.9% | 43.2% | 29.8% | 349.6% | -8.3% | 21.0% | 31.2% | |
Section 2: Asset Managers: Net Zero Plans by 2025
NYCERS’ Net Zero Implementation Plan set the following expectations for our asset managers:
- All our public and private markets asset managers to have a net zero goal or science-based targets, and an implementation plan covering, at a minimum, assets managed for the System, by June 30, 2025. We expect public markets managers to have their goals, targets and plans in place by that date. For private markets managers the expectation will apply for commitments NYCERS makes from that date forward.
- All managers to cover Scopes 1 and 2 emissions and material Scope 3 emissions of underlying investments in their targets and plans.
- BAM will review the proxy voting record of public markets asset managers related to climate change, including shareholder proposals and director elections.
To help achieve these expectations, BAM integrates consideration of climate risks and opportunities and net zero alignment in asset manager due diligence, monitoring and engagement and will annually report a summary of the status of the System’s managers to the Board.
2.1 Monitoring and Engagement of Asset Managers
In July 2023, BAM sent a letter to all of NYCERS’ current managers ensuring they are aware of the Systems’ Net Zero by 2040 expectations and encouraging them to align with these expectations consistent with fiduciary duty and their investment objectives.
Along with the letter, BAM sent managers the annual ESG questionnaire. In 2023, BAM revised and updated its annual ESG questionnaire to managers to add more specific questions related to climate and net zero alignment. The climate-related topics include:
- The managers’ adoption of a net zero goal, science-based targets, or alternative decarbonization goals for the funds and strategies in which the System invests as well as the managers’ total AUM.
- The managers’ adoption of a written implementation plan to achieve any formal decarbonization goals.
- The percentage of total Scope 1, 2, and 3 emissions currently measured for the funds/products managed for the System as well as for the managers’ total AUM.
- The assessment of physical climate risk, transition risk, nature-related impacts and dependencies, and water-related risks and stewardship.
BAM received responses from 161 managers for 420 funds that represent 95% of NYCERS’ AUM. These answers provide a baseline from which to measure progress towards the expectations outlined in the Net Zero Implementation Plan.
As a starting baseline for formal decarbonization goals across NYCERS’ portfolio, the following percentages of managers stated they have adopted, or intend to adopt in the next 18 months, net zero goals, science-based targets, other decarbonization goals or implementation plans. The goals and targets apply to the funds or products the managers invest in for NYCERS:
- 21% of investment funds that comprise 33% of NYCERS’ AUM, adopted or intend to adopt a net zero goal
- 17%, that comprise 13% of the AUM, adopted or intend to adopt science-based targets
- 29%, that comprise 34% of AUM, adopted or intend to adopt other decarbonization goals
- 32%, that comprise 37% of the AUM, adopted or intend to adopt written implementation plans to support their decarbonization goals.
We expect these numbers, which were reported in the summer of 2023, to improve over time after receipt of our July 2023 net zero expectations letter and with subsequent targeted engagement of managers throughout the year. Results by asset class appear in Appendix B.
As a starting point for GHG emissions disclosure, about 39% of managers covering 40% of NYCERS AUM stated they measure and report Scope 1 and 2 emissions for the investments of the fund/product they manage for the System. 23% of managers covering 27% of the AUM stated they measure and report Scope 3 emissions for the fund/product.
The majority of NYCERS managers are already beginning to assess the impacts of climate change and related risks in their portfolio.
- 80% of investment funds that comprise 89% of AUM currently or intend to assess physical climate risk exposure for some or all of their investments.
- 75% of investment funds that comprise 87% of AUM assess or plan to assess transition risk in some or all of their investments.
- 71% of investment funds that comprise 84% of the AUM assess or plan to assess nature-related impacts and dependencies.
- 73% of investment funds that comprise 82% of the AUM assess or plan to assess water-related risks and water stewardship.
Based on information collected from the questionnaire, BAM will prioritize engagement of managers to encourage and support further adoption of net zero goals, science-based targets or other decarbonization goals along with written implementation plans. Given the outsized share of NYCERS’ public markets financed emissions concentrated in actively managed funds, working with active public markets managers is a critical component of the decarbonization strategy. In addition, BAM will seek to further understand the integration and pricing of physical, transition, nature, and water risks. BAM will report activity, findings and progress from this engagement to the Board in the 2024 Plan Report.
Pursuant to the Net Zero Implementation Plan, BAM is consulting with some of the System’s existing private markets managers to develop a proposal for how managers without control over portfolio companies can address GHG emissions in their investments. This is particularly applicable to some investments in Alternative Credit, Private Equity Growth and Real Estate Debt.
BAM will continue to monitor and, to the extent practicable, participate in industry initiatives to develop frameworks and guidance for net zero alignment in private markets asset classes and non-control investments. BAM will provide a progress report on this work in the 2024 Plan Report.
2.2 Due Diligence of Asset Managers
BAM conducts due diligence of material environmental, social, and governance (ESG) factors, including climate change-related risks and opportunities, for all asset managers across all asset classes as part of the overall diligence process conducted prior to approvals and recommendations of investments to the Board. Climate change poses both systemic and idiosyncratic risks for the investment portfolio and is, therefore, actively assessed in the diligence for all managers and strategies and explored in more depth where it may be more financially material.
As a starting point for diligence, BAM utilizes the Due Diligence Questionnaire template of the Institutional Limited Partners Association (ILPA) for private markets managers and a similar template for public markets managers. The ILPA-based template is used along with the BAM-specific supplement described above. These questionnaires collect written disclosures of how managers consider climate change-related risks and opportunities in diligence and portfolio management, whether and how they measure the greenhouse gas emissions of their investments, what climate commitments or targets they have and whether they report in line with the Task Force on Climate-Related Financial Disclosures (TCFD) recommendations. During diligence, the BAM team asks clarifying questions about the written responses as well as questions about the managers’ climate-related practices using specific past investments as examples.
BAM looks at the managers’ past management and governance of the exposure to physical risks stemming from climate change as well as the management and governance related to climate-related transition risks stemming from evolving regulation and market preferences. In addition, BAM diligences the manager’s future plans to integrate and price-in climate-related physical and transition risks and opportunities where material.
BAM also looks at the manager’s progress in decreasing its contribution to the systemic risks of climate change and evolving market preferences through emissions reduction pathways. In 2023, BAM adopted specific diligence questions related to climate change and net zero alignment including whether managers measure the Scope 3 emissions of their investments; whether they have specifically adopted net zero goals, science-based targets or other emissions reduction targets for their investments; whether they have a written plan to support these goals or targets; and whether their goals or targets cover Scope 3 emissions of their investments. For specific high emitting sectors, we conduct deeper diligence. For example, for midstream oil and gas assets, we diligence our managers’ monitoring and management of methane leaks at portfolio companies given methane’s global warming potential is 28 times that of carbon dioxide.[1] BAM summarizes and reports findings related to climate-related ESG diligence in investment memoranda to the Board.
In recognition of the importance of nature as a vital carbon sink and subject of the cascading impacts of climate change, BAM has been monitoring the release of the final Task Force on Nature-Related Financial Disclosures (TNFD framework), which is harmonized with the TCFD/ISSB S2 framework, and will make a recommendation on the next steps to help mitigate the systemic risk from large-scale ecosystem collapse.
Section 3: Public Markets Portfolio Companies: Science-Based Targets
The Plan highlights the importance of companies setting science-based targets (SBTs) as a first step for creating a clear roadmap toward a net zero portfolio by 2040 with these goals:
- NYCERS seeks to have companies representing 70% of Scopes 1 & 2 (S1S2) financed emissions (FE) to adopt science-based targets (SBTs), to be approved by SBTi or otherwise independently verified with globally established science-based standards by June 30,
- NYCERS seeks to have companies representing 90% of Scopes 1, 2 & 3 financed emissions to adopt SBTs by 2030 with such targets also approved by SBTi or other independent globally established standards.
- NYCERS will focus efforts toward engagement of these companies by prioritizing portfolio companies in the highest emitting sectors in Scopes 1 and 2 – Energy (primarily oil and gas), Utilities, Industrials, and Materials – in developed markets as well as the largest emerging markets portfolio companies in those sectors.
In 2023 NYCERS initiated robust engagement with portfolio companies and asset managers to adopt SBTs to achieve the Plan’s goals for increasing alignment of our public equity and corporate bonds portfolio companies with science-based pathways to limit global warming to 1.5 Celsius.
3.1 Current Science-Based Targets Coverage
In the last year, the percentage of NYCERS’ publicly listed portfolio companies that have set science-based targets or committed to do so through the Science-Based Target Initiative (SBTi) has more than doubled, from 16.7% to a total of 38.6%. As of June 30, 2023, 22.8% of NYCERS Scope 1 and 2 financed emissions in public equity and corporate bonds are covered by science-based targets validated by the SBTi, with an additional 15.8% committed to setting science-based targets with SBTi within the next two years. This results in 38.6% of Scope 1 and 2 financed emissions in NYCERS’ public equity and corporate bonds portfolio being covered by SBTi-approved science-based targets or commitments to set such targets in the next two years.
While this is a significant and encouraging increase, we flag that we remain a significant distance from our goal of having portfolio companies representing 70% of our public equity and corporate bonds Scope 1 and 2 emissions covered by, or at least committed to, SBTs by 2025.
Percentage Financed Emissions by SBTi Status
3.2 Engagement Activity and Initial Results
To achieve NYCERS’ SBT goals, BAM assessed the public markets portfolio for the highest emitters and current portfolio coverage of SBTs and developed a focus list of companies for engagement. BAM found that in 2022 108 companies were responsible for 70% of NYCERS’ Scope 1 and 2 financed emissions with the highest concentration among Utilities and Energy companies.
BAM prioritized engagement of companies by sector, share of financed emissions, and availability of sectoral guidance from SBTi. BAM determined to initially focus on the Utilities sector for the following reasons:
- Utilities are linchpins in efforts to decarbonize the global economy – other high emitting companies purchase power directly from utilities.
- According to the International Energy Agency, under a net zero by 2050 energy scenario, electricity utilities must hit net zero emissions by 2040.[2] The decarbonization of the global economy is dependent on a quicker transition in the utility sector.
- There is robust sector-based guidance from SBTi for the Utilities sector which acknowledges the need for the sector to decarbonize at a faster pace than other sectors of the economy.
BAM constructed an initial target list of 35 high-emitting utility companies without SBTs, that are based in North America or Europe, and owned by at least two of the three New York City pension funds that have net zero goals. Collectively, these companies represented 18.8% of NYCERS’ Scope 1 and 2 financed emissions in 2023. In August 2023, Comptroller Lander sent letters to these 35 utility companies encouraging their adoption of science-based targets validated by SBTi or another third-party entity.
All 35 companies responded to the engagement letter sent in August 2023. BAM has conducted additional direct engagement with over half of the letter recipients and will continue engagement throughout 2024. While nearly all of these companies have made net zero commitments, the vast majority are not yet covered by or committed to science-based targets.
Alongside distribution of our engagement letter, BAM also engaged with the U.S. utility trade association, the Edison Electric Institute (EEI), to discuss their members’ approach to science-based targets. From both EEI and individual companies with whom BAM has had direct engagements, we have learned that, while a small handful of their members have submitted plans to SBTi, the majority of their members have expressed concerns with their ability to utilize SBTi methodology. EEI is therefore in the process of developing an alternative, science-based target-setting protocol for the utility industry, in partnership with the Electric Power Research Institute (EPRI).
As stated in the Net Zero Implementation Plan, NYCERS remains open to other methodologies beyond SBTi that are science-based and where targets can be verified by a third-party; however, we will not sign off on any targets that serve to water down the net zero commitments of utilities. As a result of BAM’s direct company engagement and engagement with EEI on behalf of the industry, BAM is considering how to formally review the methodology under development and consider whether NYCERS’ goals can be satisfied through this forthcoming approach.
3.3 Climate Action 100+ Thematic Lead and Collaboration with Other Net Zero Asset Owners
On behalf of NYCERS and other Systems with net zero goals, BAM serves as a lead thematic investor on the topic of science-based targets and net zero for the Climate Action 100+ (CA100+). CA100+ established this new theme and role for its second phase based on discussions with BAM and other members and the need for greater collaboration on this important systemic issue. As thematic lead, BAM will facilitate collaborative activities and engagements across sectors and lend topical expertise to existing CA 100+ engagement teams to increase the number of companies with science-based targets. BAM has proposed three initial areas for collaboration in the coming year:
- Establish a cohort of CA 100+ signatory investors that are requesting third-party verified science-based targets from high-emitting companies.
- Develop a shared understanding of what is acceptable to investors as a science-based target.
- Identify key actions that a company should take to ensure accountability after it sets science-based targets.
Specific engagement opportunities will flow from these topics.
In addition, on behalf of NYCERS and the other NYC Systems with net zero goals, the Comptroller has been actively reaching out to other global Net Zero asset owners to foster collaboration. During NYC Climate Week in September 2023 the Comptroller co-hosted a roundtable for Net Zero asset owners, and the UN Framework Convention on Climate Change (UNFCCC), the secretariat for the Conference of the Parties (COP), asked the Comptroller to co-convene the UN Recognition and Accountability Framework Asset Owner Consultation in the lead-up to COP 28. A dozen asset owners from Europe, Asia and the U.S. participated in the consultation and in follow-up conversations as well. NYCERS is an active member of the Paris-Aligned Asset Owners Organization (PAAO) and is considering also joining the Net Zero Asset Owners Alliance.
Future Strategy
3.4 Continued Portfolio Company Engagement
In addition to continuing the work that BAM began with the Utilities sector, on behalf of NYCERS and the other Systems with net zero plans, BAM plans to continue engaging with higher emitting portfolio companies to encourage third-party validated science-based targets in three additional waves between now and June 30, 2025. BAM expects to begin engagement with high-emitting Materials sector companies in early 2024. BAM will employ a similar approach as it took with Utilities companies – a letter from the Comptroller to encourage adoption of science-based targets followed by direct engagement and engagement through additional channels (e.g., trade associations, industry events, etc.) BAM will continue to utilize the new science-based targets thematic lead role through CA100+ to accelerate this activity.
To the extent that BAM will need to evaluate non-SBTi standards, BAM plans to work with industry experts and other stakeholders to ensure that alternative standards are truly science-based and meet the requirements of NYCERS’ Net Zero implementation plan.
3.5 Assessing Net Zero Alignment of Portfolio Companies
Pursuant to the Net Zero Implementation Plan, BAM is exploring data sources, tools, frameworks and methodologies for assessing the net zero alignment of portfolio companies as recommended by the Paris-Aligned Asset Owners (“PAAO”) Net Zero Investment Framework (NZIF). NZIF recommends assessing and setting targets for the net zero alignment of portfolio companies based on the categories of not aligned, committed to aligning to net zero, aligning to net zero, aligned to net zero and achieving net zero. NZIF recommends six main criteria for how to classify a company in these categories. They include whether a company (1) has a net zero goal; (2) has interim emissions reduction targets (including for material Scope 3 emissions); (3) reports emissions performance relative to targets; (4) discloses Scopes 1, 2 and 3 emissions; (5) has a detailed decarbonization strategy; and (6) has capital expenditures supporting net zero alignment. NZIF recommends the following methodologies to support assessment of the alignment of companies in line with the criteria above: (1) Climate Action 100+ Benchmark, (2) Transition Pathway Initiative (TPI) carbon performance and management quality indicators and (3) Science-Based Targets Initiative. NZIF specifically recommends using SBTi for assessing companies against alignment criteria 2, 3 and 4. NZIF also states that private data providers may also support assessment of alignment of companies in line with NZIF criteria.
Section 4: Engagement with Banks
In 2023, NYCERS filed shareholder proposals that requested that Bank of America[3], Goldman Sachs, JPMorgan, Morgan Stanley, and Royal Bank of Canada disclose interim 2030 absolute greenhouse gas (GHG) reduction targets for their lending and underwriting in the high-emitting sectors of oil and gas and power generation. These targets should align with a science-based net-zero pathway and complement the emission intensity targets the banks have already set for these sectors.
An absolute financed emissions target aims to reduce GHG emissions by a set amount, while an intensity target is a normalized metric that sets an organization’s emissions target relative to an economic or operational variable. Unlike absolute targets, intensity targets do not necessarily correlate with emissions reductions. Relying solely on intensity targets could allow a bank’s clients to invest in expanded volumes of fossil fuel production with increased absolute financed emissions in the real economy as long as the bank’s overall intensity per dollar decreases.
As signatories to the Net Zero Banking Alliance (NZBA), the five banks have previously committed to achieving net-zero GHG emissions by 2050 and to reporting progress against absolute emissions and/or emissions intensity targets and some have begun to do so.
All of the proposals, except at Morgan Stanley, went to a vote and received 13.5 % of votes cast on average. The proposal at Morgan Stanley was withdrawn for procedural reasons.
In 2024, NYCERS will continue to advocate for improved disclosure to track banks’ progress towards their own net zero goals. NYCERS, TRS, and BERS filed shareholder proposals requesting the calculation and disclosure of an energy supply ratio that shows the banks’ total financing through equity and debt underwriting and project finance in low-carbon energy supply relative to that in fossil-fuel energy supply.
Bloomberg New Energy Finance (BNEF) annually publishes an Energy Supply Banking Ratio report that compares banks’ “low-carbon” energy supply financing to their fossil fuels financing. BNEF aggregates climate scenarios to project that the overall clean energy supply ratio must reach 4:1 by 2030, 6:1 during the 2030s and 10:1 thereafter. BNEF’s methodology uses numerous assumptions and estimates because of inadequate reporting from banks.
BNEF reports the 2022 ratios for the banks where we are filing the 2024 resolutions as follows:
| RBC | 0.4 |
| Citi | 0.6 |
| JP Morgan | 0.8 |
| B of A | 1.0 |
| Goldman Sachs | 1.2 |
| Morgan Stanley | 1.3 |
BNEF puts the global real economy ratio for 2022 at 1:1 ($2 trillion each for fossil fuels and low-carbon supply), with the bank financing ratio at .73. By urging them to disclose their ratio of clean to fossil fuel financing, we hope the banks will increase the former while reducing the latter, focus on accelerating the transition, and disclose more information about their financing to have them take their commitments to net zero seriously. We believe that the ratio would complement the banks’ aggregate financed emissions disclosures and provide investors a more robust picture.
Section 5: Just Transition
The NYCERS Net Zero Implementation Plan includes a commitment to support a Just Transition “in the investment process, consistent with our fiduciary duties.” The trustees directed BAM to recommend an initial approach for this effort by the fourth quarter of 2023. As articulated in the net zero implementation plan, the recommended approach should:
- Integrate assessments of how NYCERS investments support a Just Transition to a low-carbon and net zero economy to mitigate systemic risk, adhere to human rights standards and support sustainable value creation, consistent with our fiduciary duties.
- Develop and apply prudent frameworks for a Just Transition assessment in:
- Diligence and monitoring of investment managers
- Shareholder engagement
- Other appropriate aspects of the investment process.
- To develop the framework, BAM shall continue to assess data, methodologies, and standards for evaluating how NYCERS investments support a Just Transition, including but not limited to ensuring genuine stakeholder engagement with local communities, workers and their union representatives, and environmental advocates; providing tangible economic benefits to the communities in which companies operate; and hiring local workers, with a priority if applicable to displaced workers from fossil fuel-related industries.
While many asset owners and investors have committed to incorporating the Just Transition into their investment strategies and net zero plans, there is not yet a widely adopted, formal, holistic framework for investors. This document lays out a beginning definition and workplan and summarizes existing and relevant literature.
5.1 Defining a Just Transition
Just Transition is a term that is used broadly and often poorly defined. Since NYCERS’ adoption of the Net Zero by 2040 plan, the team at BAM developed a definition that could be applicable to NYCERS’ work as asset owners and allocators that will inform investment decision-making moving forward, consistent with NYCERS’ fiduciary duties:
As we implement our Net Zero by 2040 plan and transition away from fossil fuels, a Just Transition requires that the workers and communities who have powered our economy must benefit from the transition. Investments in climate solutions must not recreate the inequities of the fossil fuel economy but strive to deliver tangible labor and environmental justice benefits. NYCERS supports the preamble to the 2015 Paris Accord: “When taking action to address climate change we will respect, promote and consider our obligations to human rights, the right to health, the rights of indigenous peoples, local communities, workers, migrants, children, persons with disabilities and people in vulnerable situations, as well as gender equality, empowerment of women and intergenerational equity.”[4]
5.2 Investor Strategies
As institutional investors with fiduciary oversight and duty, BAM has identified five strategies through which to implement Just Transition Priorities:
- Investment policy
- Manager selection and engagement
- Coalition building with other asset owners
- Individual portfolio company engagement
- Regulatory advocacy
Given the limited resources and scope, BAM recommends focusing immediate energy on investment policy, manager selection and engagement, coalition building with other asset owners and individual portfolio engagement, particularly in private markets. Regulatory advocacy is not in the immediate purview of the System’s trustees, so the focus is on strategies one through four below.
- Investment Policy
- NYCERS will update our Net Zero by 2040 implementation plan with a clear definition of Just Transition and these strategies.
- Manager Selection & Engagement
- Ask all potential asset managers in both public and private markets to disclose their Just Transition definition and plans and how Just Transition factors into their investment decision-making.
- Include a question about Just Transition plans and implementation in BAM’s annual ESG questionnaire with all managers in both public and private markets.
- Coalition Building
- BAM is working to build a coalition of global high ambition net zero asset owners. In partnership with the UN, Comptroller Lander and BAM have met with more than a dozen large asset owners to discuss Net Zero plans. Just Transition is an important component of this partnership work. To maximize impact, BAM will work to ensure that asset owners have a generally agreed upon definition and can work together to push asset managers to adhere to the principles of a Just Transition, as defined above.
- Individual portfolio company engagement
- Public Markets
- NYCERS is a universal investor with shares in almost every public company, with the exception of those companies NYCERS has divested. It is therefore imperative that NYCERS focus our portfolio company engagement to maximize impact. In the adopted Net Zero plan, NYCERS has identified 90 US-based companies in our portfolio that are responsible for the vast majority of our fossil fuel emissions. NYCERS will include Just Transition priorities in our engagement with those companies. As we engage with these priority companies, we will identify stakeholders and meet with them to understand the nature of the specific concerns regarding their economic and community impacts and will develop proposals and engagements based on the stakeholder demands, assuming they are aligned with our fiduciary duty and interest.
- NYCERS will introduce Just Transition shareholder proposals at targeted companies as necessary.
- Private Markets
- As is true across NYCERS’ ESG work, our engagement with private market portfolio companies is different than its public market equivalent. Beyond our asset manager engagement, often individual portfolio company engagement is done on an as-needed basis. As NYCERS identifies material and investor-related concerns with portfolio companies, including relevant information from stakeholders, we will reach out to the asset manager. NYCERS intends to continue this model and work to publicize our prioritization of Just Transition principles so that key stakeholders are aware of our role.
- Public Markets
5.3 Engaging Stakeholders to Advance a Just Transition
One of the key principles of Just Transition rests in the understanding that, all too often, the communities that are most affected by climate change, pollution and resulting economic changes are considered an after-thought in the decision-making process and are not seen as experts in developing potential solutions.
Given the scope and reach of the System’s investments, NYCERS acknowledges that it will not be possible to engage all affected communities. However, as we engage individual portfolio companies in particular, it is imperative that we meet with and learn from affected stakeholders to develop our engagement priorities and proposals.
BAM has identified three stakeholder communities that we believe NYCERS should engage and learn from as the System embarks on the planning process. NYCERS will engage key stakeholders to advise on possible priorities in our coalition building, asset manager and portfolio company engagement. Stakeholders will primarily fall within the following categories:
- Workers’ Rights & Labor Unions – particularly those most affected by the transition from a fossil-fuel based economy to a green economy.
- Front-line environmental justice organizations, with an emphasis on those in NYC and in North America.
- Organizations and Individuals who focus on global fairness and emerging markets, as needed.
As NYCERS engages with these stakeholders we understand that different stakeholders may have different, even competing, perspectives on what a company should do to ensure a just transition. Additionally, NYCERS will assess if stakeholder priorities are consistent with our fiduciary duty and whether they are requests that NYCERS, in our capacity as asset owners, can address.
Section 6: Divest to De-Risk
In 2015, NYCERS began excluding from its portfolio publicly-traded companies which derive at least 50% of their revenue from thermal coal production, mining and/or processing. In 2018, NYCERS voted to set a goal to divest from fossil fuel owners in publicly traded equity and fixed income securities within five years following . NYCERS completed the divestment in 2022 for a total of $1.7 billion. subsequently evaluating the impact of this divestment on our portfolio annually.
Consistent with the Board’s Fossil Fuel Reserve Owner Divestment resolution, NYCERS’ Net Zero Implementation Plan provides that BAM shall ask all private markets managers recommended for Board approval to commit across the recommended fund to exclude investments in exploration, extraction or production of oil, gas or thermal coal, or to otherwise provide NYCERS with the ability to opt out of such investments. BAM has implemented this policy by adding language to private markets side letters and is assessing all investments for exploration, extraction or production of oil, gas or thermal coal in their funds or products under consideration during the diligence process, consistent with fiduciary duty.
In addition, the Net Zero Implementation Plan stated NYCERS will explore further potential prudent actions in the thermal coal value chain, including coal infrastructure and coal-powered electricity generation, as part of our engagement strategy, to manage the phaseout of high-risk fossil fuel assets and expedite the transition to a clean energy economy. Such actions may include consideration of additional exclusions of the coal value chain to address the high financial and climate risk of thermal coal, subject to investment analysis to ensure compliance with our fiduciary duties and an assessment of Just Transition plans for workers. We have not taken additional action in this area yet but will maintain the objective of exploring prudent ways to address uncompensated risks of the thermal coal value chain in NYCERS’ portfolio.
Section 7: Disclose Emissions and Risk
Public Equity and Corporate Bonds Interim Scope 1 and 2 Emissions Reduction Targets and Annual Carbon Footprint Analysis
We know that our progress towards Net Zero will not be smooth or linear, just as we are seeing in the global economy. After showing substantial declines from 2019 to 2022, our GHG emissions for the year ended June 30, 2023 increased substantially, reflecting the uptick in global emissions that accompanied the post-pandemic surge in economic activity. Our portfolio GHG emissions as of 2023 are still lower than the baseline year of 2019.
In our Net Zero Implementation Plan, NYCERS set aspirational targets to reduce the Scope 1 and 2 financed emissions intensity in our public equity and corporate bonds (including investment grade, high yield and convertible bonds) portfolio by 32% by 2025, 59% by 2030, and 100% by 2040, using a baseline of December 31, 2019. For these interim emissions reduction targets, NYCERS uses “financed emissions intensity” (tons of CO2 equivalent emissions/$million invested) based on Enterprise Value Including Cash (EVIC) as the primary metric for emissions. We also report, measure and evaluate changes in absolute financed emissions (which will be also referred to as financed emissions or FE in this report) and weighted average carbon intensity (WACI) (tons of CO2/$million sales) and strive toward comparable progress among all metrics. Scope 3 emissions and target-setting are discussed in the subsection further below on Scope 3 emissions. For definitions of Scopes 1, 2 and 3, please see Appendix E.
NYCERS’ Scope 1 and 2 financed emissions intensity had decreased by 21.34% during the years between December 31, 2019, and June 30, 2022, yielding an average annual reduction of 8.54%. However, from June 30, 2022 to June 30, 2023, NYCERS’ Scope 1 and 2 financed emissions intensity increased by 12.42%. This was a higher rate of increase than the benchmark’s increase of 5.78%. Additional details are discussed below. Overall, NYCERS’ Scope 1 and 2 financed emissions intensity decreased 11.57% from Dec. 31, 2019 until June 30, 2023.
Public Equity and Corporate Bonds Annual Carbon Footprint Analysis
On behalf of NYCERS, BAM conducted an annual updated carbon footprint analysis of the System’s public equity and corporate bond portfolios and a blended benchmark[5] portfolio. The analysis used holdings data as of June 30, 2023 and MSCI’s carbon footprint data and analytics[6]. Public equity and corporate bonds constituted 54.6% of NYCERS’ total assets as of June 30, 2023. Corporate bonds include only 1) investment grade, 2) high yield (including convertible bonds).
7.1 Scope 1 and 2
7.1.1 Scope 1 and 2 – Financed Emissions and Intensity
During Fiscal Year 2023 NYCERS’ public equity and corporate bonds portfolio experienced a greater increase than the blended benchmark, as depicted in Table 1. Most of this increase was driven by the increase in underlying Scope 1 and 2 emissions of the portfolio companies, followed by change in EVIC of companies, and new investments.
Table 1: Public Equity and Corporate Bonds Scope 1 and 2 Financed Emissions and Intensity
| NYCERS – Financed Emissions Intensity – Scope 1 and 2 | ||
|---|---|---|
| NYCERS Portfolio Tons carbon emissions/$m invested |
Blended Benchmark Tons carbon emissions/$m invested |
|
| 31-Dec-19 | 86.40 | 77.58 |
| 30-Jun-22 | 67.96 | 58.80 |
| 30-Jun-23 | 76.40 | 62.20 |
| Change % (2022-2023) | 12.42% | 5.78% |
| Change % (2019-2023) | -11.57% | -19.82% |
| NYCERS – Absolute Financed Emissions – Scope 1 and 2 | ||
| NYCERS Portfolio Tons carbon emissions |
Blended Benchmark Tons carbon emissions |
|
| 31-Dec-19 | 3,656,537 | 3,234,250 |
| 30-Jun-22 | 2,788,136 | 2,384,931 |
| 30-Jun-23 | 3,352,732 | 2,732,120 |
| Change % (2022-2023) | 20.25% | 14.56% |
| Change % (2019-2023) | -8.31% | -15.53% |
NYCERS’ public equity and corporate bonds absolute financed emissions (FE) also increased more than the benchmark’s total FE during Fiscal Year 2023. Almost half of the increase in FE was driven by the increase in underlying Scope 1 and 2 emissions of the portfolio companies, and more than a third of the increase can be explained by the increase in market value of the securities, amongst other factors.
While NYCERS’ financed emissions intensity and FE have both decreased since the baseline year of 2019, both have decreased less than the benchmark during that period as well.
The highest emitting sectors in both the NYCERS portfolio and the benchmark are materials, utilities, energy, and industrials, collectively representing almost 85% of financed emissions, and 23% of portfolio weights (see Table 2). That a significant share of NYCERS’ public portfolio is actively managed helps explain the overall higher FE in the portfolio compared to the benchmark. On behalf of NYCERS, BAM is pursuing active engagement with portfolio companies in these high emitting sectors, starting with utilities (see more details on engagement in Section 3 above).
Table 2: High Emitting Sectors (Scope 1 and 2) – Jun 30, 2023
| NYCERS Portfolio | NYCERS Blended Benchmark | |||||
|---|---|---|---|---|---|---|
| GICS Sector | Portfolio Weight | Contribution to Scope1,2 FE | GICS Sector | Portfolio Weight | Contribution to Scope1,2 FE | |
| Materials | 4.6% | 28.3% | Materials | 4.3% | 28.5% | |
| Utilities | 3.6% | 27.6% | Utilities | 3.3% | 24.7% | |
| Energy | 3.6% | 19.5% | Energy | 4.9% | 22.1% | |
| Industrials | 11.6% | 10.2% | Industrials | 10.5% | 9.6% | |
| Top 4 High Emitting Sectors | 23.4% | 85.6% | Top 4 High Emitting Sectors | 23.1% | 84.9% | |
Figure 1 below shows the percentage of Scope 1 and 2 emissions reductions needed for the public equity and corporate bonds portfolios each year to achieve the interim emissions reduction targets of 2025 and 2030 and net zero emissions by 2040. NYCERS would need to reduce emissions by approximately an additional 20% by 2025 to achieve its interim target of 32% emissions reduction.
Fig 1: NYCERS – Realized and Projected Emissions Reduction Targets (Scope 1 and 2)
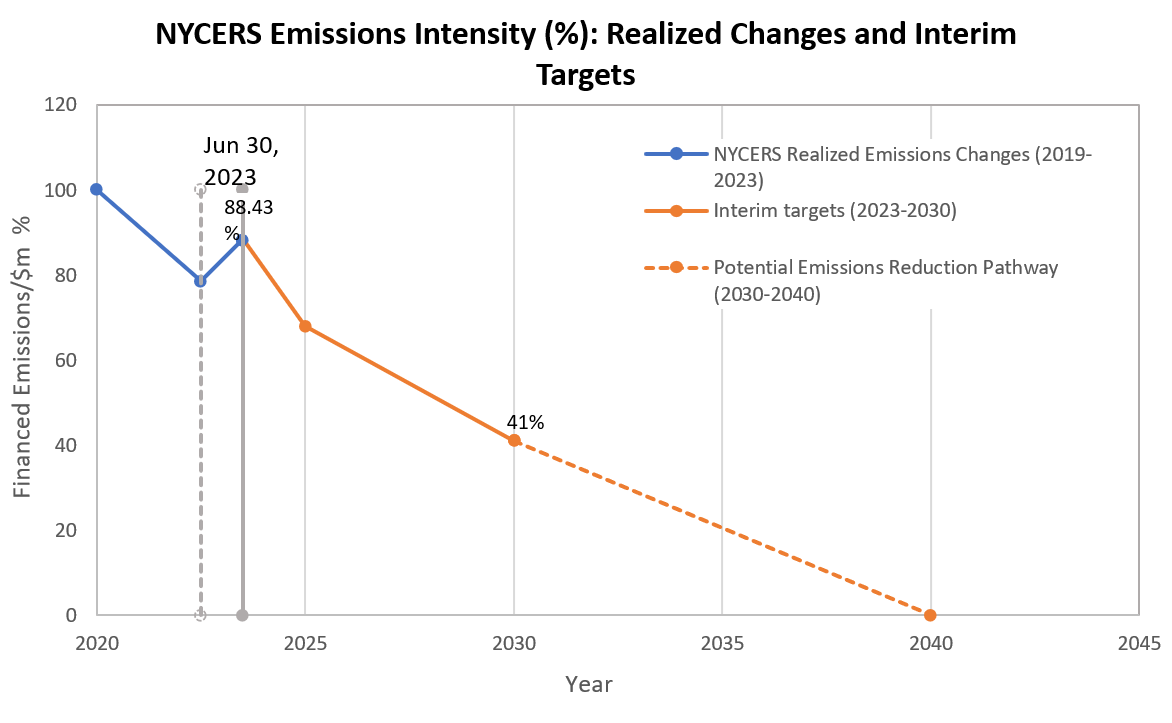
While we continue to assess sources of (and changes in) emissions increases in NYCERS portfolio and engage with the highest emitting sectors and companies in pursuit of our targets, it is important to note that some of this increase is in line with the expected post-pandemic increase in economic activity in the US[7] (EIA 2022) and the increase in global energy-related emissions[8] (IEA 2023).
For details on NYCERS’ Scope 1 and 2 emissions by sub-asset class, by active vs. passive equity, by sector, and by WACI, please see Appendix C.
7.2 Scope 3 Financed Emissions
7.2.1. Scope 3 – Financed Emissions and Intensity
NYCERS public equity and corporate bonds portfolio experienced a greater increase in Scope 3 financed emissions intensity than the benchmark, as depicted in Table 4. Most of this increase was driven by the increase in underlying Scope 3 emissions of the portfolio companies, followed by change in EVIC of companies, and new investments.
Table 4: Public Equity and Corporate Bonds – Scope 3 – Financed Emissions and Intensity
| NYCERS – Financed Emissions Intensity – Scope 3 | ||
|---|---|---|
| NYCERS Portfolio Tons carbon emissions/$m invested |
Blended Benchmark Tons carbon emissions/$m invested |
|
| 30-Jun-22 | 260.92 | 367.60 |
| 30-Jun-23 | 431.50 | 405.20 |
| Change % (2022-2023) | 65.38% | 10.23% |
| NYCERS – Absolute Financed Emissions – Scope 3 | ||
| NYCERS Portfolio Tons carbon emissions |
Blended Benchmark Tons carbon emissions |
|
| 30-Jun-22 | 10,741,650 | 14,919,198 |
| 30-Jun-23 | 18,944,404 | 17,791,200 |
| Change % (2022-2023) | 76.36% | 19.25% |
NYCERS’ Scope 3 absolute financed emissions also increased more than the benchmark during this time. More than two-thirds of this change can be attributed to an increase in the underlying Scope 3 emissions of the portfolio companies, and the rest is explained by the changes in the market value of securities, EVIC, and addition of new securities amongst other factors.
The highest emitting sectors for Scope 3 in both NYCERS’ portfolio and the benchmark are Materials, Consumer Discretionary, Energy, and Industrials, collectively representing more than 75% of financed emissions, and almost 31% of portfolio weights (see Table 5). That a significant share of NYCERS’ public portfolio is actively managed helps explain the overall higher Scope 3 financed emissions in the portfolio compared to the benchmark. The top 70% of Scope 3 financed emissions are attributed to 227 companies in the NYCERS’ portfolio compared to 268 in the benchmark.
NYCERS has not yet set interim Scope 3 emissions reductions goals because we do not yet have enough data. We plan to set such goals by 2025 as data availability and quality improve.
Table 5: High Emitting Sectors (Scope 3) – Jun 30, 2023
| NYCERS Portfolio | NYCERS Blended Benchmark | ||||
|---|---|---|---|---|---|
| GICS Sector | Portfolio Weight | Contribution to Scope 3 FE | GICS Sector | Portfolio Weight | Contribution to Scope 3 FE |
| Energy | 3.6% | 36.8% | Energy | 4.9% | 34.6% |
| Industrials | 11.6% | 17.0% | Industrials | 10.5% | 17.5% |
| Consumer Discretionary | 12.1% | 12.2% | Materials | 4.3% | 15.5% |
| Materials | 4.6% | 10.2% | Consumer Discretionary | 11.2% | 11.8% |
| Top 4 High Emitting Sectors | 31.9% | 76.2% | Top 4 High Emitting Sectors | 30.9% | 79.4% |
For details on NYCERS’ Scope 3 emissions by sub-asset class, by active vs. passive equity, by sector, and by WACI, please see Appendix D.
7.3 Sector Decarbonization Targets
BAM will review the sectoral target setting protocols by the widely used net zero frameworks, and propose interim emissions reduction targets for NYCERS’ highest emitting sectors in 2024.
7.4 Private Markets
On behalf of NYCERS, BAM continues to evaluate tools and data sources for conducting carbon footprint analyses for our Private Equity, Alternative Credit, Real Estate, and Infrastructure portfolios. We are also reviewing industry frameworks for applicable guidance, including from Net Zero Asset Owner’s Alliance (NZAOA), Net Zero Investment Framework (NZIF), Science-Based Targets Initiative (SBTi), Institutional Investors Group on Climate Change (IIGCC) and Initiative Climate International (iCI), for our private asset classes’ emissions assessment and net zero guidance.
7.5 Task Force on Climate-Related Financial Disclosures (TCFD)/ISSB S2 Climate Standards Reporting
As part of our commitment to the Paris-Aligned Asset Owner Alliance, and as outlined in our Net Zero Implementation Plan, NYCERS pledged to produce a climate report in accordance with the Task Force on Climate-related Financial Disclosures (TCFD). The TCFD wound down in October 2023 as part of the consolidation of international sustainability standards under the International Financial Reporting Standards (IFRS) International Sustainability Standards Board (ISSB). The TCFD will now become the ISSB S2 Climate Standards starting in 2024.
NYCERS plans to publish an ISSB S2 Climate aligned report (formerly the TCFD) in 2024. With this change we also plan to transition and align our carbon accounting metrics as closely as possible to the PCAF standard, as recommended by the TCFD, CDP, and the US Treasury.
Appendices
Appendix A – Climate Solutions Investments
Table 7: NYCERS – Climate Solutions Investments
| NYCERS – Climate Solutions Investments ($million) – Jun 30, 2023 | ||||||||
|---|---|---|---|---|---|---|---|---|
| Total Portfolio | Public Equity Active | Public Equity Passive | Public Fixed Income | Alternative Credit | Private Equity | Real Estate | Infrastructure | |
| 2Q 2023 (1Q23 data for infrastructure) – Including unfunded commitments in climate exposure | ||||||||
| 06/30/23 total NAV | 80410 | 17895 | 18196 | 24741 | 3603 | 8252 | 5870 | 1853 |
| 06/30/23 climate exposure | 3538 | 703 | 1190 | 490 | 132 | 122 | 481 | 420 |
| 06/30/23 climate % | 4.4% | 3.9% | 6.5% | 2.0% | 3.7% | 1.5% | 8.2% | 22.7% |
| NYCERS – Climate Solutions Investments ($million) – Dec 31, 2022 | ||||||||
| Total Portfolio | Public Equity Active | Public Equity Passive | Public Fixed Income | Alternative Credit | Private Equity | Real Estate | Infrastructure | |
| 4Q 2022 (2Q22 data for real estate; 3Q22 data for infrastructure) – Including unfunded commitments in climate exposure | ||||||||
| 12/31/22 total NAV | 76499 | 16497 | 16694 | 24700 | 3326 | 7989 | 5775 | 1518 |
| 12/31/22 climate exposure | 2734 | 645 | 831 | 377 | 29 | 133 | 398 | 320 |
| 12/31/22 climate % | 3.6% | 3.9% | 5.0% | 1.5% | 0.9% | 1.7% | 6.9% | 21.1% |
| Analysis of Changes from Dec 2022 to Jun 2023 | ||||||||
| Total Portfolio | Public Equity Active | Public Equity Passive | Public Fixed Income | Alternative Credit | Private Equity | Real Estate | Infrastructure | |
| Total NAV % Change | 5.1% | 8.5% | 9.0% | 0.2% | 8.3% | 3.3% | 1.7% | 22.1% |
| Climate exposure % Change | 29.4% | 8.9% | 43.2% | 29.8% | 349.6% | -8.3% | 21.0% | 31.2% |
To comprehensively account for the climate solutions exposure in our portfolios and to be consistent with the best practices recommended in the Climate Investment Roadmap 2022 by IIGCC (The Institutional Investors Group on Climate Change), NYCERS adopted a new weighted average calculation method to account for climate solutions investments in public markets replacing the prior method of accounting for climate solutions investments. The prior method counted all of a company’s market value as a climate solutions investment if 50% of more of its revenue was derived from climate solutions activity. The new method counts only the percentage of a company’s market value that is the percentage of its revenue derived from climate solutions activity.
Definitions of Climate Solutions Investments
Public Equity: Companies that derive revenue from MSCI’s Environmental Impact categories of alternative energy, energy efficiency, green building, pollution prevention, or sustainable water. New weighted average method adopted as of 4Q 2022.
Public Fixed Income: Companies that derive revenue from MSCI’s Environmental Impact categories of alternative energy, energy efficiency, green buildings, sustainable water, pollution prevention, or sustainable agriculture, as analyzed by Risk Management. New weighted average method adopted as of 4Q 2022.
Also includes green bonds based on manager surveys conducted by Fixed Income Team. Managers were allowed discretion in defining green bonds.
Alternative Credit: OFI market values are based on manager surveys conducted by Alternative Credit Team. The definition of climate solutions used for OFI is “investments in companies that generate 50% or more revenue from clean and renewable energy technologies and assets including (1) renewable energy such as solar, wind, geothermal and hydropower; (2) energy efficiency and energy smart technologies such as power storage, fuel cells and carbon capture and storage; (3) energy efficient transport and (4) low carbon buildings.” This definition is a summary of the MSCI and Burgiss definitions as well as a reflection of a definition by Ceres. Total OFI NAV based on data from Alternative Credit Team.
Private Equity: Companies predominantly focused on a business activity classified under the Burgiss category of “Eco Friendly” activities, including renewable energy, biofuel and other clean tech or associated companies. All data is NAV.
Real Estate: Properties certified as Energy Star. Includes properties certified as LEED only if they are also certified as Energy Star. All data is based on manager surveys conducted by the Real Estate Team. All data is NAV.
Infrastructure: Includes categories of alternative energy, energy efficiency, green buildings, sustainable water, pollution prevention, and sustainable agriculture. Data for 2Q 2023 is based on 1Q 2023.
Climate solutions identified by Infrastructure Consultant for 1Q 2023.
Economically Targeted Investments (ETI): ETI data is incorporated in the data for Public Fixed Income and Real Estate due to the portfolio’s investment structure.
The calculations include only assets for which BAM provides investment advice and, therefore, does not include VSFs.
Appendix B – Annual ESG Questionnaire Net Zero Results by Asset Class
Number of NYCERS Investment Funds with a Formal Net Zero by 2050 goal
Percentage of NYCERS AUM with Formal Net Zero by 2050 goals, arranged by Asset Class
% of NYCERS Funds/ Products Measuring Scope 1&2 Emissions Across Asset Classes (by number of funds)
% of NYCERS Funds/ Products Measuring Scope 3 Emmissions Across Asset Class (by number of funds)
Note that 0% of Alternative Credit is measuring Scope 3 emissions. Carbon accounting methodologies are still developing for many kinds of alternative credit products like CLOs, MBS, etc.
Appendix C – Scope 1 and 2 Financed Emissions Breakdowns
Scope 1 and 2 – Sub-Asset Classes Financed Emissions
As of June 30, 2023, total public equity and corporate bonds represent about 80% and 20% of the measured public security portfolio’s market value, but their contributions to Scope 1 and 2 financed emissions are 73.5% and 26.5%, respectively. U.S. equity has higher total financed emissions but lower financed emissions intensity than international equity. Within fixed income, high yield has twice the total financed emissions and emissions intensity of investment grade corporate bonds.
Sub-Asset Classes Financed Emissions (Scope 1 and 2) – June 30, 2023
Between June 2022 and June 2023, however, high yield bonds saw the largest percentage increase in Scope 1 and 2 financed emissions. High yield also had the largest contribution of the sub-asset classes to the change/increase in Scope 1 and 2 financed emissions from 2022 to 2023. The Utilities sector drove the majority of this increase in the Scope 1 and 2 financed emissions in high yield, followed by Industrials and Materials.
While the portfolio’s total public equity market value is almost equally divided between active and passive strategies, the contribution of actively managed equity to Scope 1 and 2 financed emissions (and the financed emissions intensity) is twice as much as that of the passive portion (see Fig 3).
Active vs Passive Equity Financed Emissions (Scope 1 and 2) – June 30, 2023
Share of Scope 1,2 Equity Financed Emissions
Share of Total Equity Market Value 2
Between June 2022 and June 2023, the increase in active public equity financed emissions intensity(?) was almost ten times higher than the increase in passive equity financed emissions. Active equity contributed more than a third to the total increase in Scope 1 and 2 financed emissions from 2022 to 2023.
Scope 1 and 2 – Top 70% Financed Emissions
The top 70% of Scope 1 and 2 financed emissions are attributed to 108 companies in the NYCERS portfolio, compared to 197 companies in the benchmark. Both the total number of companies responsible for the top 70% of financed emissions and the sectoral distribution of these top emitters is comparable to 2022 for the NYCERS portfolio and benchmark.
Fig 4: Sector Contribution to Top 70% Financed Emissions (Scope 1 and 2) June 2022 and June 2023
The Utilities and Energy sectors remain the highest emitting sectors among the top 70% of financed emissions. This year, 24 Utilities companies contributed 24.1% to NYCERS total Scope 1 and 2 financed emissions in public equity and corporate bonds, 30 Materials companies contributed 18.7% and 20 Energy companies contributed 16.6%. This information continues to be critical to our engagement activities towards the NYCERS goal of 70% of Scope 1 and 2 financed emissions covered by science-based targets by June 30, 2025.
Scope 1 and 2 – Weighted Average Carbon Intensity (WACI)
| NYCERS – Weighted Average Carbon Intensity – Scope 1 and 2 | ||
|---|---|---|
| NYCERS Portfolio Tons carbon emissions/$m sales |
Blended Benchmark Tons carbon emissions/$m sales |
|
| 30-Jun-22 | 196.87 | 174.60 |
| 30-Jun-23 | 172.20 | 161.60 |
| Change % (2022-2023) | -12.53% | -7.45% |
Weighted Average Carbon Intensity (WACI) (financed emissions per million dollars of sales) decreased by 12.53% during the year 2022-2023, as the increase in emissions was outdone by the increase in sales of the portfolio companies, amongst other factors. This increase in sales is consistent with the increase in economic activity that is also driving increase in company emissions.
Appendix D – Scope 3 Financed Emissions Breakdowns
Scope 3 – Sub-Asset Classes Financed Emissions
As of June 30, 2023, public equity and corporate bonds represent approximately 80% and 20% respectively of their combined market value, but their contributions to Scope 3 financed emissions are 82.8% and 17.2%, respectively. U.S. equity has higher Scope 3 financed emissions and emissions intensity than international equity. Within corporate bonds, high yield has twice the total financed emissions and emissions intensity of investment grade corporate bonds.
NYCERS – Sub-Asset Classes Financed Emissions (Scope 3) June 2023
Between June 2022 and June 2023, high yield saw the largest percentage increase in Scope 3 financed emissions. The Energy sector drove much of this increase in the Scope 3 financed emissions in high yield, followed by Financials and Materials. U.S. equity, though, had the largest contribution to the change/increase in Scope 3 financed emissions from 2022 to 2023.
While the portfolio’s public equity market value is almost equally divided between active and passive strategies, the contribution of actively managed equity to Scope 3 financed emissions (and the financed emissions intensity) is almost twice as much of the passive portion (see Fig 6).
Active vs Passive Equity FE (Scope 3) – Jun 30, 2023
Share of Scope 3 Equity Financed Emissions
Share of Total Equity Market Value
Between June 2022 and June 2023, the increase in active equity financed emissions was higher than the increase in passive equity financed emissions. Active equity contributed more than half of the total increase in Scope 3 financed emissions from 2022 to 2023.
Scope 3 – Weighted Average Carbon Intensity (WACI)
| NYCERS – Weighted Average Carbon Intensity – Scope 3 | ||
|---|---|---|
| NYCERS Portfolio Tons carbon emissions/$m sales |
Blended Benchmark Tons carbon emissions/$m sales |
|
| 30-Jun-22 | 595.03 | 791.80 |
| 30-Jun-23 | 640.20 | 769.90 |
| Change % (2022-2023) | 7.59% | -2.77% |
Scope 3 Weighted Average Carbon Intensity (WACI) (financed emissions per million dollars of sales) increased by 7.59% during the year 2022-2023, as the increase in Scope 3 emissions outpaced the increase in sales of the portfolio companies, amongst other factors. This increase in sales is consistent with the increase in economic activity that is also driving the increase in company emissions.
Appendix E – Definitions of GHG Emissions and Categories (Scopes 1, 2 & 3)
Scopes 1, 2 and 3 are ways of categorizing the different sources of GHG emissions from a company’s direct operations and its wider value chain.
| Scope 1 | Scope 2 | Scope 3 |
|---|---|---|
| Covers the direct emissions from sources owned or controlled by a company – for example, by running its boilers and vehicles | Covers indirect emissions from the generation of energy a company purchases | Covers all other indirect emissions up and down a company’s supply and value chain. For example, a petroleum company’s Scope 3 emissions include the emissions from the gasoline they produce when it is burned by a customer’s car. A bank’s Scope 3 emissions include those from extracting fossil fuels from projects they finance. It is estimated that Scope 3 emissions constitute 75% of firms’ emissions on Average.10 |
Illustration of Scopes 1, 2 and 3 emissions
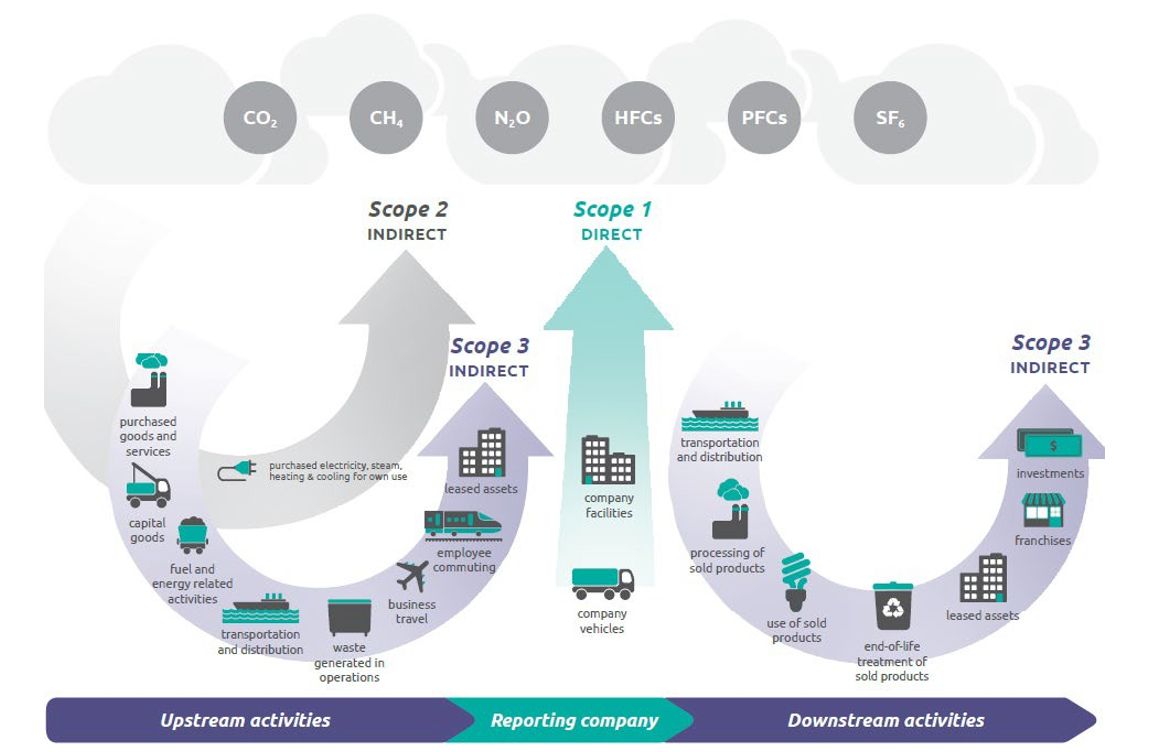
Source: Greenhouse Gas Protocol Corporate Value Chain (Scope 3) Accounting and Reporting Standard (2011)
Endnotes
[1] Microsoft Word – Global-Warming-Potential-Values.docx (ghgprotocol.org)
[2] https://www.iea.org/reports/world-energy-outlook-2022
[3]Co-filed with the New York State Common Retirement Fund
[4] 2015 United Nations Paris Agreement, p. 2, ADOPTION OF THE PARIS AGREEMENT – Paris Agreement text English (unfccc.int)
[5] Blended benchmark for NYCERS, as of Jun 30, 2023, is comprised of: Russell 3000 48.45%, MSCI Ex-US Developed Equity 21.53%, MSCI Emerging Market Equity 8.97%, Bloomberg Agg IG 12.08%, Bloomberg HY 5.38%, Bloomberg Convertible Bonds 3.59%
[6] As MSCI makes progress on PCAF alignment, some of these metrics may evolve. We continue to monitor evolving industry guidance and standards for calculating the portfolio carbon footprint. We are moving to more closely align with the PCAF standard for the asset classes in which there is guidance next year. The current footprint is calculated using the MSCI Carbon Analytics tool.
[7]https://www.eia.gov/todayinenergy/detail.php?id=50958#:~:text=As%20the%20U.S.%20economy%20began,remaining%20virtually%20flat%20in%202023.