
Introduction
When the Covid pandemic struck in early 2020, New York City was ground zero. Though the earliest signs were coming from New Rochelle and Seattle, by the end of March, New York City was the most widely affected. The city’s population density, which had historically been a cornerstone of its economic strength, suddenly became its Achilles’ heel: its busy offices, crowded bars, vibrant clubs, and packed subways provided the perfect environment for spreading the deadly disease. While lockdowns, cessation of travel, and steep job losses occurred across the nation (and world), the effect on New York City was particularly severe.
Five years later: fortunately for New York City, warnings of a “new normal” favoring suburbs and sprawl and a likely “doom loop” for the Big Apple have not panned out. However, while the economy as a whole has largely recovered, it is still a good way short of its pre-pandemic trend—that is, where it would have been if pre-pandemic trends had continued—and certain segments of the local economy, notably the office market, remain in a slump.
Yet it is increasingly clear that the subdued growth in the city’s economy results not from weak demand (i.e. people and businesses not wanting to be here) but rather from an increasingly severe housing shortage. This Spotlight assesses the contours of New York City’s post-pandemic rebound and explores both the foundations that make the local economy so resilient and the constraints that are holding it back.
Pandemic Collapse & Rebound
Here Today, Gone Tomorrow: The Covid Shock
As of the end of 2019, New York City’s economy had been on a record-breaking run. In the decade following the Great Recession, city-wide employment grew at a nearly 2.5% annual rate—the strongest on record over a 10-year period—and, though it wasn’t known at the time, its population had reached a record 8.8 million. Aside from some pullback in home prices following years of solid price increases, there were few signs of slowing growth.
The initial Covid-19 outbreak was designated a pandemic on March 11, 2020, though there were already earlier indications by late February. The swiftness with which it transformed the economy was staggering. The quarantining of a New Rochelle neighborhood on March 10th was followed by a complete shutdown of New York City schools and “non-essential” businesses over the next two weeks. The extraordinary human toll, with 20,000 deaths in the first two months, was exacerbated by an extraordinary economic toll with a record-shattering 23% drop in private-sector employment across the city. The national economy was also hit hard, though somewhat less so, with a 16% job loss. By mid-2021, the city’s population is estimated to have fallen by roughly 350,000 (4%) from its early-2020 record of 8.8 million (based on the decennial Census), and the office market was still languishing; but the overall economy appeared to be on the rebound.
It’s a Long Way Back
Given the depth of the city’s economic collapse in the spring of 2020, a full recovery was expected to take a long time. Yet by 2023, aside from the office market and complementary businesses whose customer base was largely office workers, the economy had largely returned to normalcy. Payroll employment was back to its pre-pandemic peak, and the proportion of adult city residents with jobs actually climbed to a record high. Over the past year, however, employment has grown only modestly and almost all of the net job creation has been in Health & Social Assistance, whereas employment in the key sectors that have historically driven the city’s economy—Finance, Information, and Professional & Business Services—as well as Information Technology, which had grown in the preceding years, has essentially stalled. The office market, aside from the very high end (so-called 5-star properties), has languished with vacancy rates holding near multi-decade highs and market rents remaining well below pre-pandemic levels.
Yet the city’s economy has also shown some positive signs. Indicators of daily office attendance suggest that, while New York is below pre-Covid levels, it has seen a substantially more vigorous rebound than most of the rest of the nation. And tourism, the sector most ravaged by the pandemic, has fully rebounded. Perhaps the clearest sign of underlying strength in the local economy has been the exceptionally strong housing market—a blessing and, as will be discussed later, a curse.
NYC’s History of Resilience
Averting the Road to Ruin
Over the past half century, New York City has seen a number of boom-bust cycles and has endured its fair share of severe economic shocks. Each time, it has come back stronger. The city’s most severe and protracted downturn occurred in the early to mid-1970s, caused by the confluence of a nationwide manufacturing collapse, rising crime, an urban-to-suburban population exodus, and fiscal governance issues. Between 1969 and 1977, employment fell almost continuously, adding up to a cumulative drop of 16%. However, the fiscal crisis of 1976 led to substantial reforms that, after a period of adjustment and fiscal consolidation, ultimately led to a secular reversal. After losing population over a period of almost three decades, New York saw four decades of continuous population gains and increasingly brisk job growth, weathering the severe 1982 recession better than the rest of the nation.
From 1989 to 1992, the city once again entered a deep and protracted recession, this time led by a confluence of different forces. First was a steep downturn in finance and other service sector jobs, as many back-office functions and jobs migrated to remote (and cheaper) locations—a trend enabled by advances in telecommunication technology—compounded by lagged effects of the 1987 stock market crash. Second was a commercial and residential real estate bust, arguably related to , not only in New York City, but throughout most of the Northeast. In contrast with the 1970s downturn, though, the city’s population continued to rise throughout, and the mid-1990s brought a robust economic rebound.
In 2001, the 9-11 terrorist attack, combined with the “dot-com bust” and a national recession, dealt yet another blow to the city’s economy. By September 2001, New York City was already well into an economic downturn, which had begun at the start of the year. The city’s key finance and tech sectors were particularly hard hit—largely a result of the bursting of the dot-com bubble in 2000. The U.S. experienced an unusually slow “jobless recovery” from that recession, and New York City did not see a sustained upturn until 2004.
The financial crisis, with the collapse of Lehman Brothers and the upheaval in the Securities industry in 2008, along with the Great Recession, was widely expected to have a particularly severe effect on New York City, due to its dependence on the financial sector. The city did see an economic downturn but, this time, less severe than elsewhere.
Just as the economy was rebounding from that recession, Superstorm Sandy struck in late 2012, causing extensive flooding, widespread power outages, and major transit disruptions. While it had a negligible effect on citywide employment trends, many businesses and neighborhoods were hard hit and flood planning became a priority.
Chart 1 below illustrates how hard New York City was hit by each of these events and episodes, and how each time it has ultimately come back even stronger.
Chart 1
Sources: NY State Department of Labor; Moody’s Economy.com; US Bureau of Labor Statistics
How Has NYC Fared Versus Other Cities?
The city’s roller-coaster path over the last half-century has left it far stronger than it started off. But how does New York compare with other cities across the U.S.? By almost any broad level measure, New York tops the list: it has the largest population, the highest density, the most headquarters of Fortune 500 corporations, the highest land values, and is the top U.S. destination for tourists.
One dimension where New York stands out most starkly from other U.S. cities—and one that enables its economy to lead the nation—is its mass transit system. While ridership, both in New York City proper and across the metro area, remains nearly 20% below pre-pandemic levels, New York still dwarves all other major urban areas. To get a sense of the magnitude of transit’s contribution to New York City’s economy, overall ridership—both before and after the pandemic—is roughly 8x higher than the 2nd ranked metro area (Los Angeles in 2025, Chicago pre-Covid) as shown in Chart 2. Even if these numbers were scaled to the relative sizes of the respective cities or metro areas, New York would outpace all of them by well over 100%.
Chart 2
Source: Federal Transit Administration
How has New York City fared in terms of growth over the years? Here it depends on what metric one uses, and also what time horizon. The most widely used local economic metric is payroll job growth—that is, the rate at which employment at workplaces in the city has grown. Because the most granular measure of local employment is at the county level, one cannot make precise city-to-city comparisons with other major U.S. cities, as defined by municipal boundaries. [Only New York, DC, Philadelphia, and San Francisco line up with counties or county equivalents.] However, one can compare employment trends in New York City (five counties) with the urban counties containing other major cities.
Prior to the pandemic, over the period 2010-2019, New York City was near the middle of the pack relative to other major U.S, as shown in Chart 3. San Francisco, Seattle, and Austin—major tech hubs—and a number of southern cities (Charlotte, Atlanta, and Phoenix) registered somewhat stronger job growth than New York. When the time horizon is expanded beyond the pandemic to 2024, New York lags behind a majority of the cities observed.
Chart 3
Sources: U.S Bureau of Labor Statistics (QCEW) and Moody’s economy.com
Headwinds Constraining Growth
Has the Shift to Remote Work Hampered NYC?
Although employment in New York City has fully rebounded from the pandemic, reaching new peaks, it is not close to its pre-pandemic trend. This is also the case for a number of the other cities observed here. Moreover, almost all of the net job gain in New York City since 2019 has been in the Health & Social Assistance sector—a sector that is particularly vulnerable to recently legislated federal cuts. Given the seismic changes in remote work and related developments, it is important to gauge whether it is supply or demand factors that have been holding back growth—that is, whether the city has become a less desirable place to live and work or whether the city does not have the capacity to accommodate more people and more businesses.
One storyline that was pervasive early in the pandemic held that both fear of disease transmission along with the surge in remote work made dense urban areas broadly less desirable. Residents and businesses had historically paid a sizable premium to live and locate, respectively, in large cities. But during Covid, much of that premium went away; and, while the fear of disease transmission has largely (though not entirely) abated, remote work has remained far more prevalent than pre-Covid, and weekday office attendance lags. In short, the premium on urban office space has clearly receded, at least for now and lack of commercial space is not in general a constraint on growth.
Insofar as where people choose to live, the payoff of living near one’s workplace, at least for those with hybrid/remote work options, has also clearly diminished. So the question, in aggregate, is: how much do people value living in a densely populated city with an unparalleled array of amenities? If substantially fewer people were viewing New York City as a desirable place to live, landlords would be scrambling to fill vacant apartments, rents would be declining, and the sales market for condos, co-ops and other homes would be languishing. However, the current environment appears to be quite the opposite. With escalating rents and historically low vacancy rates, it would appear that New York City is in high demand.
Within New York City, the outer boroughs have seen a much stronger rebound in employment than Manhattan, where the lion’s share of the city’s offices are. Yet things could have been a good deal worse for Manhattan’s central business districts if the pandemic had struck a few decades earlier. At the end of the ‘70s, Lower Manhattan was home to only about 16,000 residents; by the year 2020, its population had increased nearly five-fold to more than 78,000. While many consumer-facing businesses in Lower Manhattan still catered largely to office workers, the neighborhood had become more of a 24/7 community than just a 9-to-5 world, and this provided somewhat of a cushion for these businesses during and after the pandemic.
The Housing Shortage Is Constraining Growth
If the city’s sluggish growth of late is not a reflection of weak demand for living and doing business in New York City, what is holding back growth? Prior to the pandemic, the high cost of both commercial (office and retail) space and housing appeared to be factors limiting growth in New York City. Since then, of course, commercial rents have fallen sharply and much more space has become available. However, the housing shortage (along with the escalating cost of housing) has intensified and is now clearly the city’s primary headwind. In our February 2024 Spotlight, we highlighted the growing gap between the number of jobs and the number of housing units. Specifically, from 2010 to 2024, while citywide employment has increased by 28%, the number of housing units has expanded by just 11%, as shown in Chart 4 below.
The dearth of affordable housing is more than just a supply-demand imbalance; even with a large increase in the overall supply of housing, market rate rentals would still be unaffordable to many residents or prospective residents. Still, increasing the supply of housing is a necessary (if not sufficient) pre-requisite for making housing more affordable.
Chart 4
Sources NY Department of Labor, U.S. Census Bureau, Population & Housing Unit Estimates (2010-2024), Decennial Census (1980,1990,2000).
The housing shortage is evident not only in New York City but across the whole metropolitan region, and also in other major metro areas. Over the five years since the onset of the pandemic in the spring of 2020, home prices have soared nationwide and, to varying degrees, across major metro areas. Over this period, during which the general price level jumped 25%, home prices climbed by more than 60% across the New York metro area and by similar magnitudes across the South, as shown in Chart 5 below. Of the areas shown, only San Francisco saw prices rise by less than 40%; but even this far exceeded overall inflation and was on top of a dramatic 90% rise over the preceding decade. These steep rises in home prices, combined with significantly higher mortgage rates, imply a substantial decline in affordability. They also imply that housing supply has not even come close to keeping up with housing demand, as explained in this recent research paper.
Chart 5
Sources: S&P CoreLogic Case-Shiller Home Price Indices, Moody’s economy.com
Note: This measure of home prices is not available for the Houston, Austin, San Antonio, Nashville, Philadelphia metro areas.
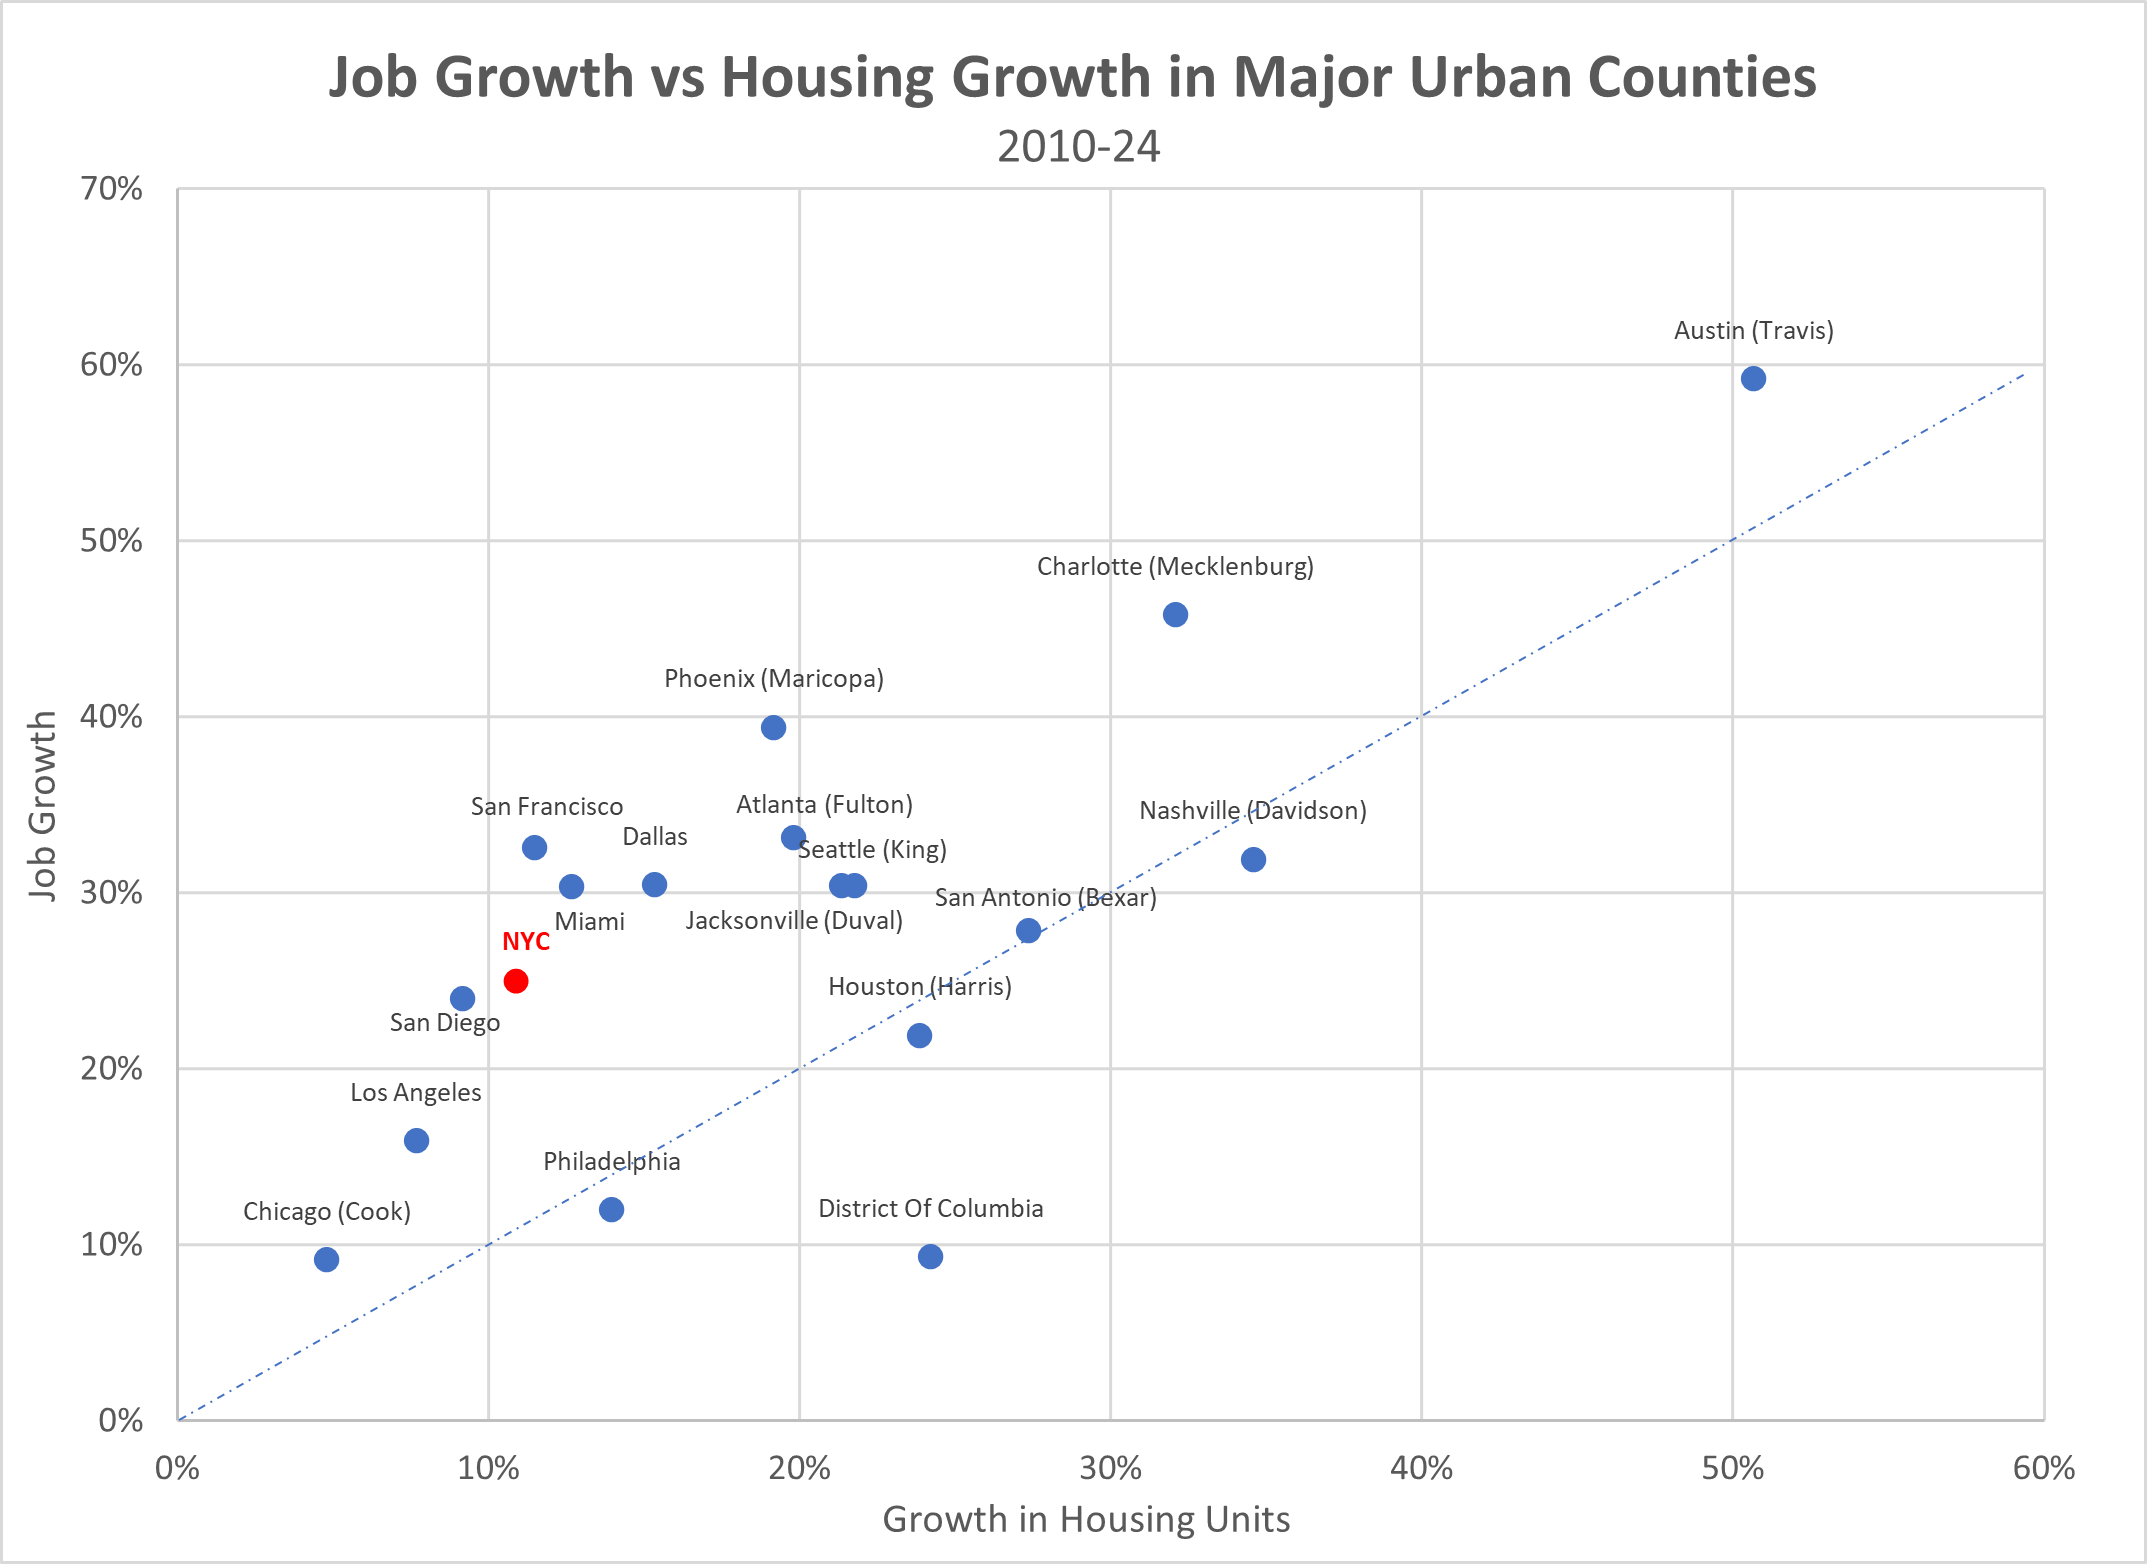
The linkage between expansion in the housing stock and job growth is apparent in Chart 6 below. In general, urban hubs that saw the largest expansion in the housing stock also tended to see the strongest job growth. While this does not prove causality, it is consistent with relative trends in home prices. Cities above the dashed line, such as Miami, Charlotte, San Diego, Phoenix, and, of course, New York—where housing supply growth has not kept up with job growth—have tended to see particularly steep escalation in home prices since 2010. This is because job growth tends to drive housing demand, and if housing demand is growing substantially faster than housing supply, that puts upward pressure on home prices and rents.
Chart 6
Sources: Sources U.S. Census Bureau, Population & Housing Unit Estimates (2010, 2024), U.S. Bureau of Labor Statistics (QCEW), Moody’s economy.com
Addressing the Housing Shortage: City vs Suburbs
Given that municipal boundaries usually don’t limit where people live, the shortage of housing in New York City, as well as in other large cities, could be alleviated by a significant expansion in the housing stock in the suburbs and surrounding areas, where there is considerably more open space and room for residential development. Yet, the past 15 years have seen quite the opposite. As shown in Chart 7 below, four of the city’s five boroughs have each added more to the metropolitan region’s housing stock than any of the surrounding 17 counties. In total, the city has added roughly 367,000 units, on net, while the rest of the region has added 271,000. This is particularly striking given that New York City includes about 300 square miles of land, while the rest of the metro area comprises over 4,300 square miles.
Chart 7
Source: U.S. Census Bureau Population & Housing Unit Estimates (2010, 2024),
The growth rate or percentage change in the housing stock can be a more useful metric than the net arithmetic increase shown above, when comparing different areas. But even in terms of the growth rate, New York City still out-performs the rest of the metropolitan region. With the notable exception of Hudson County, New Jersey (often characterized as NYC’s 6th borough), every single one of the surrounding counties has lagged New York City in the rate of growth of the housing supply, as shown in Chart 8 below. In total, while New York City’s housing stock has expanded by roughly 11%, the housing stock across the other 17 counties has increased by a paltry 6.6%; and without Hudson County, the increase is 5.6%, or roughly half the city’s pace.
Chart 8
Source: U.S. Census Bureau Population & Housing Unit Estimates (2010, 2024),
This phenomenon of a metro area’s housing supply growing faster in the core city than in the rest of the metro area is not at all unique to New York. In fact, in 10 of the 18 metro areas shown in Chart 9 below, the core city has expanded its housing stock faster than its surrounding area. Interestingly, those metro areas where the outlying areas have seen strong growth in the housing stock are largely those that have seen the briskest job growth.
Chart 9
Source: U.S. Census Bureau Population & Housing Unit Estimates (2010, 2023)
Note: 2023 was used here instead of 2024 due to data constraints for metro areas.
Where Is NYC headed?
As New York City faces not only a housing shortage but also new risks and challenges, it is important to point out some of the city’s unique attributes that have contributed to its resilience over the decades. Two closely related metrics on which New York stands out among cities across the U.S. are density and land values. A 2018 research paper that estimated the value of the land across U.S. central cities found that Manhattan topped the list and that land values were more than triple those of the 2nd ranked central city (Chicago). New York City’s extraordinarily high population density enables it to have an unparalleled array of amenities and a skilled and diverse labor force—what economists call economies of scale and scope. And it is these qualities that explain and support its high land values. Of course, high land values are a double-edged sword: on the one hand, they are a reflection of New York City’s success and desirability; on the other hand, they make it harder to build affordable housing without substantial government intervention.
Much of the foundation enabling New York’s high density involves infrastructure—an extensive water and sewage system, its numerous residential and commercial buildings, and, perhaps most importantly, its mass transit system, which manages more than 3 billion passenger trips in a year.
Taking a long view, New York City’s economy is a mature one, where capacity constraints such as housing, land, and congestion are more likely to hamper growth. The city’s infrastructure—specifically its extensive transit system and dense residential and commercial structures—have enabled its population and economy to expand to levels unmatched, at least in the U.S. While a number of older, more established cities—notably San Francisco, Boston, and Washington DC—have long faced similar capacity issues, a number of large, rapidly growing cities in the South have also begun to face these kind of constraints.
Currently, in New York City, due largely to the prevalence of remote work, commercial space and transit are not anywhere near full capacity and are thus not constraining growth; on the other hand, housing clearly is. In recognition of this need, steps are being taken to remove barriers and incentivize residential development across the city, in the form of both new construction and commercial-to-residential conversions. In addition, spurring more housing in the surrounding region would also go a long way to ease the shortage.
In order to enable New York City to grow and prosper, addressing the housing issue is critical, as is maintaining the quality-of-life issues that have bolstered demand for city living and doing business in the city. In recent Spotlight reports, we have highlighted risks associated with forthcoming federal cutbacks. In order to weather this figurative storm, it is important that the city maintain the strong demand it has seen thus far, while addressing the housing shortage to increase its capacity to grow its economy and tax base.
Acknowledgements
This report was prepared by Jason Bram, Director of Economic Research; Aliyah Sahqani, Economic Research Analyst; and Amber Born, Economic Development Research Analyst. Archer Hutchinson, Creative Director, and Addison Magrath, Graphic Designer led the design, with assistance from Angela Chen, Senior Website Developer Martina Carrington, Web Developer, and Cindy Zhao, College Aide-Web Developer.