
Introduction
In just a few years, the COVID-19 pandemic brought about an acceleration of remote work arrangements equivalent to 40 years of pre-pandemic growth.[1] The acceleration of economic obsolescence for a subset of office real estate assets was just as fast. So strong was the shock of doubling vacancy rates and value losses that some of the economic narrative gravitated toward the specter of a “doom loop” not dissimilar from the municipal fiscal crises of the 1970s.[2] Accordingly, few other topics have occupied the research agenda at the Office of the Comptroller quite like the economics of the office market and its fiscal implications (see the Spotlight reports of June 2022, August 2022, June 2023, and May 2024).
As leasing recovers and the worst fears dissipate, one key element to restore healthy economic fundamentals is the absorption of the excess supply of obsolete office space. This fiscal note presents an analysis of office-to-residential conversions in New York City.
Since 2020 many office buildings have started the process of converting to residential use, a trend that has accelerated after changes to the tax and land use codes were introduced in 2024. This fiscal note collects data on 44 completed, ongoing, and potential conversions as of the first quarter of 2025 totaling 15.2 million gross square feet. These conversions could absorb more than one third of the occupancy lost since the fourth quarter of 2019 in the lower tiers of the market, and produce approximately 17,400 apartments, the majority of which are studios and 1-bedrooms available for rent. Post-pandemic conversion activity already appears on track to exceed the totals subsidized by the 421-g program in the Financial District in the 1990’s and 2000’s, and to triple the production of residential units from commercial space seen in 2012-2020.[3]
The 467-m property tax exemption program enacted in 2024 is sustaining the wave of conversions, accelerating overall housing production, and providing access to income-restricted units in otherwise hard-to-reach neighborhoods. 467-m requires that 25% of the apartments be reserved for families earning on average 80% of the Area Median Income and be subject to rent stabilization in perpetuity. A total of 12.2 million gross square feet in Manhattan south of 59th Street containing 14,500 apartments, 3,600 of which would be income-restricted, could start renovation by the end of June 2026 and qualify for exemptions. In present value terms, the tax exemptions on these conversions (that is the amount of tax expenditure) are estimated to be worth $5.6 billion. Relative to counterfactuals where 467-m did not exist, over the life of the exemptions, our office estimates a $5.1 billion drop in property tax revenues on these conversions, in present value. More than 80% of the revenue drop is absorbed by the rent discounts on the income-restricted units.
The next section provides an overview of recent policy changes, data on the 44 conversions, and stylized financials. The following section focuses on estimating property taxes on conversion projects, tax expenditures, and the opportunity cost of the 467-m program.
The analysis is based on assumptions and economic conditions as of the first beginning of 2025. The economic outlook has since become more uncertain as shown in the April Economic Spotlight. Even though the likelihood of a recession appears to have receded since April, negotiations around trade agreements could still affect development activity negatively.
The Pipeline of Office-to-Residential Conversions in NYC
By many measures, the office market in New York City appears to be healing. The Partnership for New York City’s latest survey in March 2025 showed that office attendance had reached 76% of pre-pandemic conditions. Cell phone traffic data suggests that the percentage could be closer to 95% (see the May 2025 Economic Newsletter). Leasing activity has been healthy and availability rates (a leading indicator of vacancies) are declining to multi-year lows in 2025. However, almost all the improvement took place at the high end of the market—so-called 5-star properties, which account for about 10 percent of all office space. Across the rest of the market, both availability rates and vacancy rates have remained elevated.
Chart 1 below shows that occupied space in 5-star buildings grew by approximately 11.5 million square feet while it declined by 43 million square feet in the rest of the market.
Given the excess supply of economically obsolete space, interest has grown for its adaptive reuse. The City formed a task force to study the issue, opened an accelerator, and recently lifted some land use constraints for the conversion to residential use. In 2024, State legislators created 467-m, a new exemption from the City’s property tax for office-to-rental conversions if 25% of the apartments are income-restricted.
Several prominent conversions have already begun in both the Financial District and Midtown, with several news reports and industry publications indicating a strong pipeline of projects. In its 2024 investor conference presentation, SL Green estimated that 45 office buildings (18.7 million square feet, 19,592 residential units) could take advantage of 467-m. In New York City, the Vanbarton Group and Metro Loft appear to be the most active developers. On the capital front, Dune Real Estate Partners and TF Cornerstone announced a $1 billion fund to acquire assets for conversion. Even without a significant increase in office space demand over the next several years, the combination of few new office building projects[4] and an increase in residential conversions in the remainder of the market should set the New York City office market up for a slow, but likely, recovery. For instance, before choosing to relocate from 150 William Street to 110 William Street, the City’s Administration for Children’s Services considered 7 other locations. Of the 7 office buildings, four are being converted (25 Water Street, 110 Maiden Lane, 111 Wall Street and 222 Broadway).[5] Once vacated, 150 William Street may itself be converted to residential use.
Chart 1. Change in Occupied Manhattan Office Space 2019 Q4 – 2025 Q1
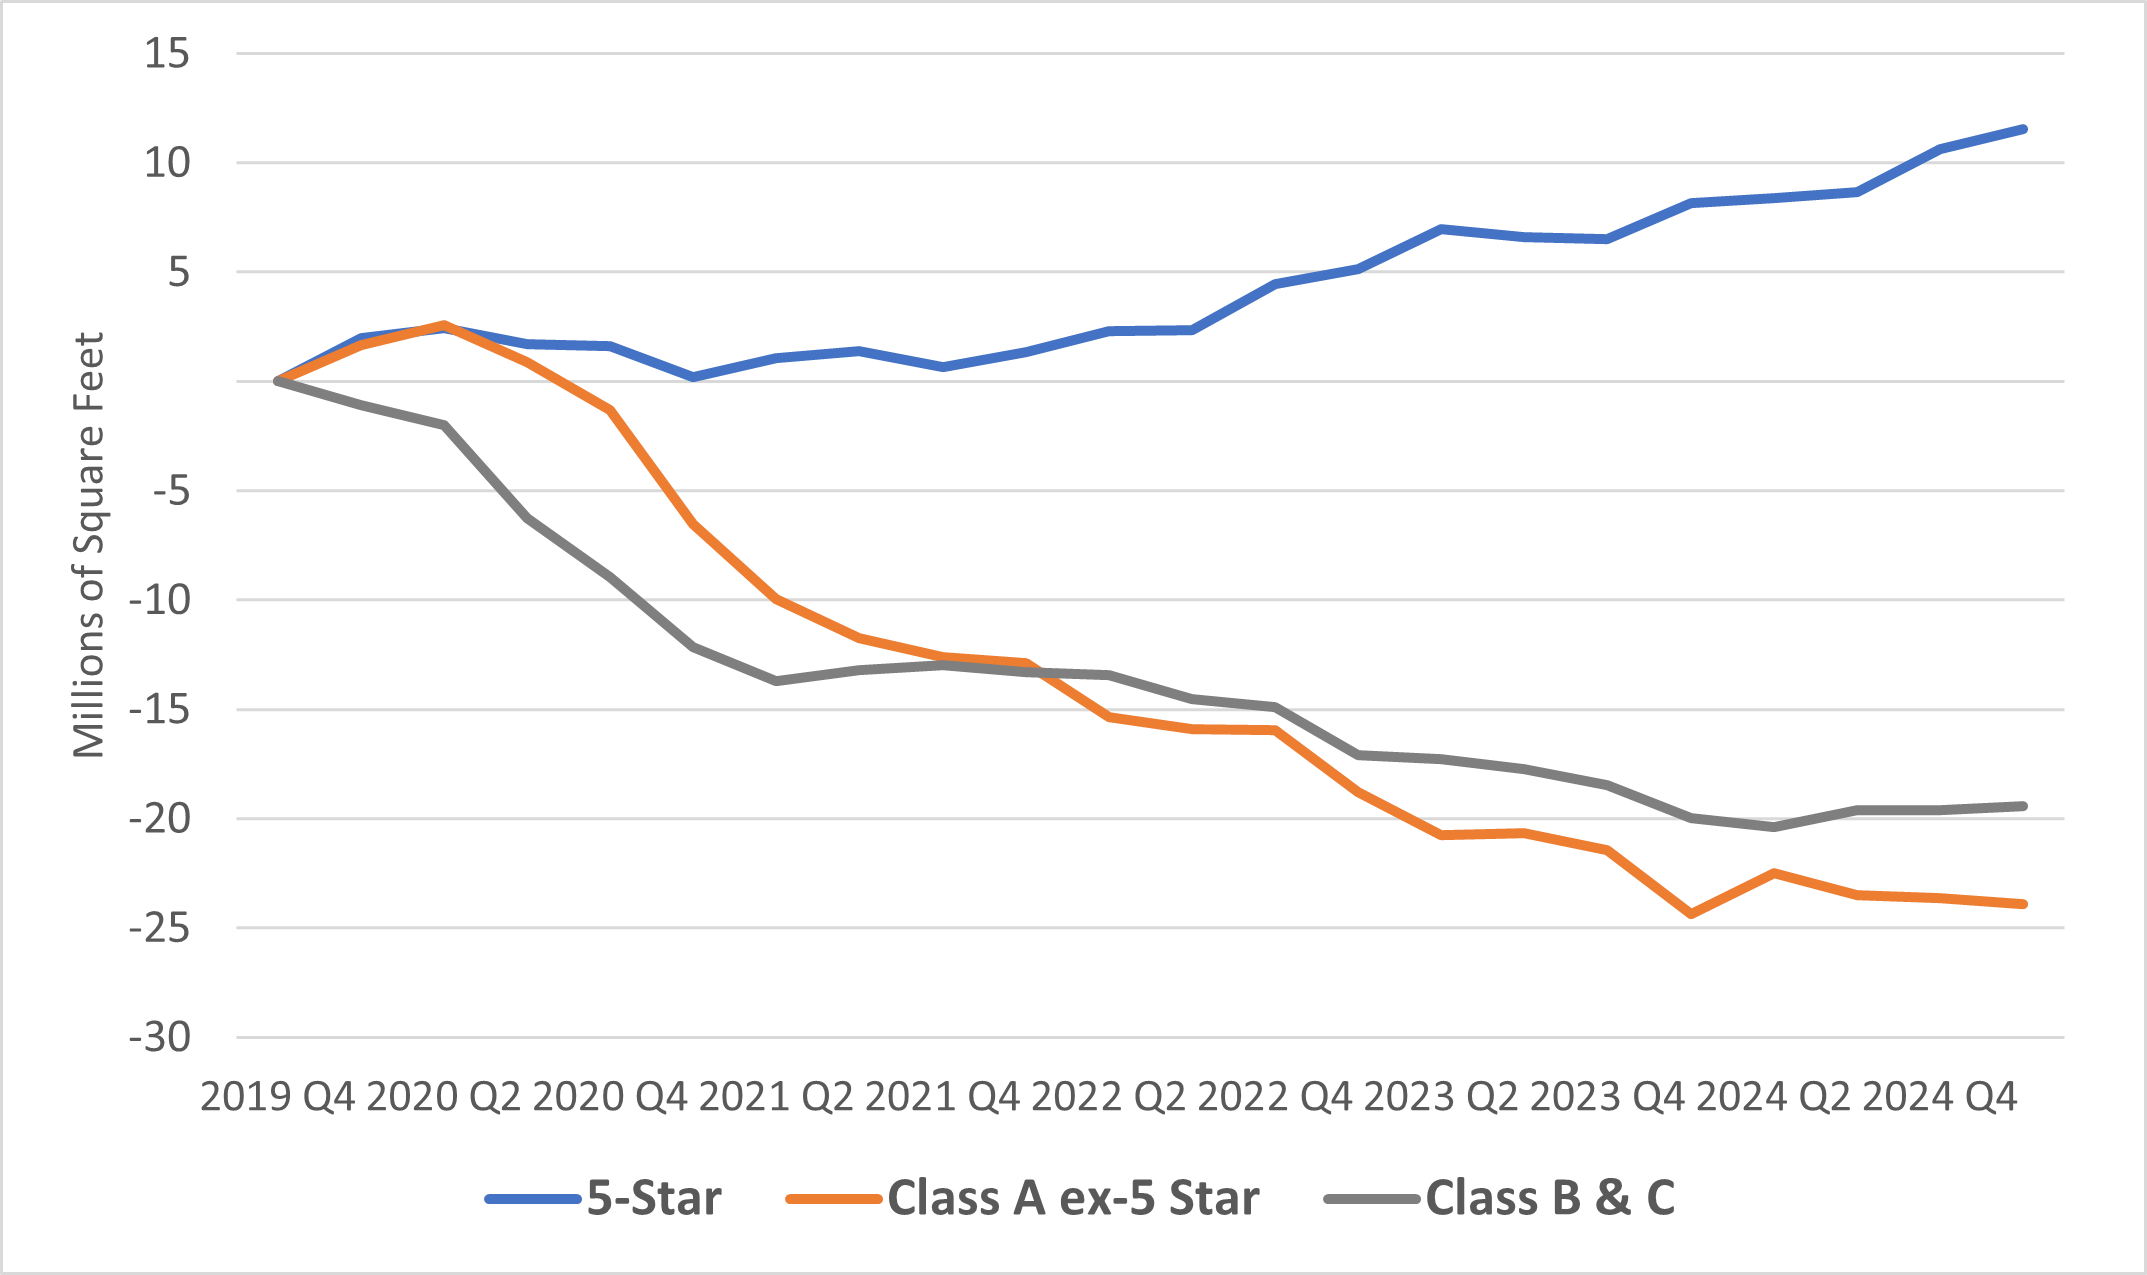
Source: CoStar.
The Affordable Housing from Commercial Conversions (467-m) Program
Office-to-rental residential conversions can be eligible for exemptions from the City’s property tax through the Affordable Housing from Commercial Conversions (AHCC) program (section 467-m of the New York State Real Property Tax Law). The tax exemption was legislated as part of the New York State Fiscal Year (FY) 2025 budget and was enacted in May 2024.[6] Final rules promulgated by the NYC Department of Housing Preservation and Development (HPD) went into effect in January 2025.
The 467-m program is available for the conversion of non-residential buildings,[7] with the exception of hotels[8] and other Class B multiple dwellings. At least 50% of the completed building area must be from the pre-existing building. The program exempts from the property tax for up to three years during the construction period and for between 25 and 35 years afterwards, depending on the date of the building permit. The program is available Citywide but provides deeper exemptions in Manhattan south of 96th Street (the “Manhattan Prime Development Area” or MPDA). Conversions need to be completed by the end of 2039. Table 1 summarizes the key tax provisions of the 467-m program. More details are available on HPD’s website.
To qualify for the tax benefits, at least 25% of the units must be income-restricted and satisfy the following requirements:
- At least 5% of the units are restricted at 40% of the Area Median Income (AMI).
- The average AMI restriction does not exceed 80% of AMI.
- There cannot be more than three AMI categories, and none can exceed 100% of AMI.
- The unit mix is proportional to that of the market units. Alternatively, at least half of the income-restricted units must have 2+ bedrooms, and no more than 25% can be studios.
- The units are subject to rent stabilization in perpetuity (e.g., beyond the end of the tax exemptions).
Table 1 Key Tax Provisions of the 467-m Program
| Program Phase Based on Start Date | Exemption Percentage | ||||
|---|---|---|---|---|---|
| 1: Jan 2023 to June 2026 | 2: July 2026 to June 2028 | 3: July 2028 to June 2031 | MPDA | Elsewhere | |
| Construction | Up to 3 years | 100% | |||
| Full benefits | 30 years | 25 years | 20 years | 90% | 65% |
| Phase out | 5 years | 80% to 40% | 50% to 10% | ||
Source: NYC HPD https://www.nyc.gov/assets/hpd/downloads/excel/467-m-benefit-schedule.xlsx.
Notes: the start date is generally the issuance of an alteration building permit (the permit types are ALT-CO – New building with existing elements to remain, Alteration CO, or Alteration Type 1). Tax benefits during the construction period are applied retroactively once the project is deemed eligible by HPD. Commercial, community facility, and non-residential space receive tax benefits if they do not constitute more than 12% of the total floor area after conversion. Non-residential and ineligible floor area includes all non-residential space and residential accessory space that is not required to obtain a certificate of occupancy for a Class A multiple dwelling (e.g., lobby, circulation, egress, and others). Specific guidance should conform to that of other tax exemption programs (see for instance the definitions for the 421-a program). The excess of non-residential and ineligible area above 12% reduces 467-m exemptions by the same percentage. Developers are expected to separate the building into condominium units to avoid a reduction in tax benefits.
Two things are noteworthy in the program design. First is the longer exemption schedules for earlier start dates (indexed as program phases 1 through 3). This provides an incentive to move quickly that is valuable to developers because the income-restricted units are subject to stabilization in perpetuity. From a public policy perspective, it is also valuable to accelerate the absorption of empty office space and to increase housing supply.
The second is that tax benefits have the same structure within the Manhattan Prime Development Area regardless of whether conversions were already feasible without tax incentives, such as in Lower Manhattan (which in this analysis is defined as the Financial District and Tribeca). In these areas, the 467-m program is effectively purchasing income-restricted units at the cost of the property tax that would have been paid by a fully market rate development. This is not necessarily the case elsewhere in Manhattan, where property values have not yet fallen to the levels seen in Lower Manhattan and 467-m exemptions are more likely to be pivotal in making the financials work (these points are discussed in more detail below).
Finally, it should be noted that tax benefits are available retroactively to projects that started since January 2023. Two such project qualified for 467-m exemptions: 25 Water Street (which is analyzed as a case study in the property tax section) and 55 Broad Street.
Recent Changes to Land Use
In December 2024, the New York City Council approved “City of Yes for Housing Opportunity,” an amendment to the Zoning Resolution. Among other provisions, the amendment eases restrictions for the conversion of non-residential buildings into housing.
Conversions can take place in zoning districts that allow residential use. Before the passage of the City of Yes amendment, conversions were relatively easier for buildings that met certain criteria. In general, buildings had to be in Manhattan south of 59th Street and parts of Brooklyn and Queens and be built before December 1961. The threshold was January 1977 in the Financial District and a few other areas, and January 1997 in special mixed-use districts. The new zoning amendment allows for conversion of buildings built before 1991 and relaxes other requirements as well.
In addition to enacting the 467-m program, the State FY 2024 budget legislation lifted the 12 Floor Area Ratio (FAR) cap imposed by the Multiple Dwelling Law on buildings built before 1968, if certain conditions are met. One such condition is that the residential building includes income-restricted units in a measure “equivalent or exceeding” the requirements of the City’s Mandatory Inclusionary Housing program. However, if the building is part of a General Project Plan (GPP) adopted by the NYS Urban Development Corporation, it is necessary that 25% of the housing units is, on average, restricted to families at 80% of AMI. This is exactly the eligibility requirement for 467-m tax benefits. The provision has already been used for the conversion of 5 Times Square (discussed in more detail in the appendix), a building with 33.4 FAR that is part of the GPP for the 1981 42nd Street Land Use Improvement Project.
The Conversion Pipeline
An early wave of office-to-residential conversions in New York City was spurred by the 421-g tax exemption program in lower Manhattan, aided by federally subsidized financing available in the aftermath of the 9/11 terrorist attacks. These projects were undertaken between 1995 and 2006 and converted 13 million square feet or 13% of the office space in the submarket. The 421-g conversions created approximately 12,900 apartments.[9] Following that period, there have been occasional conversions, mainly in the Financial District including 20 Broad Street, 180 Water Street, 70 Pine Street, and 1 Wall Street.
Table 2 shows that the post-pandemic pipeline of office-to-residential conversions through March 2025 could total 15.3 million gross square feet (gsf) in 44 buildings and produce 17,400 residential units. Detailed information on the pipeline can be found in Table A1 in the Appendix. Most of the square footage (14.7 million) is in Manhattan, and most of it is converted to rental use. Because the rentable square footage of office buildings often exceeds gross square footage, these conversions could remove between 15 and 16 million rentable square feet of office supply in Manhattan. Chart 1 showed that, excluding 5-star buildings, occupancy in Manhattan offices dropped by 43 million square feet between the last quarter of 2019 and the first quarter of 2025. Therefore, conversions to residential could absorb more than one-third of the loss. These estimates appear to be broadly consistent with those recently published by the real estate firm CBRE.[10] There are 16,400 apartments in the pipeline of office conversions in Manhattan, including both rentals and condominiums. This total is just shy of the borough’s new buildings pipeline of 17,600 units as of the end of 2024.
Finally, 12.2 million gross square feet in Manhattan may be eligible for 467-m exemptions in the first phase of the program for a potential of nearly 14,500 units (3,600 of which income-restricted). Data from completed conversions indicates that the unit mix is heavily skewed toward smaller apartments, particularly studios. For instance, studios make up 49% of the units at 55 Broad Street, 72% at 25 Water Street, and 84% at 5 Times Square. This shows that the alternative unit mix required for 467-m eligibility (where more than 50% of income-restricted units must be two bedrooms or larger, and no more than 25% can be studios) is not used, as a practical matter.
In general, conversions to condominiums take place in smaller buildings and the unit size is larger.
Table 2. Summary Data on Office Conversions Since 2020
| Aggregate | Units | Gross Square Feet (gsf, in millions) | Number of Buildings | Average gsf per building |
|---|---|---|---|---|
| Rentals: | 16,510 | 13.5 | 32 | 421,400 |
| Lower Manhattan | 9,297 | 7.8 | 14 | 557,900 |
| Midtown East | 4,153 | 3.4 | 8 | 425,600 |
| Rest of Manhattan* | 2,115 | 1.9 | 8 | 237,400 |
| Brooklyn** | 945 | 0.4 | 2 | 184,500 |
| Condominiums | 922 | 1.8 | 12 | 145,900 |
| Total | 17,432 | 15.2 | 44 | 346,200 |
| Potentially eligible for 467-m | 15,414 | 12.6 | 27 | 466,300 |
Source: Office of the NYC Comptroller analysis.
*Average square footage biased downward by partial conversions and buildings that will undergo expansion.
**Number of units biased upward by a building that will undergo expansion as part of the conversion to residential. See Table A1 in the Appendix for details.
More recent rumored conversions to rental not included in the totals are 300 East 42nd Street and 6 East 43rd Street which, combined, could add approximately 500,000 gross square feet and 600 apartments to the total (see details in the appendix). Both could be eligible for 467-m.
Conversion vs. New Construction Activity
Concurrently with the creation of 467-m, the State legislature enacted the Affordable Neighborhoods for New Yorkers (ANNY) program to incentivize new residential construction (section 485-x of the New York State Real Property Tax Law).[11] Final rules were promulgated at the same time as 467-m’s.
The 485-x program is more complex compared to 467-m, with options and labor requirements varying by geography and building size. The first data on 485-x published in May shows a much smaller pipeline than 467-m’s (2,603 units of which 540 income-restricted), none in the “large and very large project” category (100 units or more), and with only a minimal fraction in Manhattan. Larger developments are being explored at 100 Gold Street, and on the Western Rail Yard at Hudson Yards. These projects (along with the proposed tower at 395 Flatbush Avenue in Downtown Brooklyn) are expected to access the 485-x tax benefits, but are also located on City-owned land or require additional financial assistance.
At least two factors complicate the comparison between the 467-m and 485-x. First, in the short term, there is likely more square footage ready for conversion than new construction opportunities. Second, new construction is still working through the spike in building permits in 2022 to take advantage of 485-x’s predecessor (421-a Affordable New York program) (see Chart 3 of this Office’s Comments on New York City’s Preliminary FY 2026 Budget), while some of the 467-m projects were planned before the program was enacted. Nonetheless, 467-m appears to be playing a unique role in unlocking the production of a significant number of rental units—both market-rate and income-restricted—in Manhattan. It is possible that the additional restrictions imposed by 485-x on large rental projects are a contributing factor.[12] But it is also true that development opportunities for large rental buildings are scarce in Manhattan. Even in 485-x’s predecessor (the 421-a Affordable New York program) only a handful of large projects originally conceived as 80/20 developments contributed most of the units south of 96th Street.[13]
Sale Prices Before and After the Pandemic
The decline in demand for office space has driven substantial value loss among the buildings in the pipeline. Table 3 compiles available transaction data for conversions to rental before and since 2020 (not all buildings transacted and not all of them transacted more than once). The table reports individual building data and the average price of all transactions weighted by gross square footage without adjusting for the timing of the transactions, building quality, and financial conditions. The data show that the post-pandemic price is $276 per gross square foot, 45% lower than before 2020. Buildings are less valuable in Lower Manhattan ($218) than elsewhere in Manhattan ($316). The prices appear to be broadly consistent with the financial feasibility analysis shown below, as well as with Department of Finance’s (DOF) property tax valuations.
Table 3. Rental Conversions
| Address | Pre-2020 | $ per gsf | Post-2020 | $ per gsf | % Ch. |
|---|---|---|---|---|---|
| 2 Wall St. | 10/16/24 | $144 | |||
| 25 Water St. | 6/28/12 | $259 | 12/28/22 | $240 | -7% |
| 55 Broad St. | 8/4/23 | $425 | |||
| 61 Broadway | 6/6/14 | $507 | |||
| 77 Water St. | 12/12/24 | $176 | |||
| 85 Broad St. | 6/2/17 | $647 | |||
| 100 Wall St. | 8/12/15 | $582 | 7/29/24 | $250 | -57% |
| 101 Greenwich St. | 7/31/13 | $350 | Reported | $250 | -29% |
| 110 Maiden Ln. | 9/6/24 | $145 | |||
| 111 Wall St.* | 1/16/20 & 6/23/21 | $399 | |||
| 175 Pearl St. | 4/6/17 | $556 | 6/4/24 | $360 | -35% |
| 160 Water St. | 4/30/14 | $314 | |||
| 180 Water St. | 7/26/13 | $309 | |||
| 219-229 E 42nd St. | 7/13/18 | $380 | 8/26/24 & 2/19/25 | $206 | -46% |
| 222 Broadway | 9/8/14 | $664 | 4/25/24 | $195 | -71% |
| 345 7th Ave.** | 1/16/25 | $348 | |||
| 650 1st Ave. | 3/27/23 | $298 | |||
| 675 3rd Ave. | Reported | $346 | |||
| 750 3rd Ave. | 8/4/04 | $335 | Valued | $394 | 18% |
| 767 3rd Ave. | 1/15/25 | $307 | |||
| 830 3rd Ave. | 9/30/22 | $478 | |||
| 1011 1st Ave. | Reported | $251 | |||
| 1740 Broadway | 12/24/14 | $1,156 | 4/24/24 | $358 | -69% |
| Weighted Average | $500 | $276 | -45% |
Source: Office of the NYC Comptroller analysis of news reports and administrative data.
Notes: Red denotes estimated value based on news reports. The transaction date is the date the deed was recorded. Weights are the building’s gross square footage in DOF’s data. * 111 Wall St. is excluded from the weighted average because it was purchased to be renovated as office building. The building has now filed permits for conversion and, at the time of writing, is looking for an $850 million construction loan. ** 345 7th Avenue is part of a four-parcel transaction which also transacted in September 2021 for $510 per gross square foot (the 2025 transaction in the table represents a 32% price decline from 2021). 300 East 42nd Street (not included in the analysis) recently transacted for $52 million, a 58% discount from the 2019 sale price of $122.5 million.
Table 4 collects transaction data for conversions to residential condominium. The sample is smaller and there are only two pre-2020 transactions. The important takeaway from this table is that, on average, office buildings that convert to residential condominium trade at more than twice the price of rental conversions ($591 vs. $276 per gsf). As land values increase, condominiums appear to be the feasible development alternative without incentives.
Table 4. Condominium Conversions
| Address | Pre-2020 | Price per gsf | Post-2020 | Price per gsf | % Change |
|---|---|---|---|---|---|
| 79 Madison Ave. | Reported | $579 | |||
| 89 Madison Ave. | 6/14/2024 | $445 | |||
| 101 Franklin St. | 12/5/19 | $1,017 | 6/27/2024 | $478 | -53% |
| 115 7th Ave. | 12/29/14 | $1,345 | 1/4/2024 | $507 | -62% |
| 175 5th Ave. | 5/23/2023 | $880 | |||
| 245 W 55th St. | 6/8/2023 | $449 | |||
| 419 Park Ave. South | 8/19/2024 | $451 | |||
| 609 5th Ave. | 6/6/2022 | $825 | |||
| Weighted Average | $1,074 | $591 | -45% |
Source: Office of the NYC Comptroller analysis of news reports and administrative data.
Notes: Red denotes estimated value based on news reports. The transaction date is the date the deed was recorded except for 609 5th Avenue which was taken from SL Green’s press release. 655 Madison Avenue, which is slated for demolition and ground-up development, traded in October 2024 for $159 million ($804 per gsf). This building is likely going to be a condominium given the small number of units (62) and the high acquisition price.
Stylized Financial Analysis of 467-m
The stylized financial analysis is based on a simplified model with assumptions derived from industry and market data for conversions in Manhattan south of 59th Street. The model shows to what extent the 467-m exemptions pay for rent discounts on income-restricted units, and to what extent they increase land values (and/or developers’ returns). The estimates serve to illustrate a general principle rather than to precisely reflect the economics of individual projects. The model’s values are summarized in Table 5 and explained below.
Conversion costs. The conversion cost (excluding site acquisition but including financing) is $500 per gross square foot.
Income. While office buildings collect rent on the entire gross square footage of a building (and even in excess of it),[14] residential buildings do not. Conversion projects appear to be able to preserve rentable square footage by adding floors (see for instance 160 Water Street, 219-229 East 42nd Street, and 25 Water Street), reducing apartment sizes, and marketing windowless spaces as home offices, even when the innermost areas of the buildings are not usable. For this reason, the analysis assumes that the rentable-to-gross square feet ratio is 75%, slightly more than the roughly 70-72% that is common for residential projects.
The assumed distribution of units is 56% studios, 32% 1-bedrooms, and 12% 2-bedrooms based on averaging available project-specific data.[15] This results in an average market rent of $105 per rentable square foot and $79 per gross square foot ($105 times the 75% ratio of rentable-to-gross square feet). Using the assumption on the unit mix and the 2025 Affordable Monthly Rents at 80% of AMI, this results in average income-restricted rent per rentable square foot of $42 ($32 per gross square foot).[16]
The assumed vacancy rate on market-rate units is 5%, a conservative assumption if compared to the lower level seen in recent market reports and rates at 20 Broad Street and 180 Water Street. The financials have no vacancy allowance for income-restricted units.
These assumptions result in income per gross square foot net of assumed vacancy of $75 in fully market-rate converted buildings and $64 in 467-m buildings. The income loss from the restricted units is $11 per gross square foot (14% of full market-rate gross income).
Expenses. Operating expenses excluding property tax are assumed to be $18 per rentable square foot ($14 per gross square foot).
Unabated property taxes are assumed to be 28% of gross income, resulting in $21 per gross square foot in market-rate buildings and $2 per gross square foot in 467-m buildings (using the schedule for the Manhattan Prime Development Area). The difference in property tax per gross square foot due to 467-m is $19, exceeding the income loss by a little more than $8 or 44% of the property tax reduction.
“Land” values. The implicit site acquisition cost per gross square foot (the residual “land” value) is calculated in two ways. The first uses a Yield on Cost calculation where net operating income clears a hurdle rate of 6.5% of renovation and acquisition cost. Land value is derived by solving the following equation: . This results in an acquisition value per gross square foot of $122 in market-rate buildings. Because, as shown above, the 467-m exemption exceeds the value of the rent discount on income-restricted units, the residual land value is $250 per gross square foot in 467-m buildings.
In the net present value calculation, it is assumed that the building is sold at stabilization using a cap rate of 5.0%. The discount rate used in the NPV calculation is 7.5%. Market-rate buildings pay taxes during construction while 467-m buildings are reimbursed for it. This results in acquisition values of $168 per gross square foot for market-rate buildings and $319 per gross square foot for 467-m buildings.
Table 5. Financials With and Without 467-m ($ per gross square foot)
| Without 467-m | With 467-m | Difference | % difference | |
|---|---|---|---|---|
| Renovation cost | $500 | $500 | $0 | 0% |
| Gross Income | $75 | $64 | ($11) | -14% |
| Operating expenses | $14 | $14 | $0 | 0% |
| Property tax | $21 | $2 | ($19) | -91% |
| Net Operating Income | $40 | $49 | $8 | 21% |
| Residual (“land”) value | ||||
| Yield on Cost | $122 | $250 | $128 | 106% |
| Net Present Value | $168 | $319 | $151 | 90% |
Source: Office of the NYC Comptroller analysis.
Notes: all values are per gross square foot. See discussion in the body of the fiscal note for an explanation of the assumptions. For simplicity, the analysis assumes no income from commercial and accessory use space.
Discussion. 467-m affects the universe of financially feasible conversions by increasing the range of office values, which do not have to fall quite as much as they did in the Financial District. The net outcome is an acceleration and possibly an expansion of housing supply in general and an expansion of the supply of income-restricted units, particularly in Manhattan. Of course, this also means that in areas such as the Financial District, where market-rate conversions were taking place without incentives, 467-m may only be pivotal for the production of income-restricted units. More in general, based on transaction prices, known pipeline, financials, and the passage of 467-m, the outlook for conversions in New York City appears stronger and more sustained than expected by earlier analyses[17] and already stronger than the wave receiving 421-g incentives.
Case Study: 750 3rd Avenue
In 2023, 8 buildings on a stretch of 3rd Avenue were singled out in an “office apocalypse” analysis. But in 2024 and again in 2025, 3rd Avenue was also featured for the return of renovation activity (though less exuberantly than before the pandemic). With 3.4 million gross square feet, most of which are on 3rd Avenue, Midtown East is also the second largest submarket for conversions. The property that is farther along is 750 3rd Avenue, which provides a case study for the assumptions in Table 5.
Based on information provided at the SL Green 2024 investor conference, this building will have 639 units with 563,940 rentable square feet. 59% of the units at 750 3rd Avenue are studios or junior 1-bedrooms. The rentable square footage includes a gym, a “membership club”, storage space and other accessory uses. DOF records indicate gross square footage of 761,384, which implies a gross-to-rentable reduction of 26%.[18] The project is expected to receive a temporary certificate of occupancy in the second quarter of 2028.
The remainder of the development budget is $430 million, and financing costs are $75 million, for a total conversion cost per gross square foot of $663. The high cost is driven by the removal of a portion of the façade and the addition of square footage in the back of the building. Expectations for net operating income are $47.5 to $50.0 million, higher than the cash rent collected as of the fourth quarter of 2019 ($46.2 million) when the building was 91.2% occupied as office and rent on available space was $70 per rentable square foot. The project’s income is boosted by accessory uses: the gym and “membership club” are expected to generate annual rent of $11-13 million.
Residential market rents are expected to range between $90 and $113 per square foot, while the range of income-restricted rents (based on 2024 AMI data) is $25-$45. Operating expenses (inclusive of residual property tax after the 467-m exemption) range between $18 and $22 per rentable square foot ($13-$16 per gross square foot). The yield at stabilization is 6.5% to 6.8%. The residual cap rate is 4.5% to 5.0%. Overall, these data are in line with the assumptions in Table 5.
SL Green purchased the building in 2004 for $255 million ($335 per gross square foot). The budget for the project indicates that the company is paying itself a “land contribution and site possession” of $300 million ($394 per gross square foot). The financial model in Table 5 suggests that the property’s residual value could have been between $98 million and $115 million lower without the 467-m exemption.
Property Tax Estimates
This section provides a first estimate of the potential cost of the 467-m exemptions, both in terms of tax expenditures (the tax value of the exemptions) and opportunity cost (the forgone property tax relative to a counterfactual). The analysis first establishes a baseline for tax assessments and the opportunity cost, and then proceeds to set the assumptions for the property tax projections.
The property tax estimates are based on a sample matching DOF market values to the properties in table A1. After excluding those that have already started conversion and making the adjustments listed in the appendix, the sample contains 9.9 million gross square feet. All buildings are in Manhattan south of 59th Street.
Chart 2. DOF Market Value per Gross Square Foot in the Sample
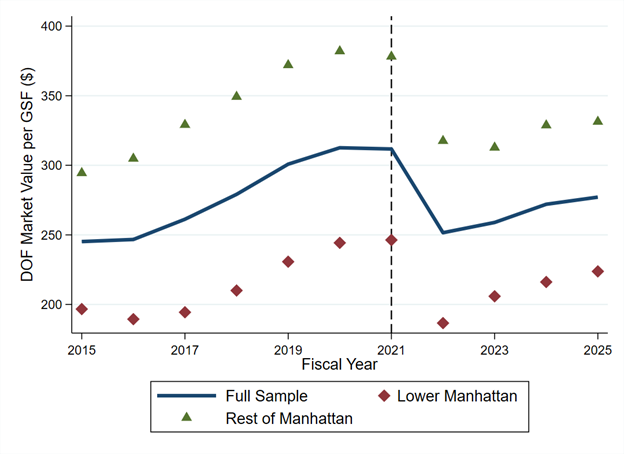
Source: NYC DOF, Office of the NYC Comptroller analysis.
The analysis necessarily touches upon two common intuitions regarding office space that are, in general, erroneous. The first is that tax assessments of to-be-converted buildings are trending downward. The second is that conversions to residential will increase property tax revenues.
On the first point, the data show that tax assessments are lower than before the pandemic but they have rebounded from the initial pandemic-related drop and are growing at a moderate pace, even for buildings that are mostly or fully vacant and are slated for conversion. The second point is discussed in the next subsection.
Chart 2 shows DOF market values per gross square foot citywide and by geography. The vertical line in FY 2021 represents the last assessment before the pandemic (January 2020, in effect in FY 2021). The Chart shows a relatively steady increase in values through FY 2021 and a sharp drop in FY 2022. But instead of deteriorating further, DOF values have partially recovered and stabilized since. The average DOF value per gross square foot in the FY 2025 assessment roll was $277 in the full sample (vs. $312 in FY 2021, or -11%). Similar to transaction values shown above, DOF values per gross square foot are lower for buildings located in Lower Manhattan ($223) than elsewhere ($331).
To analyze pre- and post-conversion tax assessments, the analysis turns to a case study. Qualitatively, the main result is that assessments are higher for residential than for office use. However, the 467-m exemptions will lower the amount of property taxes levied below what is collected before conversion (unless the buildings are already otherwise exempted).
Case Study: 160 and 180 Water Street
160 and 180 Water Street are adjacent buildings that were converted by the same developer at different times (in 2024 and 2017, respectively). This case study is helpful to understand Department of Finance valuations for otherwise comparable buildings. In the tentative FY 2026 assessment roll, 180 Water Street had a DOF value of $355 per gross square foot while 160 Water Street had value of $343 per gross square foot. As an additional point of reference, 20 Broad Street (converted in 2018) has a DOF market value of $387 per gross square foot.
Chart 3 fixes the conversion time (time zero) to the year before the building changes classification from office to residential in DOF tax records. DOF’s market value is normalized to 100 at time zero (FY 2024 for 160 Water Street and FY 2017 for 180 Water Street).
There are two takeaways from the chart:
- DOF market value is significantly higher post-conversion, but it takes some time to stabilize. Values from time -1 to time +1 can be reflective of assessments during construction.
- The increase in post-conversion market value is higher for recent conversions due to lower post-pandemic office valuations. The DOF market value for 160 Water Street at time +2 is 2.4 times the value at time zero and it is likely estimated based on full completion (but not yet on income produced).[19] The DOF market value jump for 180 Water Street is 1.5 – 1.7, depending on whether the measurement is taken from time -1 or time zero, respectively.
Chart 3. DOF Market Value Relative to Conversion Date: 160 and 180 Water Street
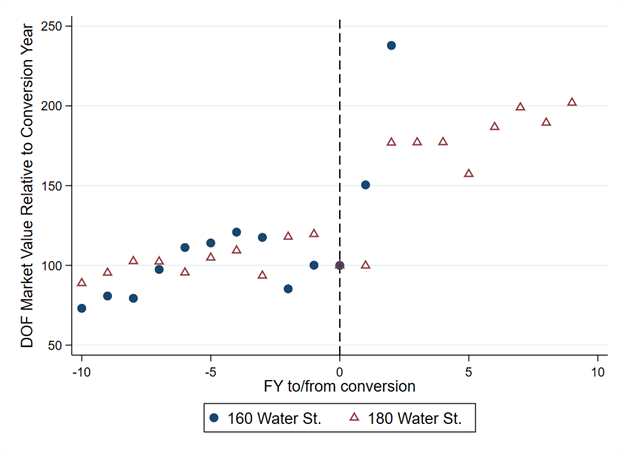
Source: NYC DOF, Office of the NYC Comptroller analysis.
The Opportunity Cost of 467-m: A Definition
Fundamentally, 467-m expands the universe of potential conversions by increasing the range of valuations at which the projects are financially feasible. There are at least two ways to analyze the property tax implications. The first is to estimate the value of the tax expenditure: the full tax on a building receiving 467-m minus the tax paid after the exemption is applied. The second is to estimate the opportunity cost, which in this fiscal note is defined (rather narrowly) as the property tax that would have been paid in a counterfactual scenario where 467-m did not exist. Both calculations require making assumptions over a horizon of almost four decades and are, therefore, inherently illustrative.
While calculating the value of tax expenditures is relatively straightforward, estimating the opportunity cost would benefit from a structured empirical framework applied to historical data. This fiscal note considers two scenarios: one for Lower Manhattan and one for the rest of Manhattan South of 59th Street. In Lower Manhattan, conversion projects are applying for 467-m retroactively and property values are already at or close to those of Table 5. Therefore, the counterfactual scenario assumes that conversions would have been undertaken without tax exemptions. In this scenario, 467-m is purchasing rent-restricted units in a submarket that would otherwise be difficult to reach. But the opportunity cost of the rent-restricted units is not the value of the tax expenditure. It is instead the foregone property tax on a fully market-rate building. It is plausible that 467-m pulled future conversions forward, particularly because the tax benefits are longer for the first applicants. However, this effect would likely be of secondary importance for the fiscal estimates and was not modeled.
On the other hand, if conversions would not take place but for 467-m, then the opportunity cost is defined as the property tax of the building as an office. This is more likely to be the case outside of Lower Manhattan, as suggested by the analysis further below. Different modeling choices are of course possible. For instance, the value of office buildings could continue to decline until conversions are feasible without tax incentives. In this case, 467-m would accelerate conversions but essentially remain a way to purchase income-restricted units. Alternatively, the lack of a robust pipeline of new office buildings could make renovations increasingly attractive as the employment base keeps expanding. In this case, the property tax paid on office properties could grow at a faster pace. Buildings could also opt for a commercial use that is not office. Absent a full equilibrium model for the City’s economy, these alternatives add complexity rather than precision.
It is also possible that 467-m could, at the margin, trigger conversions to rental that would otherwise have been condominiums. However, the data suggest that conversions to condominiums involve smaller buildings that trade, on average, at a price that make the choice of rental conversion not feasible even with 467-m.
It is certainly plausible that not all conversions in Lower Manhattan would have taken place without 467-m and, at the same time, that some conversions in the rest of Manhattan would have been completed without tax incentives. As such, the opportunity cost estimates should be interpreted as broad benchmarks. Their empirical support is presented in the next two case studies. It may also be worth noting explicitly that this is not a full cost-benefit analysis, which would have to consider the effect of relaxing housing supply constraints on economic and tax revenue growth, as well as externalities from the creation of mixed-use and mixed-income neighborhoods.
Case Study: The Opportunity Cost of 25 Water Street
At 1,320 apartments, the conversion at 25 Water Street is one of the largest. Leasing has recently started and construction is expected to be completed this November. The building sold for approximately $251 million in December 2022 ($240 per post-conversion gross square foot).[20] In the same month, the project secured a $536 million construction loan. The lottery for income-restricted units indicates that, of the 330 income-restricted units, 238 (72%) are studios, 73 (22%) are one-bedroom, and the remaining 19 (6%) are 2-3 bedrooms.
Construction at 25 Water Street started in 2023, making the project eligible retroactively for 467-m benefits. Because the economic feasibility of this project was established well before the passage of 467-m, 25 Water Street plainly proves that the tax benefits exceed the rent discounts on income-restricted units. The opportunity cost of 25 Water Street is the amount of taxes that would have been collected had the converted building not been eligible for 467-m exemptions. The same can be said about 55 Broad Street, a converted building that is also receiving the 467-m exemption retroactively.
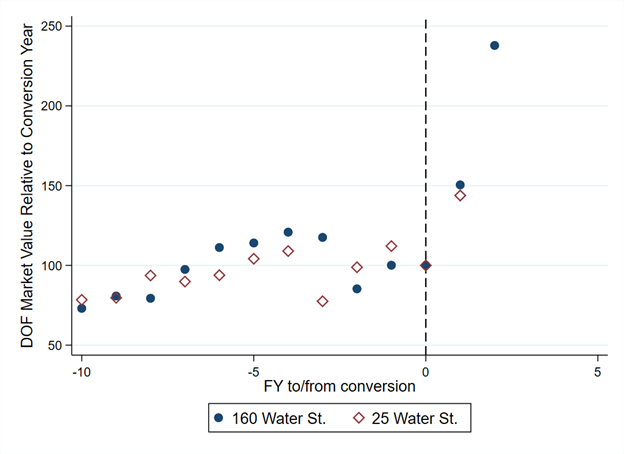
Chart 4 compares DOF market values for 160 Water Street (for which time zero is FY 2024) with those of 25 Water Street (for which time zero is FY 2025). DOF market values for the two properties behave similarly. Considering the loss of income due to the income-restricted units, at time +2 DOF market value could be approximately 2.0 times than at time zero or $312 per gross square foot.
Chart 4. DOF Market Value Relative to Conversion Date: 160 and 25 Water Street
Source: NYC DOF, Office of the NYC Comptroller analysis.
Assuming 25 Water Street receives two years of construction benefits (FY 2025 and FY 2026) and that taxes grow at a constant annual rate of 3.5% (a standard assumption in long-term projections by the NYC Office of Management and Budget), the 37-year present value of 467-m tax benefits is $434 million while the present value of taxes paid is $67 million.[21] As a full market-rate building, 25 Water Street could have instead paid taxes totaling $605 million in present value, $538 million more than as a 467-m building. This results in a cost of $1.6 million per income-restricted unit or 2.3 million per income-restricted bedrooms (in this calculation, studios are given the value of half a bedroom). The opportunity cost per unit in this building is less than the Lower Manhattan average shown further below because it has a larger concentration of studios. Correspondingly, the opportunity cost per bedroom is higher than the average.
Case Study: Conversion vs. Renovation on 3rd Avenue
To validate the opportunity cost assumption outside of Lower Manhattan, it is necessary that 467-m makes conversions more profitable than renovations. This is relevant particularly in the 3rd Avenue corridor, where many conversions are concentrated. To give a specific example, it is possible to compare two neighboring buildings: 830 3rd Avenue, which is slated for conversion, and 850 3rd Avenue which will be renovated and is taking advantage of a different tax incentive offered by the New York City Industrial Development Agency (NYCIDA).
830 3rd Avenue (151,000 gross square feet) traded in September 2022 at $72 million ($478 per gross square foot)[22] and, as of news report in 2023, had a vacancy rate of 40%. The FY 2026 property tax per gross square foot is approximately $13. The permit to convert the buildings to residential use (for a total of 188 units) was approved in October 2024.
850 3rd Avenue received approval for a tax exemption through the Manhattan Commercial Revitalization (M-CORE) Program in early 2024. The transaction closed in July 2025. M-CORE is a discretionary tax incentive for renovations and improvements that was announced by NYCIDA in May 2023, one year before the passage of 467-m. To be eligible, a building must be located below 59th Street in Manhattan, have at least 250,000 gross square feet (later lowered to 100,000), and have been built before 2000. In addition, the renovation costs need to meet a minimum threshold. The program grants property tax exemptions for up to 20 years, sales tax exemptions on construction materials, and mortgage recording tax exemptions. The program provides a 100% property tax exemption on changes in assessed value for the first 2.5 million square feet entering the program. The percentage is reduced by 10% for each additional 2.5 million square feet entering the program. In general, the property tax abatements keep taxes constant for 16 years before a 4-year phase out.[23] The program is capped at 10 million square feet. A first analysis of M-CORE is available in the May 2024 Spotlight published by this Office.
M-CORE is far from fully subscribing even the first tranche of 2.5 million square feet. A total of 11 projects submitted applications during the first round of the program. In the second round, the square footage threshold was lowered to 100,000 square feet and 3 projects applied. Applications are now received on a rolling basis. Of the 14 projects, 3 were approved for benefits for a total of 1.4 million square feet: 175 Water Street, 850 Third Avenue, and 460 Park Avenue. Two more projects ready for approval were ultimately shelved: 522 5th Avenue and 695 6th Avenue.[24] Market data suggests convincingly that properties in core midtown markets (such as 245 Park Avenue and 522 5th Avenue, which was recently purchased by Amazon) remain attractive and do not require M-CORE tax incentives to renovate. But on 3rd Avenue, the case is less clear cut.
As of January 2024, 850 3rd Avenue (575,000 gross square feet) was 67% vacant. The building’s mezzanine lender took possession after foreclosure in March 2023, when the property was valued at $266 million ($463 per gross square foot) based on the amount of outstanding debt. This was 37% less than the previous sale of $422 million in January 2019 (itself a 9% decline from the 2016 sale price of $463 million). As part of the M-CORE program, the new owner planned to invest $63 million for the renovation ($109 per gross square foot).[25] This amount did not include the cost of tenant improvements and leasing commissions. The FY 2026 property tax is approximately $13 per gross square foot.
830 3rd Avenue and 850 3rd Avenue are comparable based on location, occupancy, valuation, and property tax but not in size. 850 3rd Avenue has width and depth of approximately 200 square feet, which may have made a conversion not feasible. 830 3rd Avenue is only half that size.
But aside from the depth of floor plates, how can the decision between renovating and converting be analyzed? The answer can be approximated with stylized financials for an office building renovation under the following assumptions: i) rentable square footage is 10% higher than gross square footage, ii) operating costs of $14 per gross square foot, iii) property tax of $13 per gross square foot (which would remain constant with M-CORE benefits), iv) renovation, tenant improvement, and leasing commission costs of $300 per gross square foot based on estimates for 850 3rd Avenue and a completely vacant building, v) cap rate of 6.5% at stabilization[26] and discount rate of 7.5%. Under these assumptions, it is possible to derive the combinations of rent and occupancy rate after conversion that generate the same residual land value of $319 from the conversion financials in Table 5.
Chart 5. Office Rent/Occupancy Frontier with 467-m
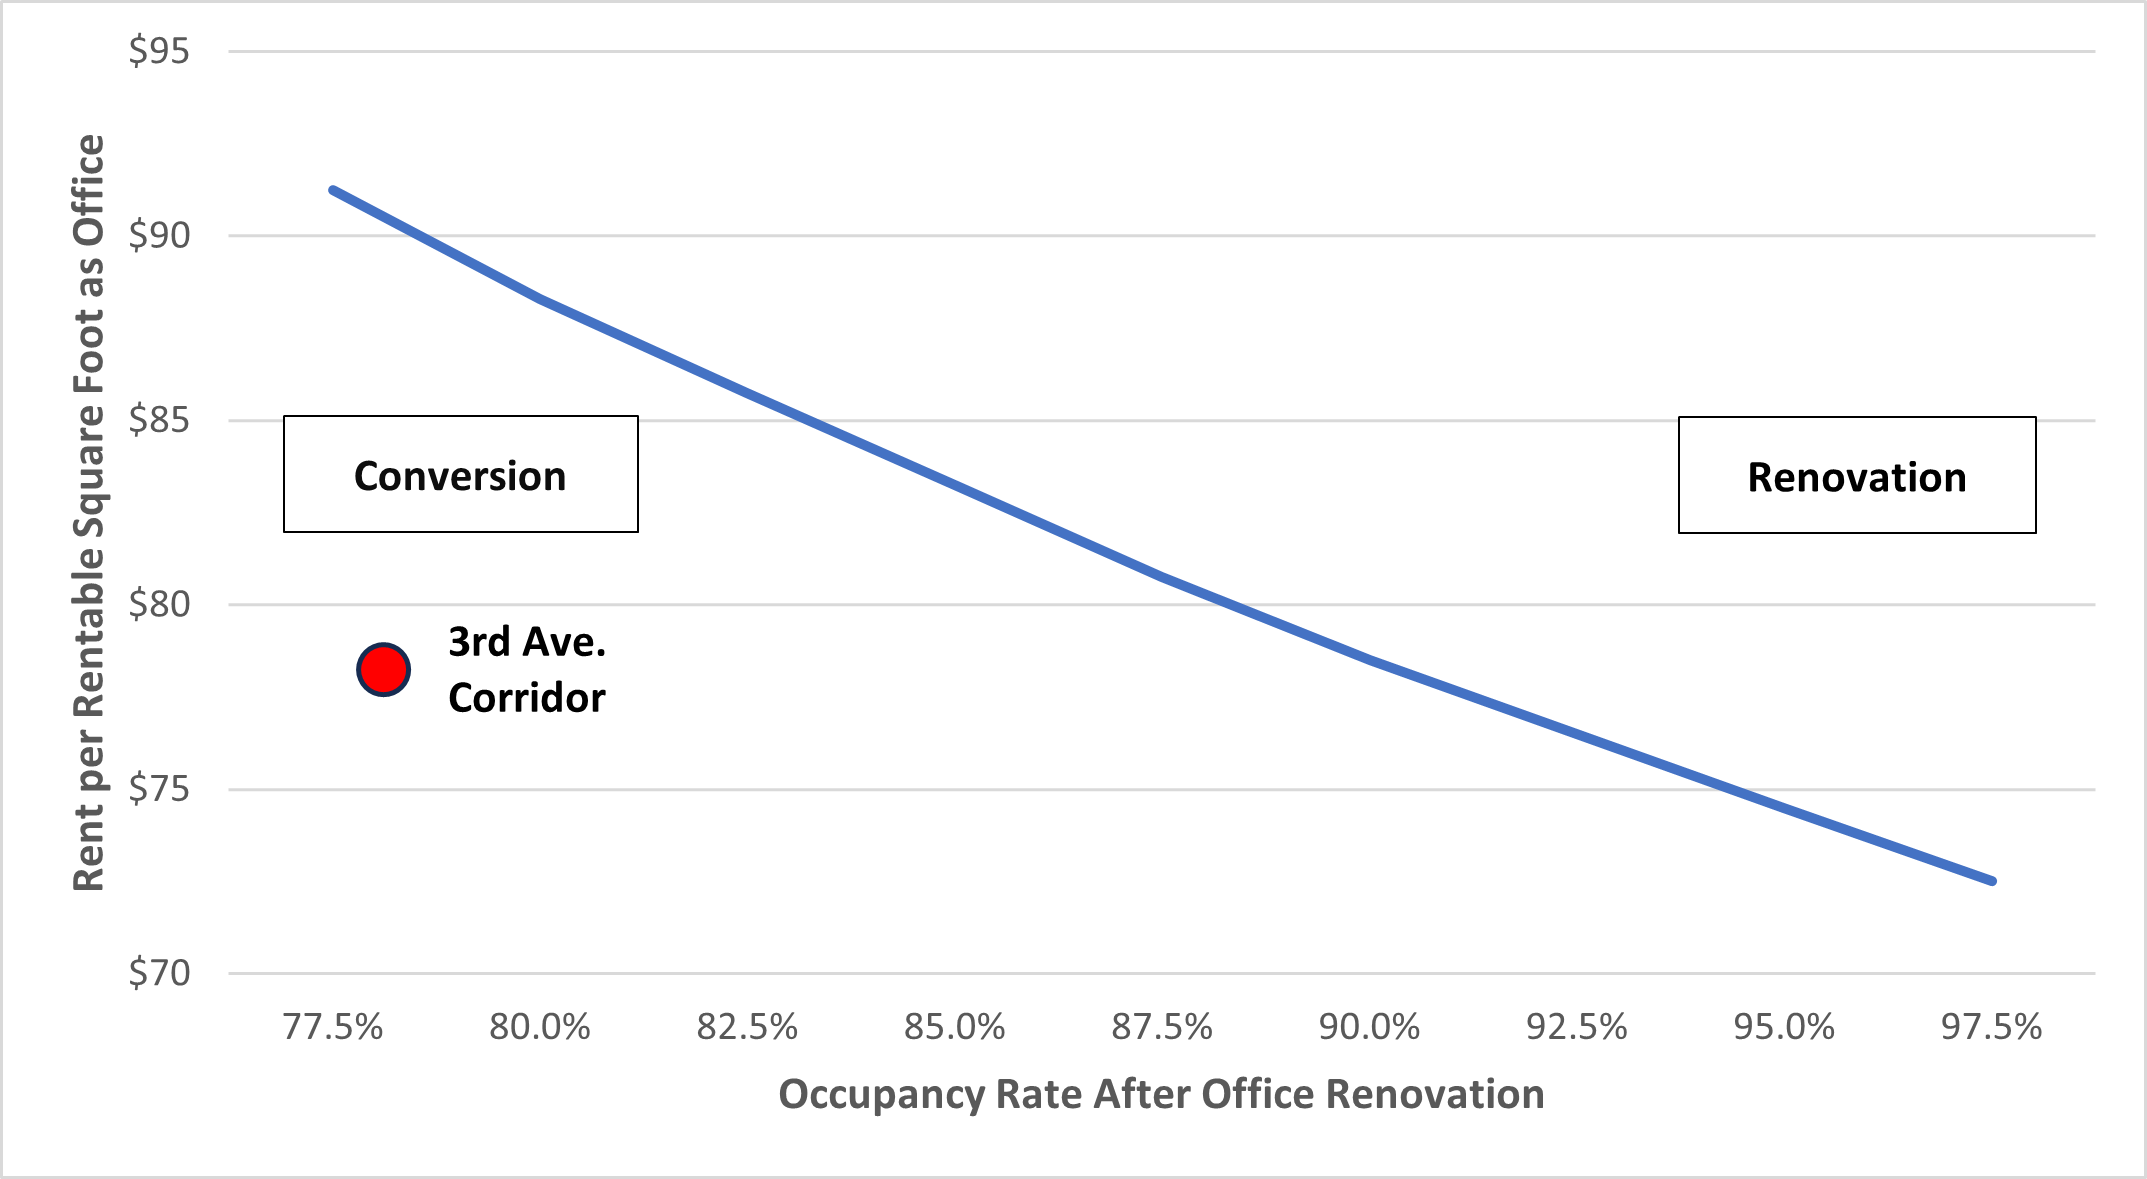
Source: CoStar, Office of the NYC Comptroller analysis.
Chart 5 shows the resulting office rent/occupancy rate frontier. To the right of the frontier, buildings should be renovated. To the left, buildings convert to residential with 467-m tax exemptions.[27] Lower renovation and leasing costs would make renovation more attractive and shift the frontier to the left. A lower conversion cost would have the opposite effect. The Chart indicates that, based on the parameters of the financial analysis, obtaining 95% occupancy at approximately $75 per rentable square foot would make an owner indifferent between renovating and converting, other things equal. The Chart also shows where the 3rd Avenue corridor stood as of the first quarter of 2025 in terms of availability rate (78%) and market asking rent ($78) per CoStar data.[28] The interpretation is that 467-m appears to tip the decision toward conversion, provided that physical characteristics and existing leases allow for it.
To be sure, some buildings in the corridor have higher occupancy. Based on the 2024Q4 financials, SL Green’s properties (2.7 million square feet) were 84% occupied and 91% leased (in part due to the 925,000 square feet renewal and expansion of Bloomberg’s lease at 919 3rd Avenue). However, the annualized rent from these properties as reported in 2024Q4, averaged $58.4 per square foot.[29] On the other hand, leasing can be challenging for renovated properties. 825 3rd Avenue, reopened in 2022 after a $150 million renovation (approximately $325 per gross square foot). A report from March of 2024 indicated that availability on the property’s website was 137,000 square feet (about 25% of the total office area). As of March 24, 2025, available office square footage remained elevated at 123,712 square feet, with lease announcements over the previous year totaling 37,000 square feet with rents ranging between $86 and $102.
Chart 6. Office Rent/Occupancy Frontiers with and Without 467-m
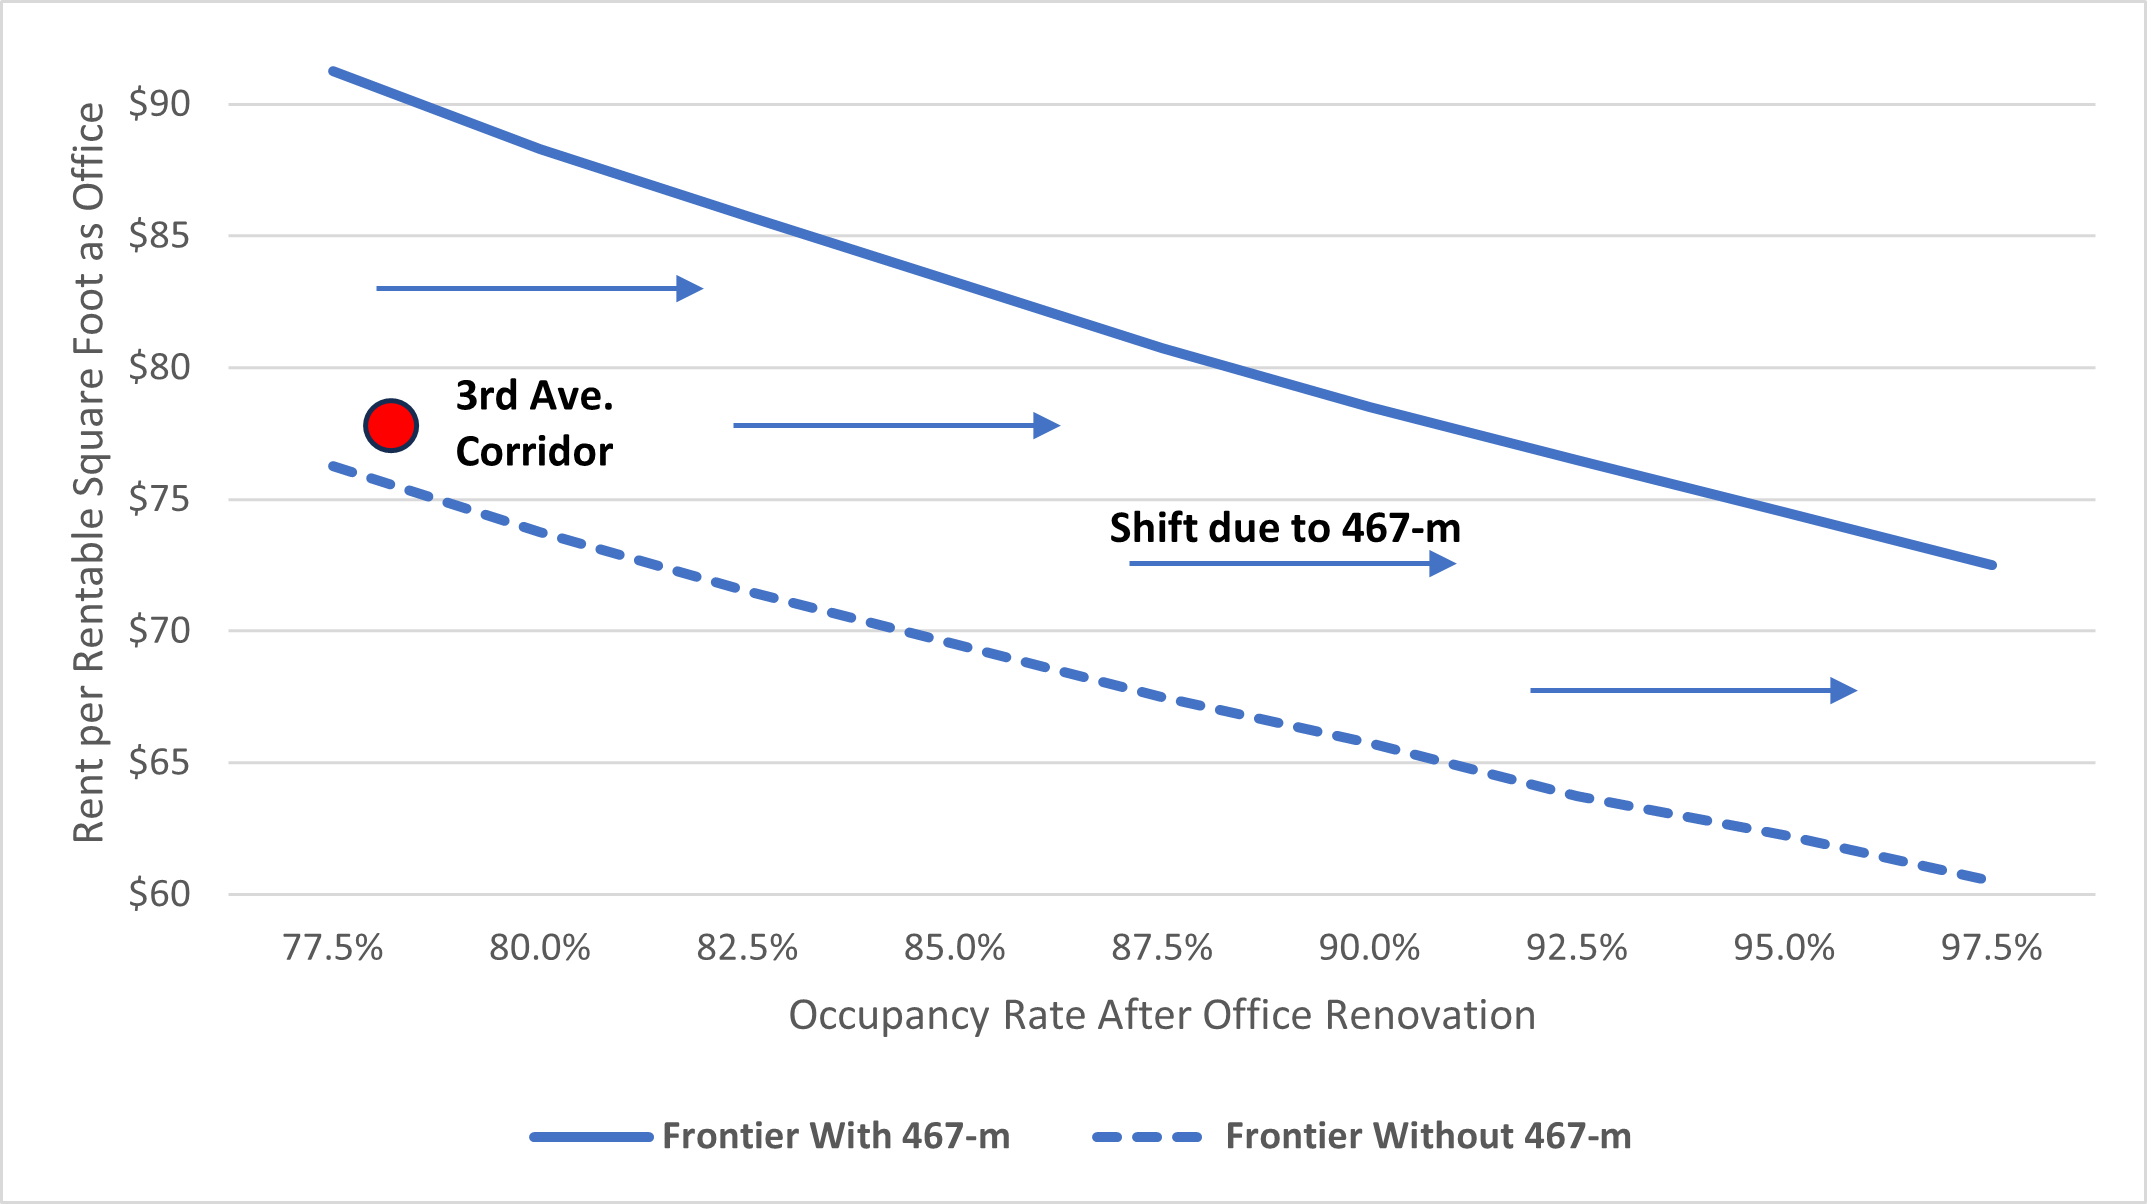
Source: CoStar, Office of the NYC Comptroller analysis.
Chart 6 shows how the office rent/occupancy frontier shifted due to 467-m. The higher frontier is the same as the one in Chart 5 and it uses the stylized financials with 467-m. The lower frontier is derived in a similar fashion from the stylized financials without 467-m. While not definitive, the calculations are supportive of the hypothesis that owners of office buildings could at least have waited for market conditions to improve rather than convert their buildings. 467-m appears to play more of a pivotal role in Midtown East than in Lower Manhattan.
Property Tax Projections
This subsection provides prospective estimate of the fiscal cost of 12.2 million gross square feet of office space potentially qualifying for 467-m benefits by June 30, 2026 in Manhattan South of 59th street. The results are expressed in present value terms over 37 years, a period that covers the 467-m schedule plus two years of construction. To simplify the calculation, it is assumed that all conversions start in FY 2026. The parameters used in the projections are listed and explained in Table 6.
Table 6. Parameters of the Fiscal Estimate
| Parameter | Values (Lower MN / Rest of MN South of 59th Street) | Details | |
|---|---|---|---|
| DOF market value per gross square foot | Pre-conversion | $ 225 / $330 | FY 2025 values in Chart 2. |
| Post-conversion with 467-m | $320 / $350 | Based on median DOF market values per square foot for properties: i) in Manhattan south of 59th Street; ii) built 2014-2023; 3) 100,000+ gross square feet; 4) receiving the 421-a tax exemptions. | |
| Post-conversion fully market rate | $390 / $426 | Estimated % difference of DOF market value from Table 5 using a cap rate of 7% plus 45% of the FY 2025 tax rate (see DOF’s assessment guidelines). | |
| Office growth rate | 1.3% / 1.1% | FY 2015 – FY 2025 CAGR from Chart 2. | |
| Residential growth rate | 3.5% | Standard assumption in NYC OMB’s fiscal projections. | |
| Total square feet | 7.0 million / 5.2 million | Table A1. | |
| Market vs. income-restricted rents | Difference starts at $63 per rentable square foot | See Table 5. Rent growth of 3.3% for market rate units (10-year average from StreetEasy repeat rent index) and 1.8% for income-restricted untis (10-year average of 1-year RGB increases). | |
| Tax calculation | DOF market value x 45% x tax rate | The calculation uses actual (rather than transitional) assessed values and the FY 2025 tax rates of 10.762% for office and 12.5% for residential. | |
| Construction period | 2 years | Construction-period tax reimbursed in year 3 for 467-m projects | |
| Discount rate | 4.5% | Average City bonds interest cost FY 2024 – FY 2025 through February. | |
Source: Office of the NYC Comptroller analysis. See the appendix for assumptions specific to 5 Times Square and 1011 1st Avenue.
The main results from the projections are summarized in Table 7. The first result is the amount of tax expenditure: the value of the exemptions without regards to the counterfactuals. The calculations yield a total expenditure of $5.6 billion. Lower Manhattan has higher value ($3.1 billion) than elsewhere ($2.5 billion) because it has the majority of converted square footage, despite the rest of Manhattan having higher exempted value per square foot.
The second result is the opportunity cost. The cost is $3.8 billion in Lower Manhattan, which is higher than the tax expenditure of $3.1 billion because the counterfactual is the conversion to fully-market rate (and fully taxable) residential buildings. The opportunity cost outside of Lower Manhattan is $1.4 billion, lower than the tax expenditure of $2.5 billion because in the counterfactual taxes on office buildings only grow at 1.2% per year. The total opportunity cost is $5.1 billion.
Table 7. Fiscal Estimates ($ in Present Value)
| Lower Manhattan | Rest of Manhattan South of 59th Street | Total | |
|---|---|---|---|
| Tax Expenditure | $3.1b | $2.5b | $5.6b |
| Opportunity cost | $3.8b | $1.4b | $5.1b |
| Number of income-restricted units | 2,103 | 1,515 | 3,617 |
| Number of income-restricted bedrooms | 1,768 | 1,218 | 2,986 |
| Opportunity cost per Income-Restricted Unit | $1.8m | $0.9m | $1.4m |
| Opportunity cost per Income-Restricted Bedroom | $2.1m | $1.1m | $1.7m |
Source: Office of the NYC Comptroller analysis. Components may not add up to the totals because of rounding.
As a result, the opportunity cost per income-restricted unit in Lower Manhattan is $1.8 million while the opportunity cost per bedroom is $2.1 million (studios are given a value of one half of a bedroom). Outside of Lower Manhattan, the opportunity cost per unit is $0.9 million and it is $1.1 million per bedroom. In the entire sample of projects, the opportunity cost per unit is $1.4 million while the opportunity cost per bedroom is $1.7 million.
The Value of Rent Restrictions
To give context to the results in the previous subsection, it is possible to estimate the value of rent restrictions. As indicated in the stylized financials, the difference between market and income-restricted rent is approximately $63 per rentable square foot ($105 minus $42). The value needs to be converted from rentable to gross square foot and further distributed over the entire gross square footage in the building. This results in a rent discount per gross square foot of $12. Based on the growth rates of market and income-restricted rents in Table 6, the present value of the rent restrictions for the 12.2 million square feet in the analysis is approximately $4.2 billion or 81% of the total opportunity cost of $5.1 billion (74% of the estimated present value of the tax expenditure).[30]
Conclusion
The excess supply of office space was one of the dominant economic and fiscal themes emerging in the post-pandemic recovery. The worries of decaying downtowns and shrinking tax revenues were captured in an urban doom loop narrative that has, fortunately, not come true. On the contrary, the re-purposing of economically obsolete office space into housing has now kicked into high gear in the US and could lead to new, vibrant mixed-use neighborhoods.
The first wave of post-pandemic conversions in New York City could turn 15.2 million gross square feet of office space into 17,400 apartments, mostly rental units concentrated in Manhattan south of 59th Street. This is a robust start to what could become a substantial addition to residential supply, mainly in the central business district.
A key catalyst for the conversion activity is the 467-m property tax exemption program, which provides resources that are sufficient to incentivize development and to buy significant rent discounts on 25% of the converted units. In a welcome move toward better program design, the tax benefits are longer for first movers. The analysis in this fiscal note finds that not all aspects of the program are as fine-tuned, with exemptions more likely to be pivotal for investment decisions in Midtown and likely too generous in Lower Manhattan. The other arm of the policy intervention is the relaxation of land use constraints that limited stock of buildings that could be converted.
Overall, the pipeline of potential projects in Manhattan South of 59th Street that could qualify for 467-m benefits between now and June 2026 could carry a cost of $5.1 billion in present value (or tax expenditures of $5.6 billion, also in present value). These conversions could produce approximately 14,500 apartments, of which 3,600 are income-restricted. The rent discounts on the 3,600 apartments represent 81% of the cost of the program over the life of the exemptions.
Based on the data in this fiscal note, New York City is making significant progress in absorbing the over-supply of office space by creating new mixed-use and mixed-income neighborhoods. This will result in a more efficient use of land, its scarcest resource, and will contribute to restoring the vibrancy of its central business districts.
Acknowledgements
This fiscal note was prepared by Francesco Brindisi, Executive Deputy Comptroller for Budget and Finance and Yaw Owusu-Ansah, Director of Tax Policy and Revenue Analysis. Archer Hutchinson, Creative Director, and Addison Magrath, Graphic Designer, led the report design and layout. The analysis builds upon research authored by Stephen Corson, Senior Research Analyst, Yaw Owusu-Ansah, and Astha Dutta that was presented in November 2024 at the Fiscal Policy Breakfast Series organized by the Federal Reserve Bank of New York, New York University and the NYC Independent Budget Office. The authors are thankful for comments received from many generous reviewers on earlier drafts and are responsible for any errors.
Appendix
Office-to-Residential Conversion Projects
Table A1 reports the list of conversions used in the analysis. C denotes completed, P denotes projected, U denotes underway (generally under construction or with a permit filed or issues), Par denotes partial conversion to residential, E denotes potential eligibility for the 467-m exemption, S denotes parcel included in the sample used to study DOF market values. Condo denotes conversion to condominium. The sample excludes properties that have recently split into commercial condominiums, are under or have completed construction, are likely condominium or partial conversions, or would not be eligible for 467-m benefits. These sample selection rules exclude 25 Water Street, 55 Broad Street, 219-229 E 42nd Street and other buildings from the sample. 110 Maiden Lane (aka 80 Pine Street) is excluded because of an anomalous increase in DOF market value. 230 Park Avenue (the Helmsley Building) is included in the sample to increase its size even though details on the conversion are not available.
Red denotes an estimated value. For rental buildings, estimates assume approximately 860 gross square feet per unit (consistent with the financial analysis assumptions of average rentable square feet of approximately 650 square feet per unit and a gross-to-rentable square foot reduction of 25%). 421-g rentals averaged 979 gross square feet per unit, per Campion S. (2022) The Potential for Office-to-Residential Conversions: Lessons from 421-g, Citizens Budget Commission but the recent wave of conversions appears skewed towards smaller units, especially studios. Permits data suggests a smaller value of 805 gross square feet per unit, but some buildings are increasing their total gross square footage. The estimates for condominiums use the weighted average gross square feet per unit from administrative data information.
Square footage information is derived from DOB NOW data when available, the NYC DCP Housing Database and NYC DOF (as of the FY 2026 tentative assessment roll). The number of units for 25 Water Street is as of NYC DOF data. Most of the projects in table A1 may be eligible for 467-m benefits, given the retroactive timeline for construction start set at the beginning of 2023. It does not appear that 90 John Street, and 17 Battery Place opted into 467-m. 160 Water Street and 1751 Park Avenue are not eligible. As mentioned in the report, 25 Water Street qualified retroactively.
The square footage at 25 Water Street was 1,016,406 before conversion. The square footage at 160 Water Street was 480,863 before conversion. The number of apartments at the ex-Pfizer headquarters (219-229 East 42nd Street) is from news reports, although building permits as of May 2025 indicate a total of 1,463. News reports indicate that 675 Third Avenue could be contain 430 apartments but permit data are not available at the time of writing. News reports on 111 Wall Street indicate that the building is looking for a $850 million loan, representing 65% of the total conversion cost.
176 Remsen Street is one of three buildings included in a larger development plan and its square footage will increase during conversion. The number of units refers to the entire development. The square footage 175 Pearl Street is expected to increase to 230,000 square feet. Based on DOB NOW information, 1751 Park Avenue is expected to have 78,290 sf of residential space and 16,800 sf of accessory uses (given the increase in square footage it is unlikely that this building will be eligible for 467-m benefits).
5 Times Square is part of the 42nd Street Land Use Improvement Project (a General Project Plan of Empire State Development) and was the location Ernst & Young until 2022. Based on the documents presented at public hearing and approved by the Empire State Development Board of Directors, the project could convert 917,745 gross square feet of office space into 1,250 apartments (1,050 studios and 200 one-bedroom, according to press releases). The conversion is envisioned in two phases. The first will convert roughly 717,000 gross square feet (see the Table of Approved Gross Area in the amended Design, Use, and Operating Requirements) into 850 apartments (714 of which studios, based on the proportions for the full development).[31] The second phase will be undertaken when the occupied office space (208,000 gross square feet) is vacated. Only the first phase is included in table A1. The grounds are leased by the NYC Economic Development Corporation (NYCEDC) with lease payments increasing from $4.7 million in FY 2022 (the last year of the lease with Ernst & Young) to $10.7 million in FY 2023 and to $11.2 million in FY 2024. The lease payments represent 50% of the full taxes on the building. The remaining 50% is charged against an Excess Site Acquisition Costs (ESAC) account with a balance of $27.6 million at the end of FY 2024. Given the amount of property taxes, the account would have been depleted in FY 2028. As part of the conversion, the owner of the building exercised an option to purchase the land which is being finalized at the time of writing. The conversion is required to adhere to the requirements of 467-m and is expected to receive the corresponding tax benefits. The building was recapitalized in October 2024 to effectuate the conversion. In FY 2025, the market value was $482 million or $501 per gross square foot (instead of the 1.1 million gsf in DOF’s data, this calculation uses 962,556 gsf indicated in the Desing, Use, and Operating Requirements document). The counterfactual for the fiscal cost estimates is that the building would have exhausted the ESAC account and continued to pay full taxes as office to NYCEDC, growing at 1.2% (per Table 6). The total amount of taxes is scaled down in proportion to the gross square footage converting in the first phase of the project (74% of the total).
1011 1st Avenue has been the headquarters of the Roman Catholic Archdiocese of New York. As such, the building is exempt from property taxes. The counterfactual for the fiscal cost estimates is a fully tax-exempt building.
The Information on 750 3rd Avenue is available in SL Green’s 2024 investor conference (this project is also discussed in more detail below). Information on 653 5th Avenue is available from the zoning application. Permits filed for 115 7th Avenue show 49,582 total square feet, with residential use totaling 39,762 square feet. The table reports the building’s current gross square footage in DOF data. The square footage for 245 W. 55th Street is as reported in DOF data, although the DOB NOW data indicates the buildings could expand to 85,378 square feet. 79 Madison Avenue has been reported as being considered for conversion to condominium. 101 Franklin Street has a transaction price that suggests conversion to condominium and it is listed as such in table A1.
Table A1. List of Office-to-Residential Conversions
| Address | Submarket | Units | GSF | Notes |
|---|---|---|---|---|
| 2 Wall St. | Financial District | 121 | 109,876 | U, Par, S, E |
| 17 Battery Pl. | Financial District | 184 | 118,932 | C, Par |
| 25 Water St. | Financial District | 1,320 | 1,044,351 | U, E |
| 55 Broad St. | Financial District | 571 | 406,025 | C, E |
| 61 Broadway | Financial District | 756 | 650,740 | P, S, E |
| 77 Water St. | Financial District | 600 | 541,568 | P, S, E |
| 85 Broad Street | Financial District | 1,171 | 1,007,569 | P, S, E |
| 90 John St. | Financial District | 114 | 130,550 | C, Par |
| 100 Wall St. | Financial District | 539 | 463,664 | P, S, E |
| 101 Greenwich St. | Tribeca | 465 | 400,294 | P, S, E |
| 110 Maiden Ln. (80 Pine St.) | Financial District | 500 | 665,975 | U, Par, E |
| 110 W 32nd St. | Midtown South | 77 | 58,230 | P, E |
| 111 Wall St. | Financial District | 1,570 | 990,250 | P, S, E |
| 160 Water St. | Financial District | 588 | 525,000 | C |
| 175 Pearl St. | DUMBO | 198 | 184,965 | P, E |
| 176 Remsen St. | Brooklyn Heights | 747 | 184,055 | P, E |
| 219-229 E 42nd St. | Midtown East | 1,600 | 972,462 | U, E |
| 222 Broadway | Financial District | 798 | 756,138 | P, S, E |
| 230 Park Ave. | Midtown | n/a | n/a | P, Par, S, E |
| 330 W 42nd St. | Hell’s Kitchen | 224 | 192,762 | P, Par, S, E |
| 345 7th Ave. | NoMad | 221 | 190,325 | P, S, E |
| 355 Lexington Ave. | Midtown East | 261 | 225,000 | P, S, E |
| 592 7th Ave. (5 Times Sq.) | Midtown | 850 | 716,869 | U, Par, E |
| 650 1st Ave. | Murray Hill | 111 | 112,262 | U, E |
| 675 3rd Ave. | Midtown East | 336 | 289,356 | P, S, E |
| 750 3rd Ave. | Midtown East | 639 | 761,384 | U, S, E |
| 767 3rd Ave. | Midtown East | 333 | 286,212 | P, S, E |
| 830 3rd Ave. | Midtown East | 188 | 150,638 | U, S, E |
| 845 3rd Ave. | Midtown East | 374 | 321,452 | P, S, E |
| 980 6th Ave. | Midtown South | 100 | 90,000 | U, Par |
| 1011 1st Ave. | Midtown East | 420 | 398,214 | U, S, E |
| 1740 Broadway | Midtown | 422 | 510,591 | P, S, E |
| 1751 Park Ave. | East Harlem | 110 | 28,539 | P |
| 79 Madison Ave. | Gramercy | 118 | 224,449 | Condo |
| 95 Madison Ave. | NoMad | 65 | 146,161 | Condo |
| 101 Franklin St. | Tribeca | 106 | 202,000 | Condo |
| 114 E 25th St. | Flatiron | 20 | 48,236 | Condo |
| 115 7th Ave. | Chelsea | 50 | 42,380 | Condo |
| 140 W. 57th St. | Midtown | 47 | 90,000 | Condo |
| 175 5th Ave. | Flatiron | 60 | 183,449 | Condo |
| 245 W 55th St. | Midtown | 42 | 63,450 | Condo |
| 285 Schermerhorn St. | Downtown Brooklyn | 75 | 124,308 | Condo |
| 419 Park Avenue S. | Midtown South | 100 | 160,114 | Condo |
| 609 5th Ave. | Midtown East | 66 | 121,745 | Condo |
| 623 5th Ave. | Midtown East | 172 | 344,300 | Condo, Par |
| Total Rental | 16,510 | 13,484,248 | ||
| Total Condo | 922 | 1,750,592 | ||
| Total | 17,432 | 15,234,840 |
Source: NYC DCP Housing Database (as of 2024Q4), DOB NOW, NYC DOF, news reports, Office of the NYC Comptroller analysis.
Additional conversions to rental are 300 East 42nd Street and 6 East 43rd Street which, combined could add approximately 500,000 gsf and 600 apartments to the total. Both would be eligible for 467-m. Based on available information, 300 East 42nd Street is a partial conversion of 93,000 square feet to 135 apartments. The building transacted for $52 million in April, which represents a 58% decline from the $122.5 million of the previous transaction in August 2019. The building was built in 1964 and has 207,887 gross square feet per DOF records. 6 East 43rd Street (the Emigrant Savings Bank building) was reported to have a sale price of $140 million. The building was built in 1968 and has 304,525 gross square feet according to DOF records. News reports indicate that the building is larger than in administrative data (400,000 square feet) and could contain 450-500 apartments.
Table A1 omits 655 Madison Avenue (approximately 200,000 gross square feet) because it is slated for demolition and ground-up residential development. The table also omits the conversion of 40 Wooster Street (4 units, 14,125 gross square feet) due to its size.
Additional Analysis of DOF Market Values
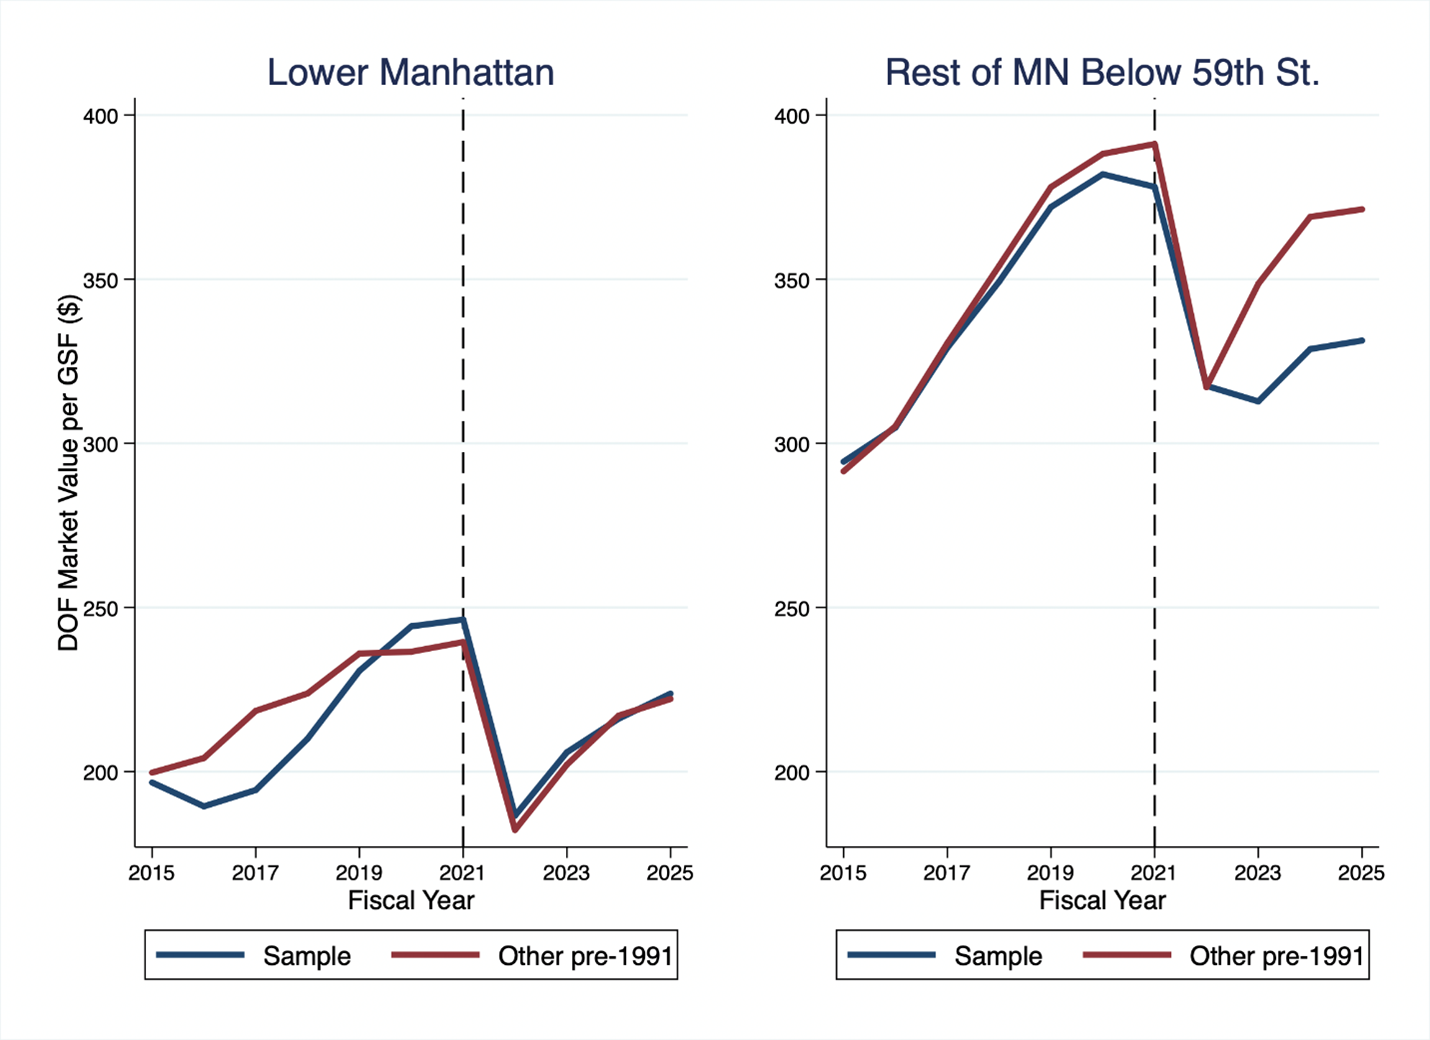
To understand where the properties in the sample are relative to the rest of the office stock, we compared to pre-1991 buildings in DOF assessment data, with gross square footage of at least 100,000 and floor plates that would not preclude conversion. The threshold we used for floor plates is taken from Gupta A., Martinez C., Van Nieuwerburgh S. (2023) “Converting Brown Offices to Green Apartments,” NBER Working Paper 31530, August. Specifically, we dropped from the DOF data buildings that have a distance from the window to the core of more than 60 feet (defined as the minimum between building width/2 and depth/2). This seems consistent with other studies that set the floor plate threshold for renovation at 14,000-15,000 square feet (see Havsy J., Li X., Fagan K. (2022) Why Office-to-Apartment Conversions are Likely a Fringe Trend at Best, Moody’s and Tong C., Schoenmaker D. (2023) The Rise and Fall of Office to Multifamily Conversions: A Real Estate Investigation, CBRE).
Chart A1 shows average DOF market value per gsf in Downtown and the rest of Manhattan south of 59th Street. The chart shows that the properties in the sample are representative of the overall pre-1991 stock of office space. At the same time, DOF valuations are not declining but rather slowly recovering over time, in nominal terms. In the rest of Manhattan south of 59th Street, pre-1991 buildings have higher valuation post-FY 2021 than those in the sample, suggesting that conversions are taking place in the lower-end of the market.
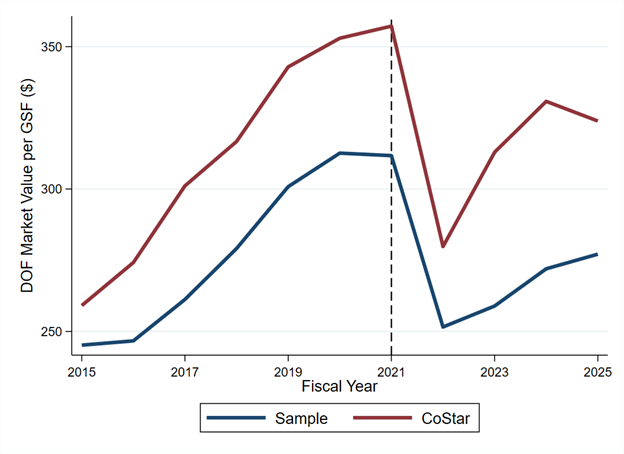
We also compared the sample of conversions to an extract from the CoStar database in mid-March. The CoStar sample includes buildings built up to 1990, not renovated since 2020, and with at most 60% occupancy. After cleaning the data and matching to DOF information, we were left with a total of 11.4 million gsf. Chart A2 shows that the CoStar sample generally has a higher DOF market value per gsf (equal to $324 in FY 2025, or 17% higher) and show a steeper growth post FY 2022. Only three buildings are included in both samples and the higher values in the CoStar sample, if used in the analysis, would suggest an overall lower likelihood of conversion.
Chart A1. Comparison of DOF Market Value per Gross Square Foot with Other Pre-1991 Buildings
Source: NYC DOF, NYC DCP, Office of the NYC Comptroller analysis.
Chart A2. Comparison of DOF Market Values per Gross Square Foot with a CoStar Sample
Source: CoStar, NYC DOF, Office of the NYC Comptroller analysis.
Footnotes
[1] See Barrero et al. (2025) Survey of Working Arrangements and Attitudes – May 2025 Update (http://www.wfhresearch.com/).
[2] See Gupta A., Mittal V., and Van Nieuwerburgh S. (2025) “Work from Home and the Office Real Estate Apocalypse,” American Economic Review, forthcoming. Available at SSRN: https://ssrn.com/abstract=4124698 or http://dx.doi.org/10.2139/ssrn.4124698 and Inman R.P. (1983) “Anatomy of a Fiscal Crisis,” Business Review, Federal Reserve Bank of Philadelphia, September/October.
[3] See Campion S. (2022) The Potential for Office-to-Residential Conversions: Lessons from 421-g, Citizens Budget Commission and Table 2 of Gould Ellen I., Kazis N. (2023) “Flexibility and Conversions in New York City’s Housing Stock: Building for an Era of Rapid Change,” Economic Policy Review, Vol.29(2), Federal Reserve Bank of New York.
[4] The new JP Morgan headquarter at 270 Park Avenue (2.5 million square feet) is slated for completion in 2025. The rezoning of 175 Park Avenue was approved in December 2021. Based on the environmental impact statement, this mixed-use project is expected to contain 2.1 million square feet of office space. BPX recently broke ground at 343 Madison Avenue and is looking for an anchor tenant at 3 Hudson Boulevard to continue the construction. These two towers could add to 2.9 million square feet according to the 2024Q4 investor presentation. Related will break ground on 70 Hudson Yards this summer. The 1.1 million square feet tower has already signed an anchor tenant for 800,000 square feet. 350 Park Avenue, which is anchored by Citadel, started the City’s Uniform Land Use Review Procedure for a 2.1 million square foot tower (1.6 million square feet of which dedicated to office uses). Finally, the Roosevelt Hotel is also rumored as a potential development site. These projects are in the Grand Central, Park Avenue, and Hudson Yards submarkets, NYC’s office market “super-core.”
[5] A fifth building, 175 Water Street, received tax benefits through the M-CORE program (discussed further below in this fiscal note) to attract fashion and arts tenants.
[6] See the Education, Labor and Family Assistance (S8306-C/A8806-C) Article VII Bill, part Q.
[7] Non-residential buildings are structures with a certificate of occupancy for commercial, manufacturing, or other non-residential use, and 90% or more of the floor area dedicated to such use.
[8] Recently, three hotels (Hudson, Watson, and Stewart) filed permits to convert to residential use, for a potential addition of 1,181 residential units. The Hotel Bossert in Brooklyn Heights has also been reported as a conversion to residential use.
[9] Campion S. (2022) The Potential for Office-to-Residential Conversions: Lessons from 421-g, Citizens Budget Commission.
[10] See CBRE (2025) Slow and Steady: A New Era of Office-to-Residential Conversions Reshape Manhattan, April.
[11] See the Education, Labor and Family Assistance (S8306-C/A8806-C) Article VII Bill, part U.
[12] See page 2 of the 485-x Final Rule.
[13] See Office of the NYC Comptroller (2022) A Better Way than 421-a.
[14] REBNY guidelines for office rentals require the calculation of usable square feet (which subtract from the gross square footage elevators, stairs, HVAC, etc.) and obtain rentable square footage by diving by (a rule of thumb of) 0.73. This typically results in rentable square footage exceeding gross square footage.
[15] The calculations exclude 5 Times Square which, with 84% of the units expected to be studios, appears to be an outlier.
[16] Commercial and other accessory uses would command a higher rent and boost income, as long as they represent less than 12% of the building area (see the footnote to Table 1).
[17] See Havky J. Li X., Fagan K. (2022) “Why Office-to-Apartment Conversions are Likely a Fringe Trend at Best,” Moody’s CRE Analytics; Peng E., Viswanathan V. (2024) “The Price Is Still Too High for Office-to-Multifamily Conversion,” Goldman Sachs Economics Research; Kramer A. et al. (2024) “Office to Residential: A Mismatch Made in Heaven?” Morgan Stanley Research.
[18] The reduction from office rentable square footage to residential rentable square footage appears to be deeper. An information sheet available on SL Green’s website, indicates 818,000 rentable square feet. Quarterly unaudited supplemental financial data as of the fourth quarter of 2024 indicates 780,000 rentable square feet.
[19] Part of the jump is due to a 3% increase in gross square footage in DODF data, which does not significantly affect the results.
[20] Gross square footage in DOF’s data increased from 1,016,406 to 1,044,351 in the FY 2026 assessment roll, when the building was reclassified from office to residential.
[21] The discount rate is 4.5%, consistent with the City’s borrowing interest rate on the municipal market in FY 2024 and FY 2025 through February which averaged 4.43% for General Obligation and Transitional Finance Authority Future Tax Secured debt.
[22] In the stylized financials, a sale value of $478 per square foot could be consistent with a renovation cost of around $320 per square foot. The conversion cost of 830 Third Avenue has not been released.
[23] In general, M-CORE’s tax exemptions are more generous than the abatements available as-of-right through the Industrial and Commercial Abatement Program (ICAP).
[24] 522 5th Avenue is fully vacant and has gone through foreclosure. A renovation was planned since 2021. In August 2020, the office condominiums in the building traded for $350 million ($609 per square foot, based on reported square footage of 575,000). Property records indicate that In May the office condominiums were sold for $340 million ($591 per square foot) to Amazon who intends to occupy the premises. The retail condominium was also sold to Amazon for $85 million for a total of $425 million (news reports indicate a slightly higher total of $456 million). In September 2024 and again in March 2025, reports indicated that the debt on the property traded at an approximately 60% discount (the mortgage on the office condominiums was assigned to an SL Green-controlled entity in March). According to data from NYCIDA’s notice of public hearing for the project, the renovation would have cost $177 per square foot. The renovation at 695 6th Avenue has an even longer history stretching back to 2019. Based on the information in NYCIDA’s cost-benefit analysis, the renovation cost was $952 per square foot and included the addition of three stories to the building.
[25] Based on the press release of the final transaction, the investment amount was revised downward to “at least $57 million.”
[26] In market data, cap rates for office buildings are higher than for multifamily because the assets are riskier.
[27] Without M-CORE, the frontier would shift to the right by the difference between M-CORE and Industrial and Commercial Abatement Program tax benefits.
[28] The sample includes pre-1991 class A buildings with at least 100,000 square feet. Total rentable area in the sample is 14.3 million square feet. The sample excludes the properties in our list of expected conversions.
[29] In the SL Green financials, annualized rent is defined as “monthly base rent and escalations per the lease, excluding concessions, deferrals, and abatements as of the last day of the quarter, multiplied by 12.”
[30] Note that the rent discount only accrues over 35 of the 37 years over which the present value is calculated. Upon vacancy, the rent on income-restricted units resets at the appropriate percentage of AMI. Because AMI is likely to grow faster than the rent increases determined by the Rent Guidelines Board, the present value of the rent discount is also likely biased upward.
[31] The analysis is based on Empire State Development data but there are a few discrepancies with other data sources. Building permits data as of 5/23 (the day after the approval by Empire State Development) shows 661,312 square feet of residential space and 927 proposed dwelling units. Total square footage is reported as 1,100,000 in DOF data but only approximately 960,000 in Empire State Development documents.