
Executive Summary
Cooling centers offer vital, life-saving spaces for people to access air conditioning during heat waves. However, cooling centers are not located equitably across neighborhoods. This report analyzes cooling center availability in New York City during the weeklong heat wave that lasted from July 19-25, 2022. The analysis reflects a snapshot in time using data downloaded from the City’s Cooling Center Finder during that heat emergency, painting a picture of disparities in cooling center access for New Yorkers across the five boroughs.
Snapshot of Key Findings
- East Flatbush was significantly underserved by cooling centers, with only two open cooling centers available to its 162,400 residents.
- The top 10 neighborhoods with the highest heat vulnerability (HVI 4 and 5) and lowest number of cooling centers per 100,000 people were: East Flatbush, Elmhurst and Corona, Kingsbridge Heights and Bedford, Kew Gardens and Woodhaven, Crown Heights and Prospect Heights, Borough Park, South Crown Heights and Lefferts Gardens, Bedford Stuyvesant, Fordham and University Heights, and Highbridge and Concourse.
- Queens had the lowest number of cooling centers per 100,000 people (5.0), while Manhattan has the highest (7.1).
- Half of all cooling centers were listed as being closed on Saturdays, and 83% were listed as being closed on Sundays—even while the weeklong July 2022 heat emergency spanned the course of a weekend.
- Nearly half of the City’s activated cooling centers were senior centers, only open to people over 60 years old. Of those senior cooling centers, 56% did not offer extended hours and 22% did not have wheelchair access.
Summary of Recommendations
- Increase the number of cooling center locations in the most underserved neighborhoods, starting with East Flatbush.
- Expand alternate cooling center siting options, especially in underserved neighborhoods.
- Establish outdoor cooling stations.
- Increase extended and weekend hours, especially in heat-vulnerable neighborhoods.
- Make cooling center information permanently available to enable proactive emergency planning.
- Ensure all cooling centers are wheelchair accessible.
- Transition to more sustainable cooling systems.
- Reduce urban heat island effect with more green spaces and cool pavements in heat-vulnerable neighborhoods.
The Dangers of Extreme Heat
Heat waves can be dangerous, and even deadly. Extreme heat is the leading cause of weather-related fatalities across the country.[1] In New York City, 370 people experience heat-related deaths annually.[2] Health impacts of heat include heat strokes, respiratory illness, and cardiovascular disease.
The threats of extreme heat will only increase as climate change causes global temperatures to rise. By the 2080s, the New York City Panel on Climate Change projects that average temperatures will increase by as much as 8.8°F,[3] with triple the number of annual heat waves and 87 days above 90°F each year.[4] As heat waves get hotter and more frequent, the toll of extreme heat on New York City will be immense, estimated to result in 3,300 annual heat-related deaths by 2080.[5]
Some New Yorkers face greater heat risks than others due to a variety of environmental, economic, and social factors. Urban heat islands occur in areas with sparse vegetation and more paved surfaces that retain heat. Such urban areas have been measured to be as much as 22°F hotter than suburban counterparts.[6]
Heat mortality rates are twice as high among Black New Yorkers compared to white New Yorkers, as a result of decades of racist housing and economic policies.[7] Historically redlined neighborhoods, where banks applied discriminatory lending practices that segregated Black residents, are well-documented to be hotter than historically white neighborhoods, which tend to have greater tree cover and green spaces that reduce urban heat island effects.[8]
Increased physical exposure to heat can be exacerbated by other socioeconomic factors, such as elderly age, lack of access to air conditioning, and jobs that require outdoor work. Average annual rates of heat-stress are 9 times higher for New Yorkers in their 70s and 16 times higher for those over 80, compared to younger people under 20 years old.[9] Heat-related mortality is also more pronounced in neighborhoods with high levels of poverty, as low-income New Yorkers are far less likely to own or use air conditioning because of cost barriers.[10] New York’s Home Energy Assistance Program (HEAP), a federally funded program that provides financial assistance for the cost of air conditioning units or fans, saw a 200% increase in demand from 2021 to 2022 and stopped taking new applications despite the prolonged heatwave.[11] Cost remains a barrier for many. One survey of New Yorkers found that 24% of respondents infrequently or never used their air conditioners because of utility bill costs.[12]
Cooling Centers: Lifelines for Heat Relief
Cooling centers provide life-saving places for people to cool down from extreme heat. In NYC, cooling centers are designated facilities, such as libraries and senior centers, that provide air-conditioned spaces open to the public during heat emergencies. Because the vast majority of heat stroke deaths tend to occur at home, cooling centers are vital public resources in hot weather.[13] As Eric Klinenberg’s classic investigation into the 1995 Chicago heat wave shows, vulnerability to deadly heat is exacerbated by fraying social networks that characterize modern urban life.[14] Government intervention and community infrastructure like cooling centers are essential to breaking through the isolation that risks the lives of our neighbors.
NYC Emergency Management (NYCEM), which oversees the City’s cooling center activations, publishes an interactive online map of cooling centers when there is a heat emergency. Cooling center information is otherwise unavailable outside of heat emergencies. According to NYCEM, cooling center locations and hours may change at any time during a heat emergency or year-to-year, due to planned or unexpected disruptions like construction or broken air conditioners.
Analysis of Cooling Center Equity in NYC
This report analyzes cooling center access across New York City during the seven-day heat wave that lasted from July 19 to July 25, 2022. The data underlying this report come from information downloaded from the City’s Cooling Center Finder as of July 20, 2022, which included 542 cooling centers. There is limited publicly available information about how the City identifies cooling center locations, including how various factors are weighed in cooling center site selection. The NYC Comptroller’s Office sought to assess the distribution of cooling centers using the information available on the Cooling Center Finder. While this analysis reflects a snapshot in time and does not account for changes that may have occurred throughout the weeklong heat wave, it helps paint a picture of how well different communities were served by cooling centers across geography, race and ethnicity, age, and other characteristics.
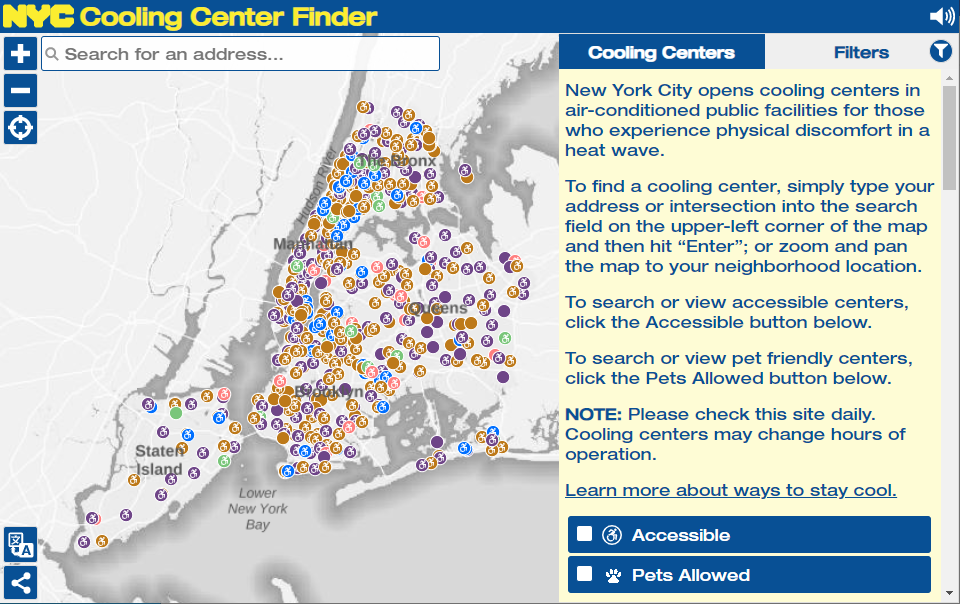
NYC Cooling Center Finder Website
Geographic Distribution of Cooling Centers
New York City’s 542 cooling centers were not equally distributed across the five boroughs. Accounting for population size, Queens had the lowest number of cooling centers per 100,000 people (5.0), while Manhattan had the highest (7.1) (see Figures 1-2).
Figure 1: Number of Cooling Centers by Borough
Figure 2: Cooling Centers per 100,000 People by Borough
Although Staten Island has the fewest cooling centers and ranks second behind Queens on a per capita basis, Staten Island has the lowest heat vulnerability of all five boroughs, in part because rates of home ownership are relatively high, and residents are more likely to have access to air conditioning.
Figure 3: Cooling Center Locations and Neighborhood Heat Vulnerability Index
Cooling Centers in Heat-Vulnerable Communities
The NYC Heat Vulnerability Index (HVI) is a measure of risk of heat-related illness or death in neighborhoods across NYC. HVI uses a statistical model to estimate heat risk based on social and environmental factors of surface temperature, green space, access to home air conditioning, and percentage of low-income and Black residents. Those factors are combined to produce a score of each neighborhood from 1 (lowest heat risk) to 5 (highest heat risk).[15]
To identify the neighborhoods most underserved by current cooling centers, the Comptroller’s Office first calculated the number of cooling centers per 100,000 people and identified the HVI scores for each of NYC’s 59 Community Districts. The top 10 neighborhoods with the highest heat vulnerability (HVI 4 and 5) and lowest number of cooling centers per 100,000 people are identified in Figure 4 below. A full table of each neighborhood’s cooling centers per 100,000 people and HVI scores can be found in the Appendix.
Figure 4: Top 10 Heat-Vulnerable Neighborhoods Most Underserved by Cooling Centers
| Neighborhood | Borough | HVI | Cooling Centers | Population (2020) | Cooling Centers Per 100,000 People |
| East Flatbush | Brooklyn | 5 | 2 | 162,446 | 1.2 |
| Elmhurst and Corona | Queens | 4 | 4 | 181,025 | 2.2 |
| Kingsbridge Heights and Bedford | Bronx | 4 | 4 | 146,813 | 2.7 |
| Kew Gardens and Woodhaven | Queens | 4 | 5 | 152,839 | 3.3 |
| Crown Heights and Prospect Heights | Brooklyn | 4 | 4 | 108,259 | 3.7 |
| Borough Park | Brooklyn | 4 | 9 | 205,377 | 4.4 |
| South Crown Heights and Lefferts Gardens | Brooklyn | 4 | 5 | 102,000 | 4.9 |
| Bedford Stuyvesant | Brooklyn | 5 | 9 | 174,960 | 5.1 |
| Fordham and University Heights | Bronx | 5 | 7 | 132,584 | 5.3 |
| Highbridge and Concourse | Bronx | 5 | 8 | 150,436 | 5.3 |
Of all the neighborhoods across the city, East Flatbush stood out as having the most significant cooling center disparity, with the fewest number of cooling centers. Despite being a large neighborhood with extremely high heat vulnerability (HVI 5), East Flatbush only had two open cooling centers available to its 162,400 residents, 85% of whom are Black New Yorkers. In comparison, Lower East Side/Chinatown and Williamsbridge/Baychester share similarly sized populations and face moderate heat vulnerabilities (both HVI 3), but had 11 and 6.7 cooling centers, respectively.
The neighborhood with the highest number of cooling centers per 100,000 people was Brownsville (HVI 5), with 17.3 cooling centers. East Harlem (HVI 4) and Midtown (HVI 3) followed, with 13.5 and 12.6 cooling centers per 100,000 people, respectively.
The number of cooling centers per 100,000 people citywide was 6.2.
Cooling Center Facilities
The Cooling Center Finder identified six types of cooling center facilities: community centers, senior centers, Cornerstone Programs[16] (hosted at NYCHA community centers), libraries, schools, and other. However, no school facilities appeared on the map as activated cooling centers.
Figure 6: Cooling Centers by Facility Type
Nearly half of the City’s activated cooling centers were senior centers, which are only open to people over 60 years old. Of the 254 senior cooling centers, 56% (177 centers) did not offer extended hours and 22% (54 centers) did not have wheelchair access. In comparison, 16% of total cooling centers were not wheelchair accessible.
The prioritization of cooling centers for older adults appropriately recognizes the significantly heightened heat risks faced by elderly people. However, the restriction of children and younger adults from half of all available cooling centers can create limitations for older adults who are caregivers for children, or intergenerational families seeking cooling center access together.
Sixteen of the 17 cooling centers categorized as “Other” were Petco stores, designated as pet-friendly cooling facilities.
The Cooling Center Finder provided no information about Covid-safe or social distancing protocols.
This report does not assess the qualitative conditions of cooling centers, due to a lack of available data. Further qualitative analysis would be needed to evaluate the accessibility, cleanliness, staffing, and other operational conditions of cooling center facilities. The 2021 Cooling Center Audit developed by WeACT for Environmental Justice provides a useful model for how to conduct on-the-ground assessments of cooling center operations to ensure that cooling centers meet the needs of the communities they serve.[17]
Hours of Operation
The daily hours of operation varied from site to site. The vast majority (82%) of cooling centers opened on weekdays before 10:00 am. Although the hottest time of day typically falls between 3:00-4:00 pm, about 30% of centers had early weekday closures before 4:00 pm.
Hot nighttime temperatures can be just as dangerous as daytime highs. When nighttime temperatures do not drop below 80°F,[18] as was the case for some nights during the July 2022 heatwave,[19] people are not able to cool down from the day. While 11% of sites had evening hours of operation from 6:00-11:00 pm, two-thirds of the locations did not offer any extended hours at all.
Moreover, half the cooling centers (268 facilities) were listed as being closed on Saturday and 83% (450 facilities) were listed as being closed on Sundays—even while the July 2022 heat emergency spanned the course of a weekend. These limitations will increasingly pose challenges for New Yorkers seeking relief from heat as the frequency and duration of heat waves increase.
Recommendations
Short-Term Actions
Some near-term actions should be taken to improve the accessibility of cooling centers that can significantly reduce heat risks for New Yorkers.
- Increase the number of cooling center locations in the most underserved neighborhoods, starting with East Flatbush. This analysis illustrates significant disparities in the number of cooling centers based on heat vulnerability and population size. It is worth noting that a handful of heat-vulnerable neighborhoods (Brownsville, Central Harlem, Mott Haven/Melrose, and East Harlem) are relatively well-served by cooling centers. This should not be the exception, but rather, the norm. The City should ensure that each neighborhood has equitable access to a network of cooling centers that reflects its heat vulnerability and population size. The City should prioritize efforts to increase cooling center locations in neighborhoods with the highest heat vulnerability, starting with East Flatbush as the neighborhood with greatest need for more cooling center locations.
- Identify new cooling center siting options, especially in underserved neighborhoods. Neighborhoods that have faced legacies of historic disinvestment may not have sufficient cooling center sites available, such as libraries, senior centers, community centers, or Cornerstone Programs. If lack of existing community facilities is a barrier, the City should explore partnerships with other types of facilities, such as houses of worship, schools (identified as a cooling center facility type but had none listed as open), and potentially private establishments that are able and willing to provide free, air-conditioned spaces. The City’s existing diversity of facilities provide precedent for different partnership types. All new cooling centers should be fully equipped with appropriate resources and information—especially those not owned or operated by the City—to be able to properly serve New Yorkers during heat advisories.
- Establish outdoor cooling stations. While air-conditioned indoor spaces provide the best guarantee for cooling down, the City should also deploy additional cooling interventions in public spaces. One innovative example was Refreshing Waters, a temporary outdoor cooling center installed in Hunts Point in 2020.[20] Designed in partnership between Southeast Bronx Community Organization, Interboro Partners, and DOHMH, the site provided outdoor fans, overhead water sprays, and seating in the pedestrian plaza on Tiffany Street next to the Hunts Point Library. The outdoor cooling center provided a comfortable, Covid-safe area using relatively low-tech, flexible, and inexpensive equipment that can easily be replicated in other neighborhoods across the city. Such outdoor cooling measures are also common in public plazas and parks across the Southeast.
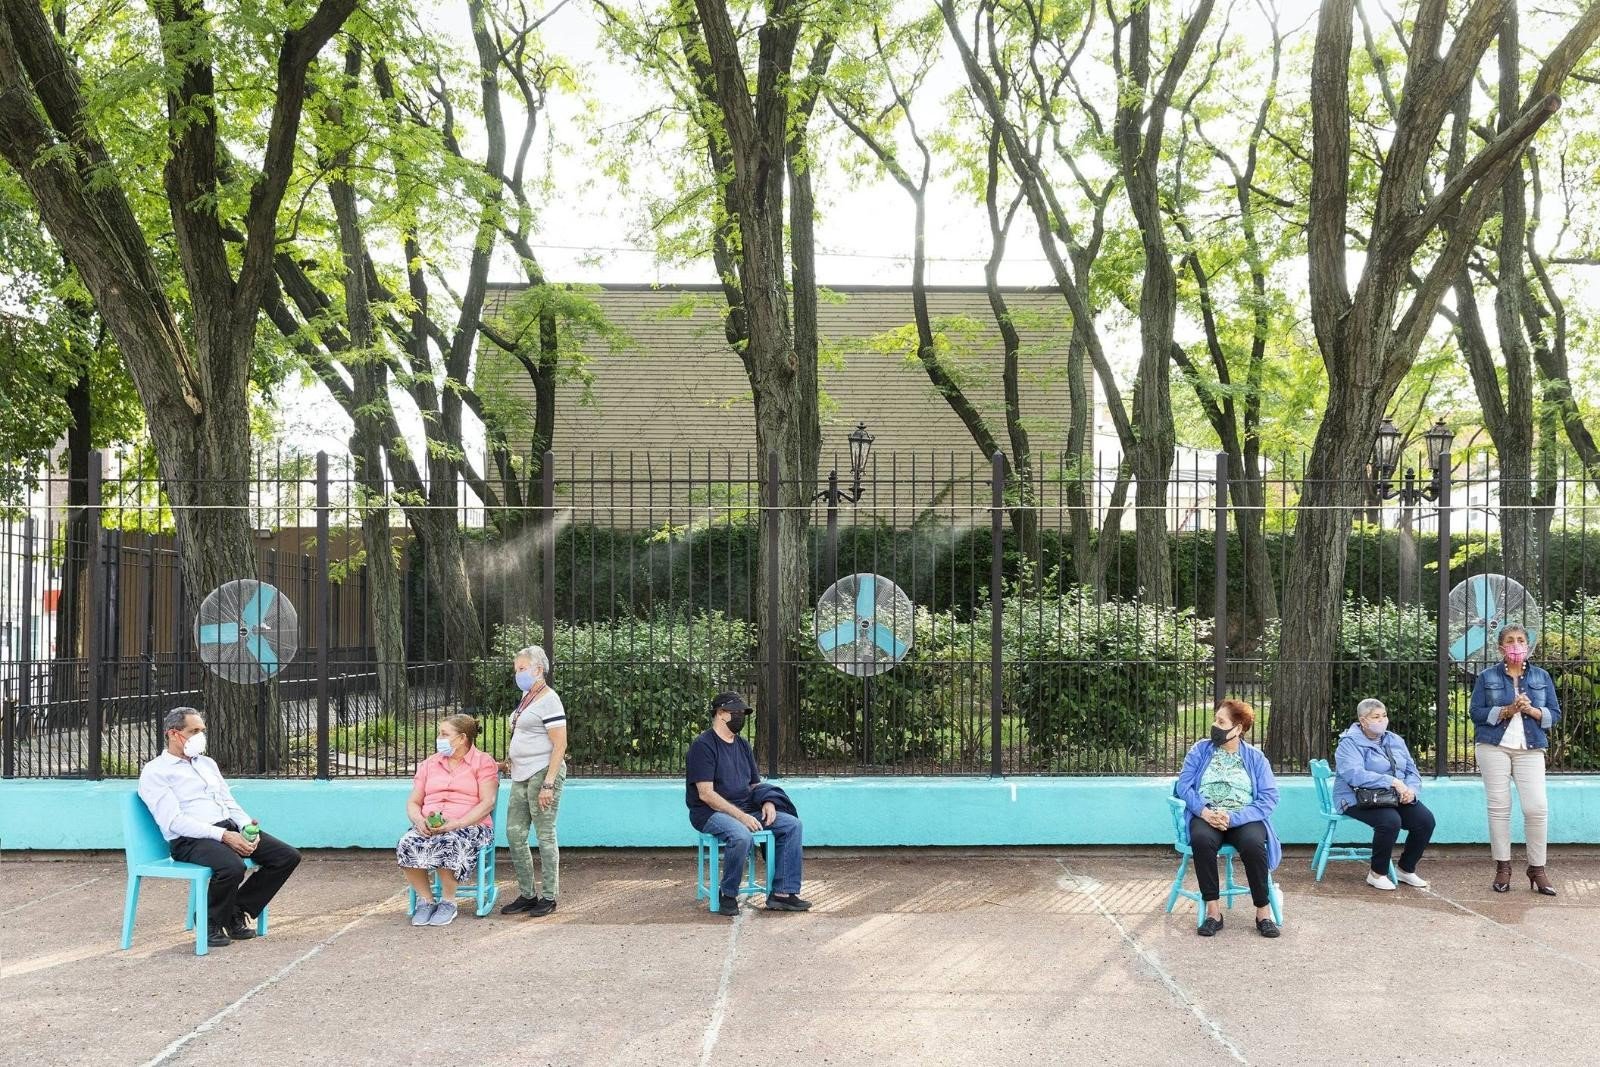
Photo of Refreshing Waters outdoor cooling station in Hunts Point. Photo Credit: Dean Kaufman
This type of program would enhance the City’s existing outdoor cooling initiatives. The NYC Parks Cool It! Program offers spray showers, pools, and drinking fountains in parks across NYC, and turns on sprinklers on days above 80°F.[21] In addition, the NYC Department of Environmental Protection (DEP) Water on the Go program brings portable drinking water fountains to different neighborhoods, particularly in areas with high foot traffic like Grand Army Plaza and Union Square.[22]
- Increase extended and weekend hours, especially in heat-vulnerable neighborhoods. NYC is already experiencing record high temperatures, and longer and more frequent heat waves. In anticipation that extreme heat will only worsen with climate change, the City should proactively identify the funding and staffing resources needed to allow more cooling centers to operate with extended hours on weekends and evenings to better serve the needs of people across the city.
- Make cooling center information permanently available to enable proactive emergency planning. The NYC Cooling Center Finder only displays information when the City has declared a heat emergency that triggers the activation of cooling centers. New Yorkers cannot find any information about cooling centers outside of that time period, even in the days leading up to an anticipated heat wave.
While it is understandable that NYCEM wants to ensure accuracy of information and avoid confusion if cooling center locations or hours change, it makes it difficult for New Yorkers to prepare for heat waves in advance. Emergency preparedness best practices call for developing household and community plans in advance so that people are equipped during emergency situations. Heat waves are no exception. Advanced planning for logistics and transportation is especially important for New Yorkers with disabilities or responsibilities for child and elder care.Other New York cities, including Albany, Rochester, Syracuse, and Ithaca, publicize cooling center locations outside of emergency heat declarations.[23] The City of New York should follow suit. Identifying even just a subset of facilities that can commit to serving as permanent cooling centers would better prepare New Yorkers for upcoming heat waves.
Long-Term Actions
In addition to these near-term improvements, the City should also take further steps to mitigate heat risks and improve long-term heat resiliency across the five boroughs. The recommendations below augment the strategies outlined in WeACT’s Extreme Heat Policy Agenda released in 2022, which calls for policy action, legislative reforms, and improved communications about heat risk to respond to the growing threats of extreme heat.[24]
- Ensure all cooling centers are wheelchair accessible. The City should invest in ramps or elevators in community facilities that serve as cooling centers so that all people who use wheelchairs, walkers, and strollers can access those spaces safely. The City should prioritize such wheelchair accessibility improvements in senior centers.
- Transition to more sustainable cooling systems. While air conditioning can be lifesaving during deadly heat waves, the city should look toward cleaner long-term solutions for cooling. Heat pumps and building efficiency retrofits can provide more efficient cooling in line with city and state climate and decarbonization goals. Because such improvements will take time to implement across community facilities, it is imperative that the City start planning for the transition of cooling technologies early. In addition to building-level improvements, the City should also permit cooling assistance programs like HEAP to be used toward more sustainable cooling measures.
- Reduce urban heat island effect with more green spaces and cool pavements in heat-vulnerable neighborhoods. Tree plantings,[25] community gardens,[26] and vegetative cover are some of the most effective interventions for reducing surface temperatures in a neighborhood. The City must increase efforts to green public spaces, especially in heat-vulnerable communities. Street reconstruction projects present the opportunity to add street trees and green infrastructure to the public right-of-way. These improvements can leverage federal funding through the newly created PROTECT and Healthy Streets Programs, established in the 2021 Infrastructure Investment and Jobs Act (IIJA), that support green infrastructure and heat mitigation for complete and resilient streets.Lighter colored pavements, roofs, and building materials also cool built environments by reflecting, instead of retaining, heat. The 2017 Cool Neighborhoods NYC report set the framework for several heat resiliency initiatives, including the CoolRoofs program to transform blacktop asphalt roofs into reflective, energy-efficient, and heat-resilient rooftops.[27] The City should go even further by installing cool pavements on city streets. Transportation land uses make up 30% of New York City. Transforming asphalt streets and parking lots to cooler pavements would go a long way in combatting urban heat island effect. Following examples of similar programs in Los Angeles[28] and Phoenix,[29] the NYC Department of Transportation should conduct an initial cool streets pilot program to determine the paving materials, sealants, or colors most suitable to NYC’s uniquely dense streetscape conditions and seasonal weather variations.
In addition to the concrete recommendations outlined in this report, further examination of other heat mitigation efforts, such as air conditioning assistance programs and emergency communications protocols, can help identify broader improvements that the city can undertake to increase resiliency to extreme heat.
Resources to Stay Safe in the Heat
Please visit these resources to find more information about how you can keep yourself and your neighbors safe during heat waves.
- NYC Cooling Center Finder (website is only activated during a heat emergency)
- Beat the Heat resource page for extreme heat
- Heat.gov
Be sure to check in on your neighbors, especially if they are elderly and/or living alone, to make sure they are safe. Please call 911 if you or someone you know shows signs of heat illness, including headache, light headedness, muscle cramps, nausea, and vomiting.
Methodology
The New York City Comptroller’s Office downloaded publicly available data from the New York City Cooling Center Finder as of July 20, 2022, activated for the heat emergency that lasted from July 19-25, 2022. The report provides analysis for a snapshot in time, and does not reflect any changes to cooling center locations or hours that may have occurred throughout the weeklong heatwave.
The Cooling Center Finder provided a map and list of 542 activated cooling centers, alongside the facility’s address, name, phone number, facility type, daily hours of operation, extended hours, wheelchair accessibility, and pets allowed.
A sample entry from the Cooling Center Finder:
Glen Oaks Library
256-04 Union Turnpike
Queens, NY 11004
Facility Type: Library
Phone: (718) 831-8636
| Hours: | ||
| Day | Opens | Closes |
| Sunday | Closed | Closed |
| Monday | 10:00 AM | 6:00 PM |
| Tuesday | 1:00 PM | 6:00 PM |
| Wednesday | 10:00 AM | 6:00 PM |
| Thursday | 12:00 PM | 8:00 PM |
| Friday | 10:00 AM | 6:00 PM |
| Saturday | 10:00 AM | 5:00 PM |
Extended Hours: No
Wheelchair Accessible: Yes
Pets Allowed: No
These data allowed the office to calculate the percentages of cooling centers by facility type, wheelchair accessibility, and hours of operation.
Latitude and longitude coordinates were assigned to each cooling center address to create point data for the cooling center locations, organized by facility type, across the city. The point data was then spatially joined to a shapefile of NYC Community Districts to determine the number of facilities per neighborhood. A ratio of total number of facilities per 100,000 people for each neighborhood was calculated by dividing number of facilities per community district by the total population of the community district and multiplying that number by 100,000. Population data in this brief are derived from the 2020 U.S. Census through the NYC Department of City Planning’s 2020 Census data resources.
To determine neighborhoods most underserved by cooling centers, the office identified two factors for each community district: 1) cooling centers per 100,000 people in each community district, and 2) the Heat Vulnerability Index (HVI) for each community district available on the NYC health data portal.[30] The HVI uses a statistical model to provide a score for each neighborhood of 1 (lowest risk) to 5 (highest risk) based on surface temperature, green space, access to home air conditioning, and percentage of low-income and Black residents. The office identified the top 10 neighborhoods with HVI scores of 4 and 5 with the lowest number of cooling centers per 100,000 people.
The data available for this analysis only reflect basic information made available on the City’s website. The data do not provide insight about the quality or capacity of those spaces or whether they were open and accessible as advertised. Further qualitative analysis would be needed to evaluate the accessibility, cleanliness, staffing, and other operational conditions of cooling center facilities. The 2021 Cooling Center Audit developed by WeACT for Environmental Justice provides a useful model for how to conduct on-the-ground assessments of cooling center operations to ensure that cooling centers are well-run and meeting the needs of the communities they serve.[31]
Acknowledgements
This report was authored by Louise Yeung, Chief Climate Officer, Alyson Silkowski, Policy Director, and Annie Levers, Assistant Comptroller for Policy. The data analysis was led by Robert Callahan, Director of Policy Analytics, Jacob Bogitsh, Senior Policy Analyst, Iza Choudrey, Policy Intern, Nicholas Lieggi, Policy Intern, and Archer Hutchinson, Graphic Designer, who also led the design. The Office of the Comptroller recognizes and is grateful for the work done over the years by environmental justice groups, such as WeACT for Environmental Justice and the NYC Environmental Justice Alliance, to advocate for better heat resiliency for all New Yorkers.
Appendix
Below is a table of all of NYC’s 59 community districts ranked in order of greatest to lowest disparity of heat vulnerability to cooling centers per 100,000 people. Calculations of cooling centers per 100,000 people and ratio of HVI to cooling centers per 100,000 people have both been rounded for legibility. Note that one cooling center is located outside of a community district boundary.
| Neighborhood | Borough | HVI | Cooling Centers | Population (2020) | Cooling Centers Per 100,000 People |
| Bay Ridge and Dyker Heights | Brooklyn | 1 | 7 | 136,071 | 5.1 |
| Bayside and Little Neck | Queens | 1 | 8 | 122,211 | 6.5 |
| Bedford Stuyvesant | Brooklyn | 5 | 9 | 174,960 | 5.1 |
| Belmont and East Tremont | Bronx | 5 | 7 | 89,216 | 7.8 |
| Bensonhurst | Brooklyn | 2 | 6 | 198,870 | 3.0 |
| Borough Park | Brooklyn | 4 | 9 | 205,377 | 4.4 |
| Brownsville | Brooklyn | 5 | 17 | 98,506 | 17.3 |
| Bushwick | Brooklyn | 4 | 7 | 120,747 | 5.8 |
| Central Harlem | Manhattan | 5 | 16 | 130,440 | 12.3 |
| Clinton and Chelsea | Manhattan | 2 | 6 | 131,351 | 4.6 |
| Coney Island | Brooklyn | 3 | 9 | 108,905 | 8.3 |
| Crown Heights and Prospect Heights | Brooklyn | 4 | 4 | 108,259 | 3.7 |
| East Flatbush | Brooklyn | 5 | 2 | 162,446 | 1.2 |
| East Harlem | Manhattan | 4 | 17 | 125,771 | 13.5 |
| East New York and Starrett City | Brooklyn | 5 | 16 | 200,293 | 8.0 |
| Elmhurst and Corona | Queens | 4 | 4 | 181,025 | 2.2 |
| Financial District | Manhattan | 1 | 3 | 78,390 | 3.8 |
| Flatbush and Midwood | Brooklyn | 4 | 10 | 164,568 | 6.1 |
| Flatlands and Canarsie | Brooklyn | 3 | 13 | 204,095 | 6.4 |
| Flushing and Whitestone | Queens | 2 | 16 | 269,587 | 5.9 |
| Fordham and University Heights | Bronx | 5 | 7 | 132,584 | 5.3 |
| Fort Greene and Brooklyn Heights | Brooklyn | 3 | 10 | 130,021 | 7.7 |
| Greenpoint and Williamsburg | Brooklyn | 4 | 18 | 204,125 | 8.8 |
| Greenwich Village and Soho | Manhattan | 2 | 7 | 92,445 | 7.6 |
| Highbridge and Concourse | Bronx | 5 | 8 | 150,436 | 5.3 |
| Hillcrest and Fresh Meadows | Queens | 1 | 7 | 161,402 | 4.3 |
| Hunts Point and Longwood | Bronx | 5 | 3 | 54,454 | 5.5 |
| Jackson Heights | Queens | 3 | 8 | 179,134 | 4.5 |
| Jamaica and Hollis | Queens | 5 | 17 | 256,278 | 6.6 |
| Kew Gardens and Woodhaven | Queens | 4 | 5 | 152,839 | 3.3 |
| Kingsbridge Heights and Bedford | Bronx | 4 | 4 | 146,813 | 2.7 |
| Long Island City and Astoria | Queens | 2 | 12 | 196,803 | 6.1 |
| Lower East Side and Chinatown | Manhattan | 3 | 18 | 163,141 | 11.0 |
| Midtown | Manhattan | 3 | 8 | 63,600 | 12.6 |
| Morningside Heights and Hamilton Heights | Manhattan | 3 | 8 | 110,458 | 7.2 |
| Morris Park and Bronxdale | Bronx | 4 | 7 | 119,666 | 5.8 |
| Morrisania and Crotona | Bronx | 5 | 6 | 93,755 | 6.4 |
| Mott Haven and Melrose | Bronx | 5 | 12 | 100,929 | 11.9 |
| Park Slope and Carroll Gardens | Brooklyn | 2 | 9 | 113,933 | 7.9 |
| Parkchester and Soundview | Bronx | 4 | 11 | 188,249 | 5.8 |
| Queens Village | Queens | 3 | 9 | 199,218 | 4.5 |
| Rego Park and Forest Hills | Queens | 1 | 8 | 120,955 | 6.6 |
| Ridgewood and Maspeth | Queens | 1 | 7 | 178,178 | 3.9 |
| Riverdale and Fieldston | Bronx | 1 | 11 | 106,924 | 10.3 |
| Rockaway and Broad Channel | Queens | 3 | 13 | 124,173 | 10.5 |
| Sheepshead Bay | Brooklyn | 2 | 14 | 169,632 | 8.3 |
| South Beach and Willowbrook | Staten Island | 1 | 7 | 140,795 | 5.0 |
| South Crown Heights and Lefferts Gardens | Brooklyn | 4 | 5 | 102,000 | 4.9 |
| South Ozone Park and Howard Beach | Queens | 2 | 4 | 129,411 | 3.1 |
| St. George and Stapleton | Staten Island | 2 | 12 | 189,663 | 6.3 |
| Stuyvesant Town and Turtle Bay | Manhattan | 2 | 6 | 155,614 | 3.9 |
| Sunset Park | Brooklyn | 2 | 6 | 133,230 | 4.5 |
| Throgs Neck and Co-op City | Bronx | 2 | 14 | 130,763 | 10.7 |
| Tottenville and Great Kills | Staten Island | 1 | 9 | 164,723 | 5.5 |
| Upper East Side | Manhattan | 1 | 8 | 231,983 | 3.4 |
| Upper West Side | Manhattan | 1 | 11 | 222,129 | 5.0 |
| Washington Heights and Inwood | Manhattan | 1 | 12 | 180,206 | 6.7 |
| Williamsbridge and Baychester | Bronx | 3 | 11 | 163,489 | 6.7 |
| Woodside and Sunnyside | Queens | 3 | 3 | 137,981 | 2.2 |
| New York City (Total) | — | — | 542 | 8,803,220 | 6.2 |
Endnotes
[1] National Weather Service (2021). Weather Related Fatality and Injury Statistics. https://www.weather.gov/hazstat/
[2] NYC Department of Health (2022). 2022 New York City Heat-Related Mortality Report. https://nyccas.cityofnewyork.us/nyccas2022/report/1
[3] Annals of the New York Academy of Sciences (2015). New York City Panel on Climate Change Report. https://nyaspubs.onlinelibrary.wiley.com/doi/10.1111/nyas.12586
[4] NYC Mayor’s Office of Resiliency (2020). Climate Resiliency Design Guidelines, Version 4.0. https://www1.nyc.gov/assets/orr/pdf/NYC_Climate_Resiliency_Design_Guidelines_v4-0.pdf
[5] Scientific American (2016). New York City Could See Thousands of Heat Deaths by 2080. https://www.scientificamerican.com/article/new-york-city-could-see-thousands-of-heat-deaths-by-2080/
[6] Cool Neighborhoods NYC: A Comprehensive Approach to Keep Communities Safe in Extreme Heat (2017). https://www1.nyc.gov/assets/orr/pdf/Cool_Neighborhoods_NYC_Report.pdf
[7] NYC Department of Health (2022). 2022 New York City Heat-Related Mortality Report. https://nyccas.cityofnewyork.us/nyccas2022/report/1
[8] New York Times (2020). How Decades of Racist Housing Policy Left Neighborhoods Sweltering. https://www.nytimes.com/interactive/2020/08/24/climate/racism-redlining-cities-global-warming.html
[9] NYC Department of Health (2022). 2022 New York City Heat-Related Mortality Report. https://nyccas.cityofnewyork.us/nyccas2022/report/1
[10] ibid
[11] New York Post (July 24, 2022). “NY cooling program has stopped taking new applications despite heatwave.” https://nypost.com/2022/07/24/chuck-schumer-says-ny-cooling-program-has-stopped-taking-new-applications-amid-heatwave/.
[12] Madrigano, Jamie, Kathryn Lane, Nada Petrovic, Munerah Ahmed, Micheline Blum, and Thomas Matte (2017). “Awareness, Risk Perception, and Protective Behaviors for Extreme Heat and Climate Change in New York City,” International Journal of Environmental Research and Public Health, Vol. 15, No. 7. https://www.ncbi.nlm.nih.gov/pmc/articles/PMC6069135/
[13] Center for Disease Control and Prevention Morbidity and Mortality Weekly Report (2013). “Heat Illness and Deaths – New York City, 2000-2011.”
[14] Klinenberg, Eric (2015). Heat Wave: A Social Autopsy of Disaster in Chicago. The University of Chicago Press.
[15] Department of Health and Mental Hygiene, Environment and Health Data Portal. https://a816-dohbesp.nyc.gov/IndicatorPublic/VisualizationData.aspx?id=2411,719b87,107,Summarize.
[16] NYC Department of Youth & Community Development. Cornerstone Programs. https://www1.nyc.gov/site/dycd/services/after-school/cornerstone.page
[17] WeACT for Environmental Justice (2021). A Call for NYC Cooling Center Improvements. https://www.weact.org/wp-content/uploads/2022/06/WE-ACT-2021-Cooling-Center-Report.pdf
[18] The Weather Channel (2019). Nights Can Be More Deadly than Daytime During a Heat Wave. https://weather.com/health/news/nights-deadly-dangerous-heat-wave
[19] National Weather Service (2022). NOWData: NOAA Online Weather Data for NY-LaGuardia AP Area, Daily Data for a Month for July 2022. https://www.weather.gov/wrh/Climate?wfo=okx
[20] Interboro (2020). The Refreshing Waters: An Outdoor Cooling Station for Tiffany Street Plaza in the Bronx. https://www.interboropartners.com/projects/the-refreshing-waters
[21] NYC Parks. Cool It! NYC. https://www.nycgovparks.org/about/health-and-safety-guide/cool-it-nyc#:~:text=to%20Stay%20Cool-,Cool%20It!,heat%20illness%20and%20even%20death
[22] NYC Department of Environmental Protection. Water On the Go. https://www1.nyc.gov/site/dep/whats-new/water-on-the-go.page
[23] New York State Department of Health. Cooling Centers. https://apps.health.ny.gov/statistics/environmental/public_health_tracking/tracker/#/CCMap
[24] WeACT for Environmental Justice (2022). Extreme Heat Policy Agenda. https://www.weact.org/wp-content/uploads/2022/06/WE-ACT-2022-Extreme-Heat-Policy-Agenda.pdf
[25] U.S. Environmental Protection Agency (2022). Using Trees and Vegetation to Reduce Heat Islands. https://www.epa.gov/heatislands/using-trees-and-vegetation-reduce-heat-islands#:~:text=Trees%20and%20other%20plants%20help,to%20reduce%20urban%20heat%20islands.&text=Trees%20and%20vegetation%20lower%20surface,providing%20shade%20and%20through%20evapotranspiration.
[26] New York Times (2022). Extreme Weather Is Soaking New York City. Community Gardens Can Help. https://www.nytimes.com/2022/07/27/nyregion/community-gardens-nyc.html
[27] NYC Department of Small Business Services. NYC CoolRoofs. https://www1.nyc.gov/nycbusiness/article/nyc-coolroofs
[28] City of Los Angeles (2021). Mayor Garcetti Kicks Off Second Phase of ‘Cool Streets L.A.’ Program. https://www.lamayor.org/mayor-garcetti-kicks-second-phase-cool-streets-la-program#:~:text=LOS%20ANGELES%20%E2%80%94%20Mayor%20Eric%20Garcetti,Los%20Angeles’%20hottest%20residential%20areas
[29] City of Pheonix. Cool Pavement Program. https://www.phoenix.gov/streets/coolpavement
[30] NYC Department of Health and Mental Hygiene. Environment & Health Data Portal: Heat Vulnerability Index. https://a816-dohbesp.nyc.gov/IndicatorPublic/VisualizationData.aspx?id=2191,719b87,107,Summarize
[31] WeACT for Environmental Justice (2021). A Call for NYC Cooling Center Improvements. https://www.weact.org/wp-content/uploads/2022/06/WE-ACT-2021-Cooling-Center-Report.pdf