
Executive Summary
Good governance requires planning for future economic cycles so that public services are not interrupted or degraded during times of fiscal stress. One crucial element of such planning is the establishment of long-term financial reserves that can be funded during times of growth and drawn upon when revenues decline. Budgetary reserves stabilize government finances during economic downturns and other crises, helping to prevent drastic cuts to public services in times when they are needed most. Accumulating a robust fiscal cushion is essential to New York City’s budget and fiscal health and to the safety and well-being of its residents.[1]
Yet, because of strict budgeting standards contained in State law, the City of New York could not explicitly create a fund to smooth revenue fluctuations until a 2019 Charter amendment and 2020 State legislation authorized creation of the Revenue Stabilization Fund (RSF), also known as the Rainy Day Fund. Prior to this change, the City used its Retiree Health Benefits Trust (RHBT) for longer-term revenue stabilization.
Establishing the new RSF was an important shift that allows the City to accumulate savings to address the volatility of its revenues. However, there is currently no target size for the Fund, guidelines for annual deposits, or conditions for withdrawals. Absent an explicit, formally adopted set of guidelines, the Rainy Day Fund will continue to be subject to the vicissitudes of the annual budget adoption process, which has historically tended to prioritize short-term needs over long-term ones. This report contains quantitative analysis and recommendations to inform such a policy.
Our recommendations are:
- The City should adopt a formal, long-term policy that establishes rule-based guidelines for the target size of the Revenue Stabilization Fund, annual deposits into the fund, and conditions for withdrawal. Such a policy could be required by State or Local Law. As part of the annual budget process, the Office of Management and Budget, the Comptroller’s Office, and the other fiscal monitors would then report on whether the City’s budgetary actions conform to the policy.
- To stabilize tax revenues for the full length of an average recession,[2] the City should set a target of 16% of its taxes deposited into the Revenue Stabilization Fund. A lower-level target of 10% of taxes would stabilize tax revenue for 2 years into a recession. We estimate that, based on the Executive Budget proposed by the Mayor in April and without any additional deposit, the RSF and the Retiree Health Benefit Trust combined will achieve a balance of $5.1 billion[3] at the end of FY 2022 or 7.3% of tax revenues.
- The minimum annual deposit into the RSF should be based on revenue growth in the City’s “non-property taxes” (all taxes other than the property tax, including the personal income tax, sales tax, business taxes and others). Specifically, the minimum deposit should be 50% of the difference between current-year growth of non-property tax revenues and their average growth over the previous 6 years.[4] Because these taxes tend to fluctuate year-to-year more than property taxes, excess revenues here can more readily be committed to long term savings. This rule, which follows a best practice established in the constitution of the Commonwealth of Virginia, would have harnessed the City’s tax volatility during the last economic recovery and brought the revenue stabilization reserves within the suggested range.
- Based on this annual deposit formula, the City should deposit $2.5 billion in the RSF for FY 2022, $1.8 billion above the $700 million already scheduled in the Executive Budget. There are several additional reasons why this amount is appropriate. First, we estimate that FY 2022 non-property taxes will be $3.0 billion above the City’s latest projections. Second, while non-property taxes are expected to grow 14.7% in FY 2022, the economic risks from high inflation, tighter monetary policy, declining asset prices, and the conflict in Ukraine point toward a drop in non-tax revenues in FY 2023 and the potential for a recession. An additional deposit of $1.8 billion would bring the combined balance of RSF and RHBT to 10.0% of tax revenues.
- Return the Retiree Health Benefit Trust to its mandated purpose of stabilizing funding for retiree health and welfare benefits. In this analysis we have considered RHBT as a rainy day fund because that is how it has been used in practice. However, formally, RHBT was established to fund retiree health care and the trust documents restrict the use of amounts on deposit in the RHBT to that purpose.[5] Therefore, once its balances are drawn down and transferred to RSF in the amount chosen by the City, RHBT should be used exclusively to fund the liability deriving from the provision of retiree health benefits.
Finally, it is important to clarify that the Revenue Stabilization Fund is only one component of the City’s overall fiscal cushion. The other two critical components are reserves for unforeseen expenditures within the budget year (the General Reserve) and the yearly surplus used to balance the upcoming year’s budget (the “budget roll”). The additional funding to RSF in FY 2022 and beyond should not come at the expense of these components.
Introduction
While the Federal government can conduct counter-cyclical fiscal policy by managing its operating deficit, the City of New York, like most state and local governments, is subject to balanced budget requirements which amplify rather than dampen economic fluctuations. Therefore, the formal establishment of reserves and so-called rainy-day funds (RDFs) should be an essential part of state and local governments’ budgetary process to ensure that there are sufficient resources to withstand economic downturns and emergencies without curtailing services or raising taxes in the most fiscally challenging moments.[6]
As of this year’s Executive Financial Plan, the City plans to use a $5.3 billion surplus to cover expenses in FY 2023, to include $1.3 billion in the General Reserve and Capital Stabilization Reserve for unexpected expenses in FY 2023, and to maintain a combined balance of $5.1 billion in the Revenue Stabilization Fund (RSF) and the Retiree Health Benefits Fund (RHBT). The total of these resources is the overall size of the City’s fiscal cushion.
This report analyzes and makes policy recommendations for how much to set aside to offset the volatility of the City’s tax revenues, and how to make deposits and withdrawals for that purpose from RSF. The City should continue to accumulate budget surpluses to cover the upcoming year’s gap. However, because this happens regardless of economic recessions or expansions, this “budget roll” is not a revenue stabilization reserve. Similarly, the City should continue to budget for unforeseen expenditures in the General Reserve, Capital Stabilization Reserve and others as needed. But these are not long-term reserves that transfer revenues from recoveries to recessions. They are expenses appropriated in the budget, typically in a flat amount through the financial plan.
In 1975, New York State passed the Financial Emergency Act (FEA) which, among other provisions, requires that the City balances its operating budget based on Generally Accepted Accounting Principles (GAAP).[7] GAAP balance requires that revenues in a given year equal expenditures in the General Fund in that year, therefore barring borrowing for operating purposes. Because current-year expenditures must match current-year revenues, it was not possible to make deposits in a rainy day fund (a current-year expenditure) to be used as a future-year revenue. Nonetheless, the City was able to use GAAP budgeting rules to transfer surpluses from one year to the next for specific purposes including the pre-payment of General Obligation debt service and subsidies to entities whose budgets are outside of the City’s General Fund such as City libraries, the Health and Hospitals Corporation (H+H) and the Metropolitan Transportation Authority (MTA). Starting in FY 2003, the City also made discretionary transfers to the New York City Transitional Finance Authority (TFA) to pre-pay its debt service. In FY 2006 the City began to occasionally use bond defeasances to transfer resources from the current fiscal year to the out-years of the financial plan.[8] Even though these prepayments and subsidies reduce the City’s need to provide funds in future fiscal years, GAAP recognizes them as expenditures in the year they are made.
In November 2019, voters supported an amendment to the City Charter to allow for the establishment of a Rainy Day Fund and in 2020 State legislators amended the FEA to permit a Revenue Stabilization Fund (RSF).[9] The State legislation allowed the City to immediately deposit into the RSF the surpluses accumulated at the end of previous fiscal years for a total amount of $493 million.[10] No requirements for the size and speed of deposits into the fund are set by the City Charter, the FEA, or the 2020 State legislation. Regarding withdrawals, the state legislation provides that no more than 50 percent of the RSF can be withdrawn in any given year, unless the Mayor certifies the existence of a “compelling fiscal need, which may be based on circumstances in a national or regional recession, a reduction in total revenues from the preceding fiscal year as projected in the financial plan […], a natural or other disaster, or a declared state of emergency in the City of New York or the State of New York.”
While the establishment of RSF is a positive and a much-needed development, its framework is missing key aspects, namely:
- The fund’s target size,
- Rules and guidelines for annual deposits,
- Rules and guidelines for withdrawals.
In this report, we first describe NYC’s reserves. We then proceed to analyze the characteristics of the City’s tax revenues, propose a methodology to determine the amount needed for revenue stabilization, and simulate the effect of adopting a simple rule to determine the timing and size of minimum deposits. Finally, the report outlines principles for the withdrawal of funds.
The City’s Fiscal Cushion
The City’s fiscal cushion contains several components, as summarized in Table 1 below:
- The Revenue Stabilization Fund (RSF), also known as the Rainy Day Fund: as of the Executive Financial Plan, RSF will have a balance of approximately $1.2 billion by the end of FY 2022.
- The Retiree Health Benefit Trust (RHBT): the fund was established by Local Law 19 of 2006. The legislative intent states:[11]
“In his Fiscal 2007 Preliminary Budget the Mayor proposed the establishment of a retiree health benefits trust fund into which would be deposited money for the exclusive purpose of funding the health and welfare benefits (other than those paid through the Management Benefits Fund) of retired city employees and their dependents. The rationale behind the fund’s creation is to give the City the ability to place certain surplus and potentially non-recurring funds in fiscal years of strong revenues in trust for the purpose of irrevocably funding certain of the City’s retiree health and welfare benefit obligations.”
RHBT is part of the Other Post-Employment Benefit (OPEB) plan, and it is used to receive, hold, and disburse assets accumulated to pay for a portion of the plan.[12] The City achieves a positive trust balance by contributing resources in excess of yearly pay-as-you-go costs. The balance peaked at the beginning of FY 2020 at $4.7 billion and was lowered to $3.8 billion by the beginning of FY 2021. While the RHBT can only be used to pay for OPEB costs, the City has lowered contributions for current year expenses for retiree health care into the fund (and therefore lowered its balance) to free up resources as needed.
Formally, RHBT is a vehicle for funding the City’s OPEB liability, which was estimated to be $122.2 billion at the end of FY 2021.[13] In practice, RHBT has functioned as a rainy day fund, with the annual amount of OPEB costs ($3.1 billion in FY 2022, projected to grow to $3.8 billion by FY 2026) representing a limit on annual drawdowns. In this report, we consider RHBT part of the revenue stabilization component of the fiscal cushion, together with RSF. However, the existence of RSF makes the revenue stabilization role of RHBT superfluous and the balances in RHBT that are not intended to fund the OPEB liability should be drawn down and transferred to RSF.
- The General Reserve: this reserve is a contingency resource to be used during the fiscal year to cover additional expenses that arise beyond those identified in the budget. The FEA requires a minimum amount of $100 million. Between FY 2004 and FY 2013, the City budgeted $300 million in General Reserve at the beginning of the fiscal year. The de Blasio administration progressively lifted the amount to reach a maximum of $1.2 billion in FY 2018. To offset the initial budgetary impact of the pandemic, the beginning-year General Reserve was lowered to its minimum of $100 million in FY 2021 and was increased to $300 million in FY 2022. The FY 2023 Executive Financial Plan includes $1.06 billion in the General Reserve and $1 billion in each of the out years of the financial plan. The General Reserve is budgeted as an expense and, as such, a higher amount increases the outyear gaps.
- The Capital Stabilization Reserve: this reserve was created under the de Blasio administration to pay for capital project-related costs that could not be paid for by issuance of bonds and to protect against potential increases in debt service. In practice, this reserve has been used as an additional General Reserve and has been budgeted accordingly. The City set aside $500 million in FY 2016 and FY 2017, subsequently reduced to $250 million. Nothing was budgeted in FY 2021 and FY 2022. The FY 2023 Executive Financial Plan includes $250 million in FY 2023 and beyond.
- The “Roll” / Budget Stabilization Account (BSA): the “roll” is the current-year budget surplus used to pay the upcoming year’s expenses. Most of the amount is dedicated to prepaying debt service but has included subsidies to libraries, H+H, and the MTA, and the prepayment of OPEB costs, among others. The amount rolled into the upcoming fiscal year helps to balance the operating budget. In Table 1, the roll is shown as the surplus carried over from the previous year.
- Other budget stabilization: in order to move resources across fiscal years, and particularly at the peak of the economic expansion in 2007 and 2008, the City has resorted to bond defeasance, pre-paying debt service more than one year in advance, or delaying certain revenues under its control (e.g., tobacco settlement revenues). These amounts are reported in Table 1 in the year the savings accrued. As discussed in more detail below, the entries in FY 2009 and FY 2010 were mainly tied to surplus accumulated in FY 2007 and FY 2008 and used to defease bonds and generate debt service savings more than one year into the future
Table 1: Budgetary reserves and budget stabilization transfers FY 2003 – FY 2023
($ million)
| Fiscal Year | Revenue Stabilization (RHBT + RSF) |
General and Capital Stabilization Reserves | Roll/BSA | Other budget stabilization |
| 2003 | $0 | $200 | $681 | $0 |
| 2004 | $0 | $300 | $1,417 | $0 |
| 2005 | $0 | $300 | $1,923 | $0 |
| 2006 | $0 | $300 | $3,529 | $0 |
| 2007 | $1,001 | $300 | $3,751 | $200 |
| 2008 | $2,594 | $300 | $4,600 | $414 |
| 2009 | $2,726 | $300 | $4,635 | $675 |
| 2010 | $2,878 | $300 | $2,914 | $2,726 |
| 2011 | $3,023 | $300 | $3,646 | $0 |
| 2012 | $2,632 | $300 | $3,742 | $0 |
| 2013 | $2,116 | $300 | $2,431 | $0 |
| 2014 | $1,363 | $450 | $2,807 | $38 |
| 2015 | $2,378 | $750 | $2,006 | $99 |
| 2016 | $3,397 | $1,500 | $3,524 | $103 |
| 2017 | $4,036 | $1,500 | $4,038 | $0 |
| 2018 | $4,254 | $1,450 | $4,180 | $0 |
| 2019 | $4,466 | $1,375 | $4,576 | $0 |
| 2020 | $4,680 | $1,400 | $4,221 | $0 |
| 2021 | $4,294 | $100 | $3,819 | $0 |
| 2022 | $4,794 | $300 | $6,107 | $0 |
| 2023 | $5,057 | $1,305 | $5,272 | $0 |
Notes: Reserves and roll/BSA as of the Adopted Budget for each FY except FY 2023 which is from the Executive Financial Plan. Adjusted budget amount nets out the impact of prepayments and other prior-year actions. RHBT balance as of June 30 of the previous FY and net of prepayments earmarked for PAYGO OPEB costs. RHBT balance at the start of FY2023 includes an estimate of interest income. RSF received at creation a $493m deposit from the fund balance (which was not available for use until RSF legislation was enacted). The annual reported budget surplus of approximately $5 million at FY-close in FY2021 and FY2022 is also added to RSF. The adopted FY 2022 budget already included the appropriation of $500 million for deposit into RSF and that amount is counted as available at the beginning of FY 2022. The Executive Financial Plan added a $200 million deposit in RSF to take place at the close of FY 2022 and is counted as available at the beginning of FY 2023 in the table. Other budget stabilization includes: a) FY 2005 $200m pay-as-you-go capital spending used to prepay FY 2007 TFA debt service; b) delayed recognition of $354m of TSASC revenues until FY 2008; c) FY 2007 prepayment of debt service of $34m in FY 2009 and $31m in FY 2010; d) FY 2007 retirement of $1.254b in debt, with debt service savings of $60m in FY 2008, $641m in FY 2009, and $659m in FY 2010; e) FY 2008 retirement of $1,986b in debt, with debt service savings of $2.036b in FY 2010; f) FY 2012 prepayment of $31m of FY 2014 debt service; g) FY 2013 defeasance of $196m of TFA bonds, with debt service savings of $7m in FY 2014, $99m in FY 2015, and $103m in FY 2016. FY 2015 BSA included $77m for BARB-supported TFA debt service, which is not part of the General Fund and not included in the table. RSF first available at the start of FY 2021.
Source: NYC Comptroller Annual Comprehensive Financial Reports.
The table shows that the City started carrying a positive balance of $1 billion in RHBT in FY 2007. Before then, the City had no mechanism to transfer resources to the future but for the roll. At the beginning of FY 2008, the RHBT balance rose to $2.6 billion and remained relatively stable through FY 2011. The impact of the Great Recession is evident by looking at the drop of the roll from $4.6 billion in FY 2009 to $2.9 billion FY 2010. In FY 2009 and especially FY 2010, budget stabilization relied on measures taken to absorb the budget surplus during peak revenue years: the retirement of $1.3 billion in debt in FY 2007 and $2.0 billion in FY 2008. The savings from these actions mostly accrued in FY 2009 and FY 2010 as reported in the other budget stabilization entries in Table 1.
In FY 2020, in the immediate wake of the Covid-19 crisis, the City lowered the balance of RHBT by $1 billion and budgeted a further $1.6 billion drawdown in FY 2021. Additionally, the City lowered the General and Capital Stabilization Reserve total for FY 2021 from $1.25 billion to $100 million. In 2021, at the time of the Preliminary Financial Plan, the City planned to reduce the General and Capital Stabilization Reserve total for FY 2022 from $1.25 billion to $100 million. Subsequently, due to higher-than-expected revenues and the injection of State and Federal aid, the City rescinded the $1.6 billion RHBT drawdown, raised the General Reserve for FY 2022 to $300 million, and planned an RSF deposit of $500 million in FY 2022.[14] During the COVID recession, the City decided to draw down RHBT balances and to reduce next-year expenses by lowering the General and Capital Stabilization Reserve. However, as noted, the latter are expenditures that are appropriated in the adopted budget and therefore funded by tax revenues. They are not vehicles for carrying revenues to the future.
Sizing the RSF
In a comprehensive and influential series of reports the Pew Charitable Trusts established a best-practice approach to rainy-day funds that is widely shared among fiscal experts.[15] Specifically:
- Require regular studies to identify major sources of volatility and present appropriate policy solutions.
- Tie budget stabilization fund deposits to observed volatility.
- Set fund size targets that match the projected need during downturns.
In this and the next section we implement all three steps as they pertain to the City’s tax revenues and apply the results to RSF.
NYC has access to a broad portfolio of taxes on real property, income, and consumption.[16] To remove the effect of tax policy changes over time we build a history of Common Rate and Base (CRB) tax collections starting in FY 1985. In the appendix to this paper, we analyze the volatility of the City’s tax revenues and how sensitive they are to current economic conditions. The analysis concludes that “non-property taxes” (all taxes with the exclusion of the property tax) are the main driver of volatility.
The next step in the analysis is to estimate the size of RSF. To do this, we separate the trend underlying CRB revenues from cyclical fluctuations and calculate the cumulative amount of revenues for the period they fall below trend. We do this for both non-property and total taxes and obtain consistent results, further supporting the fact that volatility is mainly driven by non-property taxes. Figure 1 provides a stylized representation of the concept. In the figure, the yellow line represents tax revenues while the blue line is their trend (assumed constant, in the figure). The revenue loss is the area below the trend line: this is the amount to set aside in RSF to maintain revenues at their trend until full recovery.
Figure 1: Stylized example of revenue loss calculation
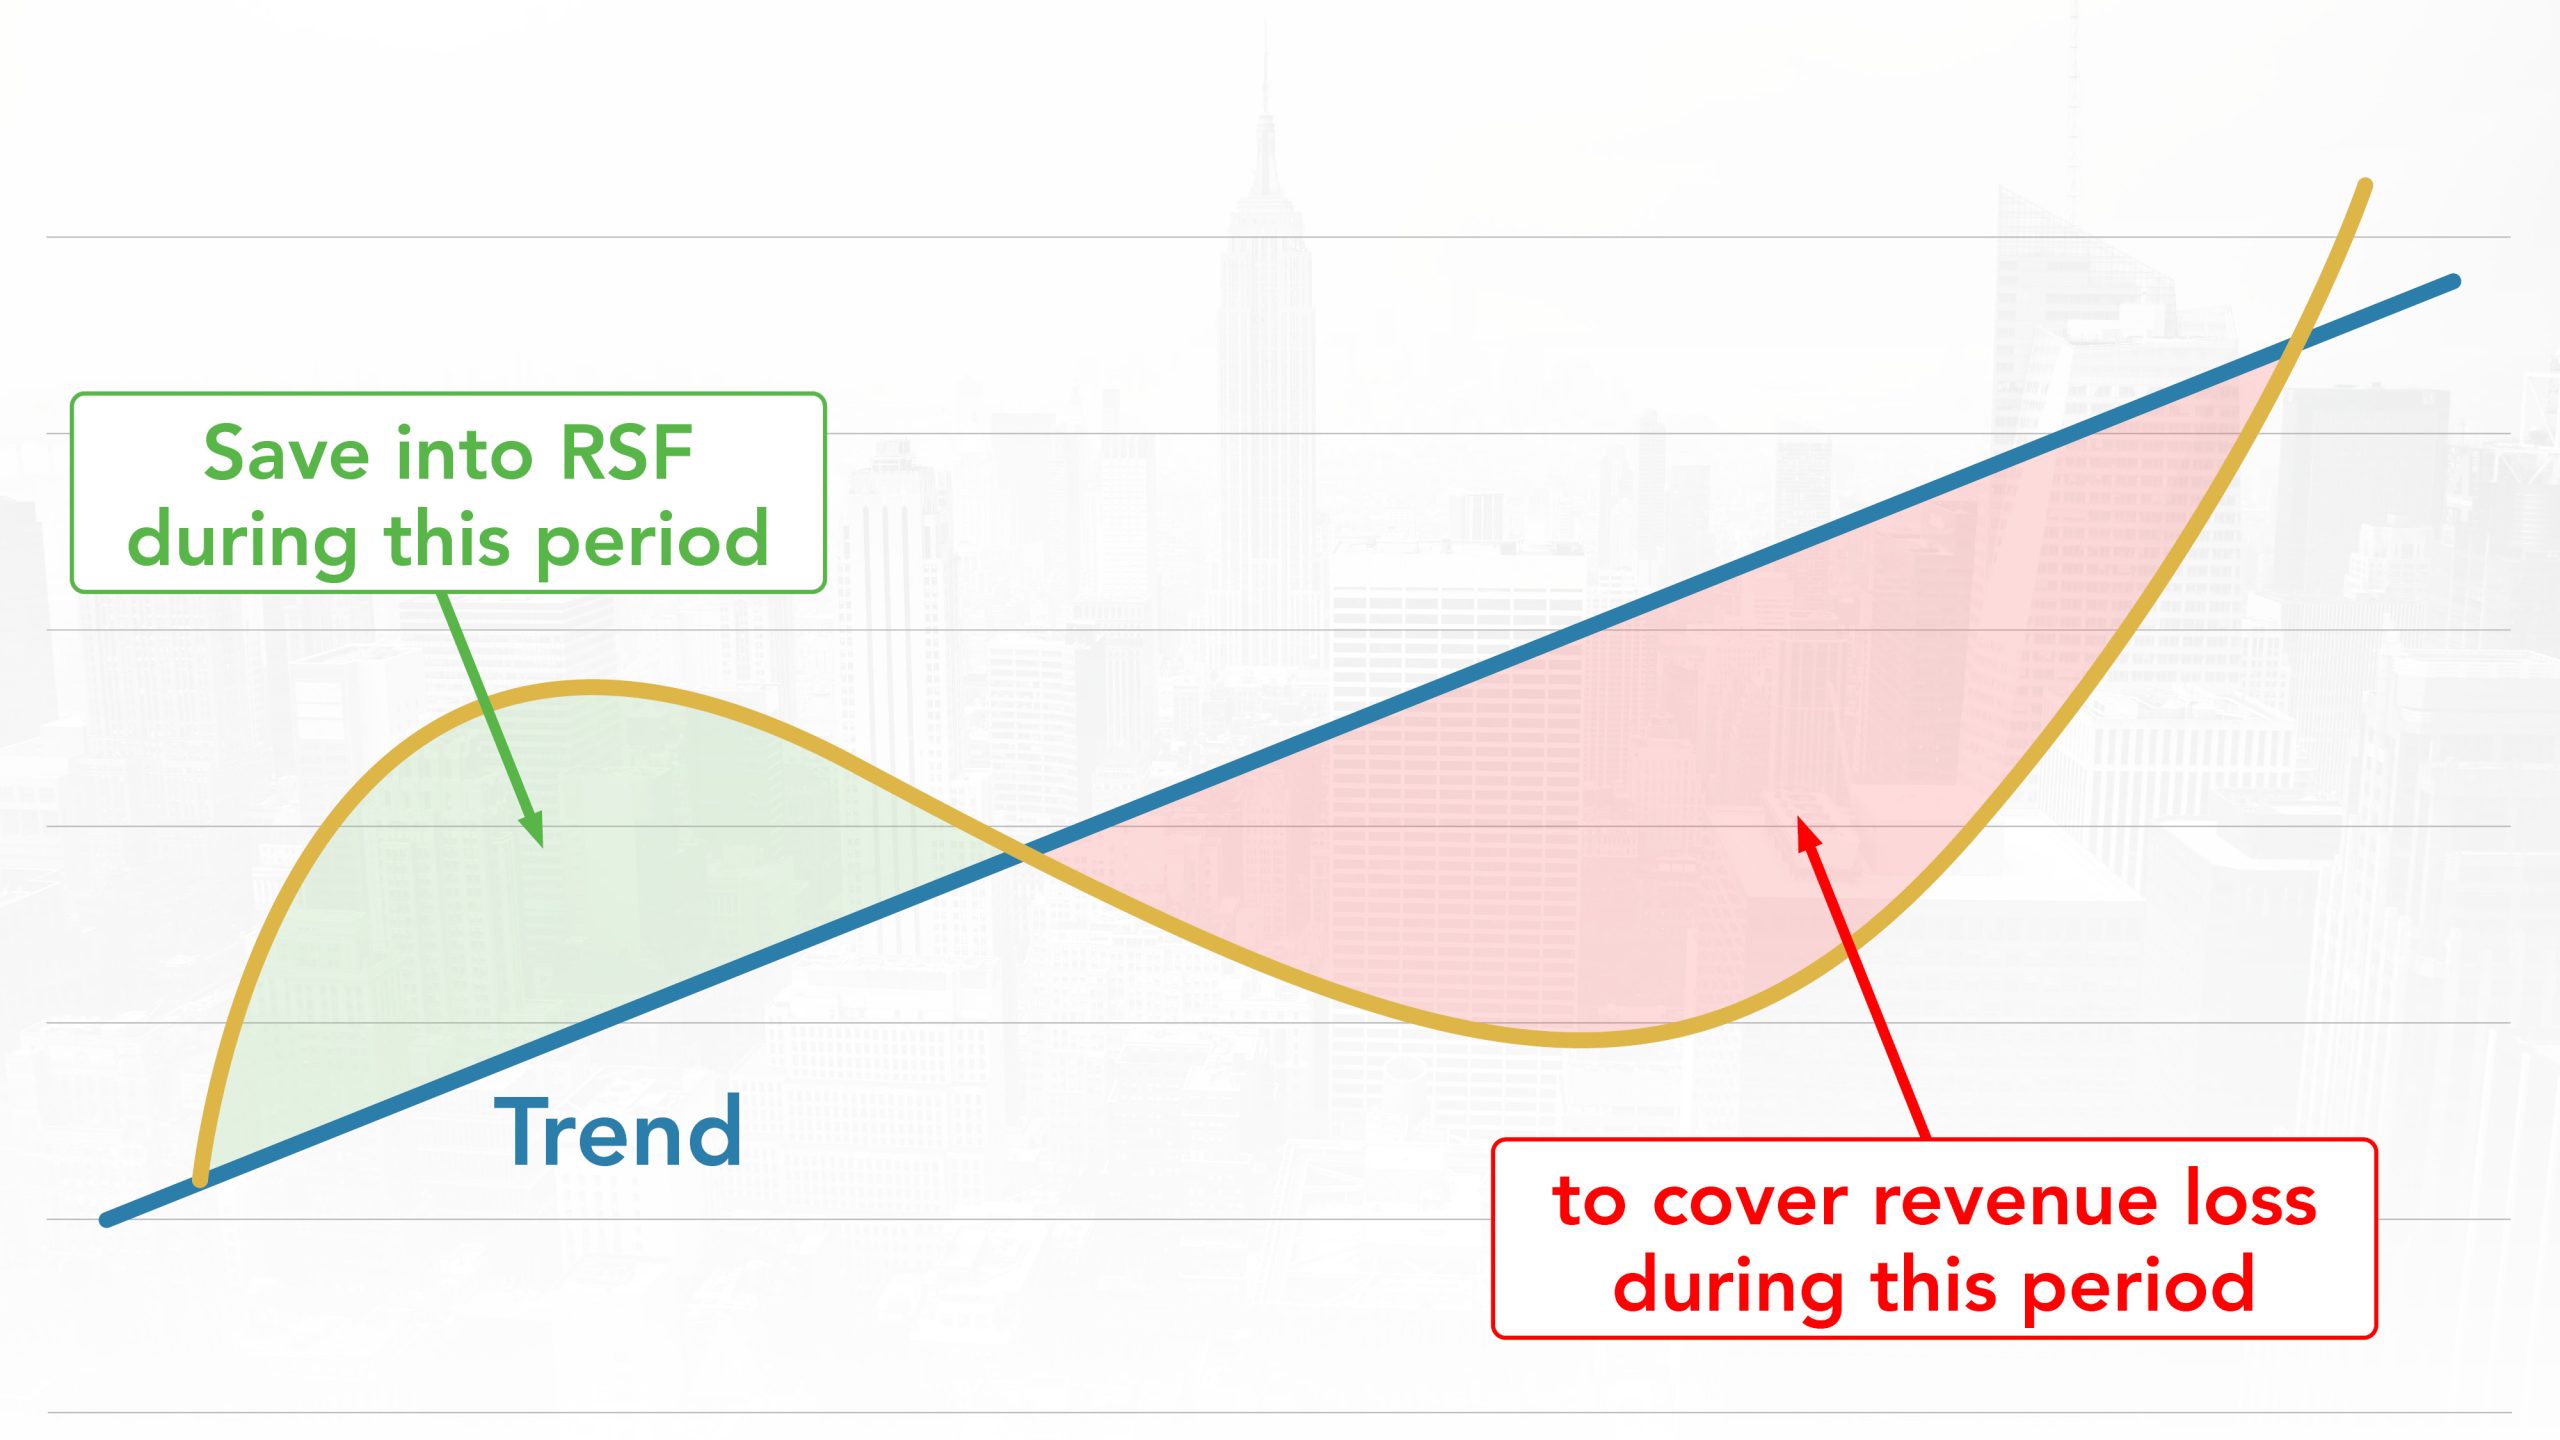
Table 2 reports the average percentage revenue loss during the two recessions in the 2000’s, which saw the City’s tax revenues dip below trend in FY 2002 and again in FY 2009. These episodes lasted three to four years.[17] In the two recessions, losses averaged 10% of tax revenues in the first two years. On the other hand, covering losses until revenues returned to their trend would have required 16% of tax revenues set aside in RSF.[18] In terms of expected FY 2022 tax revenues, this means RSF should have a balance of between $6.9 billion and $11 billion. Instead, as currently planned, the combined balance of RSF and RHBT will be $5.1 billion or 7.3% of expected FY 2022 tax revenues, as explained in more detailed in the next section.
Table 2: Average revenue loss during the 9/11 recession and the Great Recession as % of total CRB tax revenues
| Estimate based on | By year 2 | By end of period |
| Non-property CRB tax revenues | -10.2% | -16.3% |
| Total CRB tax revenues | -9.5% | -15.6% |
Note: trends are estimated using the Hodrick-Prescott filter on CRB non-property or total tax revenues FY 1985 – FY 2019. The revenue loss is given by cumulative below-trend revenues as a percentage of total CRB revenues the year before below-trend revenues started.
Source: Comptroller’s Office estimates.
A few considerations suggest that the City should target a percentage toward the higher end of the range. First, in both recessions the City benefited from Federal policies, both directly (aid tied to the 2001 terrorist attack) and indirectly (the support given to the financial industry in 2008). It is not possible to predict to what extent this may repeat in the future. Second, the City can balance its budget by raising the property tax rate, as it did in FY 2003 and FY 2009. However, in doing so, the City would be relying on a regressive tax. Third, the passage of state legislation to implement other tax policy measures is uncertain.
The City has a precedent for (implicitly) saving more than 15% of its tax revenues for use during a recession. While the percentage of tax revenues in RHBT grew to only 7.0% in FY 2008, in addition to the usual prepayments with budget surpluses, the City used FY 2007 and FY 2008 resources to retire and prepay future year debt for $1.3 billion and $2.0 billion, respectively. This provided savings almost exclusively during the recession in FY 2009 and FY 2010. Therefore, debt retirement had the same effect as rainy day fund deposits. Had the City chosen to deposit the amounts of debt retirement in RHBT, it would have grown to 15.4% of FY 2008 tax revenues.[19]
Deposits
The objective of rules is to ensure that policy making follows credible and consistent commitments over time. In the context of revenue stabilization, the objective of a rule is two-fold: to accumulate sufficient reserves during economic expansions, and to avoid depleting them outside of economic downturns or other adverse circumstances. The rule should be:
- Credible and able to achieve a target commensurate to the volatility of tax revenues,
- Counter-cyclical, so as to require deposits during economic recoveries,
- Simple, transparent, and easy to implement,
- Updated regularly.
This is no easy task. In this section we simulate a deposit rule based on actual non-property tax revenues that was implemented by the Commonwealth of Virginia and considered a best practice.[20] Specifically, the rule requires minimum deposits equal to at least 50% of the difference between current-year growth of non-property tax revenues and the average growth rate of non-property taxes in the previous six years.
Deposits should continue until the balance reaches 16% of actual current-year tax revenues to provide revenue stabilization for the duration of an average recession.[21] Table 3 reports the results of a simulation starting from FY 2011 (the first year with a deposit after the Great Recession) with a starting balance of $2.6 billion (the RHBT balance available at the start of FY 2012). In FY 2020, the counterfactual subtracts $1 billion used during the pandemic to address the COVID recession and adds $493 million as the first deposit into RSF from fund balances that could not previously be used. As a comparison, we add the actual combined balance of RHBT and RSF as a percentage of total tax revenues. FY 2022 amounts are based on the Comptroller’s Office estimate of tax revenues: $68.9 billion for total taxes and $39.2 billion for non-property taxes.
To be clear, the minimum deposit rule is one component of the deposit policy and needs to be complemented by planned deposits to reach the desired balances. But even if analyzed in isolation, the minimum deposits would have been able to rise above 10% of total tax revenues (enough to provide revenue stabilization for 2 years into a recession) and put the City on a strong path to the 16% target. Because of the volatility of non-property taxes, the rule would not have triggered a deposit in every year, but it would have been able to capture spikes like that in FY 2018 which was driven by the passage of the Tax Cuts and Jobs Act of 2017 and the repatriation of hedge funds’ offshore profits.
Table 3: Deposits based on average 6-year growth rate of non-property tax revenues
| Fiscal Year | Non-property taxes growth rate | Non-property taxes 6-year average growth rate | Deposit ($m) | Counterfactual | Actual RHBT + RSF |
|
|---|---|---|---|---|---|---|
| Balance (year-end, $m) | % of total tax revenues | % of total tax revenues | ||||
| 2011 | 11.7% | 4.5% | $844 | $3,476 | 8.6% | 6.5% |
| 2012 | 2.9% | 3.3% | $0 | $3,476 | 8.3% | 5.0% |
| 2013 | 11.6% | 2.0% | $1,291 | $4,767 | 10.4% | 3.0% |
| 2014 | 5.3% | 1.3% | $560 | $5,327 | 11.0% | 4.9% |
| 2015 | 7.8% | 2.1% | $873 | $6,200 | 11.9% | 6.5% |
| 2016 | 0.1% | 6.1% | $0 | $6,200 | 11.6% | 7.5% |
| 2017 | -1.5% | 6.6% | $0 | $6,200 | 11.3% | 7.8% |
| 2018 | 8.9% | 4.4% | $751 | $6,951 | 11.8% | 7.6% |
| 2019 | 2.8% | 5.4% | $0 | $6,951 | 11.3% | 7.6% |
| 2020 | -1.0% | 3.9% | $0 | $6,444* | 10.2% | 6.8% |
| 2021 | 2.3% | 2.8% | $0 | $6,444 | 9.8% | 7.3% |
| 2022 | 14.7% | 1.9% | $2,500 | $8,944 | 13.0% | 7.3% |
*Includes $1 billion RHBT drawdown in FY 2020 and $493 million deposit into RSF at inception. Counterfactual estimates do not include interest income. Source: Comptroller’s Office estimates.
In the last column of Table 3 we show the percentage of tax revenues held in RHBT and RSF (inclusive of this year’s planned $700 million deposit) as a percentage of total tax revenues. The data shows that the since deposits into RHBT restarted in the de Blasio administration, balances have been around 7.5% of tax revenues, except in FY 2020. Without additional contributions, RHBT and RSF are expected to have a combined balance of 7.3% of tax revenues.
The second main result in Table 3 is that FY 2022 should see a deposit of $2.5 billion or $1.8 billion above the amount already committed. There are several reasons that support this conclusion:
- We expect FY 2022 to register the highest yearly growth rate in non-property taxes in more than a decade, with income taxes reaching new peaks,
- A large amount of FY 2022 tax revenues is not accounted for in the Executive Financial Plan. We expect the City is to end FY 2022 with $3.0 billion in non-property taxes above projections,
- Non-property taxes will likely be lower in FY 2023 due to slower economic growth, tighter monetary policy, declines in the stock market, lower profits on Wall Street, and declining activity in real estate markets. Our forecast expects non-property taxes to decline -8.3% in FY 2023. Even without considering the heightened risk of recession, this is the right time to make a substantial deposit in RSF.
The rule can be easily incorporated in the budget process: at any time that the City forecast non-property tax revenues to grow above the average of the previous 6 years, the financial plan would automatically include the corresponding deposit into RSF. The current-year deposit amount would fluctuate with successive revisions to the financial plan but would ultimately be determined at the close of the fiscal year. Finally, to simplify the structure currently in place, the City could either absorb the Capital Stabilization Reserve into the General Reserve or, since it is already in each year of the financial plan, use it as a starting point for planned deposits into RSF to make progress toward the 16% target.
Withdrawals
Designing appropriate withdrawal rules from long-term reserves is just as complex. Withdrawals should be limited to recessions and extraordinary circumstances such as health and safety emergencies, and natural disasters. However, withdrawal rules cannot be so strict that they prevent the deployment of RSF in the amount needed.[22] Further complicating things is the fact that relevant economic data are not available in a timely fashion and that it is particularly difficult to predict the timing of recessions.
Because deposits need to happen before withdrawals, and because we are at a decisive moment with respect to deposits, this report focuses on the size of RSF and the rule for minimum annual deposits. Further analysis is needed to determine a full set of withdrawal conditions, and how they could be integrated in the City’s quarterly budget updates and overall budget process.
The triggers for using the funds during economic downturns should be both objective and readily available, which restricts attention to data available without lag on a monthly or quarterly basis such as:
- NYC payroll jobs data. The data are available monthly from the NYS Department of Labor[23] and can be analyzed at a quarterly cadence for year-over-year changes (using not seasonally adjusted data) and quarter-to-quarter changes (using seasonally adjusted data). In the 9/11 recession and the Great Recession, total nonfarm jobs started declining on a year-over-year basis in the first quarter of FY 2002 and the third quarter of FY 2009, respectively. On a quarter-to-quarter basis, the first declines were in the third quarter of FY 2001 and in the second quarter of FY 2009.[24] In either case, quarter-to-quarter declines appear more timely and it is reasonable to require at least two continuous quarterly declines before tapping into RSF.
- Composite local indexes of economic activity such as the NYS Index of Coincident Economic Indicators (ICEI) or a new index specific to NYC.[25] In the early 2000’s, the first year-over-year decline in quarterly ICEI data was the first quarter of FY 2002 while the first quarter-to-quarter decline was in the third quarter of FY 2001. This is the same timing derived from total nonfarm jobs. At the time of the Great Recession, the first year-over-year decline was in the second quarter of FY 2009 and the first quarter-to-quarter decline was in the fourth quarter of FY 2008.[26] Again, two consecutive quarters of decline are sufficient to allow for withdrawals from RSF. As is the case for NYC jobs data, quarter-to-quarter percentage changes give an earlier indication of recessions and can be used to formulate withdrawal rules.
- NYC non-property tax revenues, particularly those components that are more tied to real economic activity (e.g., PIT withholdings, sales tax receipts), appropriately adjusted for policy changes (e.g., excluding declines driven by tax cuts).
Another data point worth considering is US real GDP. However, there were not two consecutive declines (quarter-to-quarter or year-over-year) in correspondence with the US recession in 2001.[27] On the other hand, Gross City Product (GCP) is not a good candidate. The Bureau of Economic Analysis publishes county-level measures of GDP, which can be used to construct Gross City Product (GCP). However, the measure is published with delay relative to US GDP and only contains yearly values. For example, 2021 GDP by county will be published in December 2022. Any quarterly version of GCP is an estimate derived from other data sources and current GCP values are themselves forecasts.
Other provisions that deserve further study are caps on yearly withdrawals to avoid depleting funds too quickly, as well as the definition of procedures in case of extraordinary circumstances such as health and safety emergencies. One final aspect that could be analyzed is a requirement that withdrawals be authorized by City Council. How this requirement might be inserted in the budget process and whether it is needed and effective should be subject to further close scrutiny.
Conclusions
The creation of the Revenue Stabilization Fund in 2020 allows NYC to smooth revenue fluctuations between times of economic growth and decline. But how much to save and how? Explicit targets and the implementation of rule-based deposits and withdrawals are necessary to make the RSF a successful Rainy Day Fund that enables New York City to weather economic storms.
This report suggests that the City should set a target of 16% of the City’s taxes to stabilize tax revenues over the full length an average recession (with 10% of taxes as a lower bound, that would provide stabilization for the first 2 years). The analysis shows that deposits should be determined by a formula based on non-property taxes because they are more volatile, complemented by planned contributions to achieve the desired balance. Deposits for revenue stabilization are complementary to the other components of the City’s fiscal cushion: reserves for unforeseen expenditures and the annual surplus used to balance the upcoming year’s budget.
The formula used in this report proscribes a deposit of $2.5 billion in the City’s Revenue Stabilization Fund in FY 2022, $1.8 billion above the $700 million already planned. This is because non-property taxes are expected to grow by nearly 15%, the fastest since FY 2007. The amount is appropriate for two other reasons. First, economic growth is expected to slow and the risk of a recession has risen. Second, non-property taxes are expected to end FY 2022 $3.0 billion above expectations. A deposit of $2.5 billion would bring New York City to 10% of taxes in long-term reserves for the first time in its history. At this economic juncture, and given the size of the additional resources available, this is both feasible and necessary to advance New York City’s fiscal resilience.
Acknowledgements
This report was authored by Francesco Brindisi, Executive Deputy Comptroller for Budget and Finance, Tan Eng-Kai, Bureau Chief for Budget, Selcuk Eren, Senior Economist, and Steven Giachetti, Director of Revenue. Archer Hutchinson, Graphic Designer, led the design.
The Office of the Comptroller is thankful for the Office of the State Deputy Comptroller’s feedback on this report and its previous work on this topic. The Office recognizes and is grateful for the work done over the years by the Citizens Budget Commission in advocating for fiscal resiliency through the institution and design of rainy day funds.
Appendix
CRB revenues
Common Rate and Base (CRB) revenues are defined as tax revenues that would have been collected in the absence of policy changes implemented since FY 1985. The estimates were received over time from the NYC Office of Management and Budget (OMB) and have been compiled and updated by the Comptroller’s office. The estimates were typically formulated at the time of enactment of legislation[28] and do not factor in behavioral changes.[29]
We exclude FY 2020 and FY 2021 because of the unique characteristics of the COVID-19 recession and recovery. While the economic hit was unprecedented and still lingering, the City’s tax revenues grew in FY 2021 and are expected to do so in FY 2022. The City ended FY 2021 with $65.5 billion in tax revenues, just shy of the $65.6 billion OMB projected in January 2020, before the start of the pandemic. In FY 2022, we estimate tax revenues will total $68.9 billion, above the $67.7 billion forecasted before the start of the pandemic. This dynamic was mainly due to the extraordinary federal policy interventions and are not representative of typical recessionary impacts on the City’s tax revenues.
Table A1 shows that the property tax is the City’s single largest revenue source, followed by the Personal Income Tax (PIT). The property tax has a larger share in actual collections than in CRB terms, due to the tax rate increase in mid-FY 2003. Correspondingly, PIT represent a smaller share of tax revenues in actual collections than in the CRB estimates. The shares of property tax and PIT have a higher standard deviation in the CRB estimates, suggesting that tax policy changes acted to stabilize their shares of total collections.
Table A1: Share of NYC’s tax revenues by main source FY 1985 – FY 2019
| Actual collections | CRB collections | |||
|---|---|---|---|---|
| Average | Standard deviation | Average | Standard deviation | |
| Property tax | 40.4% | 3.6% | 36.9% | 4.5% |
| PIT | 20.0% | 2.5% | 22.1% | 4.0% |
| Sales Tax | 14.3% | 1.4% | 14.7% | 1.4% |
| Business Taxes | 11.6% | 1.6% | 12.5% | 1.7% |
Source: NYC OMB, Comptroller’s Office.
Persistence, volatility, and sensitivity FYs 1985-2019
Adapting previous work by Edgerton, Haughwout and Rosen,[30] we assess three features of tax revenue growth rates: 1) the degree to which they persist one year to the next; 2) their volatility; and 3) their sensitivity to economic conditions, which are summarized by growth rate of the Index of Coincident Economic Indicators (ICEI) published by the NYS Department of Labor.[31] Table A2 summarizes results for actual and CRB collections, with and without controlling for current economic conditions.
In all panels, persistence is the degree to which the growth rate in the current and previous year correlate. A number close to one indicates that high growth in one year is followed by high growth in the next, a negative number indicates that growth in one year is followed by declines in the next, and numbers close to zero indicate a weak relationship between growth rates. Asterisks denote estimates that are statistically discernible from zero. Volatility is a measure of the error made in using this year’s growth rate to predict next year’s. Results are reported relative to the volatility of the property tax. A higher number denotes a more uncertain tax.
A few results are of note. First, the only persistent tax is the property tax, whose growth rate is less affected by current economic conditions than other taxes.[32] Second, the persistence of total CRB taxes goes from 0.35 (statistically significant) to 0.15 (not statistically significant) when economic conditions are factored in the analysis: non-property taxes make the growth rate of total revenues less persistent, noisier, and subject to current economic conditions. Third, the persistence for PIT, sales tax, and business taxes is generally small or negative,[33] and never statistically different from zero. Fourth, except for the sales tax, non-property taxes are more volatile than the property tax. In summary, the evidence points to non-property taxes as the main driver of tax revenue volatility for the City.
Table A2: Persistence and volatility of CRB collections FY 1985 – FY 2019
| Total taxes | Property Tax | Non-property taxes | PIT | Sales Tax | Business taxes | |
| Excluding current economic conditions | ||||||
| Persistence | 0.36** | 0.60*** | 0.28* | 0.02 | 0.23 | 0.02 |
| Volatility relative to property tax | 1.6 | 1.0 | 2.5 | 3.6 | 1.5 | 4.6 |
| Including current economic conditions | ||||||
| Persistence | 0.15 | 0.62*** | -0.00 | -0.25 | -0.17 | -0.09 |
| Volatility relative to property tax | 1.3 | 1.0 | 2.1 | 2.8 | 0.9 | 4.5 |
Notes: Persistence is the coefficient of a regression of the tax growth rate on its value the prior year and a constant. Regressions that control for economic conditions add the growth rate of ICEI as an explanatory variable. Asterisks denote statistical significance (* 5%; ** 1%; *** 0.1%, robust standard errors). Volatility is the standard error of the regressions’ residuals relative to the standard error of the regression for the property tax.
Source: Comptroller’s Office estimates.
Revenue loss estimates
In this section we provide details on the trend and cycle estimates based on total and non-property taxes. Based on non-property taxes, there are three periods of sustained (more than 2 years) below-trend revenues, lasting three to four years. 1995-1997 is a period of economic growth (as captured by ICEI) and excluded from the average during recessions.[34] Table A3 reports the amount of revenue losses as a percentage of total tax revenues.
Table A3: Revenue loss based on CRB non-property tax revenues
| Fiscal Years | Non-property loss as percentage of total revenues | ||
| By year 2 | By year 3 | By end of period | |
| 1995-1997 | -4.5% | -5.3% | -5.3% |
| 2002-2004 | -11.9% | -19.8% | -19.8% |
| 2009-2012 | -8.5% | -9.9% | -12.8% |
| Average during recessions in the 2000’s | -10.2%* | -14.8% | -16.3%* |
Note: The trend is estimated using the Hodrick-Prescott filter for FY 1985 to FY 2019. The revenue loss is given by cumulative non-property taxes below their trend as a percentage of total CRB revenues the year before below-trend non-property CRB revenues started. *Reported in Table 2.
Source: Comptroller’s Office estimates.
The results based on total tax revenues are similar in terms of magnitude, although the length of periods with below-trend revenues is one year longer: four to five years. As in the previous table, 1995-1999 is a period of economic growth and excluded from the average during recessions. Table A4 summarizes.
Table A4: Revenue loss based on CRB total tax revenues
| Fiscal Years | Revenue loss | ||
| By year 2 | By year 3 | By end of period | |
| 1995-1999 | -6.2% | -7.5% | -8.1% |
| 2002-2005 | -11.1% | -18.5% | -19.1% |
| 2009-2012 | -8.0% | -9.4% | -12.1% |
| Average during recessions in the 2000’s | -9.5%* | -13.9% | -15.6%* |
Note: The trend is estimated using the Hodrick-Prescott filter for FY 1985 to FY 2019. The revenue loss is given by cumulative total tax revenues below their trend as a percentage of total CRB revenues the year before below-trend non-property CRB revenues started. * Reported in Table 2.
Source: Comptroller’s Office estimates.
Endnotes
[1] Much has already been written on the topic. See for instance NYC Comptroller (2015) Measuring New York City’s Fiscal Cushion: How Much is Needed to Weather the Next Fiscal Storm?, August, https://comptroller.nyc.gov/wp-content/uploads/documents/PARR_Report_Final.pdf, NYS Comptroller (2021) Strengthening New York City’s Rainy-Day Fund, November, https://www.osc.state.ny.us/files/reports/osdc/pdf/report-13-2022.pdf, Citizens Budget Commission (2019) To Weather a Storm: Create a NYC Rainy Day Fund, April, https://cbcny.org/research/weather-storm , NYC Council (2018) Budget Reserves: How Much Does New York City Need?, March, https://legistar.council.nyc.gov/View.ashx?M=AO&ID=58579&GUID=2b744f91-a160-46d2-94d5-39b29323f1bc&N=UmV2ZW51ZSBOb3RlOyBCdWRnZXQgUmVzZXJ2ZXM6IEhvdyBNdWNoIERvZXMgTmV3IFlvcmsgQ2l0eSBOZWVkPw%3d%3d NYC Independent Budget Office (2020) Safety Net: Background on the City’s Budget Reserves and How the Mayor Plans to Use Them, May, https://ibo.nyc.ny.us/iboreports/safety-net-background-on-the-citys-budget-reserves-and-how-the-mayor-plans-to-use-them-foeb-may-2020.pdf.
[2] As explained in the report, the estimate averages the impacts of the 9/11 recession and the Great Recession.
[3] The amount is inclusive of the $3.8 billion balance in RHBT from the financial plan documents, interest income on the RHBT balance for approximately $50 million, the current RSF balance of $500 million balance, and a deposit into RSF at FY-close of $705 million (inclusive of the usual $5 million general fund balance achieved at FY-close).
[4] This is the rule adopted in Virginia. See Cassidy M. and Okos S. (2011) Building a Better Rainy Day Fund, The Commonwealth Institute, February, Rainy_Day_2.2011.indd (thecommonwealthinstitute.org). The rule is considered best practice (Pew Charitable Trust (2017) Rainy Day Fund Best Practices, rainy_day_fund_best_practices_draft.pdf (pewtrusts.org), Barrett K., Greene R. (2019) Rainy Day Fund Strategies, Volcker Alliance, https://www.volckeralliance.org/resources/rainy-day-fund-strategies-call-action-0.
[5] Therefore, amounts in RHBT are available for revenue stabilization only up to a given year’s expenses for retiree health care costs.
[6] See for instance McNichol E., Boadi K. (2011) Why and How States Should Strengthen their Rainy Day Funds, Center for Budget and Policy Priorities, https://www.cbpp.org/sites/default/files/atoms/files/2-3-11sfp.pdf.
[7] Most of the FEA legislation was incorporated into the City Charter in 2005.
[8] Other means by which the City used current year resources for future year budget relief include delaying the receipt of tobacco settlement revenues and pre-paying subsidies to H+H in the out-years of the financial plan.
[9] NY State Senate Bill S8400 (nysenate.gov)
[10] The City typically achieves a surplus of approximately $5 million at Fiscal Year-close. The year-end close surplus can now be transferred to RSF.
[11] See https://legistar.council.nyc.gov/View.ashx?M=F&ID=667718&GUID=BE279B59-AD32-417B-8366-4CE35A57838B.
[12] For more details, see NYC Comptroller (2021) Annual Comprehensive Financial Report for the Fiscal Years Ended June 30, 2021 and 2020, p.136, ACFR-2021.pdf (nyc.gov). and OPEB plan financial statements https://comptroller.nyc.gov/wp-content/uploads/documents/OPEB_Financial_Statements_2021.pdf.
[13] Ibid. p.137.
[14] We count the FY 2022 deposit of $500 million included in the June 2021 Adopted Budget as available for budget stabilization in FY 2022 because it was appropriated but could have been rescinded in case of need. The additional $200 million deposit included in the FY 2023 Executive Financial Plan is counted as available in FY 2023.
[15] Pew Charitable Trusts (2014) Building State Rainy Day Funds, sfh_rainy-day-fund-deposit-rules-report_artready_v9.pdf (pewtrusts.org) and (2017) Rainy Day Fund Best Practices, rainy_day_fund_best_practices_draft.pdf (pewtrusts.org). See also Barrett K., Greene R. (2019) Rainy Day Fund Strategies, Volcker Alliance, https://www.volckeralliance.org/resources/rainy-day-fund-strategies-call-action-0 and McNichol E.C., Lazere E. (2021) States Should Improve the Design of Their Rainy Day Funds, Center on Budget and Policy Priorities, States Should Improve the Design of Their Rainy Day Funds | Center on Budget and Policy Priorities (cbpp.org).
[16] For an overview, see NYC Office of Management and Budget Tax Revenue Forecasting Documentation – June 2021 (nyc.gov).
[17] Additional details are available in the appendix.
[18] Using a different methodology, the Citizens Budget Commission estimates the need to set aside 17.2% of tax revenues to compensate for revenue losses. The estimate is derived from the difference between tax revenue growth of 2% and the average percentage decline in CRB revenues experienced during the same two recessions. The proposal would in essence compensate for the forecast error in the financial plan. See Citizens Budget Commission (2019) To Weather a Storm: Create an NYC Rainy Day Fund, To Weather a Storm | CBCNY and (2022) The Record on Reserves, The Record on Reserves | CBCNY.
[19] This counterfactual calculation simulates the RHBT balance had the City decided to deposit the amounts spent on debt retirement in FY 2007 and FY 2008. The specific amounts are in points d) and e) of Table 1’s footnote. However, Table 1 reports savings (inclusive of debt service savings) from debt retirement in the “other budget stabilization” column in the years in which they accrued. The benefits from debt retirement are evident in the FY 2009 and, particularly, the FY 2010 entries.
[20] See Pew Charitable Trust (2017) Rainy Day Fund Best Practices, rainy_day_fund_best_practices_draft.pdf (pewtrusts.org) and Barrett K., Greene R. (2019) Rainy Day Fund Strategies, Volcker Alliance, https://www.volckeralliance.org/resources/rainy-day-fund-strategies-call-action-0.
[21] Additional provisions are that the deposit rule nets out the effect of tax cuts for a period of time, so as to not intentionally lower the fund balance. Current-year revenues in excess of the estimates in the Adopted Budget could also be deposited in full.
[22] See for instance The PEW Charitable Trusts (2017) When to Use State Rainy Day Funds, When to Use State Rainy Day Funds | The Pew Charitable Trusts (pewtrusts.org) and Chapman J., Loiaconi A., Oh A. (2020) State Rules Can Complicate Rainy Day Fund Withdrawals, The PEW Charitable Trusts, State Rules Can Complicate Rainy Day Fund Withdrawals | The Pew Charitable Trusts (pewtrusts.org),
[23] Data are typically released on the third Thursday of the month, with the exception of January data which is released in March after the annual data benchmarking exercise.
[24] The estimates use the data available as of April 2022. Because the data are subject to periodic retroactive revisions, data published at the time the recessions started may be different. We have not performed an analysis of the revisions. Seasonally adjusted data are from NYC OMB and the methodology has also been adopted by the Comptroller’s Office. NYS DOL also generates seasonally adjusted total nonfarm payroll estimates.
[25] See the analysis of persistence, volatility and economic sensitivity of NYC tax revenues that is included in the appendix for further details on ICEI.
[26] All components of ICEI are seasonally adjusted. See the technical notes available here: https://dol.ny.gov/index-coincident-economic-indicators-icei-technical-notes. ICEI is also revised retroactively as new data become available or are themselves revised. We have not analyzed the extent and size of revisions.
[27] As is the case for the other data sources GDP data are subject to periodic retroactive revisions.
[28] For instance, there is no revenue impact from the 2014 reform of the City’s taxes on corporate entities because, at the time of passage, it was estimated to be revenue neutral. Other changes that have revenue implications in the future (for example, the changes introduced in 2017 to the 421-a program) are not included.
[29] As an example, the cap on the state and local tax deduction in Federal individual tax returns does not have a CRB estimate. Nor does the flow-through into the City’s corporate tax base of Global Intangible Low-Taxed Income.
[30] Edgerton J., Haughwout A.F., Rosen R. (2004) “Revenue Implications of New York City’s Tax System,” Current Issues in Economics and Finance, Federal Reserve Bank of New York, 10(4), April, https://www.newyorkfed.org/research/current_issues/ci10-4.html.
[31] NYS Department of Labor Index of Coincident Economic Indicators (ICEI) | Department of Labor (ny.gov),Index of Coincident Economic Indicators (ICEI) Technical Notes | Department of Labor (ny.gov). This index is closely correlated with a NYC index produced by the Federal Reserve Board of NY that was discontinued in 2018 (Index of Coincident Economic Indicators – FEDERAL RESERVE BANK of NEW YORK (newyorkfed.org)).
[32] This is because the property tax system embeds smoothing mechanisms and because, for income-producing properties, it is derived from lagged information.
[33] A negative coefficient means that growth in one year is followed by declines in the following one.
[34] For a description of economic conditions in the 1990s and early 2000s, also see Bram J. (2003) “New York City’s Economy before and after September 11,” Current Issues in Economics and Finance, 9(2), February, https://www.newyorkfed.org/research/current_issues/ci9-2.html.