Results of a Survey of LGBTQ New Yorkers
Introduction
New York City’s metro area is home to the largest lesbian, gay, bisexual, transgender or queer (LGBTQ) population in the United States and is the historic epicenter of the nation’s gay rights movement,[1] making the LGBTQ community a vital part of the city’s social, cultural and economic fabric. At the same time, however, the stark reality is that LGBTQ people in New York and across the country and world continue to face discrimination, harassment, and violence as a result of their sexual orientation or gender identity.[2]
Overcoming these challenges so that every New Yorker has the chance to live a full and equal life requires a detailed understanding of the lived experience of LGBTQ New Yorkers, including how government services are, or are not, reaching them. While surveys seeking information about the sexual and/or gender identity of New Yorkers are conducted by the New York City Department of Health and Mental Hygiene and others, information about how LGBTQ New Yorkers interact with various government services and programs could be enhanced.[3] For that reason, in May 2017, the Office of New York City Comptroller Scott M. Stringer undertook a survey to better understand challenges facing LGBTQ New Yorkers when it comes to economic security, accessing healthcare and issues related to discrimination in the workplace and beyond.
The survey responses document that while LGBTQ New Yorkers as a whole face a number of economic and health care-related challenges, the prevalence of these issues is not distributed evenly within the LGBTQ community. Specifically, the survey found that:
- 21 percent of survey respondents report that they have been denied a promotion, not hired, or been fired or forced to resign from a job due to their sexual orientation or gender identity. Respondents who identified as transgender or gender non-conforming reported such an experience at much higher rates.
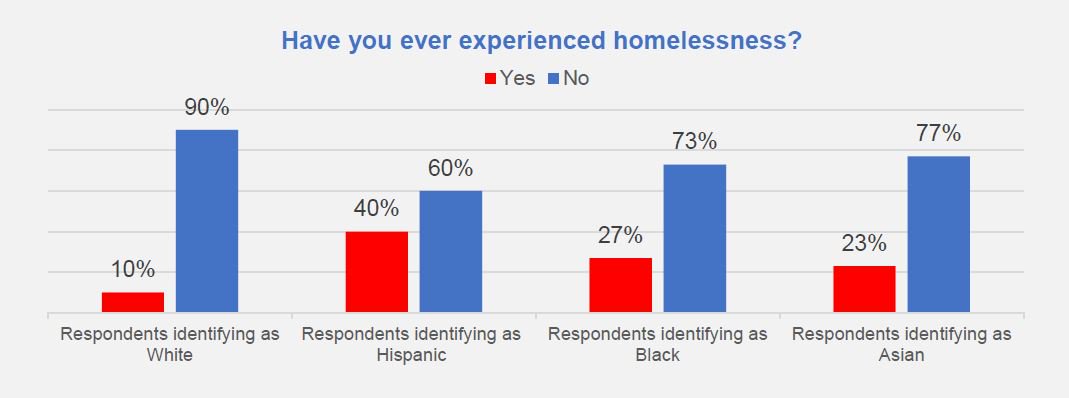
- While 18 percent of respondents reported experiencing homelessness, those respondents identifying as Black, Hispanic, or transgender or gender non-conforming were much more likely to say they had been homeless at one time. Survey respondents who had utilized New York City homeless shelter services overwhelmingly indicated that they felt very unsafe or unsafe when doing so.
- Respondents identified public transportation as the location where they had most frequently been denied equal treatment or experienced verbal or physical harassment, followed by retail stores, restaurants, hotels, or theaters.
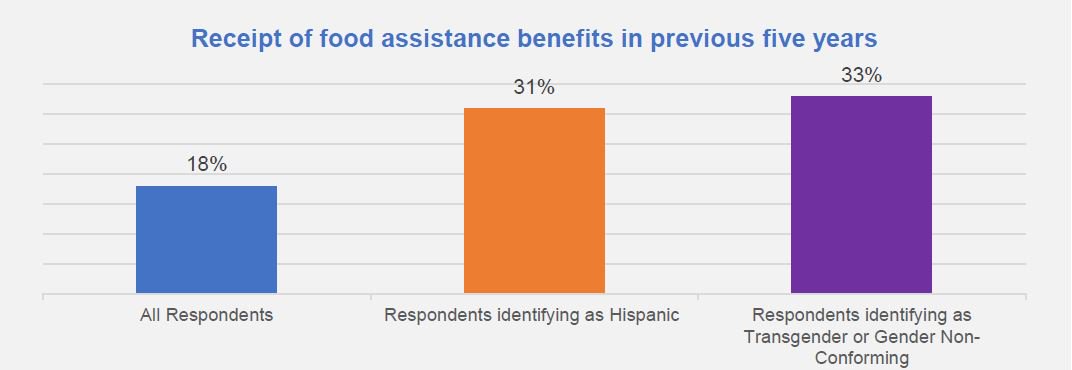
- Although 18 percent of respondents stated that they had utilized food assistance programs in the last five years, respondents identifying as Hispanic or transgender or gender non-conforming stated that they had used or continue to use food assistance programs at higher rates than respondents overall.
- Compared to all respondents, those identifying as Black or transgender or gender non-conforming were less likely to receive health insurance through an employer, while those identifying as Hispanic or transgender or gender non-conforming were more likely to obtain health insurance through Medicaid. Respondents identifying as Hispanic, Asian, or transgender or gender non-conforming were more likely to receive health care services in a setting outside of a traditional doctor’s office compared to respondents overall.
These responses provide important information for policymakers, advocates, and citizens alike that enhance our collective understanding of the experiences of LGBTQ residents in the five boroughs. In addition, as policies and programs to address issues faced by LGBTQ New Yorkers are conceived of, designed, and implemented, the responses indicate that particular attention should be given to ensuring that such programs can be accessed by all members of the LGBTQ community.
Findings
Unequal Treatment in Employment
In total, 21 percent of survey respondents indicated that they believed they had been denied a promotion at a job, not hired for a job they applied for, or fired or force to resign from a job due to their sexual orientation or gender identity.
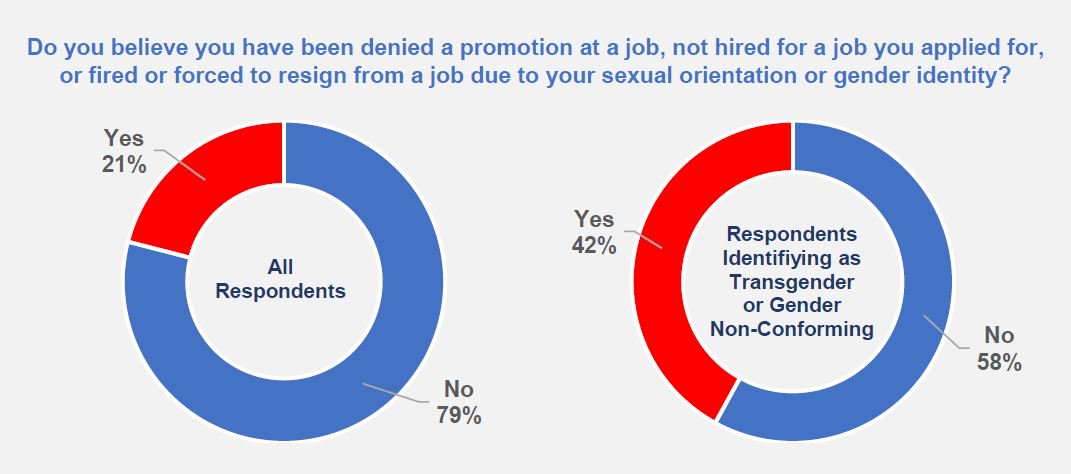
Forty-two percent of respondents who identify as transgender or gender non-conforming indicated that they had such a belief. This elevated rate among those who identify as transgender or gender non-conforming is consistent with other surveys. For instance, in response to a similar question in the 2015 U.S. Transgender Survey, 30 percent of respondents who had a job reported being fired, denied a promotion, or experiencing some other form of mistreatment in the workplace due to their gender identity or expression, such as being verbally harassed or physically or sexually assaulted at work in the year prior to the survey.[4]
Homelessness
Overall, 18 percent of survey respondents indicated that they have experienced homelessness. Hispanic, Black, and Asian respondents experienced homelessness at higher rates—40 percent, 27 percent, and 23 percent respectively—compared to non-Hispanic White respondents at 10 percent.
Thirty-eight percent of respondents identifying as transgender or gender non-conforming indicated that they have experienced homelessness, similar to a finding in the 2015 U.S. Transgender Survey that suggested about 30 percent of transgender people have experienced homelessness in their lifetime.[5]
Survey respondents who said they had obtained shelter through the New York City homeless system were asked to rate how safe they felt in that shelter and the reasons for such feeling. Overall, about 30 percent of respondents who experienced homelessness utilized the City’s shelter system. Of those respondents, 79 percent indicated that they felt very unsafe, 11 percent that they felt unsafe, and 11 percent that they felt safe. Respondents who felt very unsafe or unsafe indicated that the most common reason for such a feeling was other shelter residents, followed by shelter staff and neighborhood residents.
Unequal Treatment in Public
Overall, about 47 percent of survey respondents indicated that they believed they had been denied equal treatment or services or been verbally or physically harassed in public spaces as a result of being LGBTQ. Respondents most frequently identified public transportation as the site of such treatment, followed by a retail store, restaurant, hotel, or theater, and finally a doctor’s office, hospital, emergency room, mental health clinic, ambulance, nursing home, or extended family care facility.
Respondents identifying as transgender or gender non-conforming were more likely than respondents as a whole to state that they have been denied equal treatment or services or been verbally or physically harassed in public spaces. In total, 70 percent of transgender or gender non-conforming respondents said they had such an experience. Consistent with other studies, transgender and gender non-conforming respondents were much more likely to state that they have gone through such an experience at a doctor’s office, hospital, emergency room, mental health clinic, ambulance, nursing home, or extended family care facility.[6]
Overall, about 17 percent of respondents who indicated they had such an experience reported notifying government authorities of the incident.
Utilization of Government Benefit Programs
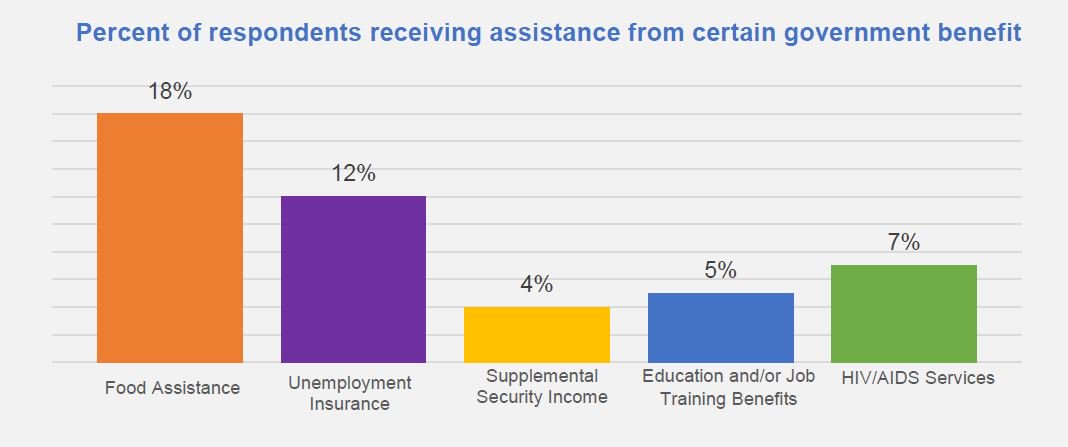
Survey respondents were asked if they had received support from a number of government benefit programs, including food assistance, unemployment insurance, Supplemental Security Income (SSI), education or job training benefits, or HIV/AIDS services, at any point in the last five years. Overall, about 37 percent of respondents indicated that they had utilized a government benefit program in the last five years. In total, 18 percent of respondents indicated receipt of food assistance, 12 percent of respondents indicated that they had received unemployment insurance, 4 percent received SSI, 5 percent accessed education or job training benefits, 7 percent utilized HIV/AIDS services, and 8 percent used other benefit programs.
Relatively high rates of food insecurity and usage of food assistance programs has been well documented in the LGBTQ community overall.[7] In this survey, 18 percent of respondents stated that they had utilized a food assistance program in the last five years, making food assistance the most frequently utilized program in the survey. Receipt of food assistance was notably higher among Hispanic and transgender or gender non-conforming respondents, at 31 percent and 33 percent respectively.
Receipt of SSI benefits were much higher among Hispanic and transgender or gender non-conforming respondents at 8 percent and 12 percent respectively, suggesting higher rates of receipt of this program than the population as a whole (about 5 percent of all New York City residents receive SSI benefits according to the Social Security Administration).[8] Additionally, the usage of HIV/AIDS services were much higher among Black survey respondents and respondents identifying as male.
Health Insurance and Health Services
Prior surveys of the LGBTQ population suggest that over 60 percent of LGBTQ New Yorkers use private health insurance to pay for medical services and are therefore more likely to have private insurance than the population overall (according to the Department of Health and Mental Hygiene’s Community Health Survey, about 45 percent of all New York City residents have private health insurance).[9] Consistent with that finding, 72 percent of respondents to this survey reported having private insurance through their employer, someone else’s employer, or that they purchased on their own. Transgender or gender non-conforming respondents indicated having lower rates of private health insurance at 60 percent.
Overall, about 21 percent of survey respondents indicated that they receive health insurance through a government program, with 11 percent indicated receipt of Medicare benefits and 10 percent indicating Medicaid. Notably, 26 percent of Hispanic respondents indicated they rely on Medicaid for health insurance. Prior surveys of LGBTQ New Yorkers found slightly higher utilization of public health insurance programs overall among LGBTQ residents of New York State.[10]
Survey participants were also asked where they go most often to obtain health care services. Overall, 63 percent of respondents indicated they received care at doctor’s offices while 17 percent said community health center, 4 percent responded hospital outpatient clinic, and 10 percent stated emergency room or urgent care facility. Hispanic and Asian respondents were less likely to seek care at a doctor’s offices and more likely to obtain care at a community health center than respondents overall.
Unlike respondents as a whole, 41 percent of respondents identifying as transgender or gender non-conforming indicated that they most often received health care services at a community health center compared to 30 percent who said they received care most often at a doctor’s office. At 18 percent, female respondents were more likely to utilize health care services at an emergency room or urgent care clinic than male respondents (4 percent) or respondents overall (10 percent).
Conclusion
The results of this survey raise a number of issues for policymakers across all levels of government. As a first step, the Comptroller makes the following recommendations:
- The City should continue to focus on enhancing security inside homeless shelters: With 90 percent of respondents who had utilized a City homeless shelter stating that they felt either unsafe or very unsafe, this survey suggests that the Department of Homeless Services should make additional efforts to improve safety at homeless shelters, with a particular focus on the safety concerns of LGBTQ New Yorkers.
- Enhance public awareness campaigns and staff training: With many respondents identifying incidents of unequal treatment or harassment occurring on public transportation or in health care settings, the City’s Department of Transportation, the Metropolitan Transportation Authority, and NYC Health + Hospitals should all take additional steps to prevent such incidents through improved public awareness campaigns and staff training.
- Access to programs and services: Government officials should continue to closely monitor future research on the experience of LGBTQ New Yorkers, with a particular focus on ensuring that all members of the LGBTQ community have access to programs and services that address their needs.
Notes on Respondents
This survey was administered by the Office of the Comptroller during May and June 2017. The survey was not based on a scientific sample of the City’s population. In total, 359 people responded to the survey. While not all respondents answered each question, the vast majority of respondents replied to each appropriate question. The information below provides more detail about the survey respondents.
Place of Residence
Nine percent of respondents indicate their borough of residents as the Bronx, 29 percent in Brooklyn, 48 percent in Manhattan, 12 percent in Queens, and 3 percent in Staten Island.
Race and Ethnicity
Research has generally documented that LGBTQ individuals share the same racial and ethnic characteristics of the population overall.[11] However, respondents to this survey were more likely to identify as non-Hispanic White than the total population and less likely to identify as either Black, Hispanic, or Asian, based on the findings of the 2015 American Community Survey.[12] In total, 19 percent of survey respondents identified as Hispanic, 9 percent as non-Hispanic Black, 65 percent as non-Hispanic White, 6 percent as Asian, and 9 percent as other.
Age
Respondents to this survey were generally younger than the total New York City population, according to the 2015 American Community Survey.[13] One percent of respondents were under 18, 49 percent of respondents were between 18-34 years of age, 38 percent between 35-64 years of age, and 12 percent over 65 years of age.
Gender Identity
Respondents were also more likely to identify as male and less likely to identify as female than the New York City population overall, according to the 2015 American Community Survey.[14] Overall, 47 percent of respondents identified as male, 40 percent as female, 10 percent as transgender, and 4 percent as other than female, male, or transgender.
Educational Attainment
Consistent with other studies of the LGBTQ population, including other local surveys, respondents were generally more highly educated than the population overall.[15] Specifically, only 18 percent of respondents reported having less than a bachelor’s degree while about 83 percent stated they had a bachelor’s degree or advanced degree.
Despite these relatively high levels of educational attainment, sizeable variations exist with respondents identifying as Black, Hispanic, or transgender or gender non-conforming being more likely to have lower levels of educational attainment than respondents overall. Specifically, 10 percent of those identifying as non-Hispanic White stated that they have less than a bachelor’s degree while 28 percent of Black respondents, 32 percent of Hispanic respondents, and 10 percent of Asian respondents reported having less than a bachelor’s degree. Among respondents who identify as transgender or gender non-conforming, 33 percent have less than a bachelor’s degree compared to 15 percent of respondents who identify as male or female.
Household Income and Employment
Respondents to the survey generally reported higher household incomes compared to the New York City population overall, based on 2015 Census data.[16] About 45 percent of survey respondents indicated their household income exceeded $75,000 (compared to 37 percent of the overall population in 2015) while 11 percent reported household income under $15,000 (compared to 16 percent of the overall population in 2015).[17]
As with the population overall, there are sizeable income variations depending on the race or ethnicity of the respondent. Fifty-four percent of non-Hispanic White respondents report household income in excess of $75,000 compared to 39 percent of Black respondents, 27 percent of Hispanic respondents, and 32 percent of Asian respondents. Similarly, only 6 percent of non-Hispanic White respondents report household income below $15,000 compared to 12 percent of Black respondents, 20 percent of Hispanic respondents, and 18 percent of Asian respondents.
Variations also exist by gender identity. Fifty-five percent of respondents who identify as male report household income over $75,000 compared to 42 percent of respondents who identify as female and 22 percent who identify as transgender or gender non-conforming.
In terms of employment, 61 percent of all survey respondents report being employed full-time, 11 percent report being employed part-time, and 11 percent state that they are self-employed. Full-time employment rates among transgender and gender non-conforming respondents are noticeably lower at 47 percent while part-time employment rates are much higher at 27 percent. Female respondents also report higher rates of working part-time at 17 percent compared to 4 percent among male respondents.
Acknowledgements
Comptroller Stringer thanks Zachary Schechter-Steinberg, Deputy Policy Director, David Saltonstall, Assistant Comptroller for Policy, and Eric Holguin, Community Liaison, for their work on this project.
Endnotes
[1] https://www.nytimes.com/2015/03/24/upshot/new-york-still-has-more-gay-residents-than-anywhere-else-in-us.html?_r=1&abt=0002&abg=0 and http://www.gallup.com/poll/182051/san-francisco-metro-area-ranks-highest-LGBTQ-percentage.aspx
[2] https://www.americanprogress.org/issues/LGBTQ/news/2017/05/02/429529/widespread-discrimination-continues-shape-LGBTQ-peoples-lives-subtle-significant-ways/ and https://www.nytimes.com/interactive/2016/06/16/us/hate-crimes-against-LGBTQ.html
[3] For example, the Community Health Survey conducted annually by the Department of Health and Mental Hygiene asks respondents about sexual identity: http://www1.nyc.gov/site/doh/data/data-sets/community-health-survey.page. A survey of LGBTQ New York State residents conducted by researchers affiliated with the Lesbian, Gay, Bisexual, & Transgender Community Center was conducted in 2016: https://gaycenter.org/file/docs/network/Needs-Assessment-WEB.pdf.
[4] http://www.transequality.org/sites/default/files/docs/usts/USTS%20Full%20Report%20-%20FINAL%201.6.17.pdf
[5] http://www.transequality.org/sites/default/files/docs/usts/USTS%20Full%20Report%20-%20FINAL%201.6.17.pdf
[6] https://www.americanprogress.org/issues/LGBTQ/news/2017/05/02/429529/widespread-discrimination-continues-shape-LGBTQ-peoples-lives-subtle-significant-ways/
[7] http://williamsinstitute.law.ucla.edu/wp-content/uploads/Food-Insecurity-and-SNAP-Participation-in-the-LGBTQ-Community.pdf
[8] https://www.ssa.gov/policy/docs/statcomps/ssi_sc/2015/ny.html
[9] https://gaycenter.org/file/docs/network/Needs-Assessment-WEB.pdf and http://www1.nyc.gov/site/doh/data/data-sets/community-health-survey.page
[10] https://gaycenter.org/file/docs/network/Needs-Assessment-WEB.pdf
[11] http://williamsinstitute.law.ucla.edu/wp-content/uploads/LGBTQ-demogs-sep-2014.pdf
[12] https://factfinder.census.gov/faces/tableservices/jsf/pages/productview.xhtml?pid=ACS_15_5YR_ DP05&prod Type=table
[13] https://factfinder.census.gov/faces/tableservices/jsf/pages/productview.xhtml?pid=ACS_15_5YR_ DP05&prod Type=table
[14] https://factfinder.census.gov/faces/tableservices/jsf/pages/productview.xhtml?pid=ACS_15_5YR_ DP05&prod Type=table
[15] http://williamsinstitute.law.ucla.edu/wp-content/uploads/LGBTQ-demogs-sep-2014.pdf and https://gaycenter.org/file/docs/network/Needs-Assessment-WEB.pdf
[16] https://factfinder.census.gov/faces/tableservices/jsf/pages/productview.xhtml?pid=ACS_15_5YR_ DP05&prod Type=table
[17] https://factfinder.census.gov/faces/tableservices/jsf/pages/productview.xhtml?pid=ACS_15_5YR_ S1901& prodType=table