Same-Sex Marriage: New Insights from the 2016 American Community Survey
Same-Sex Marriage
As the Trump Administration refuses to allow inclusion of questions on sexual orientation and gender identity in the 2020 Decennial Census, recently released data from the U.S Census Bureau’s American Community Survey provides new insight on the far reaching impact that the repeal of the federal Defense of Marriage Act (DOMA) has had on the lives of same sex couples. The impact for New York City residents is measured after 2011, when New York State first recognized the right of same sex couples to marry with the passage of the Marriage Equality Act. This legislation was followed by the two historic Supreme Court decisions that effectively repealed the Defense of Marriage Act.[1] These decisions paved the way for same sex couples to marry in all States and conferred on same sex couples rights that had previously been accorded only to opposite sex couples, including the ability to file joint tax returns and the right to survivor and other federal benefits.
Here’s what the data reveal:
- Same sex married couples in the City have grown from approximately 8,000 in 2012 to more than 16,000 in 2016, an increase of nearly 100 percent over this 5 year period.
- The biggest increase in marriages occurred in 2014, a 28 percent jump, following the landmark Supreme Court decision (United States vs. Windsor) in June 2013 that effectively recognized same sex marriages for federal purposes.
- Overall, the numbers of same sex married couples in the City are still small, only 16,399 in 2016 compared to over 1.1 million opposite sex couples. This can be partly explained by the relative newness of same sex marriage, but one also has to consider the devastating impact that the AIDS epidemic had on older cohorts.
The Number of Same Sex Married Couples Has Nearly Doubled in 5 Years
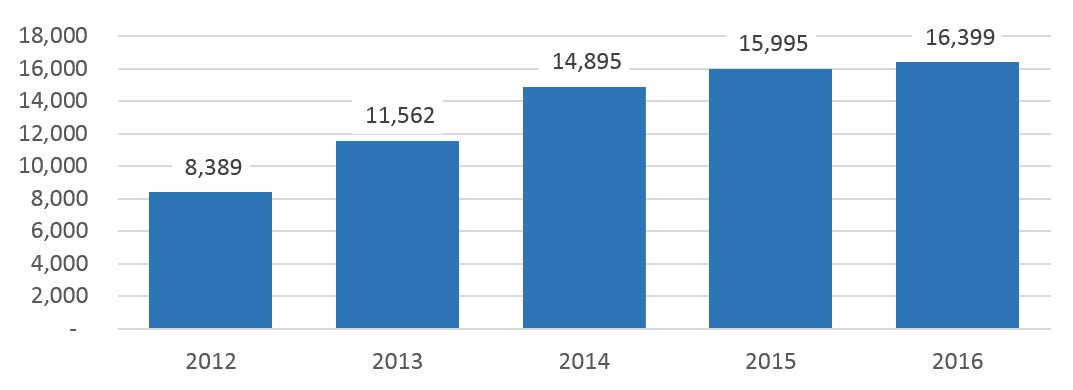
Source: Office of the Comptroller calculations from ACS 2012-2016 1-Year Estimates
The ACS also provides interesting data on socioeconomic characteristics of same sex married couples:
- Same sex married couples generally have similar incomes compared to opposite sex couples when controlling for borough of residency.
- The one notable exception is Brooklyn where incomes for same sex married couples far exceeded the borough wide average, though this may change as the number of same sex marriages increases.
- For the City as a whole the median income for same sex couples was higher, at $145,000 compared to $87,000.
- This can be partly explained by the higher prevalence of two-earner households among same sex married couples: almost 60 percent, compared to 45 percent for opposite sex couples.
Same- and Opposite-Sex Married Couples by Borough
| Same Sex | Opposite Sex | |||
| Number | Median Income | Number | Median Income | |
| Bronx | 920 | $60,000 | 142,046 | $62,200 |
| Brooklyn | 5,817 | $142,500 | 341,235 | $76,000 |
| Manhattan | 6,632 | $145,300 | 207,007 | $160,000 |
| Queens | 2,574 | $97,300 | 338,506 | $82,000 |
| Staten Island | 456 | $145,000 | 90,059 | $105,000 |
| TOTAL | 16,399 | $145,000 | 1,118,853 | $87,000 |
Source: Office of the Comptroller calculations from ACS 2016 1-Year Estimates
- Additional characteristics of same sex married couples are provided in the Appendix Table at the end of this brief.
The recognition of same sex marriage has brought significant economic benefits to same sex couples. For instance, in Windsor, the IRS had denied the same favorable tax treatment and exemption on estates that opposite sex couples were entitled to. Couples were also denied the opportunity to file taxes jointly, which had particularly negative consequences when same sex partners had different incomes as they were required to file separately.
From the City’s perspective, the benefits of marriage will be felt more in terms of the long run implications that marriage will have on household formation, household size and stability/migration of residency. It is too early to discern these effects.[2]
In addition, the data on same sex couples provides useful insights to researchers across all fields, whether employed in academia, medicine, government/policy, marketing and real estate, etc. This underscores the need to obtain more data on same sex couples at a time when the current administration is planning to cut back on this valuable data.
Appendix Table: Characteristics of Same- and Opposite-Sex Married Couples
| New York City | New York State | U.S. | ||||||||||
| All Married Couples | Same Sex Married | Married Couples | Same Sex Married | Married Couples | Same Sex Married | |||||||
| Opposite Sex |
Same Sex |
Male | Female | Opposite Sex |
Same Sex | Male | Female | Opposite Sex |
Same Sex |
Male | Female | |
| Number | 1,118,853 | 16,399 | 8,692 | 7,707 | 3,127,233 | 33,031 | 17,175 | 15,856 | 56,512,330 | 476,131 | 228,917 | 247,214 |
| Median Income, 2016 | $87,000 | $145,000 | $142,090 | $145,300 | $95,700 | $126,900 | $136,000 | $111,700 | $85,000 | $96,400 | $108,000 | $90,000 |
| Both Spouses Work, % | 45.2 | 59.2 | 63.3 | 54.7 | 46.4 | 54.6 | 59.6 | 49.1 | 46.2 | 52.7 | 52.9 | 52.4 |
| Interracial Couple, % | 7.7 | 17.2 | 23.3 | 10.3 | 5.7 | 11.9 | 16.7 | 6.7 | 6.7 | 12.6 | 14.8 | 10.5 |
| With Presence of Children, % | 46.8 | 28.3 | 13.8 | 44.6 | 42.6 | 24.8 | 16.0 | 34.3 | 42.1 | 21.9 | 14.7 | 28.6 |
| Age of Householder, Reference Person % | ||||||||||||
| 30 and Under | 6.8 | 7.6 | 6.9 | 8.4 | 5.3 | 5.1 | 5.0 | 5.2 | 7.3 | 8.0 | 5.0 | 10.8 |
| 31 to 40 | 22.1 | 21.4 | 20.4 | 22.6 | 18.1 | 15.9 | 15.4 | 16.4 | 18.5 | 17.5 | 15.8 | 19.1 |
| 41 to 50 | 22.3 | 27.5 | 34.2 | 19.9 | 21.9 | 25.5 | 29.0 | 21.7 | 20.9 | 21.0 | 21.8 | 20.3 |
| Over 50 | 48.8 | 43.5 | 38.6 | 49.0 | 54.8 | 53.5 | 50.6 | 56.7 | 53.3 | 53.5 | 57.4 | 49.9 |
Source: Office of the Comptroller calculations from ACS 2016 1-Year Estimates
Data Sources
Data in this report is culled from U.S. Census Bureau, 1 year American Community Survey (ACS) for the 2012-2016 years (https://www.census.gov/programs-surveys/acs/news/data-releases
/2016/release.html). In 2013 the Census Bureau introduced a specific question and indicator in the household records relating to same sex married couples. Prior to that, same sex marriages could only be inferred by cross tabulating the sex of person records to identify married couples of the same sex.
Data from the Census bureau is obtained from a relatively small sample of 3.5 million interviews for the U.S., 300,000 in NYS. Because of this, the estimates produced are subject to sampling errors. Overall estimates for sampling errors and the corresponding confidence intervals are shown below for same sex married couples.
Estimate of Number of Same Sex Married Couples, 2016
| Estimate | Standard Error | 95% Confidence Interval | |||
| New York City | 16,399 | 1,591 | 13,233 | 19,565 | |
| New York State | 33,031 | 2,025 | 29,000 | 37,062 | |
| U.S. | 476,131 | 6,552 | 463,089 | 489,173 | |
Source: Office of the Comptroller calculations from ACS 2016 1-Year Estimates
Other studies, more recently, have focused on larger samples of tax records for married filing joint couples using name algorithms to identify same sex couples.[3] This data source has only become available for the U.S. since tax year 2014, the first year same sex couples could file jointly on their tax returns.
Acknowledgements
The Comptroller thanks Steven Giachetti, Chief of Revenue Estimation in the Bureau of Budget, and Selçuk Eren, Senior Economist, for preparing this brief.
[1] Legislative milestones for same sex marriage include:
June 24,2011, New York State Marriage Equality Act, https://www.nysenate.gov/legislation/bills/2011/A8354
June 26, 2013 United States v. Windsor, https://www.supremecourt.gov/opinions/12pdf/12-307_6j37.pdf,
June 26,2015 Obergefell v. Hodges https://www.supremecourt.gov/opinions/14pdf/14-556_3204.pdf
[2] Some reports have also highlighted the increased economic activity associated with spending on same sex weddings. See Love Counts: The Economic Benefits of Marriage Equality for New York, Office of the New York City Comptroller, https://gaymarriage.procon.org/sourcefiles/love-counts-gay-marriage-new-york-benefits.pdf
[3] https://www.treasury.gov/resource-center/tax-policy/tax-analysis/Documents/WP-108.pdf