Service Denied: Accessibility and the New York City Subway System
New York City’s Inaccessible Subway System
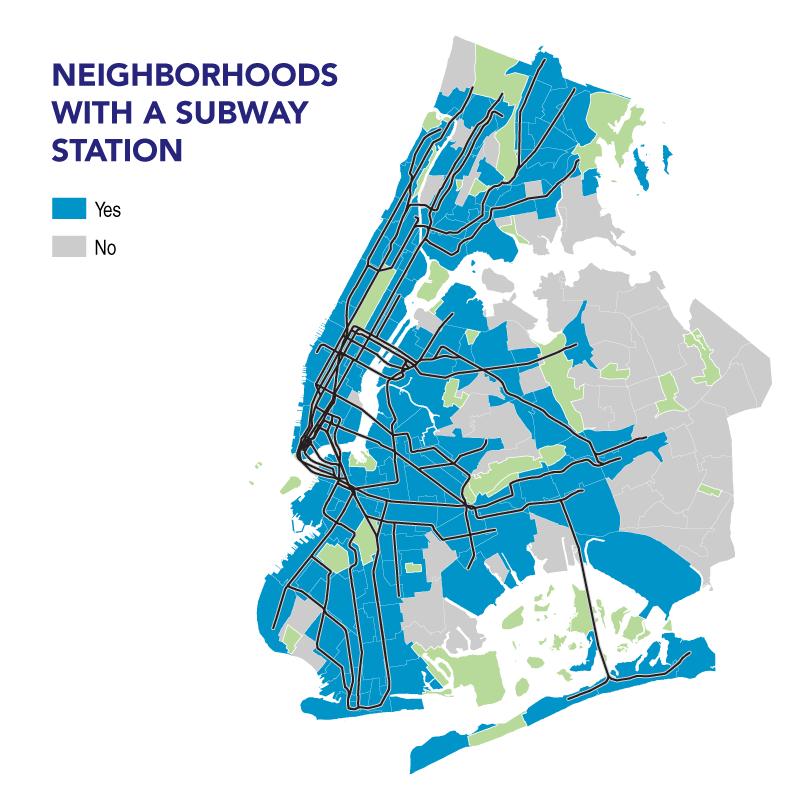
Despite the delays, despite the deferred maintenance, despite the growing frustration, the New York City subway system remains the most expansive in the country and among the most impressive in the world. Its reach is extraordinary, with 472 stations connecting 122 of the city’s 189 neighborhoods. In total, 6.3 million New Yorkers—or 75 percent of the city’s population—have access to a subway station within their neighborhood.
That is, unless, those New Yorkers are mobility-impaired.
For those with disabilities… or with young children… or immobilized by an injury…or the elderly… For all of these New Yorkers, the vast majority of subway stations provide little access to transit in neighborhoods across the city. For all of these New Yorkers, the city’s “transit deserts” begin to resemble the Sahara.
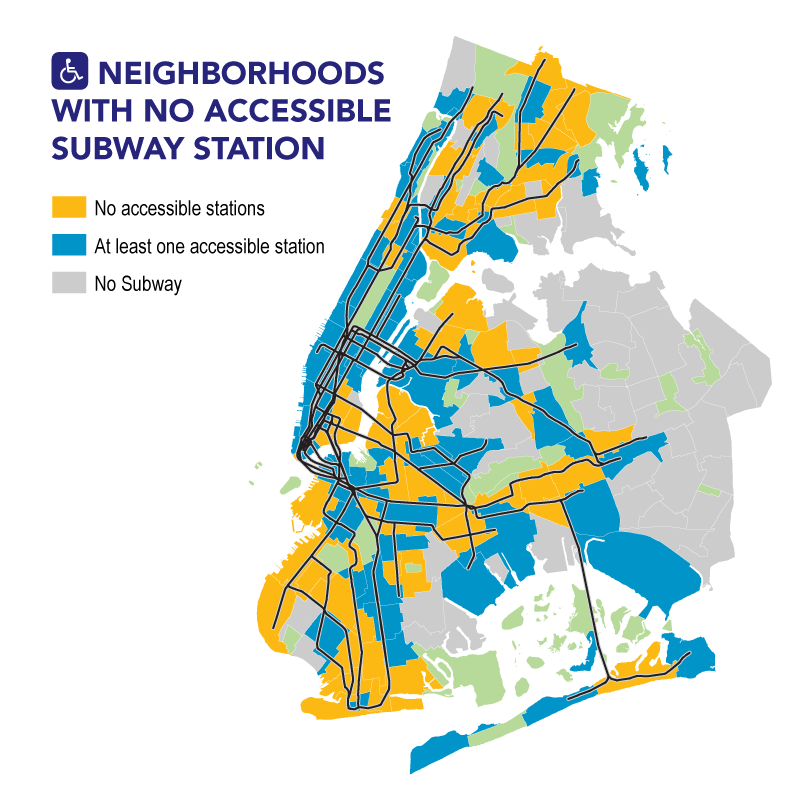
One only needs to look at a map of the neighborhoods with a subway station and compare it to one showing all neighborhoods without a single accessible station (see Chart 1)—the difference is profound, and underscores just how limiting the system is for too many New Yorkers.
Chart 1: Neighborhoods without an Accessible Station
Geography: NYC Department of City Planning, “Neighborhood Tabulation Area.” 2018.
Subway Stations: New York Transit Authority. “Static Data Feeds: General Transit Feed Specification,” MTA. 2018.
Accessibility: Transit Center. “Access Denied: Making the MTA Subway System Accessible to All New Yorkers,” 2017.
Indeed, of the 122 New York City neighborhoods served by the subway system, 62 do not have a single accessible station. Of these 62 “ADA transit deserts,” 55 are in the Bronx, Brooklyn, and Queens (see Chart 2).
Chart 2: Subway Accessibility and New York City Neighborhoods
| Borough | Neighborhoods served by the subway | Neighborhoods without a single accessible station | Share Inaccessible |
| Bronx | 28 | 19 | 59% |
| Brooklyn | 44 | 26 | 68% |
| Manhattan | 27 | 7 | 26% |
| Queens | 23 | 10 | 43% |
| Total | 122 | 62 | 51% |
Geography: NYC Department of City Planning, “Neighborhood Tabulation Area.” 2018.
Accessibility: Transit Center. “Access Denied: Making the MTA Subway System Accessible to All New Yorkers,” 2017.
Taking a step back, New York City’s “ADA transit deserts” are home to 199,242 mobility-impaired residents, 341,447 seniors above the age of 65, and 203,466 children below the age of five (see Chart 3). Aggregating these three groups—and eliminating overlap and redundancy—a total of 640,000 New Yorkers are confined to neighborhoods that are severely restricted from accessing the city’s vast subway network.
Chart 3: Subway Accessibility and Neighborhood Demographics
| At Least One Accessible Subway Station | Only Inaccessible Subway Stations | No Subway Stations | |
| Number of Neighborhoods | 60 | 62 | 67 |
| Mobility-Impaired Residents | 204,697 | 199,242 | 130,481 |
| Age 65+ Residents | 447,261 | 341,447 | 310,622 |
| Under Age 5 Residents | 220,916 | 203,466 | 131,001 |
| Seniors + Children Under Age 5 + Mobility-Impaired Under Age 65 |
759,733 | 638,246 | 499,294 |
Demographics: NYC DCP. “New York City Population FactFinder: Neighborhood Tabulation Area,” 2018.
The Effects of an Inaccessible System
Inaccessible subway stations place a severe strain on the lives of New York families, seniors, and the mobility-impaired. Lack of accessibility effects their choice of residence, their access to jobs, and their cost of living. It is responsible for countless compromises, sacrifices, and inconveniences, depreciating the quality-of-life of hundreds of thousands of New Yorkers.
For those mobility-impaired riders and their families who wish to live closer to an accessible station, local housing costs can be a serious deterrent. Median rents in neighborhoods with at least one accessible station are over $100 higher than in neighborhoods with only inaccessible stations ($1,310/month versus $1,205/month). Given that the disabled, injured, elderly, and families with young children already bear heavy expenses for medical care and other services, these higher rents can be prohibitive.
Chart 4: Subway Accessibility and Residential and Employment Prospects
| At Least One Accessible Subway Station | Only Inaccessible Subway Stations | |
| Number of Neighborhoods | 60 | 62 |
| Median Rent | $1,310 | $1,205 |
| Number of Local Jobs | 2,701,190 | 608,258 |
Median Rent: NYC DCP. “New York City Population FactFinder: Neighborhood Tabulation Area,” 2018.
Jobs: United States Census Bureau. “LEHD Origin-Destination Employment Statistics.” 2015.
For those seeking employment, meanwhile, accessibility gaps can severely restrict opportunities for the mobility-impaired. Those living in areas without accessible stations will struggle to reach the 2.7 million jobs in areas that are accessible by subway, while the 608,258 jobs in neighborhoods without subway accessibility are even more challenging to access.
These barriers to the labor market exacerbate the high rates of unemployment and low rates of workforce participation among the disabled. In New York City, only 23 percent of the mobility-impaired are employed or actively looking for work – compared to 74 percent of the non-disabled population (aged 25-65). And for those who are participating in the labor force, unemployment rates are a disturbing 16 percent for the mobility-impaired versus only 7 percent among the non-disabled.[1] These disparities were equally dramatic among the college educated—12 percent unemployment versus 4 percent.
Chart 5: Employment Outcomes for New Yorkers with and without a Mobility-Impairment
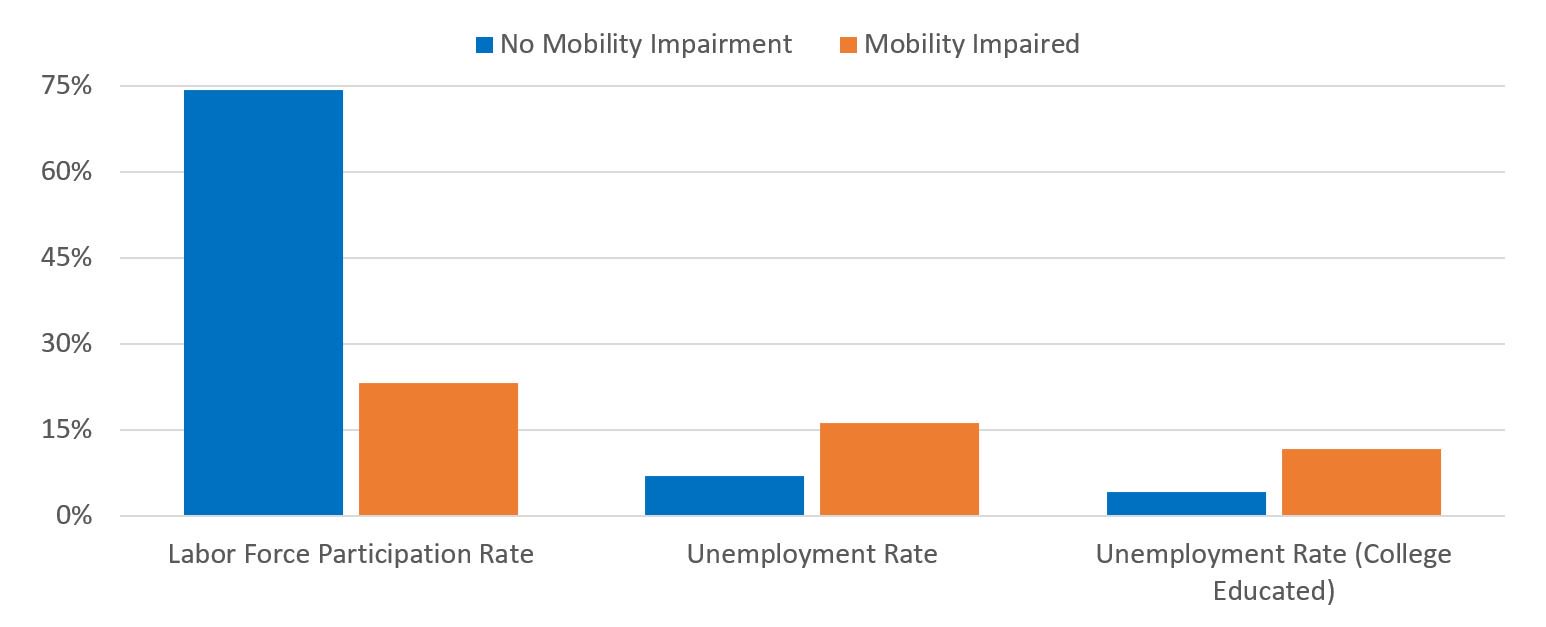
United States Census Bureau. American Community Survey 2012-2016, 5-Year Estimates.
These mobility-impaired residents have been left in the lurch by the MTA; victims of decades of underinvestment. Today, only 24 percent of the subway’s 472 stations are accessible, by far the lowest share among the country’s metropolitan rail systems. And while some of these systems were built after ADA legislation was introduced and were pre-engineered for accessibility, both Boston and Chicago are nearly as old (or older) than the New York City subway system, but are far more accessible.[2]
Only in New York are 640,000 residents being deprived of access to a rail system that is already built in their neighborhoods. Only in New York is the utility and reach of the subway system being systematically squandered.
Viewed in this light, it is clear that ADA upgrades are not just an ethical measure towards greater inclusivity or a regulatory measure towards legal compliance, but also an essential expansion effort to increase the reach of the subway system and relieve overcrowding at the handful of “key” stations that serve a disproportionate share of mobility-impaired riders.
The impact of these investments, in fact, would rival the MTA’s recent cluster of system expansion projects. The 34th Street-Hudson Yards terminus of the $2.5 billion 7 Train extension, for instance, served only 10,082 riders on average per day in 2017.[3] The four stations along the Second Avenue Subway line currently serve 190,000 riders per day. This first phase of the Second Avenue line cost $4.5 billion while the second phase, which is expected to add 100,000 new riders, is budgeted for $6 billion.[4] The East Side Access project connecting the LIRR to Grand Central station, meanwhile, will serve approximately 162,000 customers at a cost of over $11 billion.[5]
Together, this totals nearly $25 billion for projects that add (or divert) less than 500,000 riders. This is significantly fewer than the 640,000 riders who are severely restricted from using subway lines that are already built in their neighborhoods, but are not accessible to them.
Fast Forward and Funding
The New York City transit network—and by extension, the city itself—is facing an existential crisis. Infrastructure is failing, ridership is falling, delays are mounting, and construction costs are out of control.
Fortunately, new leadership at New York City Transit has advanced an ambitious Fast Forward plan to rescue and modernize local transit and sparked some much-needed optimism. Central to the Fast Forward plan is a promise to make 50 new stations ADA accessible in the next five years. These upgrades will be scattered throughout the five boroughs, so that no rider is more than two stops away from an accessible station.
Actually implementing these plans, however, will depend on significant external funding—along with a dramatic overhaul of contracting and procurement.
As a first step, the state legislature should introduce an $8 billion Transit Bond Act in the next session and bring it to referendum. When a transit bond act was last placed on the ballot in 2005, it was approved by 56 percent of New York State voters. The measure generated $2.9 billion, divided fairly between upstate and downstate needs.
In this iteration, downstate investments must include significant investment for ADA upgrades. With these dollars in place, the MTA can dramatically enhance the reach of the subway system and improve the lives of hundreds of thousands of New Yorkers.
Endnotes
[1] Note: The Census ACS collects unemployment data in a different manner than the Department of Labor. As a result, Census figures are often slightly higher than the DOL.
[2] National Transit Database, “Stations,” Federal Transit Administration. 2016.
[3] MTA, “Average Weekday Subway Ridership”, 2017.
Note: Ridership for the 7 Train extension, includes only riders entering the 34 St-Hudson Yards station. The other three ridership figures and projections include both entries and exits.
[4] AMNY. “The Second Avenue subway explained,” March 19, 2018.
[5] Castillo, Alfonso A. “East Side Access price goes up again, now stands at $11.2B,” Newsday. April 15, 2018.