Executive Summary
Playgrounds are essential community spaces in every city neighborhood. They are places where children can socialize, learn, experiment, be active, and exercise their imaginations. They are places where parents can watch their children mature and develop and where they can meet fellow parents and neighbors. Communities with abundant, safe, accessible, well-used, and well-designed playgrounds are communities where people want to raise their families and where they want to spend their time.
Unfortunately, New York City lags far behind other American cities when it comes to providing these critical public spaces.
In total, there are approximately 2,067 public playgrounds in New York City, including 1,028 overseen by the New York City Department of Parks and Recreation (NYC Parks), 796 maintained by the New York City Housing Authority (NYCHA), and 243 “Schoolyards to Playgrounds” that are located on Department of Education (DOE) property but open to the community after school hours.[1]
While these figures may appear substantial, they are, in fact, quite meager given the city’s large population. Among the 100 largest cities in the United States, New York ranks a lowly 48th in playgrounds per capita, behind Detroit, Milwaukee, Cleveland, St. Louis, Chicago, Boston, San Francisco, Minneapolis, and dozens of others.[2]
This report, by New York City Comptroller Scott M. Stringer, outlines the following challenges:
- On the whole, Brooklyn is the most underserved borough, with only eight NYC Parks playgrounds for every 10,000 children under the age of ten. By comparison, Manhattan has 15 and Staten Island 11. In eight Community Districts (CD), meanwhile, there are fewer than five playgrounds for every 10,000 children, including: Crown Heights South & Prospect Lefferts (CD9), Flatbush & Midwood (CD14), Bensonhurst (CD11), Borough Park (CD12), Jackson Heights (CD3), and Woodhaven & Richmond Hill (CD9).[3]
- To a large extent, these disparities are driven by a failure to anticipate, prepare for, and respond to changing demographics in our city. For instance, in the 15 neighborhoods with the lowest ratio of playgrounds, the number of local children increased by a robust 14 percent in recent years, from 275,088 in 2010 to 313,122 in 2017—or 89 percent of the net growth in children city-wide.[4]
- This uneven geography of playgrounds and failure to execute long-term planning is also evident with the Schoolyards to Playgrounds program. While the City promised to “transform 290 schoolyards into vibrant community parks by 2010” when the program was launched in 2007, it has yet to meet that goal. More troublingly, large sections of the south Bronx, western Queens and Brooklyn, and Manhattan have not reaped the benefits of upgraded school playgrounds that are open to the public after hours and on weekends.[5]
Of course, simply having a playground in your neighborhood is not enough. It is also critical that those playgrounds are stimulating, accessible, clean, and safe. Unfortunately, despite impressive progress in the last decades, this is not always the case.
- In 2018, NYC Parks deemed 159 playgrounds to be “unacceptable.” Conditions in Brooklyn were the most troubling, with 24 percent of playgrounds found to be unsafe or unsanitary.[6]
- Inspectors found that 521 NYC Parks playgrounds had at least one hazardous feature that required “immediate attention.” This included 807 “Priority 2 Hazards” that “present the chance of slight to moderate injury” and 29 “Priority 1 Hazards” that “present the chance of life-threatening or debilitating injury.”[7]
To resolve these maintenance issues and address the severe shortage of neighborhood playgrounds, the Office of the Comptroller outlined a comprehensive playground plan, including the build out of 200 new playgrounds in the next five years. Recommendations include:
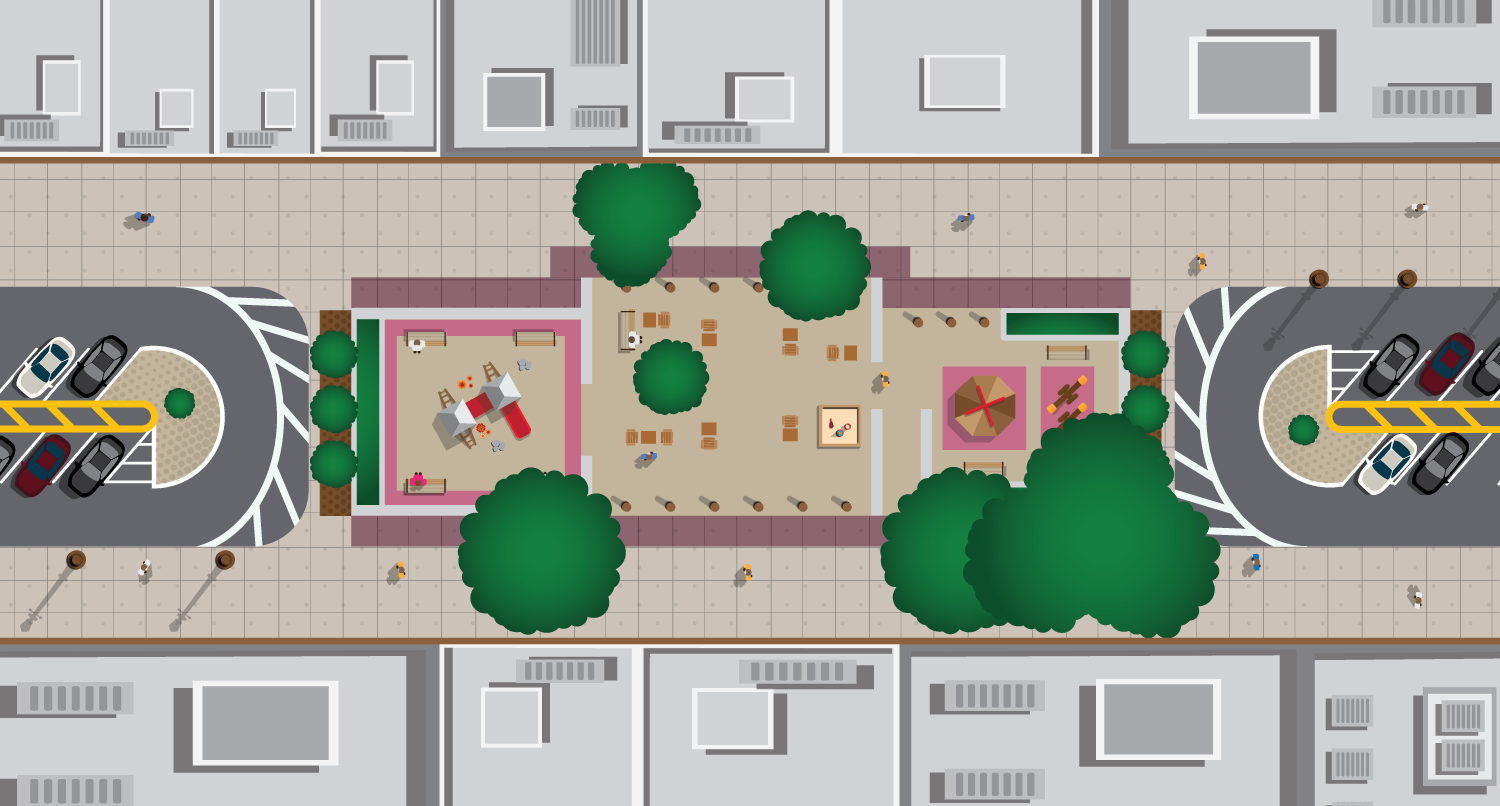
- Launch the “Pavement to Playgrounds” program. Targeting neighborhoods with insufficient and inadequate community space, the City should look to replicate the vibrant mid-block playground and public plaza on St. Marks Avenue in Crown Heights, Brooklyn. Built by the Bedford-Stuyvesant Restoration Corporation under the early leadership of Robert F. Kennedy, it should serve as a model for up to 100 playgrounds city-wide.
To accomplish this goal, NYC Parks, the Department of Transportation, and local Community Boards should identify neighborhood streets with minimal through traffic—either disconnected from the local grid or at dead ends—and build playgrounds mid-block (see rendering below). Angled street parking would be introduced so that the total number of parking spots would remain constant and, while through traffic would be eliminated, the street would continue to provide access to delivery trucks and service vehicles at both ends.
“Pavement to Playgrounds” model
- The City should dramatically expand its Schoolyards to Playgrounds program. More than a decade after the Schoolyards to Playgrounds program was first launched, the City has yet to achieve its three-year goal of 290 school playground conversions. This oversight should be rectified immediately. Working with proven non-profit partners, the City should break ground on an additional 100 Schoolyards to Playgrounds in the next five years and specifically target the Bronx, Queens, and Brooklyn neighborhoods that have experienced a tremendous increase in their nine-and-under population and have far too few playgrounds.
- NYC Parks should increase investment in maintenance and operations. While NYC Parks has made tremendous strides to improve the safety and cleanliness of their facilities in the last several decades, there are still far too many playgrounds in disrepair. Moving forward, the City should increase their budget for maintenance and operations, particularly in those neighborhoods where playgrounds have far too many “hazardous conditions.” Investment in the NYC Parks expense budget should be consistent with those demanded by the Play Fair Coalition, which includes over 100 community organizations as well as Parks employees.
- The City should develop stronger protections for “Jointly Operated Playground” properties. Among the 1,000 playgrounds overseen by NYC Parks, approximately one-quarter are maintained and operated as “Jointly Operated Playgrounds” that sit adjacent to school buildings. These properties remain in legally murky territory, with the City arguing that they are not protected by the New York State “public trust doctrine” which precludes the use of dedicated parkland for non-park uses. Given that the City is already deficient in its playground and park facilities, surrendering these properties to private development would be misguided. Moving forward, the City should adopt stronger protections, ensuring that “Jointly Operated Playgrounds” remain dedicated for public use.
- The City should ensure that its playground facilities serve a wide range of ages. Playgrounds are generally designed for a very specific age group, whether toddler, pre-school, or school-age. And while it is essential that each of these groups are well served, NYC Parks does little to classify, track, or communicate the target age of their facilities.
Moving forward, NYC Parks maps, directories, and inventories should designate the age group that each of its playground facilities was designed for and, using this information, address gaps in their playground inventory to ensure there are sufficient age-appropriate facilities for all New York City children.
Introduction
An adventure playground on Governors Island. A jungle gym shaped like a printing press in the Bronx. Dragons, sharks, and warships at the Seaside Nature Wildlife Playground in Staten Island. A music-themed playground in Prospect Park.
New York City’s playgrounds are not lacking in inventiveness, eclecticism, and joy. They are, however, lacking in number.
Among the 100 largest cities in the United States, New York ranks a lowly 48th in playgrounds per capita.[8] And while Minneapolis, Boston, Cincinnati, Louisville, and Madison all feature more than four playgrounds for every 10,000 residents, New York City has fewer than two and a half (see Chart 1).
Chart 1: Number of playgrounds per 10,000 residents in the 100 largest U.S. cities
![]()
The Trust for Public Land, “City Park Facts,” 2018.
In total, there are approximately 2,067 playgrounds in New York City. This includes 1,028 overseen by the New York City Department of Parks and Recreation (NYC Parks), 796 maintained by the New York City Housing Authority (NYCHA), and 243 “schoolyards to playgrounds” that are located on Department of Education (DOE) property, but open to the community after school hours (see Chart 2).[9]
Chart 2: New York City public playgrounds
Playgrounds 1,028 |
Playgrounds 796 |
Playgrounds Conversions 243 |
TOTAL 2,067 |
NYC Open Data and Office of the New York City Comptroller.
Of course, the size, quality, and number of these playgrounds varies dramatically from neighborhood to neighborhood. While some communities enjoy dozens of playgrounds within walking distance of their homes, in others, parents must travel a significant distance to find suitable playgrounds for their children.
On the whole, Brooklyn is the most underserved, with only eight playgrounds for every 10,000 children under the age of ten years old. By comparison, Manhattan has 15 and Staten Island has 11 (see Chart 3).[10]
Chart 3: NYC Parks playgrounds per 10,000 children, by borough
Playgrounds: NYC OpenData. “Parks Inspection Program – All Sites.”
Population: United States Census Bureau. American Community Survey 2017.
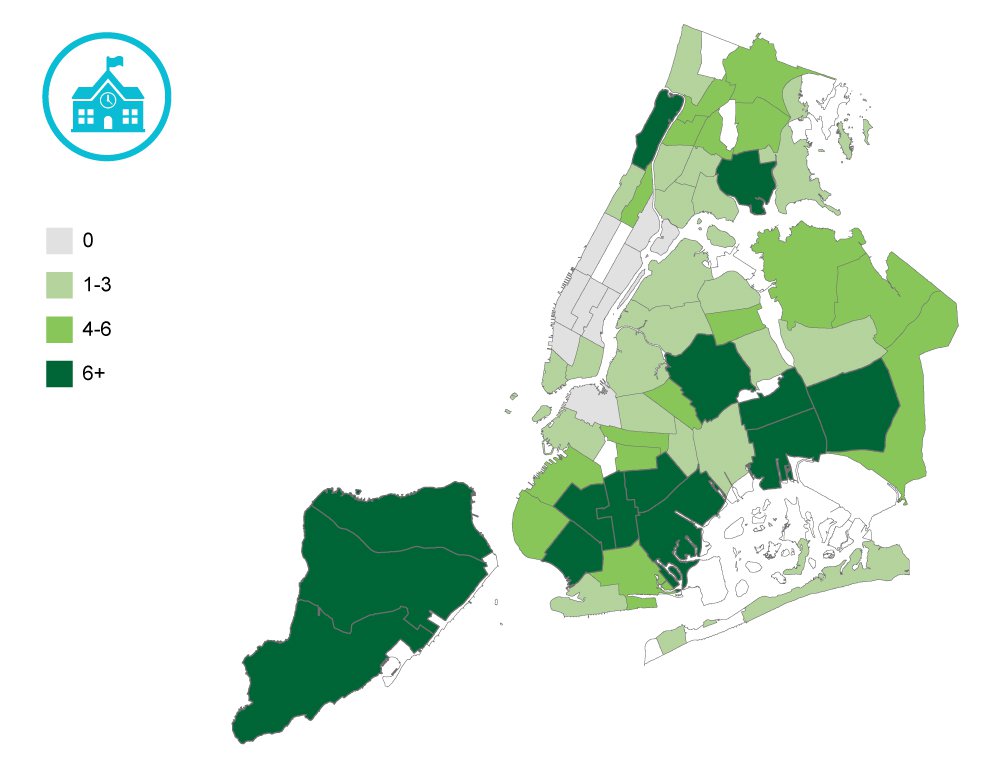
Drilling down to the Community District (CD) level, a number of neighborhoods are severely underserved by playground facilities.[11] For instance, Crown Heights South & Prospect Lefferts (CD9), Flatbush & Midwood (CD14), Bensonhurst (CD11), Borough Park (CD12), Jackson Heights (CD3), and Woodhaven & Richmond Hill (CD9) all have fewer than ten NYC Parks playgrounds (see Chart 4) and fewer than five playgrounds for every 10,000 children.[12]
Chart 4: Total number of NYC Parks playgrounds, by Community District

NYC OpenData. “Parks Inspection Program – All Sites.”
To a large extent, these disparities are driven by a failure to anticipate, prepare for, and respond to changing demographics in our city. For instance, in the 15 neighborhoods with the lowest ratio of playgrounds, the number of local children grew by a robust 14 percent in recent years, from 275,088 in 2010 to 313,122 in 2017 (see Chart 5).[13]
Chart 5: Neighborhoods with the fewest NYC Parks playgrounds per 10,000 Children
| Neighborhoods | Community District | Parks Playgrounds per 10,000 Children | Children 9 and under | ||
|---|---|---|---|---|---|
| 2010 | 2017 | Growth, 2010 to 2017 | |||
| Borough Park, Kensington & Ocean Parkway | Brooklyn CD 12 | 2.0 | 33,130 | 29,877 | -10% |
| Bensonhurst & Bath Beach | Brooklyn CD 11 | 2.7 | 18,826 | 25,789 | 37% |
| Richmond Hill & Woodhaven | Queens CD 9 | 3.0 | 15,590 | 16,574 | 6% |
| Flatbush & Midwood | Brooklyn CD 14 | 3.2 | 22,962 | 22,098 | -4% |
| Jackson Heights & North Corona | Queens CD 3 | 3.9 | 21,727 | 23,350 | 7% |
| Upper East Side | Manhattan CD 8 | 4.3 | 19,109 | 18,628 | -3% |
| Crown Heights South, Prospect Lefferts & Wingate | Brooklyn CD 9 | 4.6 | 13,384 | 13,065 | -2% |
| Co-op City, Pelham Bay & Schuylerville | Bronx CD 10 | 4.8 | 9,106 | 10,449 | 15% |
| East Flatbush, Farragut & Rugby | Brooklyn CD 17 | 5.1 | 18,203 | 15,807 | -13% |
| Sunset Park & Windsor Terrace | Brooklyn CD 7 | 5.1 | 19,334 | 21,498 | 11% |
| Bedford Park, Fordham North & Norwood | Bronx CD 7 | 5.6 | 18,178 | 26,564 | 46% |
| Sheepshead Bay, Gerritsen Beach & Homecrest | Brooklyn CD 15 | 6.0 | 13,868 | 23,452 | 69% |
| Crown Heights North & Prospect Heights | Brooklyn CD 8 | 6.1 | 14,461 | 16,480 | 14% |
| New Springville & South Beach | Staten Island CD 2 | 6.3 | 14,043 | 19,184 | 37% |
| East New York & Starrett City | Brooklyn CD 5 | 6.3 | 23,167 | 30,307 | 31% |
| Total | 4.5 | 275,088 | 313,122 | 14% | |
Playgrounds: NYC OpenData. “Parks Inspection Program – All Sites.”
Population: United States Census Bureau. American Community Survey 2017.
By comparison, in the fifteen Community Districts with the highest ratio of playgrounds per 10,000 children, the total nine-and-under population fell by six percent and nine of these communities saw the number of children fall or stay steady during this period.[14]
Clearly, playground construction is lagging behind the times and failing to account for changing demographics in our city neighborhoods.
Schoolyards to Playgrounds
In 2007, the “Schoolyard to Playgrounds” program was launched in partnership with NYC Parks, DOE, School Construction Authority, and the Trust for Public Land. The City promised to “transform 290 schoolyards into vibrant community parks by 2010” and invest $111 million in upgrading these facilities.
While the program has proven to be a great success and inspired Philadelphia, Newark, San Francisco, and Los Angeles to follow suit, the City remains dozens of playgrounds short of its 290 schoolyard goal.[15]
Moreover, while Staten Island, central Brooklyn, and eastern Queens have benefitted from a significant investment in Schoolyard to Playground conversions, in the south Bronx, western Queens, northeast Brooklyn, and Manhattan, the City has neglected to make vital investments in school playgrounds (see Chart 6).
Chart 6: School Yards to Playgrounds, by Community District
NYC OpenData. “Directory of Schoolyard to Playground conversions.”
Clearly, there is an opportunity for the City to reach—and surpass—its 2007 build-out goal while also investing in neighborhoods that have largely been left out of this innovative and vital program.
Playground Conditions
Whether a schoolyard or NYC Parks facility, simply having a playground in your neighborhood is not enough. It is also critical that those playgrounds are stimulating, accessible, clean, and safe.
In 1984, NYC Parks launched the Parks Inspection Program, dispatching staff to assess the structural, landscape, and sanitary conditions of each of its facilities and determining whether they were “acceptable” or “unacceptable.” The program has proven highly successful, catalyzing increased investment in maintenance and upkeep. From 1994 to 2017, the rate at which City parks were deemed “acceptable” increased from 39 percent to 85 percent.[16]
While this progress is commendable, there is still a long way to go. Today, hundreds of NYC Parks playgrounds remain unsatisfactory and unsafe. Looking at the most recent round of inspections in 2018, for instance, NYC Parks deemed 159 playgrounds to be “unacceptable” due to a) multiple features being unsatisfactory, b) one feature having a serious safety hazard, or c) the playground having a failed cleanliness rating.[17]
Conditions in Brooklyn were the most severe, with 24 percent of playgrounds deemed unacceptable. This was nearly triple the rate of Staten Island playgrounds (see Chart 7).[18]
Chart 7: Playgrounds rated “unacceptable” in most recent 2018 PIP inspection
NYC OpenData. “Parks Inspection Program – Inspections.”
Narrowing the lens further, more than 25 percent of local playgrounds were found to be “unacceptable” in 12 Community Districts, including one in Manhattan, two in the Bronx, three in Queens, and six in Brooklyn (see Chart 8).[19]
Chart 8: The share of “unacceptable” playgrounds, by Community District
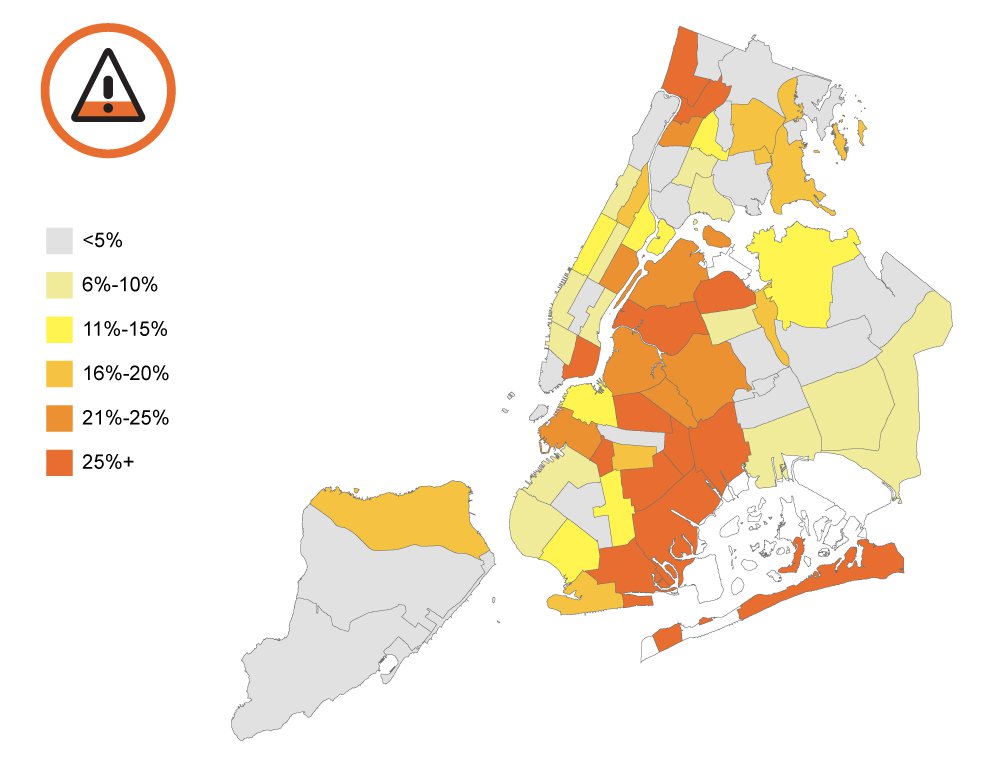
NYC OpenData. “Parks Inspection Program – Inspections.”
Even more disconcertingly, inspectors found that 521 NYC Parks playgrounds had at least one hazardous feature that required “immediate attention” at the time of the most recent inspection. This included 807 “Priority 2 Hazards” that “present the chance of slight to moderate injury” and 29 “Priority 1 Hazards” that “present the chance of life-threatening or debilitating injury.”[20]
Found either inside or within the vicinity of NYC Parks playgrounds, these hazardous features included 52 pieces of play equipment, 34 benches, 42 fences, and 282 paved and safety surfaces that presented a risk of injury.[21]
In total, 11 Community Districts had more than 12 playgrounds with hazardous features that demanded immediate attention. This included five Districts in Brooklyn, three in Queens, and three in Manhattan (see Chart 9).[22]
Chart 9: The number of “hazardous” playgrounds, by Community District
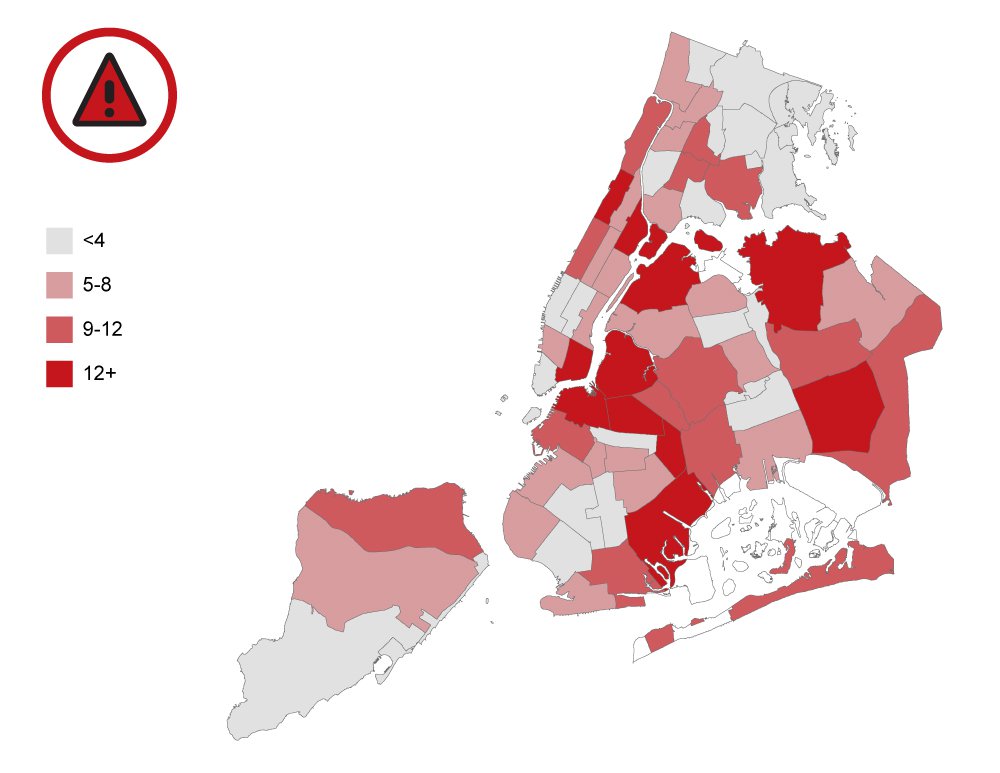
NYC OpenData. “Parks Inspection Program – Feature Ratings.”
Clearly, NYC Parks playgrounds demand more active attention and maintenance. In order to provide clean and safe facilities for all New York City children, increased staffing and resources will be needed.
Recommendations
Having the opportunity to play in a clean, safe, and easily accessible playground should not depend on the zip code where you live. To address the vast disparities in playground availability and conditions throughout the five boroughs, the City must adopt a more thoughtful and targeted approach to building and maintaining playgrounds.
Moving forward, the Comptroller’s Office recommends that the New York City Department of Parks and Recreation (NYC Parks)—along with the Department of Transportation (NYC DOT), the Department of Education (DOE), and local Community Boards—identify suitable sites in every neighborhood and build 200 additional playgrounds in the next five years. To achieve this ambitious goal, the City should engage relevant nonprofits in the planning, design, and funding of these playgrounds, as has been the case with the successful Schoolyards to Playgrounds program.
Recommendation One: NYC Parks and NYC DOT should launch the “Pavement to Playgrounds” program, building 100 new playgrounds in the next five years with this new and innovative playground model
On St. Marks Avenue, nestled between Albany and Kingston in Crown Heights, Brooklyn, a playground sits at the center of the block, offering a place to congregate for local residents, seniors, families, and children of all ages. On both sides, it is flanked by angled street parking, offering more spots than even the typical city block. And, while the street is cut off from through traffic, it continues to provide access to delivery trucks and service vehicles at both ends (see Chart 10).
Chart 10: “Pavement to Playgrounds” model

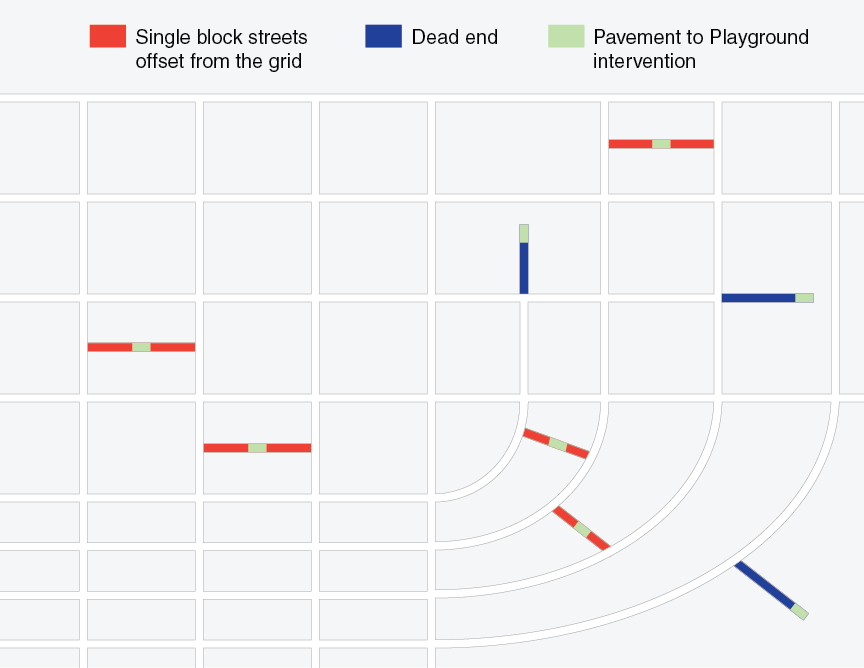
Across the five boroughs, there are thousands of blocks that could accommodate a similar intervention (see Chart 11). Blocks that are sparsely travelled by through traffic, have sufficient width, are disconnected from the local street grid, where street parking is in high demand, and, most importantly, where playgrounds and benches—or dog runs or fitness equipment or skate parks—are in short supply within the neighborhood.
Chart 11: “Pavement to Playgrounds” potential site locations
In the next five years, NYC Parks, NYC DOT, and local Community Boards should work together to identify suitable sites in every neighborhood and build 100 additional playgrounds using this model. To achieve this ambitious goal, the City should engage relevant nonprofits in the design, construction, and funding of these playgrounds, as has been the case with the Schoolyards to Playgrounds program.
Nonprofit partners can help defray the costs of these new playgrounds, which will generally range from one to two million dollars. The NYC DOT, meanwhile, would bear primary responsibility for the costs associated with curb and bollard enhancements.
Recommendation Two: The City should dramatically expand its Schoolyards to Playgrounds program
More than a decade after the Schoolyards to Playgrounds program was first launched, the City has yet to achieve its three-year goal of 290 school playground conversions. Clearly, it is far past time to meet (and far exceed) this benchmark. The City should work with proven non-profit partners to break ground on an additional 100 Schoolyards to Playgrounds in the next five years and specifically target the Bronx, Queens, and Brooklyn neighborhoods that have experienced a tremendous increase in their nine-and-under population and have far too few playgrounds.
Recommendation Three: NYC Parks should increase investment in maintenance and operations
While NYC Parks has made tremendous strides to improve the safety and cleanliness of its facilities in the last several decades, there are still far too many playgrounds in disrepair. Moving forward, the City should increase their budget for maintenance and operations, particularly in those neighborhoods where playgrounds have far too many “hazardous conditions.” Investment in the NYC Parks expense budget should be consistent with those demanded by the Play Fair Coalition, which includes over 100 community organizations as well as Parks employees.
Recommendation Four: The City should develop stronger protections for “Jointly Operated Playground” properties
Among the 1,000 playgrounds overseen by NYC Parks, approximately one-quarter are maintained and operated as “Jointly Operated Playgrounds” that sit adjacent to school buildings. These properties remain in legally murky territory, with the City arguing that they are not protected by the New York State “public trust doctrine” which precludes the use of dedicated parkland for non-park uses.
Given that the City is already deficient in its playground and park facilities, surrendering these properties to private development is severely misguided. Moving forward, the City should adopt stronger protections, ensuring that “Jointly Operated Playgrounds” remain dedicated for public use.
Recommendation Five: The City should ensure that its playground facilities serve a wide range of ages
Playgrounds are generally designed for a very specific age group, whether toddler, pre-school, or school-age. And while it is essential that each of these groups are well served, NYC Parks does little to classify, track, or communicate the target age of their facilities.
Moving forward, NYC Parks maps, directories, and inventories should designate the age group that each of its playground facilities was designed and intended for. Using this information, NYC Parks should identify gaps in their playground inventory and work to ensure that there are a sufficient number of age-appropriate facilities for New York City children to play, learn, and socialize.
Acknowledgements
Comptroller Scott M. Stringer thanks Adam Forman, Chief Policy & Data Officer and the lead author of this report. He also recognizes the important contributions made by David Saltonstall, Assistant Comptroller for Policy; Jacob Bogitsh, Policy Analyst for Economic Development; Angela Chen, Senior Web Developer and Graphic Designer; Eugene Resnick, Senior Press Officer; Tian Weinberg, Senior Press Officer; Alex Wunrow, Digital Media Manager; and Susan Watts, Director of Visual Content.
Endnotes
[1] For NYC Parks: NYC OpenData. “Parks Inspection Program – All Sites.” January 29, 2019.
Includes all properties classified as either a “Neighborhood Playground” or “Playground within Park,” all playgrounds classified as “Jointly Operated Playgrounds,” and a handful of properties that are named “playgrounds,” but classified as some variation of a “small park.”
For NYCHA Playgrounds: Office of the New York City Comptroller. “Audit Report on the New York City Housing Authority’s Maintenance and Inspection of Its Playgrounds,” April 4, 2018.
For Schoolyards to Playgrounds: NYC OpenData. “Directory of Schoolyard to Playground conversions.”
While only 231 Schoolyards to Playgrounds are listed on the City’s OpenData website, elsewhere it has been reported that the City has somewhere between 251 and 264. In addition to the 231 officially listed, this report added 12 sites from the “Parks Inspection Program” directory.
[2] The Trust for Public Land, “City Park Facts,” 2018.
[3] NYC OpenData. “Parks Inspection Program – All Sites.” January 29, 2019.
[4] United States Census Bureau. American Community Survey 2017.
[5] The Trust for Public Land, “NYC Launches “Schoolyard to Playground” Initiative,” July 2, 2007.
[6] NYC OpenData. “Parks Inspection Program – Inspections,” January 29, 2019.
Includes the most recent available inspection for each playground, all of which occurred sometime between March and October of 2018.
[7] NYC OpenData. “Parks Inspection Program – Feature Ratings,” January 29, 2019.
[8] The Trust for Public Land, “City Park Facts,” 2018.
Drawing from NYC OpenData as well as Office of the Comptroller audits, we identified more NYC Parks and NYCHA playgrounds than the Trust for Public Land. As such, we adjusted New York City’s playgrounds-per-capita figure and ranking accordingly.
[9] See Endnote 1.
[10] NYC OpenData. “Parks Inspection Program – All Sites.”
[11] For this analysis, only the 972 NYC Park playgrounds located within a Community Districts were counted. The 64 NYC Parks playgrounds located in signature parks – e.g. Central Park, Prospect Park, Van Cortlandt Park, Gateway National Recreation Area, etc. – were not included.
[12] NYC OpenData. “Parks Inspection Program – All Sites.”
United States Census Bureau. American Community Survey 2017.
[13] ibid
[14] ibid
[15] The Trust for Public Land, “NYC Launches “Schoolyard to Playground” Initiative,” July 2, 2007.
[16] Surico, John. “A New Leaf: Revitalizing New York City’s Aging Parks Infrastructure,” June 2018. Center for an Urban Future.
[17] NYC OpenData. “Parks Inspection Program – Inspections.”
[18] ibid
[19] ibid
[20] NYC OpenData. “Parks Inspection Program – Feature Ratings.”
[21] ibid
[22] ibid