
Executive Summary
Superstorm Sandy laid bare the vulnerabilities of New York City’s coastal communities and infrastructure. The storm resulted in the deaths of 43 city residents and caused damages estimated at $19 billion.[1] With the support of the Federal government, the City initiated billions of dollars of investments in recovery and new resiliency infrastructure. These initiatives have gone a long way to repair damaged homes, elevate mechanical and electrical systems, install backup generators, and support the recovery of impacted residents and businesses.
However, a decade later, many of these projects remain far from completion. This report analyzes progress on resiliency capital spending to date. The report goes on to provide a snapshot of the property values, land uses, and essential infrastructure in the coastal floodplain, illustrating the range of critical assets at risk. Concrete recommendations to improve planning, design, and delivery of resiliency projects offer a path forward for the City’s future resiliency efforts as we reflect on the ten-year anniversary of Sandy and better prepare for future storms.
Snapshot of Key Findings
City Spending
- Of the $15 billion of federal grants appropriated for Sandy recovery and resilience, the City has spent $11 billion, or 73%, as of June 2022. The City has spent 66.2% of the nearly $10 billion in FEMA Sandy grants, and 92.4% of the $4.2 billion HUD CDBG-DR grants.
- However, these figures only tell a partial story of progress, as the City’s Sandy tracker only captures the spending of federal grants, and does not include the City’s own capital contributions. For instance, the Sandy Funding Tracker only accounts for $338 million (18%) of the $1.9 billion total East Side Coastal Resiliency budget, the share being paid by federal funds. The Comptroller’s under-the-hood examination of total project budgets and actual liquidations shows that the City has spent only 13.3% of the $1.9 billion ESCR budget.
- The FY23 Capital Plan indicates that the anticipated completion dates for some of the uncompleted Coastal Resiliency Projects are as far out as 2030.
Real Estate & Essential Infrastructure
- In the past decade as new waterfront developments have steadily increased, market rate values of real estate in the 100-year floodplain have increased to over $176 billion – a 44% increase since Superstorm Sandy.
- Rising tides and more frequent storms will put upwards of $242 billion (in current market value) at risk of coastal flooding by the 2050s – a 38% increase in value from today with Brooklyn experiencing the most dramatic increases in property values at risk in the coming decades.
- The tax lots in the current 100-year floodplain are estimated to generate $2.0 billion in annual property taxes. As the floodplain grows, more tax lots will be put at risk, threatening $3.1 billion in annual projected property tax revenues by the 2050s (using current property values).
- The City’s overall housing stock will become increasingly at risk over the next several decades, but public housing will be particularly impacted. Today, 17% of NYCHA’s buildings are in the 100-year floodplain; this number will grow to 26% by the mid-century.
- Significant essential infrastructure lies in the 100-year floodplain, including:
- 79% of transportation and utility land uses that support our electric and gas utilities, rail yards, airports, docks and piers, bridges, tunnels, and highways.
- 67% of open space and outdoor recreation areas, from neighborhood parks that provide vital space for local residents to iconic parks that draw visitors.
- 46% of the city’s industrial and manufacturing that house waste transfer stations, construction businesses, warehouses and distribution centers – industries on which our local economy and supply chain rely.
Summary of Recommendations
As New York City observes the ten-year anniversary of Superstorm Sandy, the devastation caused by Hurricane Ian in Florida and Puerto Rico and the deadly floods in Pakistan serve as a cruel but important reminder to address our slow progress on resiliency infrastructure. We must find ways both to improve the delivery of climate resiliency projects (and capital projects in general), and to update the city’s long-term resiliency plans. This is the moment not only to complete projects commenced after Sandy, but to adjust our plans to address a broader understanding of climate risks (such as those impacted by Hurricane Ida, as well as by recent deadly heat waves in Europe and South Asia) and to make the best possible use of new federal funds, including Ida disaster recovery funds and the Infrastructure Investment and Jobs Act.
Strengthen the City’s capacity to deliver capital projects on time and on budget.
- Accelerate the pace of incomplete resiliency projects and future capital projects by rapidly implementing the initial recommendations of First Deputy Mayor Grillo’s Capital Process Reform Task Force and pushing aggressively forward on longer-term action.
- Improve public transparency of capital project tracking.
- Implement grant accounting procedures for federal funds to improve the City’s ability to track and maximize federal reimbursement.
- Fully fund operations and maintenance activities associated with emergency activation and long-term maintenance of new resilient infrastructure.
Revisit and update the City’s long-term resiliency plans to address our current understanding of climate risks and maximize use of forthcoming federal funds.
- Develop a citywide long-term resiliency plan to address long-term land use changes.
- Codify design guidelines for resiliency infrastructure.
- Establish diverse and sustained funding sources for future resiliency investments.
Introduction
Ten years ago, Superstorm Sandy made landfall in New York City on October 29, 2012, tragically killing 43 New Yorkers and causing significant destruction to communities, homes, and infrastructure in its wake.[2] Over two million New Yorkers lost power—some for weeks—as damages to the electrical grid and fuel shortages caused disruptions for over a month.[3] Nearly 70,000 housing units and 800 buildings were destroyed or structurally damaged.[4] The storm also upended livelihoods, impacting 23,400 businesses located in the areas inundated by floodwaters.[5] Many bridges, tunnels, and transit stations sustained significant damages, making it difficult for people to travel and vital goods to be delivered. In total, Sandy resulted in $19 billion of damages and losses across the five boroughs.[6]
As Sandy’s ten-year anniversary approaches, it is clear that more storms are coming. As the impacts of Hurricane Ian in Florida and Puerto Rico have tragically reminded us, the intensity and frequency of hurricanes is increasing as the planet warms. There is no way to predict where and when the next coastal storm will hit New York, but its likelihood has only increased. Meanwhile, the devastation one year ago due to flash flooding from Hurricane Ida, and the deaths from extreme heat waves in Europe and the Pacific Northwest this past summer, instruct us that deadly climate risk does not come only from coastal storms.
Over the last decade, the City has taken many steps to rebuild the infrastructure that was destroyed in a more resilient manner. With $15 billion of federal disaster recovery grants and billions more in City capital funds, the City has initiated projects to rehabilitate and harden damaged infrastructure, rebuild destroyed homes and NYCHA buildings, support businesses to make resiliency improvements, and build new coastal protection infrastructure along vulnerable shorelines.
However, progress to implement these projects has been plodding. This report assesses the City’s progress on Sandy resiliency and recovery spending and highlights lessons that can be carried forward for resilient infrastructure planning and design efforts, especially as the City is poised to receive $188 million new federal dollars for Hurricane Ida[7] recovery and billions more through the Investment and Jobs Act (IIJA).
As the City continues to advance its resiliency capital investments, much of the city still remains vulnerable to coastal flooding and sea level rise. The report will also provide a snapshot of the communities, land uses, properties facing coastal flood risk, to assess how the NYC’s risk profile has evolved in the last ten years.
Resiliency and Recovery Progress
Superstorm Sandy spurred billions of dollars for new resiliency infrastructure. Federal programs, primarily from Federal Emergency Management Agency (FEMA) and the Department of Housing and Urban Development (HUD) Community Development Block Grant Disaster Recovery (CDBG-DR) programs, provided significant disaster grant assistance to not only repair or replace damaged infrastructure and facilities, but also to build new, more resilient assets to protect against future storms. The City is devoting funds to address critical infrastructure from hospitals to homes and bridges to ferry landings.
In total, the City has spent $11 billion, or 73%, of its $15 billion federally allocated grants appropriated for Sandy recovery and resiliency. While this represents modest progress since 2019 when only 54% of those federal grants had been spent,[8] there is still much work to be done to complete project implementation.
This analysis in this report is derived from information provided by the City’s Office of Management and Budget (OMB) on Sandy federal grant spending as of June 2022. Information on federal grant allocations and spending is publicly available on the City’s Sandy Funding Tracker. For a few key resiliency projects, the Comptroller’s Office conducted a deeper dive of project-level information, including the accompanying City capital spending to provide a more detailed and comprehensive picture of the plodding progress of implementation.
FEMA Funding
The majority of the City’s Sandy FEMA grants come from the FEMA Public Assistance program for debris removal, emergency protective measures, and repair, replacement, or restoration of publicly owned facilities damaged by disaster.[9]
As of June 2022, the City has spent 66.2% of the nearly $10 billion in allocated FEMA Sandy grants. This figure represents a 22.7% percentage point increase from the Comptroller’s Office’s last budget analysis in 2019, when only 43.9% of the FEMA funds had been spent.[10]
FEMA grant allocations, as well as rates of agency spending, vary significantly by agency. Of all 53 agencies that received FEMA grants, four agencies received over a billion dollars each in FEMA grants: the New York City Housing Authority (83.5% spent), Health and Hospitals Corporation (45.3% spent), Department of Environmental Protection (58.8% spent), and Department of Parks and Recreation (61.8% spent). On the other end of the spectrum, 20 agencies received less than $300,000.
A majority of agencies (34) have spent 75% or more of their allocations. A dozen agencies, including the Department of Design and Construction (DDC), the Department of Citywide Administrative Services (DCAS), and Department of Buildings (DOB), have completed all FEMA grant spending.
However, just as many agencies have spent less than half of their allocations. Most notably, of the agencies with significant FEMA grants, the NYC Economic Development Corporation has only spent 10.6% of its $169 million[11] and the Brooklyn Navy Yard Development Corporation has only spent 5.9% of its $98 million.
Several agencies raised challenges with initial scoping, as the City did not always have sufficient documentation of pre-storm conditions to prove damages caused during Sandy, and that additional damages were discovered after projects had advanced. For instance, $98 million for the Brooklyn Navy Yard reflects a recent increase of $18.4 million allocated in 2022 to address added scope after infrastructure assessments documented more damages than the original FEMA grant included. Because all scope and funding changes require rounds of review and approvals from both New York Department of Homeland Security and Emergency Services and FEMA, these changes contributed to timeline delays.
Table 1: FEMA Allocations and Spending by Agency (Q2 2022)
| Agency | Federal Grants Awarded | Spent to Date | Percent Spent |
|---|---|---|---|
| Administration for Children’s Services | $723,606 | $655,635 | 90.6% |
| Board of Elections | $5,404,189 | $5,404,189 | 100.0% |
| Brooklyn Borough President | $9,594 | $9,594 | 100.0% |
| Brooklyn Bridge Park* | $1,281,570 | $1,102,991 | 86.1% |
| Brooklyn Navy Yard Development Corporation | $98,019,521 | $5,770,581 | 5.9% |
| Brooklyn Public Library | $4,152,563 | $0 | 0.0% |
| Campaign Finance Board | $59,164 | $59,164 | 100.0% |
| City Council | $11,761 | $11,703 | 99.5% |
| City University of New York | $25,406,376 | $2,452,815 | 9.7% |
| Civilian Complaint Review Board | $146,368 | $140,522 | 96.0% |
| Deferred Compensation Plan | $19,681 | $19,681 | 100.0% |
| Department for the Aging | $498,171 | $477,204 | 95.8% |
| Department of Buildings | $4,664,518 | $4,664,518 | 100.0% |
| Department of Citywide Administrative Services* | $24,001,354 | $24,001,354 | 100% |
| Department of Consumer Affairs | $21,245 | $21,244 | 100.0% |
| Department of Correction | $88,838,628 | $40,116,216 | 45.2% |
| Department of Cultural Affairs | $192,266,003 | $112,421,625 | 58.5% |
| Department of Design and Construction | $10,507,286 | $10,507,286 | 100.0% |
| Department of Education | $37,497,527 | $33,079,431 | 88.2% |
| Department of Environmental Protection | $1,174,124,715 | $690,815,091 | 58.8% |
| Department of Finance | $271,842 | $252,797 | 93.0% |
| Department of Health and Mental Hygiene | $12,187,691 | $6,661,251 | 54.7% |
| Department of Homeless Services | $22,729,075 | $16,117,880 | 70.9% |
| Department of Information Technology and Telecommunications | $8,641,705 | $8,292,425 | 96.0% |
| Department of Investigation | $76,474 | $77,029 | 100.7% |
| Department of Parks and Recreation | $1,110,905,390 | $687,084,914 | 61.8% |
| Department of Probation | $104,954 | $102,899 | 98.0% |
| Department of Records and Information Services | $7,692 | $7,692 | 100.0% |
| Department of Sanitation | $218,716,332 | $196,707,163 | 89.9% |
| Department of Social Services (Human Resources Administration) | $13,668,863 | $12,910,765 | 94.5% |
| Department of Transportation | $142,370,315 | $66,946,650 | 47.0% |
| Department of Youth and Community Development | $233,564 | $177,339 | 75.9% |
| District Attorney – New York County | $7,612,863 | $4,580,518 | 60.2% |
| District Attorney – Richmond County | $12,537 | $11,836 | 94.4% |
| Economic Development Corporation | $168,956,907 | $17,918,010 | 10.6% |
| Financial Information Services Agency | $112,350 | $106,539 | 94.8% |
| Fire Department | $230,320,563 | $99,032,149 | 43.0% |
| Health and Hospitals Corporation | $1,863,119,819 | $844,126,996 | 45.3% |
| Housing Preservation and Development | $9,473,363 | $8,940,598 | 94.4% |
| Law Department | $149,697 | $149,697 | 100.0% |
| New York City Taxi and Limousine Commission | $132,606 | $103,421 | 78.0% |
| New York Public Library | $4,436 | $0 | 0.0% |
| NYCHA | $3,181,028,330 | $2,657,290,187 | 83.5% |
| Office of Administrative Trials and Hearings | $31,726 | $13,045 | 41.1% |
| Office of Collective Bargaining | $6,030 | $6,269 | 104.0% |
| Office of Emergency Management | $14,778,948 | $12,900,093 | 87.3% |
| Office of the Mayor | $212,983,470 | $158,217,362 | 74.3% |
| Office of the Public Advocate | $1,114 | $898 | 80.6% |
| Police Department | $296,116,414 | $243,016,471 | 82.1% |
| Queens Borough Public Library | $6,281,003 | $3,645,764 | 58.0% |
| School Construction Authority | $797,178,527 | $639,941,087 | 80.3% |
| Teachers’ Retirement System of NYC | $255,562 | $254,293 | 99.5% |
| Trust for Governors Island | $15,431,600 | $3,215,553 | 20.8% |
| Total | $10,001,555,597 | $6,620,540,432 | 66.2% |
* The amount of federal grants awarded and spending to date reflects self-reported data from agencies that identified major discrepancies in their spending and the City’s Sandy Funding Tracker
HUD CDBG-DR Spending
Following Superstorm Sandy, the City of New York received $4.2 billion of HUD CDBG-DR funding to repair and restore disaster-affected areas. These funds are flexibly designed for communities to tackle an array of needs, including rebuilding safe and resilient housing, assisting displaced tenants, providing resources for impacted businesses to become more resilient, and build coastal flood protection infrastructure. These grants included funding from the general CDBG-DR program, as well as funding for the Rebuild By Design program that HUD created in the aftermath of Sandy to spur resiliency innovation instead of only building back to pre-storm conditions. The City’s CDBG-DR grants fund some of the City’s most high-profile initiatives, such as the Build It Back program to repair, rebuild, elevate, or relocate homes damaged by Sandy,[12] as well as the East Side Coastal Resiliency project which is part of the BIG U.[13]
In comparison to the Sandy FEMA funds, all CDBG-DR funds came with a use-or-lose timeline that called for recipients to complete spending of federal grant money by 2022. That deadline was recently extended to 2025 as part of the Consolidated Appropriations Act passed by Congress in 2022.[14]
The City has spent 92.4% of its total $4.2 billion HUD CDBG-DR allocation as of June 2022, with roughly $321 million to spend before the 2025 deadline. Federal spending is nearly complete across all program areas except for the Coastal Resiliency projects that together make up about 10% of the total CDBG-DR allocation. While it is typical for such complex infrastructure projects to see the lion’s share of costs during later construction phases, the portfolio of Resiliency projects has, in aggregate, only spent 36.3% of its allocated funds, lagging much further behind the rest of the HUD-funded programs.
Table 2: HUD CDBG-DR Spending by Program (Q2 2022)
| Program Category | Federal Grants Awarded | Spent to Date | Percent Spent |
|---|---|---|---|
| Housing | $3,002,159,533 | $2,980,020,891 | 99.3% |
| Build It Back Single-Family | $2,263,056,000 | $2,314,126,774 | 102.3% |
| Build It Back Multifamily | $411,000,000 | $381,746,666 | 92.9% |
| Build It Back Temporary Disaster Assistance Program | $8,570,290 | $8,570,310 | 100.0% |
| Build It Back Workforce Development | $2,533,243 | $2,533,243 | 100.0% |
| Public Housing – NYCHA | $317,000,000 | $273,043,899 | 86.1% |
| Business | $90,884,968 | $81,171,142 | 89.3% |
| Hurricane Sandy Business Loan and Grant Program | $58,000,000 | $56,992,176 | 98.3% |
| Resiliency Innov. for a Stronger Economy (RISE:NYC) | $30,000,000 | $22,056,621 | 73.5% |
| Business PREP | $2,884,968 | $2,122,346 | 73.6% |
| Infrastructure and Other City Services | $404,043,390 | $402,224,779 | 99.5% |
| Debris Removal/Clearance | $6,654,089 | $5,396,516 | 81.1% |
| Rehabilitation/Reconstruction of Public Facilities | $77,187,274 | $76,857,323 | 99.6% |
| Interim Assistance | $97,129,396 | $97,129,396 | 100.0% |
| Public Services | $223,072,631 | $222,841,545 | 99.9% |
| Coastal Resiliency | $423,516,667 | $153,864,842 | 36.3% |
| Raise Shorelines | $10,750,000 | $4,462,601 | 41.5% |
| Breezy Point Risk Mitigation | $966,667 | $1,311,697 | 135.7% |
| Sheepshead Bay Courts Infrastructure | $20,000,000 | $13,411,675 | 67.1% |
| Resiliency Property Purchase Program | $5,800,000 | $2,185,343 | 37.7% |
| Staten Island University Hospital | $28,000,000 | $21,029,116 | 75.1% |
| Rebuild by Design – East Side Coastal Resiliency | $338,000,000 | $107,761,261 | 31.9% |
| Rebuild by Design – Hunts Point Lifelines | $20,000,000 | $3,867,690 | 19.3% |
| Planning & Admin | $293,271,442 | $275,910,194 | 94.1% |
| Planning | $92,720,000 | $92,486,936 | 99.7% |
| Administration | $200,551,442 | $183,423,258 | 91.5% |
| Total | $4,213,876,000 | $3,893,191,848 | 92.4% |
More Comprehensive Analysis of Projects, Including City Capital Funds, Reveals Slower Progress
However, these figures only tell a partial story of progress. While both FEMA and HUD CDBG-DR funds require the City to contribute a share of project funds as a local match, the City’s Sandy tracker exclusively covers the federal share of funds and does not include the City’s own capital contributions for any of the Sandy recovery and resiliency initiatives. In many cases, the City has prudently moved to spend federal funds first; however, this means that tracking only federal funds gives too rosy a sense of progress.
To determine more accurate information about the City’s progress on its Coastal Resiliency portfolio, the Comptroller’s Office cross-referenced the City’s Sandy Funding Tracker with the City’s Fiscal Year 2023 September Capital Commitment Plan and Financial Management System (FMS), the City’s centralized internal budgeting and accounting system, for a number of high-profile resiliency projects. The Capital Plan provides a breakdown of planned and committed funds by fiscal year and projects for the entire capital budget. FMS provides up-to-date information for actual liquidated expenses by fiscal year and project IDs.
A comparison of spent, committed, and planned future funds from these budget sources sheds a more critical light on the City’s trudging progress to implement these vital projects and its lack of transparency in project tracking. Not only are these projects much further behind in total spending than the Sandy Funding Tracker suggests, but anticipated completion dates are still many years away.
Table 3: Comparison of Budget, Liquidations, and Commitments for Select Coastal Resiliency Projects
| Projects (anticipated completion year for committed funds) | CDBG-DR Grants | Total Project Budget | Commitments from Registered Contracts | Actual Total Spending (Liquidations) to Date | |||
|---|---|---|---|---|---|---|---|
| Total Allocated | Percent Spent | Amount | Percent | Amount Spent | Percent | ||
| East Side Coastal Resiliency (2027) | $338,000,000 | 31.9% | $1,903,291,000 | $788,489,000 | 41.4% | $253,379,000 | 13.3% |
| Hunts Point Resiliency (2030) | $20,000,000 | 19.3% | $57,506,000 | $9,983,000 | 17.4% | $3,631,000 | 6.3% |
| Raise Shorelines (2025) | $10,750,000 | 41.5% | $102,894,000 | $4,339,000 | 4.2% | $289,000 | 0.3% |
- East Side Coastal Resiliency (ESCR): ESCR aims to provide 2.4 miles of coastal protection through a series of berms and walls along the east side of Manhattan from E. 25th to Montgomery Street.[15] The $338 million of federal funds devoted to the ESCR project shown in the Sandy Funding Tracker only makes up about 18% of the $1.9 billion dedicated to all ESCR-related contracts. While the Sandy Funding Tracker shows that the City has spent 31.9% of ESCR’s CDBG-DR funds, the Comptroller’s under-the-hood examination of total project budgets and actual liquidations shows that the City has only spent 13.3% of the total $1.9 billion ESCR budget.
- Raise Shorelines: The Raise Shorelines program encompasses a suite of projects across several neighborhoods to elevate low-lying and frequently flooded roadways.[16] The total project budget of $103 million is ten-fold higher than the amount shown on the City’s Sandy Funding Tracker. While the City has reported spending 41.5% of its federal CDBG-DR funds, FMS liquidation data indicates that only 0.3% of the total program funds have been spent. The FY23 Capital Plan indicates that the current Raise Shoreline commitments will be complete in June 2025, but 95.8% of the project’s total funds have not yet been committed.
- Hunts Point Resiliency: The Hunts Point Resiliency project aims to install solar panels and battery storage that will provide resilient and sustainable backup power to P.S. 48 and M.S. 424. CDBG-DR funds comprise about one-third of the project’s $57.5 million budget. While the Sandy Funding Tracker reports that the City has spent 19.3% of federal funds, FMS shows that only 6.3% of the total project funds have been spent. The FY23 Capital Plan projects that the project’s committed funds will be spent by June 2030, nearly two decades after Superstorm Sandy.
- Breezy Point Risk Mitigation: This project, originally intended to build coastal flood protection in the low-lying Breezy Point neighborhood, was quietly cancelled in the City’s latest HUD Action Plan Amendment after FEMA concluded that there is no “path forward to create public beach access to the project site,” in conflict with the City’s waterfront access requirements.[17] In 2021, the Action Plan Amendment substantially reduces the HUD CDBG-DR grant amount from $14.5 million to under $1 million.[18]
Frontlines of Climate Change
In the decade since Superstorm Sandy made landfall in New York City, the likelihood of future storms that will bring devastating coastal flooding has only grown. The anniversary reminds us of what is at risk, and the stakes of the plodding pace of progress on resiliency.
This section presents an overview of how coastal flooding and sea level rise will affect New York City over time, quantifies the economic impacts of property values and tax base from flood-risk areas, and identifies the land uses and essential infrastructure in the coastal floodplain. Vulnerability to climate risks can be mitigated through a range of strategies to reduce exposure to storm surge or adapt infrastructure to better withstand the impacts of flooding—as many of the federally funded Sandy recovery and resiliency initiatives are designed to improve. This analysis does not account for all the potential ways that flood vulnerability has been mitigated through various property- or neighborhood-scale improvements and therefore does not make determinations about the vulnerability of specific infrastructure. However, it does illustrate the range of critical assets that sit within the floodplain and points to the importance not only of completing the projects commenced after Superstorm Sandy, but of comprehensive approaches to resiliency at small and large scales.
Current and Future Flood Risks
The threats of coastal flooding are anticipated to grow significantly throughout the century as sea levels rise and global temperatures warm. Figures 1-3 below show current and future maps of the 100-year floodplain and high tide zones across New York City.
Figure 1: Current and Future 100-Year Floodplain
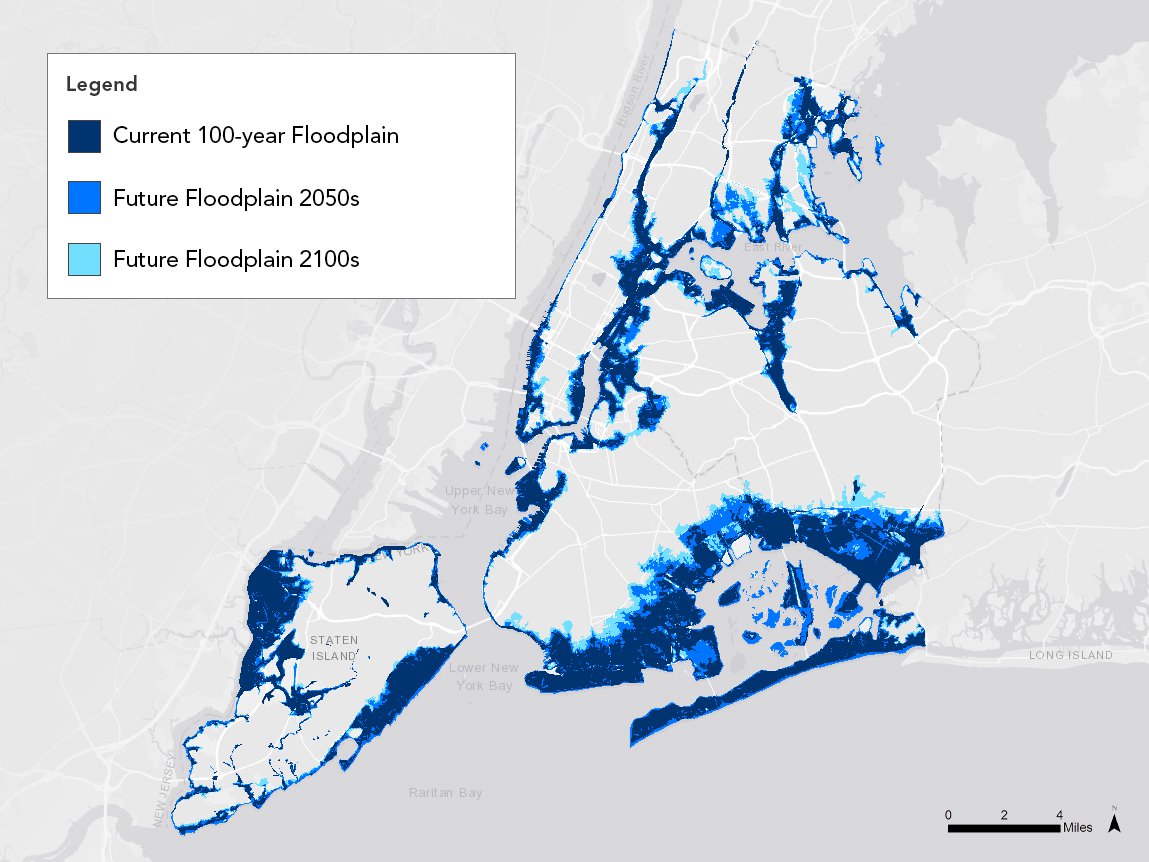
Especially low-lying areas are likely to face regular or permanent flooding from high tides as sea level rise worsens. Neighborhoods particularly around Coney Island, Jamaica Bay, and the West Shore of Staten Island will be most affected by sea level rise.
Figure 2: Current and Future High Tides
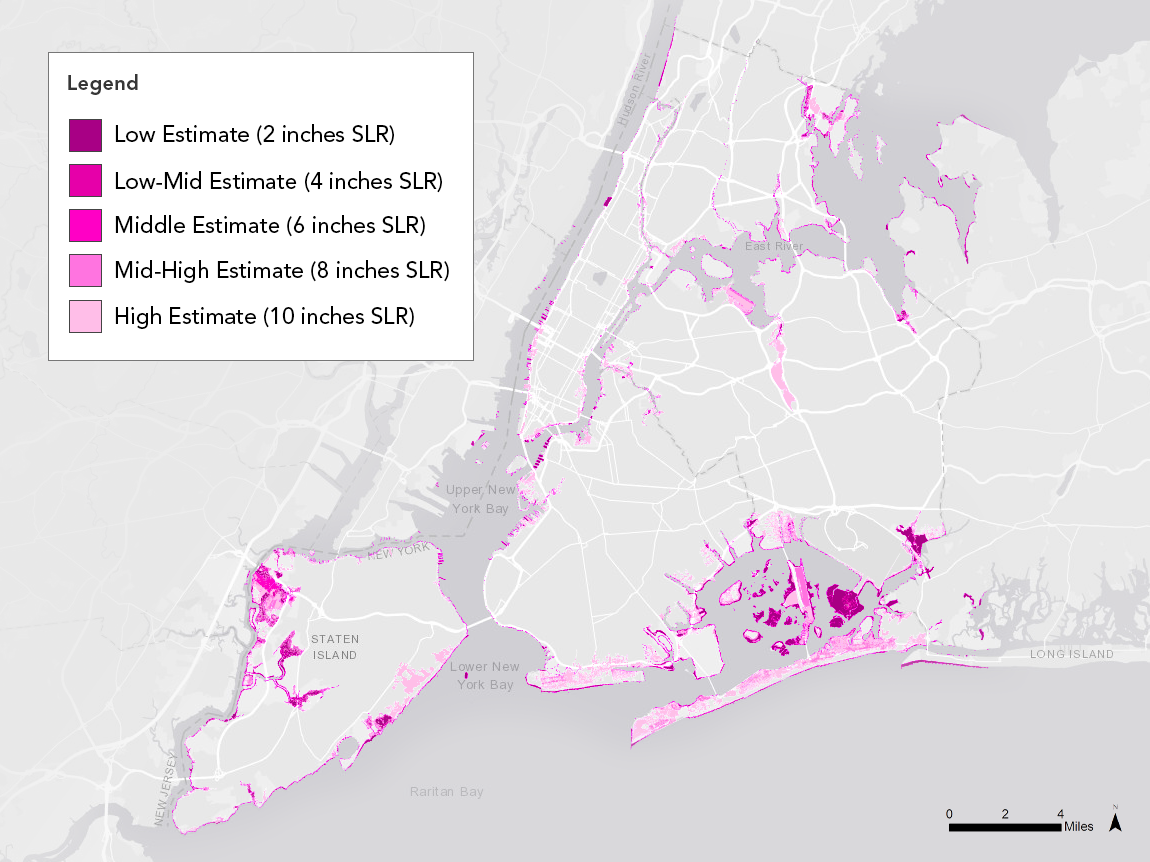
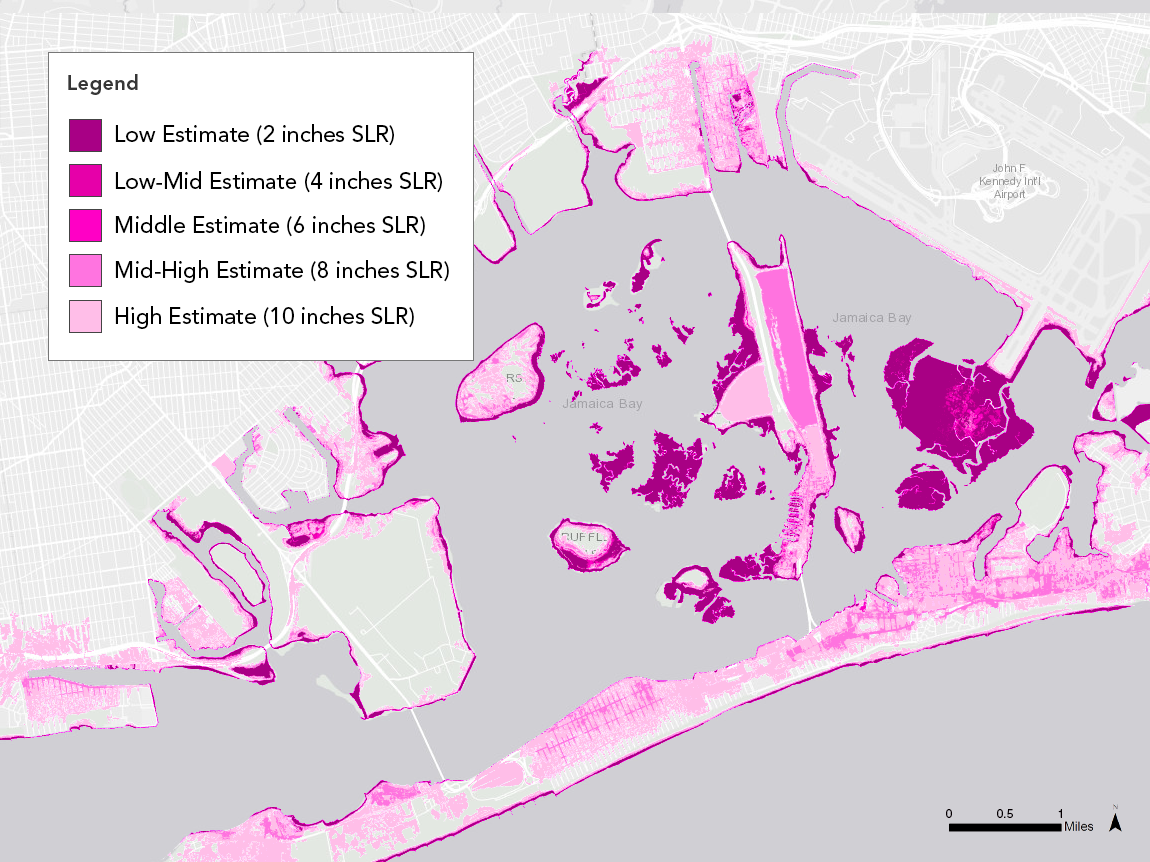
Figure 3: Current and Future High Tides in Jamaica Bay
Property Values and Tax Base
When Superstorm Sandy hit New York City on October 29, 2012, the value of property in the 100-year floodplain was $122 billion (in current market value). In the past decade as new waterfront developments have steadily increased, market rate values of real estate in the 100-year floodplain have increased to over $176 billion – a 44% increase since Superstorm Sandy, with Manhattan and Queens seeing the highest growth in values and Bronx seeing the highest rate of growth. With rising tides and more frequent storms, flood maps will continue to stretch further inland, putting upwards of $242 billion (in current market value) at risk by the 2050s – a 38% increase in value from today with Brooklyn experiencing the most dramatic increases in property values at risk in coming decades.
Table 1: Property Value in the Floodplain by Borough
| Borough | 2012 Market Value in Floodplain | 2022 Market Value in Floodplain | Percent Increase, 2012-2022* | Current Market Value in Future 2050s Floodplain | Percent Increase, 2022-2050** |
|---|---|---|---|---|---|
| Manhattan | $32,330,919,044 | $49,697,213,793 | 54% | $71,257,105,734 | 43% |
| Bronx | $6,507,959,001 | $9,950,838,410 | 53% | $14,725,866,686 | 48% |
| Brooklyn | $30,734,983,910 | $42,482,219,828 | 38% | $69,441,448,759 | 63% |
| Queens | $42,143,648,068 | $60,065,606,447 | 43% | $72,030,324,788 | 20% |
| Staten Island | $10,309,206,687 | $13,884,484,170 | 35% | $15,433,712,672 | 11% |
| Citywide | $122,025,716,710 | $176,080,362,648 | 44% | $242,888,458,639 | 38% |
* Accounts for changes in floodplain as well as appreciation in property values
** Accounts for changes in floodplain, but does not project increased values in property
While the true worth of these properties to New Yorkers and our City’s neighborhoods can never be quantified, their cumulative economic value makes a clear case for public and private investments in resilience infrastructure.
After Sandy, the City codified new, significantly higher standards for flood-resilient construction for buildings in the current 100-year floodplain, outlined in Appendix G of the building code, adopted in 2014. Roughly 3.5% of structures in the current 100-year floodplain were built or last altered after the new standards were adopted.[19] The remaining 96.5% of buildings have no obligation to institute resilient measures. Manhattan has the highest percentage of structures built to resilient standards, with 7.8% of its building stock in the 100-year floodplain constructed or altered after 2014. Buildings in Brooklyn are particularly at risk, with only 2.8% of structures in the 100-year floodplain built or altered prior to 2014 respectively.
Table 2: Buildings Constructed or Altered After 2014 in the Current Floodplain by Borough
| Borough | Buildings Constructed or Altered Post-2014 in 100-year Floodplain | Total Buildings in 100-Year Floodplain | Percent Constructed or Altered After 2014 |
|---|---|---|---|
| Manhattan | 211 | 2,722 | 7.8% |
| Bronx | 131 | 3,277 | 4.0% |
| Brooklyn | 715 | 25,120 | 2.8% |
| Queens | 672 | 20,841 | 3.2% |
| Staten Island | 669 | 13,531 | 4.9% |
| Citywide | 2,398 | 65,491 | 3.7% |
Current and future flood risks also threaten the City’s tax base and fiscal health. This report estimates the potential for lost property tax revenue in the face of rising tides and destructive storms. The tax lots in the current 100-year floodplain are estimated to generate $2.0 billion in property taxes, annually. As the floodplain grows, more tax lots will be put at risk, threatening $3.1 billion in annual projected property tax revenues by the 2050s (using current property values). Without sufficient protective infrastructure, the assessed values of these revenue-generating properties will likely decline significantly or be removed from the tax base altogether either via abandonment or the implementation of managed retreat programs such as New York State’s NY Rising Enhanced Buyout Program, which resulted in the demolition of 473 homes in Staten Island directly following Superstorm Sandy.[20], [21] All told, Sandy cost the City an estimated $5.7 billion in lost gross city product and a further $14 billion in private and public damages.[22] The economic damages of future storms may be compounded by this additional $3.1 billion in potential lost annual tax revenues as properties in the floodplain sustain additional damage and increasingly frequent storms over the next several decades.
Table 3: Tax Revenue Generated by Properties in Current and Future Floodplain
| Borough | Current 100-Year Floodplain | Future 2050s Floodplain |
|---|---|---|
| Manhattan | $958,732,655 | $1,468,155,706 |
| Bronx | $101,078,276 | $168,994,299 |
| Brooklyn | $506,447,946 | $833,730,703 |
| Queens | $303,658,050 | $503,049,566 |
| Staten Island | $118,449,334 | $152,611,621 |
| Citywide | $1,988,366,261 | $3,126,541,894 |
Essential Infrastructure
Most New Yorkers were impacted by Superstorm Sandy, regardless of where they lived or worked. From the days-long blackout of Lower Manhattan caused by the explosion of a ConEd substation[23] to the full shut-down of the subway system with certain tunnels flooded from “track to ceiling,”[24] Superstorm Sandy brought the entire city to a halt.
Much of our essential infrastructure—infrastructure that serves a public and citywide purpose—is in the floodplain:
- 79% of citywide land designated for transportation and utility infrastructure sits in the current 100-year floodplain. These areas of the City house our electric and gas utilities, rail yards, airports, docks and piers, bridges, tunnels, and highways.[25]
- 67% of open space and outdoor recreation areas lay in the current 100-year floodplain. From Battery Park to the Rockaways, the City’s iconic waterfront parks serve a local and citywide purpose – drawing tourists and visitors from across the city.
- 46% of the city’s industrial and manufacturing uses also sit in the current 100-year floodplain. Flooding in these industrial districts threaten our city’s waste transfer stations, construction businesses, warehouses and distribution centers – industries on which our local economy and supply chain rely.
Table 4: Land Use in the Current and Future Floodplains
| Land Use Type | Land Use Type, Citywide (Sq Ft) |
Land Use Type in 100-Yr Floodplain (Sq Ft) |
Percent of Land Use Type in Current 100-Year Floodplain | Land Use Type in 2050s Floodplain (Sq Ft) |
Percent of Land Use Type in 2050s Floodplain |
|---|---|---|---|---|---|
| One and Two Family | 1,826,875,441 | 171,017,164 | 9% | 247,582,169 | 14% |
| Multi Family Walkup Building | 481,492,604 | 28,072,590 | 6% | 49,596,231 | 10% |
| Multi Family Elevator Building | 351,744,599 | 56,686,351 | 16% | 95,346,298 | 27% |
| Mixed Residential and Commercial | 256,422,436 | 28,010,352 | 11% | 40,306,038 | 16% |
| Commercial Office Buildings | 274,008,810 | 55,395,362 | 20% | 80,130,338 | 29% |
| Industrial and Manufacturing | 228,232,258 | 105,751,556 | 46% | 135,617,855 | 59% |
| Transportation and Utility | 641,259,077 | 505,437,205 | 79% | 521,484,557 | 81% |
| Public Facilities and Institutions | 532,358,603 | 205,661,947 | 39% | 199,708,787 | 38% |
| Open Space and Outdoor Recreation | 1,612,222,845 | 1,075,178,362 | 67% | 1,099,775,277 | 68% |
| Parking Facilities | 85,631,966 | 21,848,310 | 26% | 34,556,893 | 40% |
| Vacant Land | 551,419,280 | 419,756,797 | 76% | 425,628,500 | 77% |
| No Land Use Described for Tax Lot | 79,098,565 | 58,795,348 | 74% | 60,892,310 | 77% |
| All Land Use Types (Total) | 6,920,766,484 | 2,731,611,344 | 39% | 2,990,625,253 | 43% |
As illustrated in Table 4, the City’s overall housing stock will become increasingly at risk over the next several decades – but public housing, in particular, will face a significant challenge, with 30% of the New York City Housing Authority’s (NYCHA) overall developments in the floodplain by the 2050s. Queens and Manhattan face the greatest risks, with a projected 52% and 48% of each borough’s respective NYCHA developments in the 2050s floodplain.
As shown in Table 4 above, NYCHA has already spent 83.5% of its $3.2 billion FEMA funds, which is notable considering the agency received the largest allocation of federal funds.[26] However, it is worth noting the variation in the urgency of repairs needed. The lack of rehabilitation progress acutely affects NYCHA residents, as the delays affect the safety and comfort of their homes. For example, residents at Red Hook Houses waited nearly 5 years for NYCHA to begin groundbreaking on essential repairs to their buildings’ boilers and roofs.[27] Decades of disinvestment in the public housing stock have resulted in a severe capital backlog.[28] NYCHA estimates that approximately $40 billion is currently needed to bring the housing stock into a state of good repair. The crisis facing public housing also creates an opportunity for the public sector to create the model for retrofitting multifamily housing for climate resiliency.
Table 5: NYCHA Developments in the Current and Future Floodplain by Borough
| Borough | Total NYCHA Developments | NYCHA Developments in Current 100-Yr Floodplain | Percent of NYCHA Developments in Current Floodplain | NYCHA Developments in 2050s Floodplain | Percent of NYCHA Developments in 2050s Floodplain |
|---|---|---|---|---|---|
| Manhattan | 101 | 29 | 29% | 41 | 41% |
| Bronx | 93 | 0 | 0% | 6 | 6% |
| Brooklyn | 99 | 15 | 15% | 24 | 24% |
| Queens | 22 | 9 | 41% | 13 | 59% |
| Staten Island | 10 | 1 | 10% | 1 | 10% |
| Citywide | 325 | 54 | 17% | 85 | 26% |
It is important to recognize that physical exposure of essential infrastructure to flooding can be mitigated with thoughtful resilient design. For instance, NYC Parks created Guidelines for Design and Planning for Flood Resiliency that offers resilient standards for plantings, materials, coastal edge designs, and other electrical, mechanical, and drainage systems for waterfront esplanades and greenways, beaches, playgrounds, recreation centers, and athletic fields. The Department of City Planning issued a Resilient Industry study that provides strategies that industrial sites can take to reduce risks of future flooding and minimize impacts to their facilities and operations.[29] While NYCHA does not have a standalone resilient design standard, it has incorporated guidance for resilient energy systems, floodproofing, and designs for entrances and lobbies in its general Design Guidelines for the Rehabilitation of NYCHA Residential Buildings.
Recommendations
The City’s efforts to strengthen resiliency after Superstorm Sandy are undoubtedly transforming the relationships between communities and their waterfronts. Many of these efforts are first-of-their kind projects that required navigating complex technical feasibility issues and thoughtful community engagement processes. Yet, at the ten-year anniversary of Sandy, many important resiliency projects remain far from completion.
The lessons learned from these Sandy recovery and resiliency projects can inform improvements to capital planning, design, and construction for future resiliency projects. Given that climate change is expected to bring even more frequent and severe storms to our shores, the City of New York is likely to receive more federal disaster recovery and resiliency funding in the future. In fact, the City recently issued a Draft Action Plan for $188 million of new HUD CDBG-DR funding to address the devastating impacts brought on by Hurricane Ida in September 2021.[30] With the historic passage of the Infrastructure Investment and Jobs Act, the City is also poised to receive over $1 billion of federal funding for infrastructure improvements.[31] Without significant improvements to infrastructure design and delivery, the City will not be poised to effectively or efficiently administer federal funds that are essential for ensuring the resiliency and structural integrity of our infrastructure.
Several agencies identified common challenges in spending federal Sandy grants. In the immediate aftermath of Sandy, many agencies did not have sufficient before-and-after documentation to prove that damages were incurred due to the storm. Initial efforts began to evaluate existing and model future vulnerabilities to climate hazards, as the City built capacity to develop advanced coastal modeling and undertake multi-hazard resiliency planning. As feasibility assessments advanced, several agencies also discovered unanticipated technical challenges, ranging from utility conflicts to hazardous materials. Project scope amendments to address such issues required several rounds of administrative reviews at the city, state, and federal levels to approve changes to project scopes and budgets. At onset of the pandemic in 2020, the City paused work and spending on many public works projects to focus on emergency COVID-19 response. As resiliency and recovery projects resumed, supply chain issues have caused significant backlogs and price escalations for essential construction materials, causing further delays. These implementation challenges are exacerbated by current staffing shortages across city agencies. Some of these factors are understandable. That said, the City has a long way to go to complete the efforts that it started after Sandy ten years ago.
The City can take several concrete measures to ensure more efficient capital project delivery and better prepare for long-term resiliency planning moving forward.
Strengthen the City’s capacity to deliver capital projects on time and on budget.
- Accelerate the pace of incomplete resiliency projects and future capital projects by rapidly implementing the initial recommendations of First Deputy Mayor Grillo’s Capital Process Reform Task Force and pushing aggressively forward on longer-term action.
New resilient infrastructure is essential to safeguarding the future of our most vulnerable communities, infrastructure, and assets. The City must prioritize the swift completion of its ongoing resiliency projects by providing support and resources to those efforts that are furthest behind. If agencies have unspent funds that are no longer needed, those dollars should be reallocated to other resiliency needs. Effectively deploying these federal dollars would build our City’s climate – and economic – resilience, creating good jobs and economic opportunity for New Yorkers.
The City must also hasten the speed of infrastructure delivery for future capital projects. Shorter project timelines lead to cost savings for project budgets. A more efficient capital process will allow the City to more nimbly and efficiently utilize current and future funds—whether from the City’s own capital budget or from federal infrastructure grants. As we stand at the cusp of an economic recession, it is both critical and fiscally prudent for the City to implement these improvements to make the most of taxpayer dollars.
There is no magic wand to speeding up capital project schedules; capital project delivery entails many internal city processes that are not always visible to the public. The City’s Capital Process Reform Task Force has provided a slate of immediate recommendations[32] that will improve project efficiencies. For instance, the City is working to streamline various approvals needed to unlock capital funding, expand the use of early completion incentives, increase utilization of time-efficient procurement methods to encourage partnering with minority- and women-owned business enterprises (M/WBEs), and institute cost effectiveness reviews at key design milestones. DDC’s 2019 Blueprint for Construction Excellence and Blueprint 2022 Update also provide tangible steps for expanding front-end planning, scaling alternative project delivery methods, and incorporating robust project controls to monitor and improve project cost assessments.[33] However, even these proposals are on the beginning. The Capital Process Reform Task Force must continue its work to identify further reforms that can add up to significant time and cost savings for these resiliency projects, as well as the city’s larger capital portfolio, along with centering equity and the promotion of M/WBEs to ensure that all savings and improvements are made towards an equitable recovery.
- Improve public transparency of capital project tracking.
The City’s Sandy Funding Tracker offers limited information to determine how much Sandy federal grants have been spent. The Tracker does not convey the status or anticipated completion dates of the actual efforts initiated with those federal funds, nor total project budgets (inclusive of City capital) for these projects. Following legislation passed in 2020, the City must create a comprehensive, citywide Capital Projects Tracker to increase accountability and efficiency in City capital spending. Such a tracker should provide easy-to-understand information about total budgets, timelines, and managing entities of all the projects in the City’s Capital Commitment Plan so that New Yorkers can easily access information on important resiliency and capital investments in their neighborhoods. To ensure active progress on this initiative, the City should put forward a timeline for implementing the Capital Projects Tracker.
- Implement grant cost accounting procedures for federal funds to improve the City’s ability to track and maximize federal reimbursement.
Currently, the City cannot monitor and manage grant spending and billing because costs incurred are not tied to the source of aid in the Financial Management System (FMS). A feasibility assessment for the enhancement of FMS was completed, remains to be implemented. The City should fully fund and prioritize these improvements, which will allow the data accessible to the public on various reporting platforms, such as Checkbook and OpenData, that provide important information on city contracting and spending.
- Fully fund operations and maintenance activities associated with emergency activation and long-term maintenance of new resilient infrastructure.
Federal and local capital investments are necessary to build new resilient projects. But as with all infrastructure, assets will only last as well as they are maintained. As the City accelerates completion of its resiliency projects, it must devote attention and funding to agencies tasked with operating the new resilient flood gates and panels in advance of a storm, as well as the routine testing, engineering inspections, and long-term maintenance of these systems for their entire useful lives. In the last decade, the City has defined clearer roles and responsibilities for agencies to operate and maintain new types of infrastructure like floodwalls and flood gates. It is now imperative to ensure that these operations and maintenance mandates are properly resourced.
Revisit and update the City’s long-term resiliency plans to address our current understanding of climate risks and maximize use of forthcoming federal funds.
- Develop a risk-based framework to guide citywide long-term resiliency
While new resilient infrastructure projects are certainly critical, the City’s future determinations about where and how to make resilience investments must be guided by a risk-based decision-making framework. In 2021, the New York City Council passed legislation to require the development of a citywide climate adaptation plan. The legislation specifies that the plan should address multiple climate hazards and to be updated once every ten years. To be most effective, the planning process must take a citywide approach that is underpinned by a clear framework by which the City and communities can make important decisions about the future resiliency of neighborhoods.
To date, resiliency projects have had to meet benefit-cost criteria to be eligible for federal funds. However, benefit-cost analyses only help decision-makers assess whether to proceed with a given project, not to determine what kind of resiliency interventions should be made in the first place. A comprehensive assessment of climate risks and vulnerabilities across them will equip decision-makers to take a holistic approach to resiliency strategies, ranging from infrastructure investments to zoning updates to new programs that equip communities to adapt to climate change. Although each waterfront community faces unique climate risks and may require different approaches to be resilient to climate change, a holistic vulnerability climate risk assessment will illuminate shared needs, identify opportunities for regional interventions or citywide programs for many communities, and support people who wish to relocate from flood-prone areas to do so safely and to thrive after they have moved. The upfront planning and identification of specific interventions through a comprehensive resiliency planning process will set the City up well for competitive federal grant funding, such as FEMA’s Build Resilient Infrastructure and Communities program.
A risk-based framework will also provide a foundation to hold community discussions that confront difficult questions about long-term land uses as sea levels rise in low-lying areas, threatening homes and livelihoods for vulnerable New Yorkers. Conversations about neighborhood change are hard. Tackling decisions about new waterfront infrastructure or climate migration are sensitive and must be grounded in a commitment to community self-determination and safety. Yet, avoiding the tough questions of whether or how to fortify or relocate from a neighborhood is not a solution. The complex community dynamics surrounding ESCR have been well[34] documented,[35] and illustrate how challenging it can be to find consensus in practice.
If the City’s decisions about how or where to invest in resiliency remain untethered from a comprehensive framework to assess future climate risks, it will lead to inconsistent and potentially conflicting signals as one arm of government invests in floodproofing while another decides that the area is unviable. For instance, the Resiliency Property Purpose Program, funded with $5.8 million of CDBG-DR grants, is currently facilitating the buyout of residential and vacant lands in Staten Island so that those properties can be incorporated into a new coastal levee that the US Army Corps of Engineers is implementing.[36] The concurrent support by different levels of government for buyouts and coastal defense in the same area presents mixed messages about the long-term future of the community.
The current fractured and ad hoc nature of resiliency planning has resulted in real resource disparities for New Yorkers. Lower Manhattan has seen roughly $3 billion of committed capital funds for coastal protection [37] (not to mention a master plan that calls for another $5-7 billion to build a new shoreline in the Financial District[38]) while some neighborhoods have no defined resiliency capital commitments or plans at all. A long-term land use planning process will require thoughtful engagement, with an eye toward equity, a deep reflection of the City’s historical injustices have shaped climate-vulnerable communities today, and a focus on proactive support for affordable and safe housing that prioritizes frontline New Yorkers.
- Codify design guidelines for resiliency infrastructure.
The climate crisis requires new approaches to adapt to change and uncertainty. Indeed, many post-Sandy resiliency projects are first-of-their-kind projects in New York City. These projects require specialized technical expertise like hydrodynamic coastal modeling, complex coordination with existing utility lines, revisiting historic engineering and design specifications that were no longer sufficient for future threats, and negotiating complicated legal agreements with impacted private property owners. Addressing these complex dynamics cost both time and money.
Fortunately, new resiliency infrastructure projects do not need to start from square one. The post-Sandy projects set important precedents, built internal City capacity for resiliency, and informed lessons learned that should be carried forward to make future resiliency capital processes more efficient. At the ten-year anniversary of Sandy, City should take stock of best practices for designing and delivering resilient infrastructure and codify these practices into clear Coastal Flood Protection Design Guidelines. These guidelines could establish standards for how to appropriately scope and design levees, floodwalls, and floodgates, with typologized recommendations for different coastal risk profiles and neighborhood characteristics. This effort would build upon MOCEJ’s Neighborhood Coastal Flood Protection Project Planning Guidance, which compiles best practices for the planning stage of large neighborhood coastal protection efforts.
Each capital agency should also establish specific resilient design standards for the infrastructure under its purview so that all future streets, sewers, bridges, and other critical assets have vetted design requirements to withstand future climate conditions. Parks resilient design guidelines is an example of a comprehensive approach to codifying post-Sandy best practices for other agencies to follow.
The codification of resilient design guidelines will make the overall design process smoother and more cost-efficient by clarifying design expectations from the outset, decreasing the potential for change orders, and reducing project design and delivery timelines.
- Establish diverse and sustained funding sources for future resiliency investments.
The $15 billion that New York City received as a result of Superstorm Sandy was no doubt instrumental in spurring meaningful resiliency improvements in the last decade. However, the City cannot and should not wait until after a disaster strikes for an influx of federal investments. The City needs a sustainable funding source to proactively make the resiliency investments that will be needed to weather future storms that are only going to become more frequent and severe with climate change. The Clean Air, Clean Water, and Green Jobs Bond Act, which would authorize $4.2 billion for environmental and resiliency efforts if passed in the November 2022 New York general election, is a helpful start. If the City of New York is committed to the long-term resilience of the five boroughs, the City must also be committed to identifying a dedicated way to fund those investments in the long run.
Conclusion
New York City is already facing the impacts of climate change today. We must efficiently complete the resiliency projects that we started as the risks of climate change intensify. This report provides a reflection on progress to-date to implement crucial resiliency improvements to protect our shorelines, and takes stock of the economic contributions and infrastructure services in our flood-prone communities.
Further research on specific resiliency projects or initiatives will help us assess of how effective these efforts have been to make our city more resilient to future climate threats. As we prepare for bigger and more frequent storms to come, we must create thoughtful and inclusive processes to engage New Yorkers to shape the futures of our neighborhoods. Public engagement will be ever-more critical to inform the types of resiliency improvements that will fundamentally change the character of our waterfront communities. The many resilience initiatives initiated after Superstorm Sandy reveal the many diverse opinions, strategies, and visions that New Yorkers hold for the waterfront. These projects have required waterfront residents and the City to tackle difficult questions about the how to integrate new large-scale flood protection systems into the existing urban fabric: What level of flood protection should a project provide? What designs are financially and technically feasible? How should divergent community preferences be reconciled? What community amenities should be upgraded or preserved? How to mitigate impacts of construction? The City must learn from its past processes to ensure thoughtful and inclusive engagement with real community leadership and buy-in for future resiliency projects to come.
Methodology
Budget Analysis
The report analyzed progress on spending federal grants allocated to the City of New York following Superstorm Sandy. These grants primarily came from the FEMA Public Assistance and HUD Community Development Block Grant – Disaster Recovery programs, but also included other grants from the Federal Highway Administration, Federal Transportation Administration, and the National Emergency Grant. These programs provided the City with funding to restore and repair critical infrastructure damaged during Sandy.
The Comptroller’s Office used several sources of budget and accounting data to conduct the budget analysis in this report. The federal grant allocations and adjusted city spending amounts shown in Tables 1 and 2 were provided by the City’s Office of Management and Budget (OMB) and reflect information displayed on the City’s Sandy Funding Tracker. Some agencies identified discrepancies between their grant spending and OMB’s tracker. OMB acknowledges that there may be a lag in reporting. The FEMA spending in Table 1 incorporates more up-to-date spending data from those agencies who provided the Comptroller’s Office with updated documentation.
The total budget, liquidation, and commitment data in Table 3 drew upon information from the Sandy Funding Tracker, Fiscal Year 2023 September Capital Commitment Plan, and Financial Management System (FMS), which is the City’s centralized internal budgeting and accounting system. FMS provides up-to-date information for actual liquidated expenses, broken out by project ID and fiscal year. The Comptroller’s Office accessed the FMS data between September 19-21, 2022.
First, the Comptroller’s Office identified all budget lines associated with each of the three projects—ESCR, Raise Shorelines, and Hunts Point Resiliency—in the FY 2023 September Capital Commitment Plan. These three projects were selected from the CDBG-DR Resiliency portfolio to provide a more detailed comparison between different City-reported budget tracking sources. The project identification numbers used to calculate each project’s budget of the projects were as follows:
| Project IDs | Description |
| East Side Coastal Resiliency (ESCR)* | |
| SANDRESPC | Citywide Resiliency Measures, ESCR, Parallel Conveyance |
| SANDRESM1 | Citywide Resiliency Measures, ESCR, Project Area 1 |
| SANDRESM2 | Citywide Resiliency Measures, ESCR, Project Area 2 |
| SANDRESEP | ESCR Early Package – Reconstruction of Lesec Composting Area |
| SAND3TREE | ESCR -Stormwater Greenstreets Construction- MG-421M |
| SAND4TREE | FY21- ESCR Tree Planting, Manhattan MG-1219M |
| EASTSIDRS | EAST SIDE COASTAL RESILIENCY PROJECT AT EAST RIVER PARK |
| Hunts Point Resiliency | |
| SANDHPRX2 | Hunts Point Resiliency Mob-Gen/SP |
| SANDHPRXD | Hunts Point Energy Resiliency Pilot – DR |
| Raise Shorelines | |
| RS-CIC | Raise Shoreline – Coney Island Creek |
| RS-PH1 | Raise Shoreline – Phase 1 |
| RS-PH2 | Raise Shoreline – Phase 2 |
| RAISESHOR | Raise Shorelines |
* The City has cited a total ESCR project budget of $1.4 billion, which only includes the project IDs that pertain to the flood protection system itself, while the Comptroller’s analysis includes all projects in the FY23 Capital Plan that are identified as associated ESCR, including tree plantings and Greenstreets construction.
The FY23 Capital Plan provided planned commitments, or the amounts estimated to be spent in future fiscal years, for all associated Project IDs that make up each of the three projects. The Comptroller’s Office then used FMS to obtain more granular detail, including actual commitments from registered contracts from both City and non-City sources and actual liquidations. Total project budgets were calculated by summing actual commitments and future planned commitments. Actual commitments and liquidations exclude Interfund Agreement (IFA) funds.
Spatial Analysis
To identify and assess the value for current tax lots in the floodplains and conduct an analysis of land uses, the Comptroller’s Office analyzed MapPluto (22v2) data under four different flood boundaries: the current 2015 Preliminary Flood Insurance Rate Maps (PFIRM) 100-year floodplains, the future 2050s 100-year floodplain, and the Projected Sea Level Rise in the 2020s, 2050s, 2080s, and 2100s. All floodplain and sea level rise shapefiles are based on models from the New York City Panel on Climate Change and retrieved from the NYC Open Data website. A “Select by Location” query was performed to identify tax lots falling fully or partially within each floodplain geography. City-wide, boroughwide, and land use category results were tallied using the total assessed value (“AssessTOT” field) of each tax lot. Total tax lot square footage was also calculated using the “LotArea” field and categorized by land use. To identify the assessed value of property, the Comptroller’s Office applied the above methodology to MapPluto data (version 12v2). The Comptroller’s office retrieved market value and property tax values for the tax lots at risk for flooding from DOF’s Property Valuation and Assessment Dataset, available on the NYC Open Data website.
New York City Housing Authority developments were downloaded from the NYC Open Data website and joined with a list of BBLS for RAD/PACT developments to create the total number of NYCHA developments. Those that fell within each of the floodplains using the same “Select by location” query were identified and categorized by borough and then compared to the total stock of NYCHA developments. Due to missing geographic data, ten NYCHA developments listed as FHA repossessed houses (Group I-X) among the 335 NYCHA developments were omitted.
Acknowledgements
This report was authored by Louise Yeung, Chief Climate Officer, and Annie Levers, Assistant Comptroller for Policy. The data analysis was conducted by Robert Callahan, Director of Policy Analytics, Jacob Bogitsh, Senior Policy Analyst, Steven Giachetti, Chief Economist, Krzysztof Haranczyk, Director of Budget Analysis and Research, Peter Flynn, Assistant Budget Chief, Krista Olson, Deputy Comptroller for Budget, and Francesco Brindisi, Executive Deputy Comptroller. Archer Hutchinson, Graphic Designer, led the graphic design and report layout.
Endnotes
[1] New York City. (2013). PlaNYC: A Stronger, More Resilient New York.
http://s-media.nyc.gov/agencies/sirr/SIRR_singles_Lo_res.pdf
[2] ibid
[3] ibid
[4] ibid
[5] ibid
[6] ibid
[7] NYC Office of Management and Budget (2022). CDBG-DR Draft Action Plan for the Remnants of Hurricane Ida. https://www1.nyc.gov/assets/cdbgdr/documents/nyc-hurricane-ida-action-plan-08-26-22.pdf
[8]Office of the New York City Comptroller (2019). Safeguarding Our Shores: Protecting New York City’s Coastal Communities from Climate Change. https://comptroller.nyc.gov/wp-content/uploads/documents/Safeguarding-Our-Shores-Report.pdf
[9] NYC Recovery. Sandy Funding Tracker, FEMA-PA and Other Grants. https://www1.nyc.gov/content/sandytracker/pages/fema-pa-and-other-grants
[10] NYC Office of the Comptroller (2019). Safeguarding Our Shores: Protecting New York City’s Coastal Communities from Climate Change. https://comptroller.nyc.gov/reports/safeguarding-our-shores-protecting-new-york-citys-coastal-communities-from-climate-change/
[11] In addition to the $169 million that EDC itself was allocated, EDC has spent 74% of around $1 billion of funding to implement Sandy recovery projects on behalf of other agencies.
[12] NYC’s Mayor’s Office of Housing Recovery Operations. Welcome to NYC Housing Recovery. https://www1.nyc.gov/site/housingrecovery/index.page
[13] Rebuild By Design. The Big U. https://rebuildbydesign.org/work/funded-projects/the-big-u/
[14] Consolidated Appropriations Act of 2022, H.R.2471, 117th Congress (2022). https://www.congress.gov/bill/117th-congress/house-bill/2471/text
[15] City of New York. East Side Coastal Resiliency. https://www1.nyc.gov/site/escr/index.page
[16] Office of the Mayor of New York City (2016). OneNYC: Mayor de Blasio Announces Progress on New Coastal Resiliency Efforts in Most Vulnerable Communities. https://www1.nyc.gov/office-of-the-mayor/news/370-16/onenyc-mayor-de-blasio-progress-new-coastal-resiliency-efforts-most-vulnerable
[17] NYC Recovery (2021). Action Plan Amendment 23. https://www1.nyc.gov/assets/cdbgdr/documents/amendments/CDBG-DR_Action_Plan_Amendment_23.pdf
[18] ibid
[19] NYC Building Code (2014) Appendix G Flood-Resistant Construction. https://up.codes/viewer/new_york_city/nyc-building-code-2014/chapter/G/flood-resistant-construction#G
[20] Aishwarya Bharat Borate (2018). Analysis of Post-Sandy Single-Family Housing Market in Staten Island, New York. https://vtechworks.lib.vt.edu/bitstream/handle/10919/85836/Borate_AB_T_2018.pdf?sequence=1&isAllowed=y
[21] U.S. Department of Housing and Urban Development (HUD), Office of Inspector General (2019). The State of New York Did Not Ensure That Properties Purchased Under the Acquisition Component of Its Program Were Eligible. https://www.hudoig.gov/sites/default/files/2019-04/2019-NY-1001.pdf
[22] Office of the New York City Comptroller (2014). On the Frontlines: $129 Billion in Property at Risk from Flood Waters. https://comptroller.nyc.gov/wp-content/uploads/documents/Policy_Brief_1014.pdf
[23] Amy Plitt (2017). The night the lights went out in Manhattan. Curbed, New York. https://ny.curbed.com/2017/10/29/16560706/hurricane-sandy-anniversary-manhattan-power-outage-photos
[24] Matt Flegenheimer (2012). Flooded Tunnels May Keep City’s Subway Network Closed for Several Days. The New York Times. https://www.nytimes.com/2012/10/31/nyregion/subways-may-be-shut-for-several-days-after-hurricane-sandy.html
[25] Department of City Planning (2022). PLUTO Data Dictionary. https://www1.nyc.gov/assets/planning/download/pdf/data-maps/open-data/PLUTODD.pdf?r=22v2
[26] New York City Housing Authority (2017). Design Guidelines Rehabilitation of NYCHA Residential Buildings. https://www1.nyc.gov/assets/nycha/downloads/pdf/nycha-design-guidelines.pdf
[27] NYC Housing Authority (2017). NYCHA Breaks Ground on Landmark $550 Million Sandy Recovery Project at Red Hook Houses. https://www1.nyc.gov/site/nycha/about/press/pr-2017/red-hook-sandy-groundbreaking-20170906.page
[28] NYC Office of the Mayor (2022). Mayor’s Management Report: New York City Housing Authority. https://www1.nyc.gov/assets/operations/downloads/pdf/mmr2022/nycha.pdf
[29] NYC Department of City Planning. Resilient Industry. https://www1.nyc.gov/site/planning/plans/resilient-industry/resilient-industry.page
[30] NYC Mayor’s Office of Management and Budget (2022). CDBG-DR Draft Action Plan for the Remnants of Hurricane Ida. https://www1.nyc.gov/assets/cdbgdr/documents/nyc-hurricane-ida-action-plan-08-26-22.pdf
[31] City of New York. The Infrastructure Investment & Jobs Act and How New Yorkers and the City’s Transportation Network Will Benefit. https://www1.nyc.gov/html/dot/downloads/pdf/infrastructure-investment-jobs-act.pdf
[32] City of new York (2022). New York City Capital Process Reform Task Force Initial Recommendations. https://www1.nyc.gov/assets/home/downloads/pdf/press-releases/2022/CP-Reform-Task-Force.pdf
[33] NYC Department of Design and Construction (2020). Strategic Plan. https://www1.nyc.gov/site/ddc/about/ddc-strategic-plan.page
[34] Michael Kimmelman (2022). What Does It Mean to Save a Neighborhood? https://www.nytimes.com/2021/12/02/us/hurricane-sandy-lower-manhattan-nyc.html
[35] Keith Gessen (2021). The Destroy-It-to-Save-It Plan for East River Park New York’s first climate adaptation battle is here. https://www.curbed.com/2021/05/east-river-park-nyc.html
[36] City of New York (2018). Resiliency Property Purchase Program 71 Fox Beach Avenue Environmental Review Record. https://www1.nyc.gov/assets/cdbgdr/documents/public-notices/71FoxBeach-ERR.pdf
[37] Lower Manhattan resiliency projects include the East Side Coastal Resiliency Project, Brooklyn Bridge-Montgomery Coastal Resiliency Project, Battery Wharf Resiliency Project, and the Battery Park City Authority’s South and North/West Resiliency Projects.
[38] NYC Economic Development & NYC Mayor’s Office of Coastal Resiliency (2021). The Financial District and Seaport Climate Resilience Master Plan. https://fidiseaportclimate.nyc/