Executive Summary
New York City is the artistic and creative epicenter of the country and, in many respects, the world. It is where the cultural treasures of our great museums meet the ad firms of Madison Avenue, where high fashion struts among the sound stages of Astoria, where Broadway theatres can be found a stone’s throw from some of the finest architectural, educational and publishing institutions across the globe. But the “creative economy” is more than just an agglomeration of cultural pursuits: It is a defining economic sector for New York City – on par with finance, real estate or law – with its own policy challenges and pressures deserving of rigorous review and analysis.
This report, by New York City Comptroller Scott M. Stringer, offers a comprehensive, up-to-date look at the city’s ever-changing creative economy. The creative sector, as we define it in this report, includes any industry the primary output of which is creative or cultural – from museums and art galleries, to film and television production, theater and dance companies, fashion, publishing, advertising, and more. Today, New York City’s creative sector directly employs over 293,000 people, paying $30.4 billion in wages. It is greater than the sum of its parts, providing tens of thousands of jobs not just for artists and actors, but for museum administrators, sewing machine operators, sound technicians, and the myriad other jobs that make up the creative economy, not to mention the hotel and restaurant workers, suppliers, construction workers and others whose jobs rely in some measure on the sector. Altogether, the sector is responsible for some $110 billion in total economic activity – or one in every eight dollars churning through the City’s economy.
293,000
People Employed, 2017
$30.4 B
Total Wages Paid, 2017
$110 B
Total Economic Activity, 2017
Findings of this report include:
- The creative sector accounts for 13 percent of the city’s total economic output. In total, one out of every eight dollars of economic activity in the city – $110 billion in 2017 – can be traced directly or indirectly to the sector.
- Creative industries are increasingly concentrated in New York City. An astonishing 12 percent of all creative industry jobs in the United States are located within the five boroughs – compared to less than 3 percent of all jobs nationally. Certain industries are especially highly concentrated in New York City, with one out of every five fashion design jobs in the United States (21.2 percent) now located in the city, a level of concentration that is also true for advertising (22.1 percent) and for publishing (19.3 percent).
NYC Creative Sector Employment, 2017
- The creative economy is increasingly a part of the knowledge economy. The fashion industry exemplifies the dynamics: While employment in fashion production plummeted 43 percent – by far the steepest decline of any industry in the city – the fashion design sector in the city boomed between 2008 and 2017 – up nearly 27 percent, a rise second only to advertising and film & television.
The report also takes a close look at the sector’s workforce. Among the significant findings of this report are:
- Volatile employment situations for some creative workers and high rates of self-employment contribute to economic insecurity. About one third of New York City-based actors did not have active employment in 2017, as did 21 percent of musicians. Part-time work is also prevalent: More than half of actors and nearly half of musicians and dancers and entertainers reported working part time. Moreover, 36 percent of New York City-based creative workers were self-employed in 2017, compared to just 10 percent of the City’s overall workforce. These workers lack access to benefits and protections available to employees, such as affordable health insurance and unemployment insurance.
- While persons of color represent 68 percent of the city’s total population, they account for only 34 percent of the workers in all creative occupations. But non-white creative workers overall earn 91 cents on the dollar compared to their white counterparts – a much better ratio than the citywide average for all workers of just 54.5 cents on the dollar. Female creative workers, who comprise 49% of the creative workforce – close to the citywide ratio – earn 94 cents on the dollar compared to their male counterparts – also considerably better than the citywide ratio of 82.5 cents.
- Finding affordable places to live and work for creative sector workers has become an ever-steeper challenge – leading to profound migrations across the five boroughs in recent years. While Manhattan neighborhoods south of 96th Street have lost residents in creative occupations, other, more affordable areas of the city have gained, with the steepest increases in Brooklyn’s Bushwick and Bedford-Stuyvesant; and Washington Heights, Inwood and Marble Hill in Upper Manhattan.
Change in Residents in Creative Occupations by Neighborhood, 2008-2017

Finally, this report looks at the robust network of government and other supports aimed at promoting creative industries and workers, and expanding access to the arts and culture.
- The New York City Department of Cultural Affairs (DCLA) is the largest cultural grant-making agency in the country, providing $181 million in support to cultural organizations in New York City in City fiscal year (FY) 2018.
- The Mayor’s Office of Media and Entertainment supports film and television production, as well as other supports to the film, TV, theater, music, advertising, publishing, and digital content sectors
- The State and City’s film and television tax credits led to a boom in production in the five boroughs.
- Numerous other programs and initiatives provide piecemeal support to other components of the sector and promote creative sector careers.
Nevertheless, more can and should be done to strengthen and sustain the city’s sprawling yet often fragile cultural eco-system. To fortify and grow the creative sector and expand access to New Yorkers of all incomes and ethnicities, the City must first and foremost treat the sector as the economic engine and resource that it is, and at the same time tackle the challenge of making the City more secure and affordable for creative workers. If New York City is allowed to become a place with limited economic footholds for artists, writers, and others who yearn to stake their claim, it will cease to be a beacon for creative types across the globe and the city will pay a steep price – in both economic activity and the cultural riches that have long defined the five boroughs. Supporting the creative economy more broadly will require both targeted investments in specific industries, as well as broad based investments aimed at making New York City a more affordable place to live, work and create.
Among the recommendations outlined further in this report are the following three areas of focus:
1. Value and Promote the Creative Sector
Given the importance of the creative sector to the City’s economy and to the lives of its residents, the City should adopt a more pro-active and cohesive approach to promoting the sector:
- Strengthen the City’s role in sustaining the creative sector: The City should establish an office and interagency task force under the Deputy Mayor for Economic Development with the role of supporting and promoting the creative sector. The office would oversee and coordinate the work of the several City agencies and entities (DCLA, EDC, MOME, NYC & Company) that currently provide support to one or more industries within the creative sector.
- Create and promote Cultural Districts: City and/or State support and sponsorship to replicate the success of existing cultural districts to drive visitors, develop the local economy, and connect local communities to their cultural offerings.
- Improve the capital funding process for cultural nonprofits: Streamline the cumbersome and costly process for providing capital funds for equipment and facilities to non-profit arts and cultural organizations, which currently hinders the City’s efforts to support small organizations in particular.
- Establish Creative Economy Zones. Creative Economy Zones would be zoned to promote development of space for creative industries.
- Foster creative incubators: Explore partnerships with industry to establish creative sector incubators where early-career creative professionals and start-ups can access low-cost space and equipment.
- Utilize existing public space. Use space in DOE schools, which have a wide array of artist facilities and space, to provide low-cost space to non-profit cultural organizations and artists.
2. Deepen Connections to Local Communities
Enhancing diversity in the creative sector requires starting early to provide opportunity for students and youth. To provide the benefits of arts education, expand access to the City’s cultural offerings, and open pathways for all New Yorkers to creative careers, the City should undertake the following steps:
- Increase arts/creative education in schools: Following a 2014 report by the Comptroller, DOE increased funding for arts education in schools. But the City still falls short of New York State requirements for arts education. The City should ensure that every New York City school has access to a full-time arts educator, and work with local arts organizations as resources for public school arts education.
- Promote creative sector careers: The City should partner with industry and the non-profit sector to create accessible training, apprenticeship, and other work-based learning programs in the creative industries.
- Bolster support for cultural programming for at-risk and underserved youth: Arts and culture programming and education offers a safe space to learn new skills, express emotion, and take risks. At-risk and underserved youth in particular should have the opportunity provided by arts programming, which can also help serve as a career pathway.
3. Support the Creative Workforce
Many members of the creative workforce face the numerous challenges associated with part-time and “gig” work. The following measures would help them and other similarly-situated workers in other sectors:
- Support state legislation to combat wage theft. New York State should enact protections for independent workers that build on the City’s 2017 “Freelance Isn’t Free Act” which guarantees freelancers the right to a written contract, full and timely payment, and protection from retaliation.
- Supporting access to quality, affordable benefits. The City or State should partner with private organizations to create a welfare benefits fund for creative workers, and enable withholding to fund benefits.
- Enhance economic security of the self-employed. Using a welfare benefits fund as an employer under New York State labor law, independent workers could be recategorized as employees to give them access to unemployment insurance and workers compensation.
- Create new affordable housing and workspaces. A more ambitious effort to create affordable living and working space for creative professionals is needed in the face of the rising affordability crisis.
New York City’s Creative Economy
The Sector at a Glance
New York City’s creative economy is world-renowned and core to the city’s global identity and brand. From the theaters of Broadway to the advertising firms of Madison Avenue, from the New York City Ballet to the performances on the runway at Fashion Week, the Metropolitan Museum to the Bronx Zoo, New York is synonymous with art, culture, and creativity.
More than just a symbol, the creative sector is a major part of, and contributor to, New York City’s economy. It provided employment to some 293,000 people in 2017 and paid $30.4 billion in total wages. Some 15,000 firms and institutions provided employment to over 231,000 people in New York City’s creative sector in 2017. In addition, over 62,000 workers in the sector are self-employed – a figure which has grown at nearly twice the rate of growth of those employed in a business or non-profit organization. Altogether, New York City’s creative sector represents about 5.4 percent of private employment in the City, and 6.7 percent of wages paid in the City.
Table 1: Overview of New York City’s Creative Sector, 2008 and 2017
SOURCE: Office of the Comptroller estimates based on Bureau of Labor Statistics and Census Bureau American Community Survey.
But those figures understate its total economic impact. Workers in other industries — both specialized, such as the crafts and trades that serve theaters and film production companies, and other more general, such as hospitality, legal services, and transportation — provide goods and services to the arts and culture industries and would not exist in the same numbers without them. The spending of these firms and their employees induces further economic activity. Including the workers directly employed in the creative industries, the suppliers of goods and services to those industries, and the induced economic activity, total output of the industry was roughly $110 billion in 2017 – nearly 13 percent of total City output, or nearly one in every eight dollars.[1]
The sector, as we define it for purposes of this report, is varied, and includes advertising agencies, design and architecture firms, the fashion industry, film and television production, art dealers, galleries and auction houses, sound recording, museums and libraries, theater and the performing arts, and book and periodical publishing.[2] (Profiles of each industry can be found in the Appendix.)
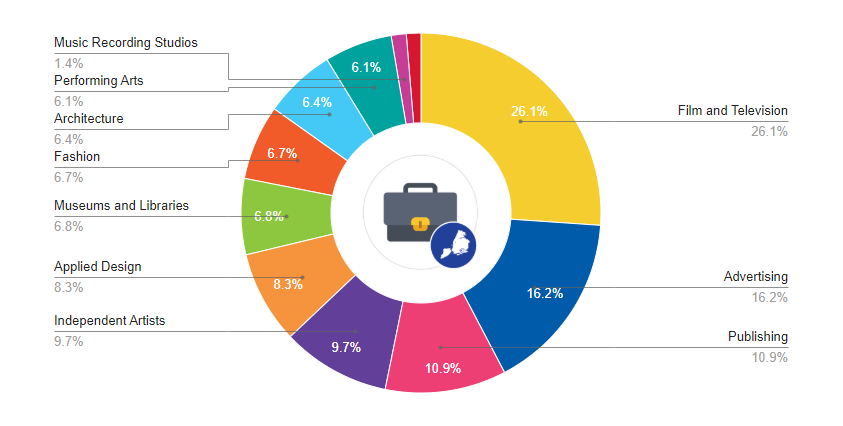
As shown in Chart 1, the largest industry was film and television, which includes motion pictures production, television broadcasting, and cable services, and employed over 76,500 people in 2017. The next largest industries were advertising and publishing, which employed approximately 47,600 and 31,900 people, respectively.
Chart 1: NYC Creative Sector Employment, 2017
SOURCE: Office of the Comptroller estimates based on Bureau of Labor Statistics and Census Bureau American Community Survey.
While many workers in these sectors hold creative occupations – actors and editors, musicians and designers, architects and photographers – overall roughly 60 percent of workers in the sector hold other jobs – from grant writers to IT administrators, sales agents to security guards, theater ushers to human resources managers. In addition, thousands of artists, writers and performers work independently – members of the “gig economy” long before the term was invented.
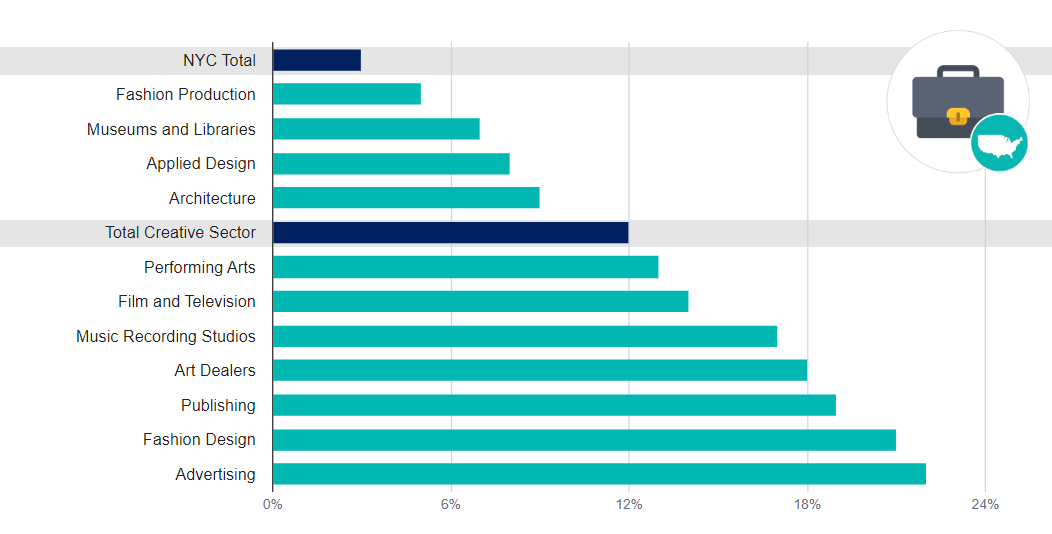
The sector as a whole, and to one degree or another, all of its industries, are highly concentrated in New York City, with sectoral shares of national employment well in excess of the City’s overall share of total national employment. New York City employment in the creative sector as a whole is nearly 12 percent of total U.S. employment in the sector; by contrast, total New York City employment in all sectors of the economy is less than 3 percent of total U.S. employment. As shown in Chart 2, some industries are particularly highly concentrated, such as advertising (22.1 percent of U.S. employment); fashion design (21.2 percent), and publishing (19.3 percent) – but even fashion production employment, which has shrunk rapidly over the last few decades, remains higher than average, at 5.4 percent. With a few exceptions, the degree of concentration has only increased in the last decade, from 10.2 percent overall in 2008, to 11.9 percent in 2017.
Chart 2: Creative Sector Shares of National Employment by Industry, 2017
SOURCE: Office of the Comptroller estimates based on Bureau of Labor Statistics and Census Bureau American Community Survey.
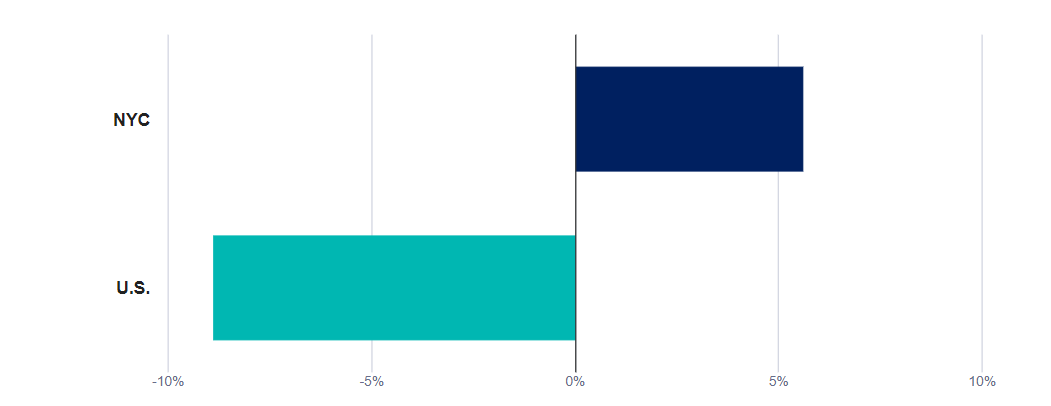
Relative to the record employment growth in the City as a whole over the last decade, employment in the creative sector (excluding self-employment) has lagged somewhat, rising 5.6 percent compared to a 15.6 percent increase in total City jobs. But relative to the U.S. as a whole, where creative sector jobs declined by nearly 9 percent, New York’s creative sector has fared extremely well in the last decade (Chart 3). Job growth was greatest in Brooklyn and, to a lesser degree, Queens.[3]
Chart 3: New York City’s Creative Sector Has Grown
SOURCE: Office of the Comptroller estimates based on Bureau of Labor Statistics and Census Bureau American Community Survey.
But growth has not been distributed evenly among creative industries, as seen in Chart 4. While most sectors have seen growth, three of the industries expanded by more than the citywide rate since the recession, while three others have contracted – fashion production, publishing, and music recording.
Chart 4: Percent Change in NYC Creative Employment by Industry, 2008 to 2017

SOURCE: Office of the Comptroller estimates based on Bureau of Labor Statistics and Census Bureau American Community Survey.
The $30.4 billion earned by creative sector workers in 2017 was up 23 percent from 2008. Total wage growth in the creative sector was slightly below the rate of growth of wages over all in New York City of 29.3 percent over the same period. Wage growth for creative sector employees was higher (23.6 percent) than for the self-employed (18.5 percent).
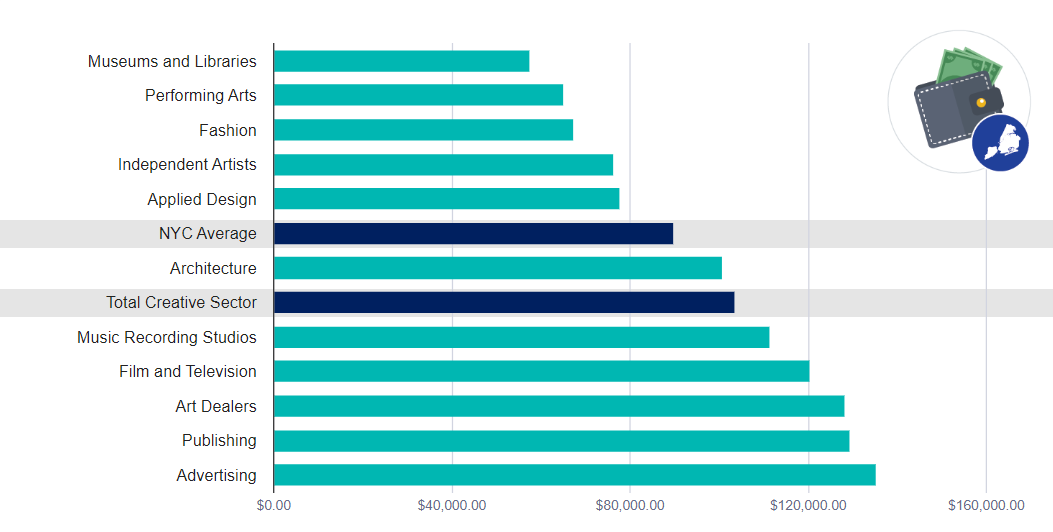
Across all sectors of the creative economy, the average creative sector wage (including the self-employed) increased by 15.2 percent from $89,864 in 2008 to $103,486 in 2017. As shown in Chart 5, average wages vary greatly by industry – from an average of $57,416 in the museums, historical sites, zoos, parks, and libraries sector to over $129,478 in publishing and $135,334 in advertising. Six creative industries have average wages exceeding the city average for all industries of $89,766. Four of these have also experienced job growth since the recession – advertising, architecture, art dealers, and film and television.[4]
Chart 5: NYC Creative Economy Average Wages, 2017
SOURCE: Office of the Comptroller estimates based on Bureau of Labor Statistics and Census Bureau American Community Survey.
NOTE: Includes both employed and self-employed. Salaries and wages only, excluding benefits.
The Creative Workforce
Nearly 228,000 New Yorkers are employed in a creative occupation, as detailed in Table 2 below. This figure includes both those who work in one of the creative industries discussed above, as well as the tens of thousands of other creative workers who are employed in other sectors – such as the graphic designer at a tech firm, or the editor working for a trade association, or the architect at a real estate development firm.
While creative workers are often relatively high earners – especially amongst those employed in private-sector firms – many creative workers are self-employed or lack steady employment and earn relatively low wages from their chosen profession. This is even more true for minorities and women, who are both underrepresented in creative professions, and generally less well-paid. Coupled with often high student debt loads and the increasing difficulty of finding affordable housing, New York City is becoming a challenging place to live for many workers in the sector.
Employment
From 2008 to 2017, the resident creative workforce grew 12.8 percent, outpacing growth of 8.2 percent in the total resident workforce. Together these creative workers represent 5.5 percent of the City’s workforce – up slightly as a share from 2008. The largest number – 61,496, or one-quarter of the total – are designers. Editors, writers and authors are the next most numerous at over 48,000.
Table 2: The Creative Workforce in New York City
| Occupation | 2008 | 2017 | Pct. Change |
| Actors | 9,255 | 11,509 | 24.4% |
| Agents | 5,629 | 5,402 | -4.0% |
| Architects | 12,703 | 13,216 | 4.0% |
| Artists | 17,681 | 17,447 | -1.3% |
| Sound Operators and Media Editors | 13,750 | 16,935 | 23.2% |
| Dancers and Entertainers | 5,215 | 5,312 | 1.9% |
| Designers | 52,530 | 61,496 | 17.1% |
| Writers, Authors and Editors | 41,513 | 48,053 | 15.8% |
| Musicians | 12,218 | 14,221 | 16.4% |
| Photographers | 12,185 | 11,709 | -3.9% |
| Producers and Directors | 19,167 | 22,455 | 17.2% |
| Total, Creative Occupations | 201,846 | 227,755 | 12.8% |
| Total, All NYC Occupations | 3,817,552 | 4,131,157 | 8.2% |
| Creative Workers as Percent of Total | 5.3% | 5.5% |
SOURCE: Office of the Comptroller estimates based on Census Bureau’s American Community Survey.
Overall, New Yorkers with creative occupations report comparable levels of active employment to other city residents reporting an occupation. As Chart 6 below illustrates, 84.4 percent of creative workers who live in New York City are working, nearly identical to the citywide average of 84.3 percent for all workers. However, these averages belie challenging labor markets for certain types of creative workers.
Chart 6: Employment Status of New York City Creative Workers vs. All New Yorkers, 2017
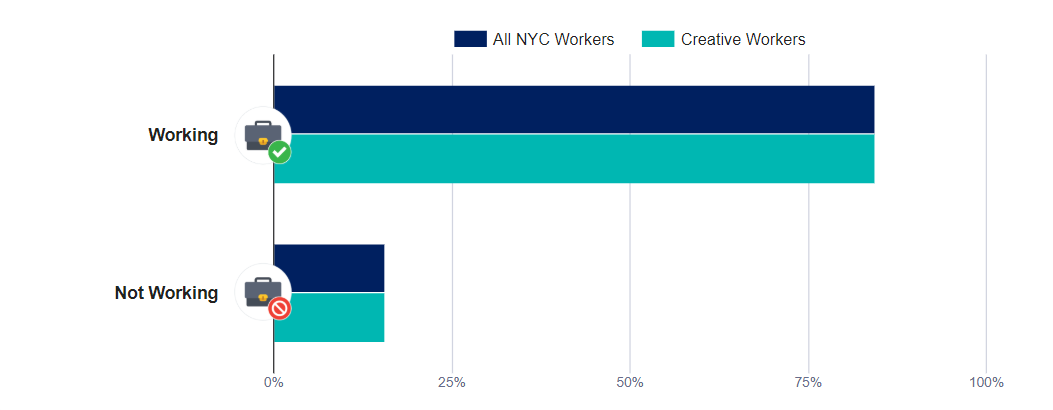
SOURCE: Office of the Comptroller estimates based on Census Bureau’s American Community Survey.
Many creative workers in New York City, such as actors, musicians, and photographers, must navigate volatile employment situations, due to the frequently short-term, “gig” nature of their work. One third of New York City-based actors did not have active employment in 2017, well above the creative workers’ average of 15.6 percent, as seen in Chart 7. Musicians also faced employment challenges with 21 percent indicating that they were not working.
Chart 7: Share of New York City Creative Workers without Active Employment by Occupation, 2017
SOURCE: Office of the Comptroller estimates based on Census Bureau’s American Community Survey.
Part-time work is also prevalent. Among creative workers, nearly one quarter reported working part time in 2017 (Chart 8). More than half of actors and nearly half of musicians and dancers and entertainers reported working part time. Full-time employment is more common for architects, designers, producers and directors.[5]
Other creative New Yorkers may not be able to support themselves with earnings from creative employment alone. For example, a survey of Off-Off Broadway staff found that only 10 percent made their living exclusively from the theater.[6] About two-thirds of these creative workers reported having a full-time or part-time job outside of their roles in theater productions.
Chart 8: Share of Employed NYC Creative Workers Engaged in Part-time Work, 2017
SOURCE: Office of the Comptroller estimates based on Census Bureau’s American Community Survey.
Creative workers have also historically exhibited high self-employment rates, and this holds across all occupational categories that comprise the creative workforce, as shown in Chart 9. Overall, 36 percent of New York City-based creative workers were self-employed in 2017, compared to just 10 percent of all New Yorkers. Photographers reported the highest self-employment rate – 71 percent – followed by musicians with a 57 percent self-employment rate. Other occupations are more typically employed by firms, including producers and directors, agents, designers and architects, but all still show high rates of self-employment.
Chart 9: Share of Self-Employed NYC Creative Workers, 2017
SOURCE: Office of the Comptroller estimates based on Census Bureau’s American Community Survey.
The precarious and volatile employment status of many creative workers also can leave them without access to worker protections and benefits available to regular employees. The self-employed generally have lower rates of health insurance coverage than the employed. Twenty-six percent of self-employed actors, and nearly 17 percent of photographers, dancers and entertainers, lack health insurance. For those with volatile employment and income, the risk of losing health insurance is elevated. Independent and freelance workers also lack the unemployment insurance and worker’s compensation benefits enjoyed by employees.
Diversity
Workers in creative occupations in New York City come from diverse backgrounds, but not to the extent of the overall population. As shown in Chart 10, while one-third of the city’s population is non-Hispanic white, about two-thirds of workers in creative occupations are white. In contrast, black residents make up just 8 percent of creative occupations, far below their 24 percent share of the total city population. Likewise, Hispanics’ share of the creative workforce is less than half their share of the general population. This imbalance has barely budged in the last decade. From 2008 to 2017, the non-Hispanic white share of creative workers in the city dropped just four percentage points from 70 percent to 66 percent.
Other research has produced similar findings. In 2014, the Andrew W. Mellon Foundation and the Association of Art Museum Directors sought to document these well-known disparities by conducting a demographic survey of art museum staff.[7] Among the most educated and highly paid positions – curators, conservators, educators and leadership – the Foundation found that 84 percent of staff were non-Hispanic white. Even more discouraging, the survey found that the lack of diversity was pervasive even among museums’ youngest cohorts. The only two art museum job categories with a roughly even split between whites and non-whites were security and facilities. Similarly, a City-commissioned study in 2019 found that non-Hispanic whites make up 68 percent of senior staff at the city’s nonprofit cultural groups and 69 percent of their boards.[8]
Chart 10: Racial Distribution of NYC Creative Workers Compared to Overall NYC Workforce, 2017
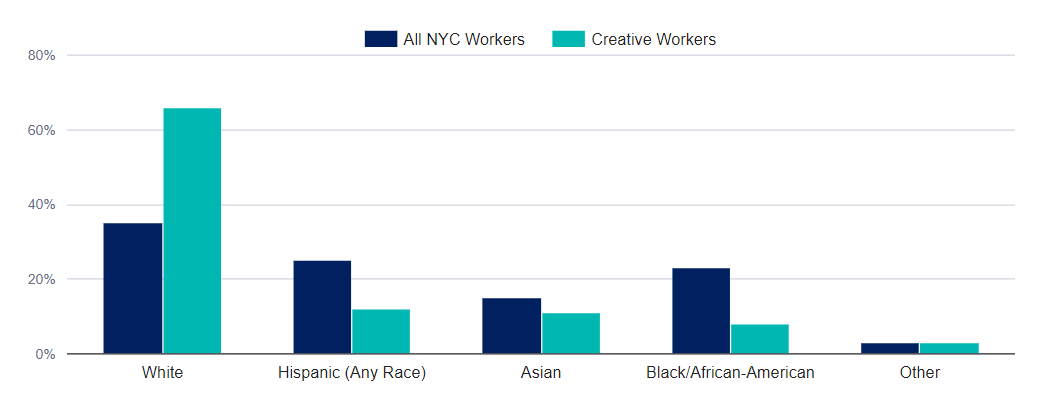
SOURCE: Office of the Comptroller estimates based on Census Bureau’s American Community Survey.
The racial divide is more pronounced in certain occupations. More than 77 percent of editors, writers and authors are non-Hispanic white, and about 82 percent of producers and directors are non-Hispanic white. Every single creative occupation category is majority white with sound operators and media editors being the most diverse, with about 44 percent of the resident workforce filled by non-white New Yorkers.
Chart 11: Racial Distribution of NYC Creative Workers by Occupation, 2017
SOURCE: Office of the Comptroller estimates based on Census Bureau’s American Community Survey.
The gap between white and non-white earnings is much less in the creative sector than in the city’s workforce as a whole, and has been improving. Median earnings of non-white creative workers were 20 percent less than white creative workers in 2008, and 9 percent less in 2017 (Chart 11). This compares favorably with the city’s workforce as a whole, where non-white workers made fully 45 percent less than their white counterparts in 2017 – a figure that has essentially stayed the same since 2008.
Chart 12: Ratio of Non-white to White Earnings – Creative Workers and All NYC Workers, 2017
SOURCE: Office of the Comptroller estimates based on Census Bureau’s American Community Survey.
The wage gap was highest among musicians where non-white workers made 42 percent less than their white counterparts in 2017. The gap in median wages among actors, producers and directors, and photographers were all larger than 20 percent. In contrast, non-white artists and performers made more than their white colleagues.
Chart 13: Non-white/White Median Earnings Ratio by Occupation, 2017
SOURCE: Office of the Comptroller estimates based on Census Bureau’s American Community Survey.
NOTE: *Results should be interpreted with caution due to small sample size.
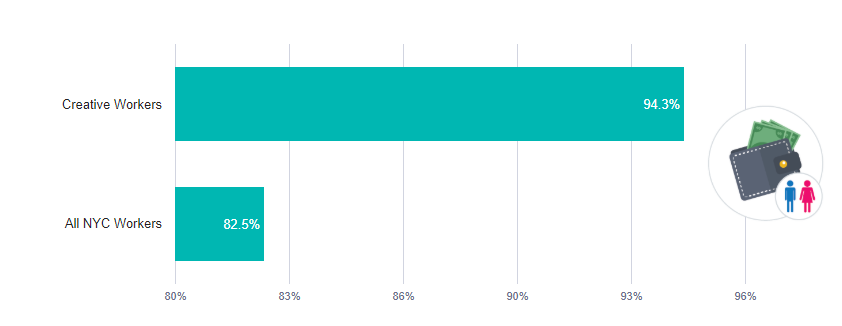
In terms of gender, the city’s creative workforce overall is somewhat closer to the makeup of the broader city adult population. In 2017, 49.7 percent of all working New Yorkers were female whereas 48.9 percent of New York City creative workers were female – a slight improvement over 2008 when 45.7 percent of New York City creative workers were female.
Chart 14: Gender Distribution of NYC Creative Workers vs Adult Population, 2008 and 2017
SOURCE: Office of the Comptroller estimates based on Census Bureau’s American Community Survey.
Some creative occupations are more male-dominated than others. In 2017, 72 percent of musicians, 70 percent of broadcast sound and media operators and editors, and 66 percent of architects and photographers, were male. On the other end of the spectrum were designers, and editors, writers and authors where a majority of the positions were held by women.
Chart 15: Gender Distribution of NYC Creative Workers by Occupation, 2017
SOURCE: Office of the Comptroller estimates based on Census Bureau’s American Community Survey.
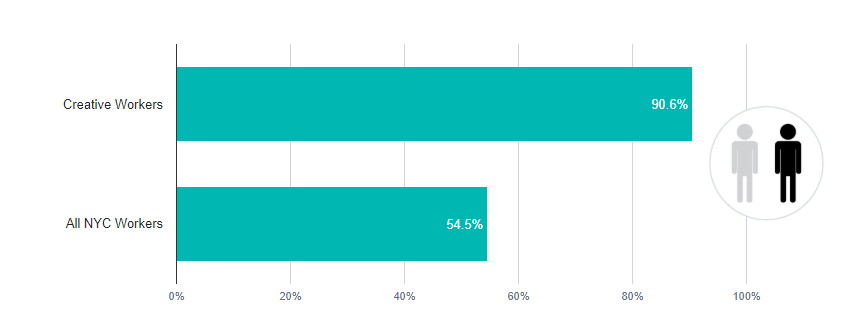
Gender inequities in earnings in creative occupations have declined very modestly. Female creative workers made 6 percent less than male creative workers in 2017. As with race, this compares favorably with the city workforce as a whole, where women earn 17.5 percent less than men.
Chart 16: Female/Male Earnings Ratio – Creative Workers and All NYC Workers, 2017
SOURCE: Office of the Comptroller estimates based on Census Bureau’s American Community Survey.
The gender wage gap was highest among photographers, where women made 33 percent less than men, followed by artists, architects, and broadcast sound and media technicians. Female actors and performers made more than men, by 21 percent and 60 percent respectively.
Chart 17: Female/Male Median Earnings Ratio by Occupation, 2017
SOURCE: Office of the Comptroller estimates based on Census Bureau’s American Community Survey.
NOTE: *Results should be interpreted with caution due to small sample size.
In acknowledgement of the lingering inequities in the cultural sector, one of the key goals of the City’s CreateNYC strategic plan is to make the city’s arts and cultural sector reflect the diversity of the city’s population. To this end, the City has pledged to increase funding for nonprofit arts and culture organizations that serve low-income neighborhoods and underserved communities, expand cultural internship opportunities for CUNY students, and require Diversity, Equity and Inclusion plans from the city’s largest cultural institutions.[9]
Affordability
In no small measure as a result of the precarity of employment and income for certain creative occupations discussed above, and because of lingering inequities in pay based on gender and race, workers in the creative fields often face particularly daunting challenges in making a home in a high-cost locale such as New York City.
For starters, many creative sector workers begin their careers with high student debt loads. The Center for an Urban Future (CUF) found that among four-year universities with the highest net tuition in America, the top ten are all classified as schools of art, music or design.[10] CUF attributed the higher price of an arts education to the need for lower class sizes and specialized equipment and spaces. According to a survey of art school alumni conducted by the Strategic National Arts Alumni Project, student debt had a “major impact on career choices” for 34 percent of graduates in the last five years but only 15 percent of older graduates.[11]
Like most New Yorkers, creative workers face growing challenges to finding affordable housing. Volatile employment and heavy student debt add to the challenges creative sector workers face in the city’s tight housing market. Between 2008 and 2017, the median contract rent in the city rose 35 percent, outpacing growth in average wages in nearly all creative industries.[12] Given the growing affordability challenges for creative workers, it is not surprising that over the last decade New Yorkers in the creative occupations have been spreading from higher-rent neighborhoods that had once functioned as strongholds for those working in the arts and culture sector to lower-rent areas outside of Manhattan.
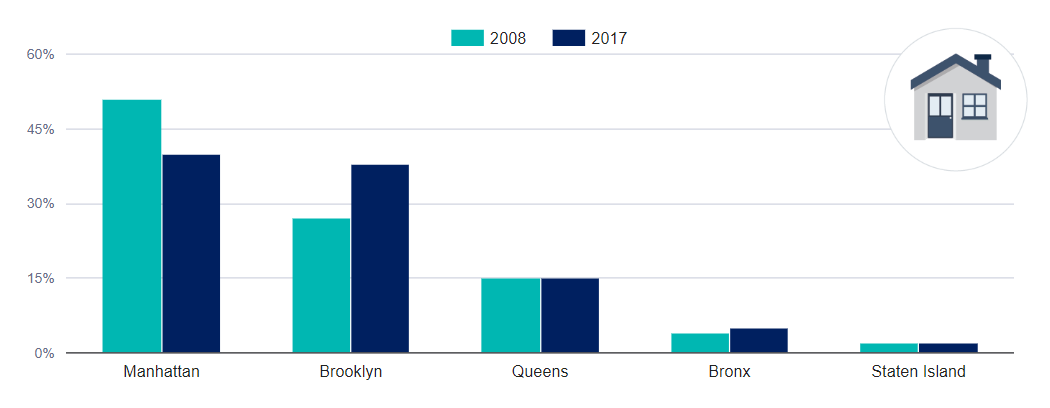
As shown in Chart 18, Manhattan housed more than half of the city’s resident creative worker population in 2008, but its share fell to 40 percent in 2017, as the number of creative workers living in Manhattan contracted. During this period, Manhattan’s share of the city’s overall population held steady at 20 percent in 2008 and 19 percent in 2017. In contrast, the number of residents in creative occupations boomed in the other boroughs. From 2008 to 2017, Brooklyn’s share of resident creative workers rose from 27 percent to 38 percent; the Bronx and Queens gained slightly in share as well.
Chart 18: Resident Creative Workers Population by Borough in 2008 and 2017
SOURCE: Office of the Comptroller estimates based on Census Bureau’s American Community Survey.
In 2008, the Upper West Side was the neighborhood with the highest concentration of people working in creative occupations, housing nearly 18,000 creative workers, or roughly 9 percent of the total creative population. But by 2017 there were only approximately 14,000 creative workers living in the neighborhood, or 6 percent of all city creative workers. Declines of more than 2,000 creative residents also occurred in the neighborhoods of Chinatown and the Lower East Side; Chelsea, Clinton, and Midtown Manhattan; Murray Hill, Gramercy & Stuyvesant Town and Battery Park City, Greenwich Village and SoHo.
The exodus of creative workers from Manhattan has produced a more dispersed population throughout the city, as the maps below detail. Whereas just one-third of New York City neighborhoods had boasted 2,000 or more creative workers within their boundaries in 2008, that percentage grew to more than half by 2017.
As these Manhattan neighborhoods have lost resident creative workers, other more affordable areas of the city have gained, with the steepest absolute gains occurring in Bushwick; Bedford-Stuyvesant; and Washington Heights, Inwood and Marble Hill.
Chart 19: Change in Number of Creative Professionals for Selected Neighborhoods, 2008 to 2017
From education to community engagement, from career opportunities to creative expression, New York nonprofits play an essential and diverse role in the city’s creative sector. These organizations provide a platform for new and emerging artists. They help preserve the history and culture of neighborhoods, ethnic groups, and ancient civilizations. They offer extraordinary educational opportunities, both inside and outside city schools. And they inspire all New Yorkers, whether as a participant, visitor, or audience member.
The city is home to nearly 2,200 cultural non-for-profit organizations with over $7 billion in annual direct contribution to the economy of the City, including $3.5 billion in wages and salaries to households employed by these institutions.[13] The remaining $3.5 billion of the budgets of these not-for-profit organizations are used to purchase goods and services outside of what their own employees provide. We estimate that, in total, this sector contributes nearly $11 billion to the New York City economy when including the spillover or multiplier effect of employment generated by businesses providing goods and services to these organizations. The city’s not-for-profit cultural sector draws about $8.8 billion in annual revenue from a combination of public and private sources.[14]
One core strength of the city’s cultural sector is its diversity of small-, mid-, and large-sized nonprofit organizations. As displayed in Chart 20, New York City cultural not-for-profits vary widely in size, with 163 organizations with annual budgets in excess of $5 million and at least 1,167 groups with budgets less than $250,000. Twelve of the largest and best known nonprofits accounted for nearly $2 billion (nearly 30 percent of the total) in direct contributions to the economy, based on their 2017 financial filings.[15]
Chart 20: Not-For-Profit Arts and Cultural Organizations in New York City, by Size of Annual Budget
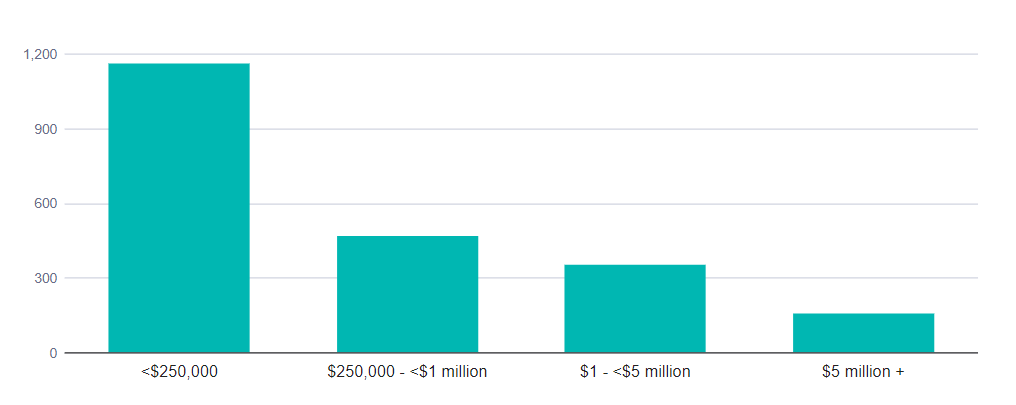
SOURCE: DataArts, accessed October 18, 2019.
The not-for-profit sector, consistent with its mission, makes art and culture widely available. According to DataArts, of the 120 million people who attend performances and museum visits each year in the city, 60 percent were free to the public, enhancing the experience of living in or visiting the greatest cultural city in the world. Additionally, not-for-profit cultural organizations provided volunteer opportunities for nearly 115,000 New Yorkers.
Non-profit cultural organizations typically rely on a mix of three broad revenue sources: ticket or “gate” sales, private fundraising, and government support. In total, nonprofit cultural organizations raised nearly $2.2 billion in private contributions in 2018 from individuals, directors, corporations, and private foundations.
But not all nonprofits can count on a reliable donor base or an annual fundraising gala, and even among those that can, most operate on tight margins. Smaller arts and culture non-profits are particularly vulnerable to rising costs: A survey conducted by the Long Island City Partnership in late 2015, for example, revealed that 40 percent of local art and cultural groups did not think they would still be in the neighborhood in five years or were not sure.[16] The study cited rent and difficulty finding appropriate space as the primary reasons.
Government plays a critical role in keeping these cultural organizations afloat and enabling nonprofits to operate across the city, particularly in lower-income neighborhoods with limited local wealth to draw upon. In the next section we highlight the government commitment to culture and the arts in New York City.
Government Support
City government supports the creative sector in a variety of ways, through several different agencies and entities:
- The Department of Cultural Affairs administers grant funding to non-profit artistic and cultural organizations.
- The Mayor’s Office of Media and Entertainment (MOME), housed in the Department of Information Technology and Telecommunications, provides programming in support of the film and TV, theater, music, and publishing industries as well as education and training programs.
- The Economic Development Corporation (EDC) supports the fashion industry, and creative technology. EDC initiatives for the fashion industry include the Made in NY Campaign, Fashion Production Fund, Fashion Future Graduate Showcase and Fashion Manufacturing Initiative, as well as NYCxDesign which showcases NYC design work across a variety of design specialties.
- Relatedly, NYC & Company, a nonprofit that provides marketing services under a City contract, promotes tourism in the City, much of which is driven by the City’s cultural offerings.
No one agency or office in City government is charged with overseeing the broader sector, however, leading to inconsistent attention and fractured policymaking relative to one of the City’s key sectors.
City Funding for Culture and the Arts
Recognizing the value of culture and the arts to New York City, the City government provides direct support to cultural organizations through several different channels, including operating and capital subsidies for 34 organizations in the City’s Cultural Institutions Group (CIG) as well as individual grants of varying amounts for non-profit arts and cultural organizations each fiscal year that are awarded through the Department of Cultural Affairs’ Cultural Development Fund (CDF). The City Council also allocates funding to cultural organizations – over $28 million budgeted in City fiscal year 2020 – through a variety of initiatives.
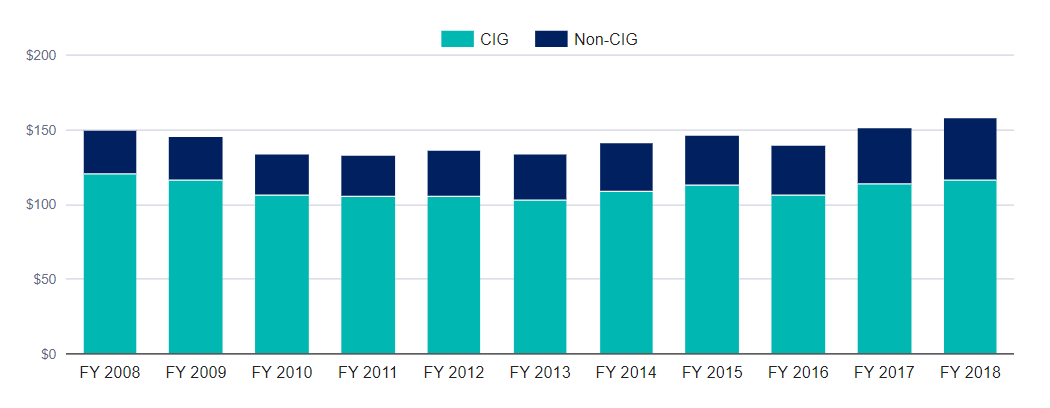
During the last recession, DCLA funding fell 11 percent over two years from $161 million in FY 2008 to $143 million in FY 2010. Funding was not restored to pre-recession levels until FY 2015. Following the passage of a law requiring the City’s first comprehensive cultural plan, the Mayor and City Council funded an additional $19 million in the FY 2017 budget for cultural organizations, bringing total funding to $182 million, a nearly 12 percent increase from the prior year.[17]
The majority of DCLA’s budget provides direct support for cultural organizations. In FY 2018, operating grants to the 33 CIGs and other non-profit institutions and organizations totaled $158 million. The department also committed $75 million in capital funding in FY 2018. The FY 2019 budget also included $3 million in grants for individual artists and smaller organizations ineligible for direct city funding.[18]
Chart 21: Department of Cultural Affairs Grants, $ in millions
Source: Office of the Comptroller
Cultural Institutions Group
The City provides direct financial support to non-profit cultural organizations in the form of operating and capital subsidies. Through a public-private partnership dating back to 1869, the City provides direct financial support to 34 non-profit cultural organizations that operate on City-own property, collectively known as the Cultural Institutions Group (CIG).[19] CIG members receive capital and operating support from the City to help meet basic maintenance, security, energy and other costs. In return for this support, these institutions are committed to ensuring access to cultural, historical and scientific programming for all New Yorkers.
The CIG represents a broad spectrum of cultural endeavor, from art and natural history museums to historical societies, theaters, concert halls, performing arts centers, botanical gardens and zoos. Institutions range from the internationally renowned Metropolitan Museum of Art and the Brooklyn Academy of Music to community-based organizations such as the Jamaica Center for Arts and Learning, the Bronx Museum of the Arts, and the Staten Island Botanical Garden.
About three-quarters of the City’s grants to non-profit organizations go to the CIGs, who make up just 3 percent of total grantees. In FY 2018 $116 million out of $158 million in operating subsidies went to the CIGs. Nonetheless, operating subsidies to the CIGs remain below their peak of $120 million in FY 2008.
Individual funding amounts for the CIGs are determined historically and are not formula-driven.[20] The top three recipients – the Metropolitan Museum of Art, the American Museum of Natural History and the Bronx Zoo – collectively received $55 million in FY 2018, close to half of total CIG funding. Individual amounts have been relatively stable over time. Although the City’s largest and most renowned institutions receive the largest amounts, the smaller institutions generally rely more heavily on DCLA funding. For example, while The Metropolitan Museum’s $24 million grant made up less than 7 percent of its annual revenue in 2016, DCLA’s grant to the Bronx County Historical Society – the smallest CIG grant recipient – accounted for about 36 percent of that organization’s total revenue.[21]
Grants to Other Cultural Organizations
Non-CIG organizations must apply and compete for DCLA funding through the Cultural Development Fund. In the last few years, subsidies to these groups have grown at a faster clip than CIG funding, increasing by 27 percent from $32.3 million in FY 2014 to $41 million in FY 2018. Faster growth has been driven by both a higher number of grantees and higher award amounts. The number of organizations receiving grants increased from 881 to 937 and average grants grew from about $37,000 to $44,000.
Most of the non-CIG grants are concentrated in Manhattan. As shown in Table 3, Manhattan-based organizations account for 65 percent of the organizations receiving grants in FY 2018 and 61 percent of total grant funds. This composition has remained largely unchanged since FY 2014, as shown in Table 4.
Table 3: Borough Distributions of FY 2018 Non-CIG Grants
| No. of Organizations | Grants | Average | |||
|---|---|---|---|---|---|
| Count | Share | Amount | Share | ||
| Bronx | 44 | 4.7% | $3,308,625 | 8.1% | $75,196 |
| Brooklyn | 194 | 20.7% | 7,759,775 | 18.9% | 39,999 |
| Manhattan | 608 | 64.9% | 25,124,850 | 61.3% | 41,324 |
| Queens | 71 | 7.6% | 3,924,500 | 9.6% | 55,275 |
| Staten Island | 20 | 2.1% | 886,600 | 2.2% | 44,330 |
| Total | 937 | 100.0% | $41,004,350 | 100.0% | $43,761 |
Source: https://data.cityofnewyork.us/Recreation/DCLA-Programs-Funding/y6fv-k6p7
Table 4: Grants to Non-CIG Cultural Organizations FY 2014 and FY 2018
| FY 2014 | FY 2018 | |||
|---|---|---|---|---|
| Amount | Share | Amount | Share | |
| Bronx | $2,527,835 | 7.0% | $3,308,625 | 8.1% |
| Brooklyn | 5,846,085 | 17.8% | 7,759,775 | 18.9% |
| Manhattan | 19,942,585 | 63.0% | 25,124,850 | 61.3% |
| Queens | 3,373,580 | 10.1% | 3,924,500 | 9.6% |
| Staten Island | 651,855 | 2.0% | 886,600 | 2.2% |
| Total | $32,341,940 | 100.0% | $41,004,350 | 100.0% |
Close to one-third of the grants awarded in FY 2018 were to multi-disciplinary organizations, many of which support individual artists and organizations with resources, networks, and funding, such as the Queens Council on the Arts and the Lower Manhattan Cultural Council. As Table 5 shows, theater groups are the second largest recipient of non-CIG grants, followed by music organizations, museums, and dance companies.
Table 5: DCLA Grants to Non-CIG Cultural Organizations by Discipline
| FY 2014 | FY 2018 | |||
|---|---|---|---|---|
| Amount | Share | Amount | Share | |
| Multi Discipline Orgs. | $10,154,965 | 31.4% | $13,429,430 | 32.8% |
| Theater | 5,604,750 | 17.3% | 6,427,360 | 15.7% |
| Music | 3,909,610 | 12.1% | 4,830,775 | 11.8% |
| Museum | 3,862,655 | 11.9% | 4,469,160 | 10.9% |
| Dance | 3,322,450 | 10.3% | 3,919,075 | 9.6% |
| Visual Arts | 1,471,205 | 4.5% | 2,160,525 | 5.3% |
| Unclassified | 875,745 | 2.7% | 1,658,475 | 4.0% |
| Film/Video/Audio | 1,192,450 | 3.7% | 1,251,995 | 3.1% |
| Literature | 600,615 | 1.9% | 800,525 | 2.0% |
| Humanities | 441,765 | 1.4% | 511,200 | 1.2% |
| Architecture/Design | 374,645 | 1.2% | 471,125 | 1.1% |
| Folk Arts | 264,985 | 0.8% | 434,005 | 1.1% |
| Science | 103,275 | 0.3% | 196,100 | 0.5% |
| Photography | 57,775 | 0.2% | 164,100 | 0.4% |
| Other | 15,760 | 0.0% | 163,050 | 0.4% |
| New Media | 84,035 | 0.3% | 117,450 | 0.3% |
| Crafts | 5,255 | 0.0% | 0 | 0.0% |
| Total | $32,341,940 | 100.0% | $41,004,350 | 100.0% |
Source: Department of Cultural Affairs
Capital Funding
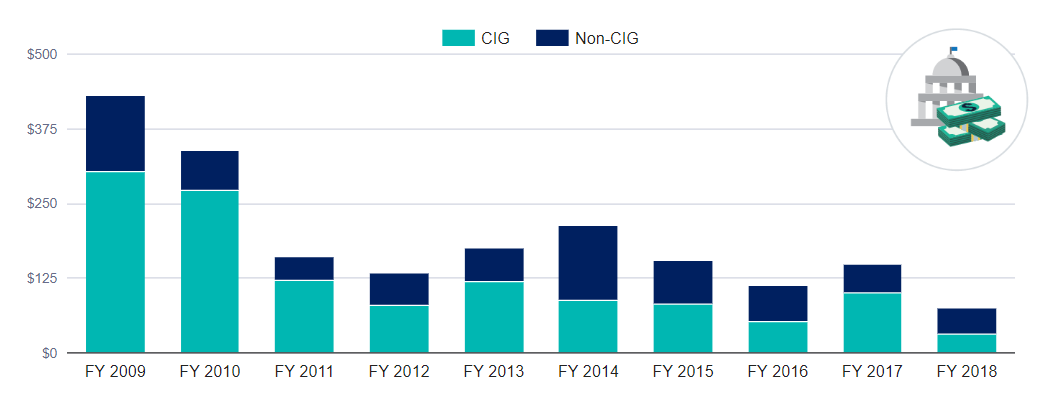
The Department of Cultural Affairs provided $1.94 billion in capital funding to cultural organizations across the City in the decade between fiscal years 2009 and 2018. Two-thirds, or $1.25 billion, went to members of the Cultural Institutions Group, while other cultural organizations received $692 million in capital funding. Capital commitments peaked in FY 2009, at $430 million, and fell as the capital budget was cut in the wake of the 2008-09 recession.[22] But while operating and programmatic support has increased steadily since fiscal year 2013, capital funding has remained at or below $150 million annually in the last four fiscal years.
The current administration has de-emphasized capital funding for members of the Cultural Institutions Group. In the last three years, City-funded capital commitments for members of the CIG have averaged less than one-third of their level from FY 2008 through FY 2014.
Chart 22: DCLA Capital Commitments, FY 2009-FY 2018, $ in millions
Source: Office of the Comptroller from New York City Financial Management System data.
Some 200 non-CIG cultural organizations received a total of $692 million in capital funds from the City over the last decade. The range of recipients is broad, spanning large, well-known cultural institutions such as the Whitney Museum, Park Avenue Armory, or Signature Theater, to smaller, local organizations such as the Louis Armstrong House, the Central Brooklyn Jazz Consortium, or the St. George Theater. The largest single non-CIG capital grant in the past decade was for construction of The Shed, a multi-disciplinary cultural performance space which opened in Hudson Yards in March 2019.
Because of restrictions on the kinds of projects that are eligible to receive City capital funding, cultural organizations that are not on City-owned property typically receive capital funding for equipment that is not attached to real property, including lighting and audio systems, ticketing scanners, or computer equipment. Nonetheless, some organizations have received funding for construction of new facilities and for expansions or renovations of existing buildings. These types of projects require the City to retain a first priority lien on the property owned or leased by the cultural organization for a term equivalent to the bonds issued to finance the project.
The process of drawing down capital funds is notoriously onerous for non-profits of all kinds, including cultural organizations. The many steps, from capital eligibility determination, to ensuring and documenting adherence to various City and other governmental requirements, to submitting payment requests, require multiple layers of review and extensive and detailed documentation. The entire process can place smaller and less financially robust organizations into a position of considerable financial strain.
Federal and State Funding
In addition to City support, non-profit cultural organizations in the City also receive grants from the Federal and State governments. The Federal grants are disbursed primarily by the National Endowment for the Arts (NEA), while State grants are disbursed primarily by the New York State Council for the Arts (NYSCA).
Federal and State support is much less than that provided DCLA, accounting for less than a quarter of total government funding for non-profit cultural organizations in FY 2018 (Chart 23).[23]
Chart 23: FY 2018 Government Funding for Non-Profit Cultural Organizations, $ in millions
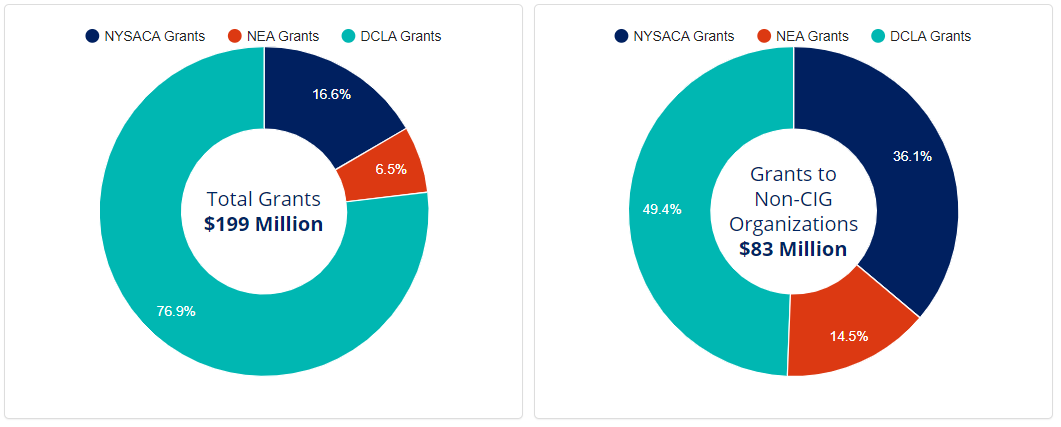
SOURCE: Office of the Comptroller; Department of Cultural Affairs; National Endowment for the Arts; New York State Council on the Arts.
Federal funding through the National Endowment for the Arts (NEA) benefits over 400 city arts and cultural organizations. After peaking at $20.3 million in federal fiscal year (FFY) 2009 as part of the federal stimulus program in response to the recession, total NEA grants to city organizations have been roughly flat for the last seven years, averaging $13.9 million since FFY 2012. The average grant size is roughly $32,000 per recipient.
The New York State Council for the Arts (NYSCA) provided grants to over 1,200 city cultural groups in state fiscal year 2018. NYSCA funding for city arts and culture rose from $20.3 million in State fiscal year (SFY) 2012 to $33.1 million in SFY 2018. SFY 2018 grants include $2.7 million in State Regional Economic Development funding, of which $1.5 million are grants to 26 organizations for “workforce readiness.” The SFY 2018 grants also include six capital grants totaling $7.5 million. The majority of NYSCA grants, which average under $20,000, are for general support, whether operating or programmatic.[24]
Unlike DCLA, NYSCA does provide grants to individual artists. About 80 artists per year – primarily in film and media and music, but also in theater and dance – receive grants each year.
Federal and state funding for the arts and culture provides a crucial additional source of revenue for smaller organizations. Most of the Federal and State grants are awarded to non-CIG organizations. Of the $33.1 million NYSCA grants to 1,234 New York City non-profit cultural organizations in State fiscal year (SFY) 2018, $29.8 million were made to non-CIG organizations. Similarly, of the $13.3 million NEA grants to 451 city organizations in Federal fiscal year (FFY) 2017, $12.2 million were awarded to non-CIGs.
Many of the same organizations that receive funding through DCLA also are the recipients of NEA and NYSCA grants, although 45 percent of organizations that received government funding between 2012 and 2018 received it from only one of the three organizations.
As with City support, Manhattan-based organizations received the bulk of the NEA and NYSCA grants. As shown in Table 6, Manhattan-based organizations received more than 70 percent of NEA and NYSCA grants in FFY 2018 and SFY 2018. Together, non-profit cultural organizations in Manhattan and Brooklyn received more than 90 percent of NEA and NYSCA grants in FFY2018 and SFY 2018, respectively.
Table 6: NEA and NYSCA Grants to Non-CIG Cultural Organizations
| NEA Grants (FFY 2018) | NYSCA (SFY 2018) | |||
|---|---|---|---|---|
| Amount | Share | Amount | Share | |
| Bronx | $405,000 | 3.3% | $1,057,934 | 3.5% |
| Brooklyn | 2,501,500 | 20.5% | 5,450,754 | 18.3% |
| Manhattan | 9,074,500 | 74.4% | 22,443,107 | 75.2% |
| Queens | 195,000 | 1.6% | 614,868 | 2.1% |
| Staten Island | 25,000 | 0.2% | 261,500 | 0.9% |
| Total | $12,201,000 | 100.0% | $29,828,163 | 100.0% |
Note: FFY: federal fiscal year (October 1, 2017 to September 30, 2018); SFY: state fiscal year (April 1, 2017 to March 31, 2018)
Other Government Support
Besides direct support to non-profit cultural organizations, City support is also provided to the creative sector through a variety of other programs.
Mayor’s Office of Media and Entertainment
In 1966, Mayor John Lindsay established the Mayor’s Office of Film, Theater and Broadcasting, the first of its kind in the world, helping to boost film production in the 1960s and 1970s.[25] Today, the Mayor’s Office of Media and Entertainment (MOME) continues to coordinate and support film and television production, but also provides broader support to the film, TV, theater, music, advertising, publishing, and digital content sectors.
MOME has a number of career development programs, including programs focused on women in film, TV and theater, and training programs for production assistants, post-production, animation, and other occupations.
MOME also sponsors programs to both promote the sector and to enhance access to its offerings, including Broadway in the Boros and NYC Music Month.
The City’s Office of Nightlife, created in 2017, is also housed at MOME.
New York State and City Film Tax Credits
Many government and industry officials argue that the expansion of the City’s film industry is due in large part to numerous tax incentives that New York State offers to the industry to keep production costs competitive with other localities. Tax credits specific to the film industry were first instituted in New York State in 2004 when the State established the Film Production Tax Credit program. This provided production companies with a 10 percent tax credit for costs related to actual film shooting that took place in New York State. New York City, under the Bloomberg Administration, coupled the State credit with its own credit equal to 5 percent of eligible production costs, as part of a program of the Mayor’s Office of Film, Theatre and Broadcasting, dubbed the “Made in NY” initiative.[26]
The credits were seen as a necessary measure to stem the tide of film production that had relocated to other localities that were offering a more favorable tax environment. In particular, beginning in 1997, the Canadian government and its provinces had approved generous rebates, which combined could total up 70 percent of production costs for foreign producers who agreed to shoot in the country. Prominent TV series and films such as Chicago and New York Minute, which ostensibly were based in American cities, were shot on location in Toronto. New York, along with other States, responded by offering their own credits to film companies.[27]
Since their first establishment in 2004, the tax credit program was subsequently expanded to provide both greater benefits and include post-production activities and commercials as well. The New York City film production credit program, however, expired on December 31, 2011.
Film Production and Post Production Tax Credits
In its current form, the State allocates up to $420 million per year for film production and post production ($25 million of the total credits are allocated to post production). Production companies may be eligible to receive a fully refundable credit of 30 percent of qualified production and post-production costs incurred in New York State.
For the period 2015-2022, productions with budgets over $500,000 can receive an additional 10 percent credit on qualified labor expenses incurred in upstate counties. There is a maximum of $5 million per year that can be allocated for the additional 10 percent credit on qualified labor expenses.
Commercial Production Tax Credits
The State also allocates $7 million per year to encourage qualified production companies to produce commercials in New York State. The $7 million per year consists of three components for companies: shooting commercials Downstate ($3 million), shooting Upstate ($3 million), and those demonstrating incremental “growth” in commercial production ($1 million).
Other Film & Television Incentives
Both New York City and State have offered various one-time incentives and supports to the film and television industry. For example, in the early 2000s, the City helped jumpstart development of Steiner Studios at the largely abandoned Brooklyn Navy Yard by contributing $28 million in infrastructure improvements.[28] Steiner is now the largest studio in New York.[29] More recently, the City pledged $36 million in tax credits to York Studios for constructing new studio space in the Soundview neighborhood of the Bronx.[30] The State has also actively supported the industry through one-time subsidy deals. Following the retirement of David Letterman, the State awarded $11 million in tax credits and a $5 million capital grant to retain The Late Show in New York City.[31] The State’s development agency, Empire State Development, also facilitated the sale of a former state-owned prison on Staten Island in 2014 to Broadway Stages to be converted into a 100,000 square foot film and television production studio space.[32]
New York State Musical and Theatrical Production Credit
New York State provides a refundable tax credit for musical and theatrical producers to tour productions and tryouts within New York State outside of New York City. The credit is equal to 25 percent of qualified expenditures, against either the business franchise tax or personal income tax (for sole proprietors or partnerships). To be eligible, a company must produce a live, dramatic stage presentation on a tour that consists of eight or more shows in three or more localities. The credit covers production and transportation costs.
CreateNYC
The de Blasio administration has also stepped up efforts to diversify cultural organizations and expand access to arts and culture in underserved areas of the City. In January 2016, DCLA launched an initiative to promote and cultivate diversity among staff and audiences in cultural organizations, and in July 2017, the administration released its first comprehensive cultural plan for the City, CreateNYC, laying out a blueprint for expanding the cultural sector and supporting arts organizations and artists in all five boroughs. The cultural plan includes milestones established to review progress and evaluate implementation. The Plan includes strategies to diversify funding distribution in underserved communities, including people with disabilities, preserve and develop workspaces for artists, encourage professional development of cultural workers from diverse communities and increase access to arts, culture and science education.
IDNYC
The de Blasio administration created a municipal identification card in 2015, IDNYC, one feature of which was to provide cardholders with free annual memberships at members of the Cultural Institutions Group and other cultural organizations, as well as discounts at several entertainment venues. According to a 2016 evaluation of the program’s first 18 months, some 45 percent of cardholders said that access to memberships at cultural institutions was “quite a bit” the reason for getting an IDNYC card.[33]
Culture Pass
Public interest in accessing New York’s cultural offerings remains strong. Culture Pass is a program for cardholders of the Brooklyn Public Library, the New York Public Library, and the Queens Library. Using their library cards, New Yorkers 13 and older can reserve passes and get free admission to dozens of New York City cultural institutions, including museums, historical societies, heritage centers, public gardens, and more. In the first week the Culture Pass was operating, New Yorkers reserved 9,500 tickets, and libraries experienced an influx of library card applications.[34]
Percent for Art
The Percent for Art law initiated by Mayor Ed Koch in 1982, requires that one percent of the budget for eligible City-funded construction projects be spent on artwork for City facilities. The program is administered by the Department of Cultural Affairs. According to data posted by the Department in November 2018, since inception, more than 300 Percent for Art projects have been completed at about 270 City facilities by 300 artists across the City.
Educational Programming
Several City programs promote arts education. Materials for the Arts is an interagency collaboration (DOE, DCLA, and Department of Sanitation) which provides a way for companies and individuals to donate supplies to nonprofit organizations with arts programming in public schools.
Additionally, the New York City Department of Education provides instruction in art and music to students at all grade levels in certain schools. According to the latest “Arts in Schools Report,” published by the City’s DOE, over the last four years the City added 444 new full-time certified arts teachers.[35] In the 2017-18 fiscal year, the total school budget for the arts was $433 million, according to the report, including $402 million in personnel costs, $23 in arts services and other arts-related expenses and $8 million in arts supplies and equipment.[36]
The City Council’s Cultural After School Adventure, or CASA, program, provides grants to schools in each Council district to work with a cultural organization to provide arts and culture programming for students. The CASA program is funded at $18.6 million in FY 2019.
After-School and Senior Center Programming
In addition to funding provided through DCLA, the City’s Department for Youth and Community Development (DYCD) and the Department for the Aging (DFTA) fund a wide variety of arts, music and other cultural programs for children and seniors. In addition to the CASA program funded through DCLA, in FY 2018 the City Council allocated close to $2 million to fund more than 100 grants for after-school programs involving art, dance, theater, museums, or music.[37] More than half of the funding was allocated to the Sports and Arts in Schools Foundation, which offers a range of performing and visual arts after-school programs to underserved students, in addition to sports and academic classes. The Council also provided more than $3.3 million in FY 2019 to support arts programming for seniors through the SU-CASA program.
NYCxDesign
Initiated in 2013 by the New York City Council, NYCxDesign is an annual event held in May, modeled on Fashion Week, to highlight the City’s design industry. It is sponsored by the City’s Economic Development Corporation (EDC) with the collaboration of the other City agencies, the Council, and a steering committee consisting of members of the design industry. With an estimated attendance of 347,000 in 2018, including 99,000 visitors from outside the New York City area, the event highlights design in a broad range of disciplines, from digital and tech, to engineering, home furnishings, manufacturing, and others.[38]
Cultural Districts
During the fiscal crisis of the 1970s, the group of museums lining Fifth Avenue created a consortium called Museum Mile.[39] The group held its first annual festival in 1978 and has since attracted more than one million total visitors to its annual events.
Today there are a variety of models for arts and cultural districts in New York City. Some districts offer grants to artists and artistic organizations, while other arts districts work simply to promote their members. Some receive City funding, while others are entirely self-funded.
To date, the City’s largest initiative to create a cultural district involved a public-private partnership between the City, the State, and existing cultural institutions in downtown Brooklyn.[40] The long-term effort to create the Brooklyn Cultural District included a rezoning in 2004 and involved the NYCEDC, the Department of Cultural Affairs, the Department of Housing Preservation and Development, the Department of City Planning, and more than $100 million in public investment from the City for the creation of cultural and performing arts space and affordable housing.[41] The district’s formation was anchored by the Brooklyn Academy of Music (BAM), and cohesion among the dozens of disparate groups within the district is further facilitated by two nonprofit organizations – the Downtown Brooklyn Partnership, which also manages three local Business Improvement Districts, and the Downtown Brooklyn Arts Alliance, which advocates for the needs of the community.
Other examples of existing cultural districts in the city include the Kaufman Arts District, Fourth Arts Block, which leads the East 4th Street Cultural District, and the Little Haiti Cultural and Business District in Flatbush.
Space
In February 2017, the City announced a $136 million commitment to a ‘Made in New York’ Campus at Bush Terminal in the Sunset Park section of Brooklyn, to be used for both garment manufacturing and film and television production. The City pledged that the investment would “support” more than 1,500 permanent jobs. The subsequent RFP sought bidders to “develop and operate a best-in-class production facility campus for film and television production, video and photo shoots, sound-recording, and emerging media sectors such as AR/VR.”
Artist Workspace and Housing
The City also provides some assistance to help provide affordable living and work space to working artists.
AREA
As a step toward providing affordable living and work space for artists in New York City, Mayor de Blasio announced in 2015 a commitment to create 1,500 units of affordable housing and 500 units of artist workspaces over a decade under the Affordable Real Estate for Artists, or AREA, program. A Request for Expressions of Interest (RFEI) was issued in early 2018 and a first round of qualifying arts organizations was announced in 2019. The selection as a qualifying organization only means that EDC and DCLA “may discuss” future development projects incorporating affordable artist workspace on City-owned sites with those organizations. To date, no projects have begun under the AREA initiative.
Zoning and Development
Working artists who are certified as such may qualify for joint live/work space in select zoning districts in the SoHo and NoHo neighborhoods. Certification permits fine artists working on a professional level who demonstrate a need for a live/work loft space to reside in specific lofts zoned for manufacturing.
The City is redeveloping the former Spofford juvenile detention center in the Bronx into a live/work campus, anticipated to include 15,000 square feet of artist workspace.
Recommendations for Strengthening and Sustaining the Creative Sector
Art and culture, creativity and innovation permeate city life: from its world-class cultural institutions, to its leading role in fashion, advertising, and publishing, to its numerous tech start-ups – New York City is synonymous with creativity.
Yet the City cannot take for granted its historic role as a beacon for artists and other creative workers to be inspired and collaborate with the best in their fields. Along with other workers and businesses, artists and creative institutions struggle with rising rents and the changing nature of work in the 21st century economy.
For the creative sector to survive in a city that is increasingly inaccessible to artists and creative ventures, City government must recognize and embrace that the creative sector and its workforce are central to New York – both of its economy and of its “brand.” The sector brings life and character to local neighborhoods, offers employment to tens of thousands of New Yorkers, attracts visitors from around the globe, and stimulates economic activity in many other supporting industries.
The following recommendations lay out a vision to retain and strengthen the City’s creative workers and industries, and fortify New York City’s place in the world as the preeminent creative capital.
Support and Promote the Creative Economy
As a major and defining economic sector, the City needs to treat the creative sector and its industries as assets to be valued, promoted, and cultivated. The City should take a more cohesive, comprehensive, and pro-active approach to promoting its creative sector through the following measures:
1. Strengthen the City’s role
The City should establish an office and interagency task force under the Deputy Mayor for Economic Development with the role of supporting and promoting the creative sector.
Current city policymaking with respect to the creative sector is fragmented and limited in scope. Different city agencies interact with different parts of the sector, but no agency or office has a larger strategic vision for or role in the sector, and there is no institutional cheerleader/promoter. As a result, the City’s policy attention is not commensurate with the importance and impact of the sector, both as an economic engine, and as a resource for New Yorkers – from cultural enrichment, to career pathways.
The City, through a deputy mayor-level office, should be seeking to promote the sector, motivate tourism and its associated employment, and to facilitate and aid education and training to ensure the existence of a qualified workforce to meet industry demands. Individual agencies should be tasked with developing – and funded and staffed to implement – broader visions as promoters and cheerleaders for their sectors: DCLA should become not just a grants administrator, but a cheerleader and promoter of the city’s cultural organizations. MoME should become not just a permitting agency, but a cheerleader and promoter of the film and television industry (and potentially other sectors as well). NYC & Company should do more to promote the City’s cultural offerings across all five boroughs (see Cultural Districts, below). Finally, EDC should establish a Creative Sector desk that would work with industries in the sector to identify their needs and challenges and take the lead in crafting multi-agency responses to help ensure the future strength of the sector.
As an important first step, the City should undertake a comprehensive assessment of the sector’s varying needs and the challenges faced by creative workers, and produce a strategic plan for the creative sector. The City of London has recently recognized the central role of its creative sector through the creation of a Cultural Infrastructure Plan.[42] The plan recognizes the challenges of affordability that confront the creative sector in London as much as they do in New York City, and proposes four strategies to help address them. Perhaps the London Plan’s greatest significance is to recognize the important contribution of the creative sector, both as an economic engine and as central to the vibrancy of London, and to begin to treat the sector holistically. New York City should undertake a similar assessment and planning exercise to develop a unified and cohesive approach to this all-important sector.
2. Create and promote cultural districts
One night each year, the city shuts down traffic along Fifth Avenue from 82nd Street to 105th Street for the Museum Mile Festival, and the museums open their doors for free to all. This partnership and campaign has increased the visibility of the participating museums and created a world renowned cultural destination. This model of collaboration should be replicated across the city; doing so would help visitors and residents alike discover new cultural resources; promote tourism and development; and strengthen local communities.
Other cultural consortiums already exist across the boroughs with varying levels of funding, City support, and activity, including the Brooklyn Cultural District, Kaufman Arts District, Fourth Arts Block (Lower East Side), and the Little Haiti Cultural and Business District in Flatbush. In September 2018, the Downtown Brooklyn Partnership launched the inaugural Downtown Brooklyn Arts Festival, which included performances, tours, and free outdoor programming from diverse institutions within Brooklyn’s Cultural District.[43]
According to the University of Pennsylvania’s study of New York City’s cultural assets, additional cultural clusters exist in Flushing, Jackson Heights, Long Island City, and Elmhurst in Queens; Harlem, Washington Heights, and Inwood in Manhattan; the South Bronx; St. George, Staten Island; and Flatbush, Bushwick, Bedford-Stuyvesant, Crown Heights, and Sunset Park in Brooklyn.[44]
New cultural districts could exist in different forms across the city, depending on the needs and desires of local institutions. But one common component should be new signage and wayfinding tools to help visitors – and residents – navigate neighborhoods and unify disparate institutions into a single marketing brand. As local community groups have noted, outside of Manhattan’s grid, city streets can be intimidating and confusing, creating a barrier to accessing the diverse array of city cultural assets.[45] One initiative to facilitate navigating new neighborhoods was the launch of the free LIC Art Bus in 2014.[46] The bus is supported by a philanthropic contribution and makes stops on Saturdays and Sundays in the Spring through Fall at Socrates Sculpture Park, The Noguchi Museum, SculptureCenter and MOMA PS1.
Cultural districts should also be featured and promoted by NYC & Company, the City’s official marketing organization and convention and visitors bureau.
The New York State Legislature has proposed legislation to create state-designated arts and cultural districts, under guidelines established by the State Council of the Arts.[47] A designated district would be eligible for development opportunities, technical assistance in applying for grants, and marketing guidance, provided by the Council and Empire State Development. According to the National Assembly of State Arts Agencies, at least 15 states have a formalized role in the establishment of cultural districts.[48] Most of these states offer technical assistance, but a few also offer tax incentives and exemptions such as sales tax exemptions for goods produced or sold within the district and income tax credits for artists living or working in the district.
Jersey City offers another model. In 2016, Jersey City’s Council approved changes to Journal Square that aims to create an official Art District. The plan aimed to create “cultural amenities” by offering bonuses to potential developers in local buildings if they include spaces for theaters, art galleries, art and dance studios, museums, libraries, rehearsal studios, cafes, or general retail along the corridor. The new zoning also established bonuses for contributions to a public arts fund.
3. Improve the process for providing capital funds to cultural organizations
The process by which the City funds capital projects to non-profit cultural organizations – whether equipment purchases, facility upgrades and renovations, or completely new theaters or other buildings – is slow, rife with bureaucratic hurdles, and financially burdensome, particularly for smaller organizations. The City should conduct a thorough business process review to determine where there are possible redundancies and inefficiencies, where the most significant bottlenecks are, and how the process can be streamlined while protecting the public interest in the use of taxpayer capital funds. In recognition of the financial burden faced by organizations that have to pay out funds and then wait for the City to reimburse them, a bridge loan program, similar to that run by the Mayor’s Office of Contract Services and the Fund for the City of New York, should be studied, that could provide short-term operating cash loans to help smaller organizations that may have difficulty accessing or affording commercial lines of credit.
4. Establish Creative Economy Zones
In November 2014, the New York City Council released a report called “Engines of Opportunity,” which proposed changes to zoning laws including the establishment of “creative economy districts.”[49] These new districts would permit greater commercial density and the development of loft-style buildings in the city’s existing industrial zones. The concept would promote a mix of high-tech manufacturing, creative employment, and office space while limiting allowable space for competing uses such as hotels and storage. For example, the American Can Factory, a 13,000 square foot former manufacturing facility in Gowanus, was converted to provide space for small businesses in design, the arts, publishing, architecture, printing, music equipment, and sound recording, among other uses.
5. Foster creative incubators
The City should expand the role of business incubators to ensure that the creative sector continues to grow and does so dynamically within the new technology-driven economy. Incubators provide shared space and equipment for early-career creative professionals and start-up firms that otherwise would not be able to afford such costs. Shared work spaces also facilitate collaboration and mentorship. Examples/models include: EDC’s fashion incubator partnership with the Council of Fashion Designers (CFDA)[50], EDC’s partnership with Chashama to provide artist studios at the Brooklyn Army Terminal in Sunset Park,[51] EDC’s Made in NY Media Center,[52] New Inc at the New Museum,[53] Parsons’ Centre for Social Innovation Incubator,[54] Pratt’s Brooklyn Fashion and Design Accelerator,[55] CUNY’s NYDesigns lab at LaGuardia Community College,[56] Staten Island MakerSpace[57], and the Broadway Tech Accelerator.[58]
6. Utilize existing public space.
According to the 2016-17 Annual Arts in School Survey, the City’s public schools have 502 dance studios, 1,171 music rooms, 559 theaters, 1,348 visual arts rooms, and 734 media arts rooms.[59] One of the city’s most famous performing arts public schools – the Frank Sinatra School of the Arts – already has a partnership with DanceWorks, a performance-based dance organization for advanced and technically trained young adults.[60] The Frank Sinatra School of the Arts hosts evening rehearsals for DanceWorks and its semi-annual performance show.
The Center for an Urban Future (CUF) has previously proposed utilizing space in the City’s public schools after school hours for creative workers.[61] Such an initiative would require collaboration between the Department of Education (DOE), local nonprofits, principals, and school facilities. The DOE could charge a reasonable rental fee to cover the cost of insurance, security, custodial services, and utilities, subsidized as needed by the Department of Cultural Affairs in order to provide space at an affordable cost to artists and arts organizations while holding school budgets harmless.
Deepen Connections to Local Communities
Enhancing diversity in the creative sector requires starting early to provide opportunity for students and youth.[62] While maintaining the ability to attract both audiences and workers from all corners of the globe, the City must also redouble its effort to connect institutions to local residents and expand opportunities for all New Yorkers – from toddlers to seasoned professionals – to engage in creative endeavors and make careers in the creative sector. Creation of Cultural Districts (recommendation #2, above) would help highlight the cultural resources available in communities, and provide an impetus to local economic development. In addition, the City should take the following steps.
7. Increase arts/creative education in schools.
Despite a recent increase in arts funding for schools, arts programming remains unequal across the city. While New York City boasts a long list of world-class schools for the arts, such as Fiorello H. LaGuardia High School of Music & Art, the Frank Sinatra School of the Arts High School, Ballet Tech, and the Celia Cruz Bronx High School of Music, other public schools fail to meet even the basic state education requirements for art instruction.[63] New York State Education law mandates that all students in grades 7-12 are taught by a certified arts teacher, yet in the 2017-18 school year, 16 percent of schools that teach those grades lacked even one full-time certified arts teacher, including dance, music, theater or visual arts instructors.[64] Fully 10 percent of these schools lacked either a full-time or a part-time arts teacher.
In the 2017-18 school year, at least 430 cultural organizations partnered with New York City public schools.[65] Arts organizations like Lincoln Center, Alvin Ailey, and the Roundabout Theater, as well as educational nonprofits like Marquis Studios and the Studio in a School Association, among many others, devote thousands of hours to arts education for public school students each year. The Broadway League instituted Broadway Bridges with the Department of Education, a program to ensure that every New York City high-school student attends a show before graduation.
The City should ensure that every New York City school has access to a full-time arts educator, and work with local arts organizations as resources for public school arts education.
8. Promote creative sector careers
Numerous programs, sponsored by trade organizations like the Broadway League, or through individual institutions, either independently or in partnership with government, provide internships, fellowships, and residencies to help further careers in the creative sector. Through a partnership between MOME and the Independent Filmmaker Project (IFP), for example, ten New York filmmakers are offered a 12-month Made in NY Fellowship that provides incubator space, mentorship, and access to networking events and other resources. Now in its third year, the Made in NY Fellowship program aims to foster a more diverse media industry. The Broadway League sponsors 4- to 7-month paid internships for people of color in member offices.
The City could promote internships and similar opportunities in other creative industries as well. And although many internships are paid, the City could provide financial assistance to ensure that such opportunities are open to all. Even more valuably, the City should encourage creative industry apprenticeship opportunities, working with the private sector to design and finance apprenticeships that would lead to permanent job opportunities.
9. Bolster support for arts programming for at-risk and underserved youth
Arts programming can offer a safe space to learn new skills, express emotion, and take creative risks – all while creating the precursors for future occupations. In recognition of the power of the arts to heal and empower, the City funds a number of programs targeted to at-risk youth, including those involved in the criminal justice system. Through the Neighborhood Opportunity Network (NeON) Arts program, the Department of Probation (DOP) offers free, high-quality arts workshops in seven communities with high rates of incarceration.[66] Offerings include visual arts, film, spoken and written poetry, music, and dance. An evaluation of the initiative, which is targeted to youth and young adults under DOP supervision but available to all local residents, found that participation improved the relationship between DOP staff and clients, reduced the stigma associated with probation, improved peer relationships, offered opportunities otherwise not accessible, unearthed undiscovered talent, and inspired hope and confidence.[67] A partnership with the Carnegie Hall Weill Music Institute facilitates the selection of grantees, recruitment of participants, and project implementation. In addition to the Arts program, the NeON initiative also offers free workshops and classes in poetry, photography, and 3D animation.
An innovative program in Brooklyn offers an arts-based diversion program to court-involved youth. Young New Yorkers (YNY) partners with multiple agencies within the criminal justice system and offers programs ranging from one day to eight weeks.[68] These diversion programs allow youth to avoid jail time and a criminal record. Teaching artists use photography, video, illustration and design to explore themes such as community, responsibility, accountability, and leadership. According to the Executive Director of YNY, the initiative has allowed more than 900 young people to make art rather than face jail or other court-imposed sanctions.[69]
These and similar programs should forge explicit linkages with education and training programs to forge a professional pathway for those participants who wish to pursue careers in the creative sector.
Support the Creative Workforce
As noted in Section I, an extraordinary 36 percent of creative workers are self-employed, and many more creative workers may be occasionally freelancing in addition to having a full-time job. Freelance work offers creative workers flexibility but it leaves them without the benefits and safety net provided by regular employment, including health and retirement benefits, and unemployment insurance and worker’s compensation, as well as exposing them to abusive practices, such as withheld or delayed payment of earnings. A recent survey of freelancers in New York City found that 78 percent of freelancers in media and entertainment have experienced late or nonpayment.[70] The City has taken some actions to address the specific needs of freelancers, including passage of the “Freelance Isn’t Free Act” and the creation of a Freelancers Hub at the City’s Made in NY Media Center in Brooklyn, which will provide free workshops, networking space, labor consultants, and free legal assistance clinics.[71]
The City should build upon these efforts by supporting state legislation to combat wage theft; give independent workers access to unemployment insurance and workers compensation programs; support access to quality, affordable health insurance; and provide financial management assistance to freelance creative workers.
10. Support state legislation to combat wage theft
New York City has taken action to protect freelance workers, enacting the “Freelance Isn’t Free Act”, which guarantees freelancers the right to a written contract, timely and full payment, and protection from retaliation.[72] In the Act’s first year, workers in the arts and entertainment sectors made up 72 percent of complaints to the City’s Department of Consumer Affairs.[73] The most common occupation for a complainant was photographer, followed by film and video editors.[74] In the first two years since the Act’s passage, the City has helped recover roughly $1 million in wages for freelancers.[75] Artists have reported receiving prompt payment they are owed by simply suggesting to their debtors that they may file a complaint.
It is time for New York State to follow suit and modernize its labor laws to reflect the growing number of freelancers and independent contractors in the creative and other sectors of the economy. Since at least 2010, bills have been introduced in the State Assembly and Senate to broaden the State Department of Labor’s oversight and enforcement authority to ensure that independent contractors benefit from the same compensation protections as traditional employees.[76]
11. Support access to quality, affordable benefits
Independent and self-employed workers in the creative sector need access to affordable, quality health insurance and retirement benefits. A City or State-sponsored benefits fund could provide multiple services to self-employed creative sector workers, including retirement savings, health insurance, tax-advantaged savings accounts, etc., through a single portal allowing them to choose, pay for, and manage their benefits.
To help workers pay for benefits, the State should allow businesses hiring such workers to pay the equivalent of withholding into the benefit fund, to help cover Social Security and Medicare taxes and additional, privately-provided benefits.
Other cities, states and countries that have found innovative ways to ensure that creative workers receive health care. In Germany, for example, self-employed artists have a unique social insurance system, which provides them with a 50 percent reduction in the cost of health insurance.[77] In Canada, a nonprofit organization offers personal health insurance exclusively for members of the artistic community, with cheap rates and guaranteed acceptance, beyond what provincial government provides to all residents.[78] Arts organizations from across the country are participating members of the organization, providing a steady source of funding. In the U.S., groups such as the Actors Fund and the Freelancers Union actively help artists and other creative workers navigate health insurance options.
12. Enhance the economic security of creative sector freelancers
As in most states, in New York State a worker must be classified as an “employee” to be eligible for unemployment insurance and workers compensation benefits.[79] Employers pay into the State unemployment insurance and workers compensation funds to finance benefits, but independent and freelance workers are excluded by their status.
Recategorizing independent workers at the state level as employees of an independent benefit entity, such as the one described in the previous recommendation, could allow the direct delivery of protections without violating existing IRS classification laws.
13. Create new affordable housing and work spaces
In the 1960s, with support from the National Endowment for the Arts and the J.M. Kaplan Foundation, local community activists in the city spearheaded one of the nation’s most innovative adaptions of industrial space into 384 live-work spaces for artists, known as Westbeth.[80] Today, the 13-building housing complex on Manhattan’s far west side, at the corner of West and Bethune Streets, is home to a range of individual, communal, and commercial spaces, including a professional dance school, the New School for Drama, a gallery, and recording studios. Demand for housing at Westbeth remains high with a seven to 10-year waitlist for new applicants.[81] Other successful affordable housing projects in the city include Manhattan Plaza (“Broadway’s Bedroom”), The Schermerhorn in downtown Brooklyn, and the rehabilitation of an abandoned school into Artspace P.S. 109 in East Harlem.[82] When P.S. 109 opened for applications in 2014, roughly 53,000 artists applied for 89 live/work apartments.[83]
In 2015, Mayor de Blasio committed to creating 1,500 affordable live/work spaces for artists over ten years.[84] More recently, the City committed to creating 35 live/work units for artists in Long Island City under the Affordable Real Estate for Artists (AREA) program.[85] But given the obvious need, a much more ambitious effort is needed, however, in order to protect the vitality of New York City as a cultural and artistic center in the face of a rising affordability crisis.
Appendix Industry Profiles
Advertising
SOURCE: Office of the Comptroller based on Quarterly Census of Employment and Wages and U.S. Census Bureau, American Community Survey.
NOTE: See Appendix for methodology and list of industry codes.
Even before the 20th century, New York City was known as the advertising capital of the world. By 1900, the city had 25 advertising agencies, and in 1911 the Advertising Club of New York supported a “truth in advertising” bill in the state legislature. It passed and was imitated by similar legislation in 36 other states. The very words “Madison Avenue” began in the 1920s to symbolize the burgeoning advertising industry that the popularity of radio helped further. The dawn of the television era inspired a more sophisticated culture made famous by Mad Men, and by the 1960s advertising was being recognized for its creative aspects. This “creative revolution” included the use of artistic techniques borrowed from photography and film, language filled with humor and irony, and graphics that highlighted more color, larger images and less and smaller type. The common understanding that advertising can be an outlet for creative expression and original, even bold ideas has its genesis in 1960s New York City. The industry’s origins in New York are reflected by the City’s growing dominance: today, the sector employs more than one in five of all advertising employees nationwide.
Many major advertising firms operate in the city, from DDB to Interpublic Group to Omnicom. Some companies, like JWT, have been around in the city for well over 100 years. Others, like McGarryBowen, are products of the 21st century, even while they have attained huge proportions. The top two publications covering the advertising industry, Ad Age and AdWeek, are based in New York City.
Technological developments have forced advertising companies to evolve. The industry has increasingly moved toward digital and web-based advertisements, and today’s advertising landscape is dominated by online advertising.[86] The rise of digital has proved challenging for traditional advertising companies, which have had to focus more on information gleaned from “clicks” – perhaps to the detriment of the creative side of the house. The increasing demand from advertisers for speed and efficiency, and reluctance to pay the fees for advertising services, has put pressure on the business. Investigations into bid-rigging in 2016 and illegal media-buying practices in 2018 have only added to the industry’s challenges.[87] “There’s little doubt that traditional agencies,” writes Business Insider, “are under fire from several fronts.[88]”
Despite these challenges, advertising has been one of the fastest-growing sectors of New York City’s creative economy over the last decade. Advertising agency employment has increased 27 percent in total, and has become increasingly concentrated in New York City, which boasts 22 percent of advertising agency jobs in the U.S. in 2017. The sector generated $6.4 billion in wages in 2017, with an average salary of $137,200 for those employed in firms, nearly 37 percent higher than the U.S. average in the industry, and up 17 percent from 2008. An estimated 3,000 persons, or about 6 percent of total sector employment, considered themselves as self-employed in the advertising industry in 2017, and earned on average about $107,300.
Applied Design
SOURCE: Office of the Comptroller based on Quarterly Census of Employment and Wages and U.S. Census Bureau, American Community Survey.
NOTE: See Appendix for methodology and list of industry codes.
The Applied Design sector is composed of specialized design firms, including interior design, industrial design, and graphic design, and photographic services firms, including both portrait and commercial photography studios.
While many firms in this sector are small and a large share (45.4 percent) of workers in the sector are self-employed, the city is also home to large, multi-national design firms with offices and projects all over the globe. These firms often work with other sectors, such as architecture, advertising, retail, real estate, fashion, film, and manufacturing, to improve the aesthetics and functionality of public and private spaces and advance innovations in consumer and corporate products from medical devices to automobiles. The city’s design firms are supported by a pipeline of graduates from some of the nation’s best design schools, such as Parsons The New School for Design, the Pratt Institute, the School of Visual Arts, Cooper Union, and New York University Tisch School of the Arts.[89]
In 2017, the city was home to 2,959 specialized design firms, roughly the same as in 2008. Private employment increased by 5 percent to 13,338 whereas self-employment increased by 6.8 percent to 11,084. Approximately 7.5 percent of nationwide employment in the applied design sector was in New York City in 2017. Average wages increased by 6.2 percent for firm-based employment to $78,500. Self-employed earnings increased at a higher rate – by 14.4 percent – resulting in similar wages for self-employed and private employment in 2017. Generally, firms in this sector are small with just over 5 employees per establishment. In 2017, an average employee in the sector made 38 percent more than his or her counterpart nationwide – a premium that was considerably reduced from 2008, when it stood at over 72 percent.
Architecture
SOURCE: Office of the Comptroller based on Quarterly Census of Employment and Wages and U.S. Census Bureau, American Community Survey.
NOTE: See Appendix for methodology and list of industry codes.
Home to one of the world’s most important real estate markets, many of the world’s pre-eminent architects and designers have practiced in New York City and the City is home to some of the most iconic buildings, interiors and parks that have revolutionized architectural and design history.
Future architects and designers come to the City to admire and be inspired by these works, and to learn the necessary skills to continue this exceptional legacy. New York City academic institutions offer some of the most competitive and recognized undergraduate and graduate programs for those seeking a career in architecture and design. Chief among these institutions are the Pratt Institute in Brooklyn, and The Cooper Union and Columbia University in Manhattan. Faculty members of these institutions include world renowned experts in their respective fields. The prestige of these institutions also helps to draw top visiting scholars from around the globe.
Although the average firm size is 11 employees, firms range in size from giants such as Gensler (1,785 architects worldwide and 291 in New York), AECOM, (1,650 architects worldwide and 63 in New York) and HOK (1,355 architects worldwide; 229 in New York) to one-person practices. The top 25 firms employed nearly 2,200 architects in the New York area in 2017, and collectively had 4,461 projects totaling over 42 million square feet underway in the area.[90]
Architectural services employment grew by 3 percent between 2008 and 2017. A little less than 9 percent of nationwide jobs in this industry were located in New York City in 2017. The sector generated approximately $1.9 billion in wages in 2017, with an average salary of $97,265 for those employed in firms, 14 percent higher than the U.S. average in the industry. Approximately 2,500 persons, or about 13 percent of total sector employment, were self-employed in the architectural services industry in 2017, and earned on average about $123,000 – a flat number compared to 2008.
Art Dealers
SOURCE: Office of the Comptroller based on Quarterly Census of Employment and Wages and U.S. Census Bureau, American Community Survey.
NOTE: See Appendix for methodology and list of industry codes.
New York City has long been one of the most important U.S. hubs for artists to create, market and sell their work. The art market, including galleries, dealers, and auction houses, attracts a global audience of investors, collectors, and curators and accounts for some 3,800 jobs in the City.
According to Galleries of New York, there are over 1,350 commercial, non-profit and artist-run galleries, auction houses, fine art institutions and alternative art spaces operating in New York City.[91] Close to half of these are concentrated in three Manhattan neighborhoods – West Chelsea, the Lower East Side, and the Upper East Side – and over 20 percent are located in Brooklyn. About 150 of these galleries are members of the Art Dealers Association of America.[92]
The City’s large and diverse art market is punctuated by a busy schedule of art fairs, auctions, and exhibitions that attract investors, collectors, and curators from all over the world. In 2017 the City hosted 16 major international art fairs, including The Armory Show, the Affordable Art Fair, Frieze, the Outsider Art Fair, the Independent Art Fair, VOLTA, 1-54 Contemporary African Art Fair, New Art Dealers Alliance (NADA), and TEFAF.[93] The Armory Show alone attracted 65,000 visitors in 2017, while Frieze had 40,000 attendees. Underscoring the international appeal of the city’s art scene, an analysis of Visa credit card transaction data found that international visitors to New York City accounted for 29 percent of sales at art galleries in 2016.[94]
In 2017, roughly $28.5 billion in art sold at public auction worldwide with just over a third of these sales taking place in the United States.[95] Five firms accounted for over 60 percent of global sales at public auction: Christie’s, Sotheby’s, Poly Auction, China Guardian and Heritage Auctions. Of these, Christie’s and Sotheby’s have the largest presence in New York, accounting for roughly a third of their global employees and three-quarters or more of U.S.-based employment. Christies’ Spring 2018 New York City auction brought in $1.79 billion in sales to buyers from 52 countries.[96]
| NYC share – World | NYC share – U.S. | |
| Sotheby’s | 35.4% | 73.6% |
| Christie’s | 31.9% | 85.4% |
SOURCE: NYC Comptroller’s Office from LinkedIn data
At the national level, art galleries and auction houses never recovered from the great recession. Payroll data show there were 6,818 private art galleries in the U.S. in 2006, employing over 23,000 workers, but these numbers declined steadily over the subsequent decade. By 2016, there were only 5,077 U.S. art galleries employing just under 17,000 workers. New York City fared much better. Although the number of galleries peaked in at 644 in 2008, and declined to under 600 in 2012, by 2017 the number recovered to 640 New York City galleries, over 90 percent of which are in Manhattan. Overall the industry paid out nearly $500 million in salaries in 2017.
Employment in auction houses, galleries and art dealerships has grown by 7.7 percent since 2008, to just over 3,000 in 2017. The average wage in the sector has risen by 17.3 percent, to $133,000 – well more than double the average wage nationally. The number of self-employed art dealers stayed constant at around 800, or about 22 percent of total art dealer employment.
As a result of national declines and local resilience in the number of art galleries, New York City’s importance has risen steadily. In 2017, New York City had nearly 18 percent of U.S. private art gallery employment, up from 13 percent in 2008.
Wages are also much higher in New York City. Nationwide, the average private art gallery employee earned about $55,000 in 2017, compared to an average of over $133,000 in New York City. Because wages are so much higher, New York City accounts for 42 percent of total U.S. wages earned at private art galleries, up from 35 percent in 2008. Earnings among self-employed art dealers, however, have fallen substantially, to just over $111,000 from nearly $179,000 in 2008.
Fashion
Introduction
New York City is a modern stronghold of fashion design, ascending to its position as a global leader in high fashion at the turn of the 1950’s following a major disruption of the Paris fashion industry during World War II. Chaos in Paris gave ascendance to the City’s nascent apparel industry cluster in Manhattan’s Garment District, which benefited from a close proximity to the City’s thriving wholesale, design, retail and advertising sectors and all of its associated talent.[97] The national fashion design industry trade group, the Council of Fashion Designers of America (CFDA), is headquartered in New York.
Despite the severe decline of garment manufacturing in New York, the City’s fashion industry is anchored by a considerable infrastructure of prominent fashion houses, widely read fashion publications, highly regarded fashion schools and an active calendar of important fashion shows and events that reverberate worldwide. New York Fashion Week (NYFW), which involves a series of fashion shows and events, is a prime example of the latter. Originally started in 1943, NYFW now occurs twice each year in February and September. The New York City Economic Development Corporation estimates that New York Fashion week generates an economic impact of $887 million.[98]
New York City’s arts and design oriented learning institutions are also an important component of local fashion infrastructure, ensuring that the City has a reliable talent stream. Those interested in a career in fashion related fields can start at the City’s High School of Fashion Industries and graduate to one of the many well regarded fashion oriented post-secondary institutions in New York City. Chief among these institutions are the Pratt Institute in Brooklyn, Parsons School of Design, and the Fashion Institute of Technology (FIT) in Manhattan. Fashion Institute of Technology (FIT) is part of the State University of New York (SUNY) system and its coursework is focused on fashion business and design. According to an economic impact statement commissioned by FIT, some 93 percent of its graduates that enter the workforce find employment in New York and it is estimated that FIT contributed more than $280 million of spending to the local economy.[99]
The fashion industry in New York City is a combination of fashion design and a limited amount of production. The production of garments was once a major industry in its own right in the City, but most of that production has been moved, due to cost considerations, to lower wage areas such as East Asia. The production that still exists in the City is largely limited to the couture and high fashion pieces and the samples and patterns that are then executed abroad. By separating this industry into the design and production components we are able to see that what was once the engine of growth for this industry – the production of clothing – has virtually evaporated while the design component continues to exhibit strength. This shows that while the City is still a vibrant place where fashion trends are developed, the City’s “garment industry” has declined significantly.
Fashion Design
SOURCE: Office of the Comptroller based on Quarterly Census of Employment and Wages and U.S. Census Bureau, American Community Survey.
NOTE: See Appendix for methodology and list of industry codes.
While not a large sector in terms of employment, the City’s fashion design industry has experienced some growth in recent years.[100] The number of establishments increased by 20 to 570 in the last decade, and annual average employment in the City’s fashion design industry rose by over 5 percent over the same period, to approximately 3,200 jobs. More significantly, the number of self-employed workers increased by 70 percent to just over 2,500 in 2017. Self-employed fashion designers made up more than 44 percent of total employment in 2017. Nearly 1 in 5 employees in the sector nationwide was employed in New York City, indicating the City’s importance as a hub of fashion design. Wages are also higher than in the rest of the nation – by approximately 25 percent in 2017 – and the average wage in the fashion design industry increased by 21 percent from 2008 to 2017, to over $93,600. Self-employed average wages also went up by 14.3 percent to almost $74,000. New York City fashion design establishments paid approximately $300 million in wages in 2017 which corresponds to more than a quarter of total U.S. wages in the sector.
Fashion Production
SOURCE: Office of the Comptroller based on Quarterly Census of Employment and Wages and U.S. Census Bureau, American Community Survey.
NOTE: See Appendix for methodology and list of industry codes.
In contrast to the design side, the production of garments, once a leading NYC industry, has shrunk significantly from its peak in the 1960’s, with employment having declined by 95 percent. The decline has continued since the 2008-2009 recession: the number of establishments has fallen by over one-third from just over 1,800 to under 1,200, and the number of employees has declined nearly 43 percent from nearly 25,000 to 14,000. Average wages for those lucky enough to keep their jobs have risen by 16 percent (to $60,200) about in line with the growth of wages seen in the City as a whole. The share of New York City employment in the nationwide fashion production sector declined to 5.4 percent (from 6.4 percent in 2008) in 2017. Wages paid declined by 33.8 percent from $1.27 billion to $845 million, corresponding to 7.4 percent of wages paid nationwide. Average wages in New York City was 37.5 percent higher than the U.S. average in the fashion production industry in 2017, declining from a 46.1 percent premium in 2008.
The Garment Center
The Garment Center district – roughly bounded by Fifth and Ninth Avenues and 34th and 42nd Streets – is the historic center of the fashion and garment industry in New York.[101] In the mid-1980s, according to the City, “nearly 5,000 businesses in the apparel industry existed in the Garment Center, employing almost 61,000 people and occupying 20 million square feet of space related to manufacturing, showrooms, suppliers, service firms, and contractors. Manufacturing comprised 41 percent of total employment in this area.”[102] Nonetheless, increasingly concerned about the loss of manufacturing jobs to lower-cost overseas producers, in 1987 the City created a special zoning district, the Special Garment Center District, in an effort to protect the garment industry. The zoning “overlay” required that 50 percent of zoned manufacturing space be reserved for the garment industry.
Over time, however, the actual amount of space used by the garment industry declined to well below the 50 percent threshold, and property owners sought to relax or remove the overlay in order to allow for other uses. In 2018, the City announced a package of measures to both allow for other uses in the Garment District, while providing some support to the fashion production industry, including a tax incentive program to preserve manufacturing space in the district; $20 million in City funds for a public-private partnership to acquire a building dedicated to garment production; and a special permit to curb hotel development in the district.[103]
Fashion Manufacturing Initiative
The Fashion Manufacturing Initiative (FMI) is a program of the Council of Fashion Designers of America (CFDA) in partnership with City’s Economic Development Corporation. FMI was created to promote garment production in New York City and connect fashion designers to local manufacturing. The program includes production innovation grants for capital equipment and technology upgrades, workforce training, and relocation within the five boroughs; workforce training through the Apparel Skills Training Courses; and a local producer directory, as well as professional development sessions and collaborative industry events.[104] As part of the recent announcement concerning the Garment Center district (see above), the City also announced a $14 million expansion of FMI.
Film and Television
Introduction
The motion picture and television industry is the largest segment of the arts industry in New York City and is an important contributor to New York City’s economy, providing high quality jobs in the production of motion pictures, television shows, videos and commercials as well as in post-production activities. The broader category includes three industries: motion picture and video; television broadcasting; and cable and other subscription programming. The film and television sector employed nearly 77,000 workers in 2017, a nearly 37 percent increase since 2008, and paid out $9.2 billion in wages.
Motion Pictures and Video
SOURCE: Office of the Comptroller based on Quarterly Census of Employment and Wages and U.S. Census Bureau, American Community Survey.
NOTE: See Appendix for methodology and list of industry codes.
The motion picture and video subsector of the film and television industry is the largest, and the most dynamic. These firms are predominantly engaged in film production, including movies, television, and commercials. Firms in this subsector are small – on average, fewer than 18 employees in 2017 – but numerous, having increased by nearly 500 firms in the last decade.
New York City has a long history as a major center for the motion picture and television production, dating back to the earliest films in the early 20th century produced by Thomas Edison and viewed through a kinetoscope.[105] However, despite the City’s iconic landmarks, dynamic neighborhoods, and complementary industries, such as theater, journalism and advertising, the sector has risen and fallen over the past century.
By the early 1990s, the City had developed a reputation as a high-cost and difficult place to film, following economic troubles and a 7-month labor dispute between studios and several theatrical unions.[106]
The City’s troubles worsened in 1997 when the Canadian government and its provinces began offering rebates of up to 70 percent of production costs for foreign producers.[107] In 2002, Louisiana created a film tax credit program and other states followed suit.[108] In 2004, New York State adopted its own tax credit, which was temporarily accompanied by a smaller city tax credit. Today, New York City film productions benefit from one of the most generous state tax credit programs in the country, along with other forms of government support, as discussed in more detail below. New York State’s film tax credit has been extended several times and currently offers up to $420 million in annual credits.
The concerted efforts by the City and the State to lure the industry back have been largely successful. From 2008 to 2017, employment in the motion picture and video production industry grew by 64 percent in New York City, more than three times faster than overall national growth of about 19 percent. According to the New York State Department of Labor, the concentration of film jobs in Manhattan is more than 3.5 times the national average.[109] New York City private employment in the sector increased to 15.3 percent of total US employment in 2017 from 11.1 percent in 2008. Major studios, including Silver Cup, Steiner, Kaufman Astoria, Kaufman Astoria North, Broadway Stages, have also made significant capital investments in New York City since the tax credit’s inception.[110] A new 650,000 square-foot production studio, backed by the actor Robert De Niro, is slated to break ground in 2020.[111]
In the 2016-17 season, the city was home to 316 feature films, 56 episodic television series, and 17 pilots (including network, cable and digital), and many shows produced in New York City have received high critical and audience acclaim.[112] According to the Mayor’s Office of Media and Entertainment (MOME), shows and television specials produced in the City received 116 Emmy nominations in 2018, including award-winners The Americans, The Marvelous Mrs. Maisel, Saturday Night Live, and Last Week Tonight with John Oliver.[113]
Based on film permits for using city property, such as a sidewalk, street or park, the City hosted at least 8,222 shoots in 2017, an increase of 19 percent from 2012.[114] Permits for television shows have grown by 39 percent, increasing to 4,606 in 2017. In total, these permits translated into 6,822 days of shooting in 2017. The actual number of shoots is higher, as these figures exclude productions in studios, which do not require permits.
Both private employment and self-employment increased significantly in the motion picture and video subsector between 2008 and 2017. Private employment increased by 64 percent to 42,351, while the number of self-employed increased by 74.5 percent to 11,134. Despite the increase in number of jobs, average wages in private sector declined by 8.3 percent to $98,000 in 2017. Average wages in the rest of the country caught up over the last decade. As a result, average wages in New York City paid 6.8 percent more than national average in 2017 compared to 32.2 percent more in 2008. On the other hand, self-employed average wages increased by 10.3 percent to $93,000.
Television and Cable Broadcasting
SOURCE: Office of the Comptroller based on Quarterly Census of Employment and Wages and U.S. Census Bureau, American Community Survey.
NOTE: See Appendix for methodology and list of industry codes.
Television broadcasting and cable and other subscription broadcasting services account for the remainder of the film and television sector. Wages in both sectors are higher than in the more artisanal motion picture and video firms, even while employment has been stagnant (television) or declining (cable). The number of establishments in television broadcasting and cable and other subscription programming has declined in the ten-year period from 169 to 148. Total employment (including self-employed) declined by 2.7 percent to 23,000. Wages, on the other hand, increased rapidly from an average of $124,736 to $178,360 – a 43% increase. Self-employed wages, on the other hand, increased by 14.8 percent to $88,846 in 2017. Overall, the television and cable industry in New York City corresponds to only 4.4 percent of nationwide sector employment, but due to high wages (175.4 percent above the national average), total wages in New York City correspond to 20.8 percent of wages paid in the sector nationally.
Music Recording Studios
SOURCE: Office of the Comptroller based on Quarterly Census of Employment and Wages and U.S. Census Bureau, American Community Survey.
NOTE: See Appendix for methodology and list of industry codes.
The music recording industry – including music publishers, recording studios, record production and sound recording industries – have been hit hard by technological advances and changes in how artists produce and people consume music. The industry has changed dramatically as a result of the disruption caused by Internet-based streaming and digital recording technologies, as well as the declining costs of ‘do-it-yourself’ recording. As a result, employment in music recording studios – already in decline – is down by 5.6 percent since 2008. The number of self-employed workers declined by 12.7 percent in the same time period. The average wage in the sector has been flat at around $128,000; earnings for the self-employed increased by 22.4 percent to $65,600 in 2017. Overall, industry wages and earnings declined by 3.2 percent to $443 million in 2017. However, similar declines in employment and wages occurred nationally and New York City kept its share of employment and wages. In 2017, New York City had nearly 17.1 percent of U.S. private sound recording studios employment, up slightly from 16.5 percent in 2008.
Wages are also much higher in New York City. The average sector employee earned about 54 percent more in New York City compared to nationwide in 2017. New York City accounts for 26.4 percent of total U.S. wages earned at music recording studios – a rate that changed little since 2008.
According to a study commissioned by the Mayor’s Office of Media and Entertainment (MOME), New York City’s recording studios have fared better than other U.S. cities since 2001 with employment declining less than elsewhere.[115] MOME contends that demand for recording podcasts, TV voice-overs, and Broadway albums has helped to mitigate employment losses in the city.
In September 2017, the City announced a deal with Berklee College of Music to prevent the historic Avatar Studios from closing and open a new state-of-the-art recording studio under the name Power Station at BerkleeNYC.[116] The City committed $6 million to preserving the studio, which is the only remaining studio in the city able to accommodate a full orchestra or live Broadway cast album. The renovated facility will also offer free and tuition-based classes, performances and resources for musicians, as well as establish a New York City presence for the Boston-based school and its alumni who live and work in New York.
Museums and Libraries
SOURCE: Office of the Comptroller based on Quarterly Census of Employment and Wages and U.S. Census Bureau, American Community Survey.
NOTE: See Appendix for methodology and list of industry codes.
Museums, zoos, historical sites (collectively called museums for the purposes of this report) and libraries add to the cultural well-being of the City. They include a wide range of institutions – from large, internationally known organizations such as Museum of Modern Art, the Morgan Library, and the Wildlife Conservation Society’s Bronx Zoo, to smaller community-based organizations such as the Queens Historical Society or Wyckoff House in Brooklyn. These institutions give us insight into history, art, science, and the ethnic diversity for which New York City is renowned.
The industry as a whole added 29 establishments since 2008 – an 8.1 percent increase. These establishments employ more than 51 employees on average. Employment has grown by 21 percent since 2008, to more than 20,000 in 2017. The average wage in the sector has risen by 21.3 percent, to just over $57,400. With increased salaries and booming employment, total wages increased by 46.8 percent from $783 million in 2008 to $1.15 billion in 2017. New York City’s share of nationwide employment in the sector stayed the same in the last ten years. In 2017, New York City had 7.1 percent of U.S. employment in the sector and 10.7 percent of wages paid. The average wage in New York City was 50 percent higher than the U.S. average in 2017 in museums and libraries.
The museum sector, like many non-profits, has struggled with pay and benefit levels. Several New York City museums have recently seen staff vote to unionize in the face of uncertain hours, limited access to benefits, and low wages.[117]
Performing Arts
Introduction
New York’s cultural pre-eminence is in no small measure the product of its world-class performing arts institutions, including theater, opera, dance, and music. From Broadway to Lincoln Center, which hosts the New York Philharmonic, Metropolitan Opera, and New York City Ballet, the performing arts draw millions of visitors to New York City every year. But hundreds of smaller performing arts organizations also draw visitors and provide cultural vibrancy to local communities.
More than 1,000 theaters, dance companies, musical groups, and performing arts venues (a flat number since 2008) in New York City provide employment to over 16,000 individuals – a 7.4 percent increase since 2008. Total wages increased by nearly 25 percent to over $1 billion in 2017. Average wages grew 16 percent from just under $60,000 in 2008 to above $66,000 in 2017.
Theaters
SOURCE: Office of the Comptroller based on Quarterly Census of Employment and Wages and U.S. Census Bureau, American Community Survey.
NOTE: See Appendix for methodology and list of industry codes.
Theater establishments in the city are divided into three different tiers: Broadway; Off Broadway; and Off Off Broadway, depending on their seating capacity. According to the Broadway League, “Broadway” consists of 41 theater houses in Manhattan’s Theater District and at Lincoln Center with capacities of at least 500 seats.[118] The official “Broadway” designation for these 41 theaters also renders their productions eligible for the Tony Awards.[119] Nonprofit Broadway theater operators – the Roundabout Theatre, Lincoln Center Theater, and the Manhattan Theatre Club – have become increasingly important in recent years, controlling six out of the 41 Broadway houses, and presenting seven out of 21 new plays in the 2018-2019 season.[120]
Broadway attendance has climbed steadily since a post-recession slump in the 2012-13 season, and in the last full season (2018-19) had its highest attendance numbers – exceeding that of the ten New York and New Jersey professional sports teams combined – and biggest gross in history.
| Season | Gross Revenues (millions) | Attendance (millions) | Playing Weeks |
| 2018-19 | $1,829 | 14.77 | 1,737 |
| 2017-18 | $1,697 | 13.79 | 1,624 |
| 2016-17 | $1,449 | 13.27 | 1,580 |
| 2015-16 | $1,373 | 13.32 | 1,648 |
| 2014-15 | $1,365 | 13.10 | 1,626 |
| 2013-14 | $1,269 | 12.21 | 1,496 |
| 2012-13 | $1,139 | 11.57 | 1,430 |
| 2011-12 | $1,139 | 12.33 | 1,522 |
| 2010-11 | $1,081 | 12.53 | 1,588 |
| 2009-10 | $1,020 | 11.89 | 1,464 |
SOURCE: Broadway League (https://www.broadwayleague.com/research/statistics-broadway-nyc/).
NOTE: Playing weeks represent the total weeks of performances by Broadway productions.
As one of the most popular tourist attractions in New York City, Broadway is a major revenue generator and job creator as “Broadway tourists” stay at city hotels, shop at city stores, and dine at restaurants throughout the City. In the 2017-18 season, nearly 63 percent of Broadway attendees were tourists, including 15 percent from outside the U.S.[121]
Off-Broadway theaters are an important subcomponent of this industry. Off-Broadway theatres are generally defined to be Manhattan theaters with a seating capacity of between 100 and 499 seats. As of December 2018, the Internet Off-Broadway Database – a comprehensive database of Off-Broadway productions, companies, theaters and awards funded by the Lucille Lortel Foundation – listed 32 Off-Broadway production companies, including large nonprofit producers like the Roundabout Theatre, Lincoln Center Theater, the Manhattan Theatre Club, Second Stage Theatre, and the Public Theater.[122]
More affordable and eclectic shows are available in the city’s Off-Off-Broadway theatres, which generally seat fewer than 100 patrons and are spread throughout the five boroughs. This segment of the theater is far broader and thus more difficult to quantify. The New York Innovative Theatre Foundation, which hosts an annual Off-Off-Broadway awards show, estimates that roughly 500 Off-Off-Broadway theaters produce about 2,000 productions each year.[123] Such offerings can range from experimental, interactive performances to children’s magic shows to original plays from new writers and producers.
The number of establishments in this sector increased by 10.6 percent between 2008 and 2017 and reached 595. These establishments employ 18.5 employees on average – a rate that stayed constant in the same time frame. Private employment has grown by 9.9 percent since 2008, to more than 11,000 in 2017 whereas the number of self-employed workers increased by 76.4 percent to just under 1,400. Total wages grew by 33% to $806 million. The average firm-based wage in the sector has risen by 17.8 percent, to $65,800, but self-employed wages declined by 2.1 percent on average to under $59,400. New York City’s share of nationwide employment in the sector stayed relatively stable in the last ten years at around 16 percent. The average wage in the theater sector in New York City was 80.2 percent higher than the U.S. average in 2017.
Music, Dance and Other Performing Arts
SOURCE: Office of the Comptroller based on Quarterly Census of Employment and Wages and U.S. Census Bureau, American Community Survey.
NOTE: See Appendix for methodology and list of industry codes.
From jazz to punk rock and hip-hop, New York City is, and has been, the home to musicians, dancers and music venues that have shaped and defined their genres. The strength and vitality of the city’s music scene derives from a network of large and small venues, and casual and formal assembles, spanning all genres and cultures. Visitors are drawn to the city’s marquee venues, such as the New York City Ballet, Jazz at Lincoln Center, The New York Philharmonic, the Metropolitan Opera, and Carnegie Hall, while smaller, local performance venues, including nightclubs and music halls, provide more accessible spaces for artists to earn a wage, entertain, and experiment. The city is home to the New York Dance & Performance Awards, better known as the Bessies.
The number of establishments in this sector decreased by 10.9 percent between 2008 and 2017 to 472. Despite the decline, private employment grew by 2.2 percent since 2008 to more than 5,000 in 2017, while the number of self-employed increased by 11.8 percent to 428. The average wage in the sector has risen by 13.3 percent, to $66,885 but self-employed wages declined by 30.7 percent on average to $44,439. New York City share of nationwide employment in the sector stayed relatively stable in the last ten years at around 9 percent. Average wage in New York City was 1.4 percent higher than the U.S. average in 2017.
A team of researchers from Harvard and the University of Pennsylvania surveyed 495 live music venues in 2017 and found that, while Manhattan dominates the city’s live music scene in terms of the number of venues, the most “experimental” spaces are in Brooklyn and the Bronx. These venues are less mainstream and commercial, and more at risk.[124] According to a study conducted for the Mayor’s Office of Media and Entertainment, 23 percent of small venues, with capacity under 500, have closed in the last 15 years, including storied venues such as CBGB and the Wetlands Preserve.[125] In March 2018, New York City appointed its first Nightlife Mayor, in part to act as a liaison for smaller music venues that have been struggling to afford rising rents and contend with noise and other quality-of-life complaints from neighbors.[126]
Publishing
SOURCE: Office of the Comptroller based on Quarterly Census of Employment and Wages and U.S. Census Bureau, American Community Survey.
NOTE: See Appendix for methodology and list of industry codes.
Every aspiring fiction writer and journalist in the United States knows the names of the big publishing houses and periodicals in the country, and most of them are based in New York City. This is not a new phenomenon. “By 1850, New York City had surpassed Boston and Philadelphia to become the center of the publishing industry in the United States,” according to the Dictionary of American History.[127] Today, the five largest book publishers in the United States – Simon and Schuster, Hachette, Penguin Random House, MacMillan and HarperCollins – all maintain headquarters in New York City.[128] Not just book publishing, but children’s book publishing, magazines, directories, maps, catalogs, databases, and web-based publications – and the thousands of people employed at these places – are disproportionately represented in New York. And many publications, from the New Yorker to the New York Review of Books, have woven themselves into the very fabric of the city, becoming as iconic as the Empire State Building and the Statue of Liberty.
While still large, the publishing industry in New York City saw a major contraction over the period between 2008 and 2017. The decline in the City mirrors the decline observed in the nation as a whole. At the national level, traditional publishing is on decline with the rise of internet publishing. Payroll data show that U.S employment declined by 30 percent – from 220,000 to 153,000 – between 2008 and 2017. New York City did not fare any better. The number of book and periodical publishers went down from 791 to 654 in the decade and total employment (including self-employed) declined by 28 percent from over 44,000 to under 32,000. New York City nonetheless remains the national hub for the publishing industry, nearly 1 in 5 workers in the industry.
Average wages went up for both privately employed as well as self-employed. Average wages of privately employed increased by 16.3 percent to nearly $133,000 in 2017 whereas self-employed made an average of $88,000, an increase of 34 percent. On average, New York City based employees made 49 percent more than their nationwide counterparts. Because wages are so much higher, New York City accounts for 29% of total U.S. wages earned at publishers.
Despite the large declines in firms and employment there is still optimism that revenues from publishing will rise 60 percent from 2017 to 2020.[129] Print books seem to remain the most popular format for reading in the United States at the expense of digital formats, with 67 percent of readers saying in a recent survey that they have read a print book in the past year and roughly 4 in 10 saying they read only print books.[130] However, audiobooks are the fastest-growing segment of the publishing industry. In the first eight months of 2017, publishers’ revenue from audiobooks grew 20 percent from the same period a year earlier, while print books only rose 1.5 percent and e-books slipped 5.4 percent, according to data compiled by the Association of American Publishers.[131] With technology improving, aiding both audiobook production and listening, those trends will likely continue. E-books, which just a few years ago were said to be the potential end of print books, are thought to have peaked and may continue to decline.
In other audio publishing, podcasts are a growing market, with the average podcast listener tuning in for several podcasts per week.[132] Macmillan’s podcasting network, Quick and Dirty Tips, is downloaded two million times per month and gets three million unique visitors to its website on a monthly basis.[133]
Data Sources and Methods
The Creative Economy
Employment information by place of work is reported in the Quarterly Census of Employment and Wages (QCEW) based on reports from employers covered under New York State’s Unemployment Insurance Law. QCEW measures jobs held in the jurisdiction (regardless of the place of residence of the employee). Each firm surveyed is classified according to a standard list of industries, the North American Industrial Classification System (NAICS). The Creative sector, as we define it for purposes of this report, includes the following industries:
Since there is no common definition of the creative sector, certain choices must always be made, which means that this set of industries inevitably will not be perfectly comparable with other studies. Some previous studies have excluded fashion and advertising, for example. But given that both industries have creative content at their core, and that the creative dimension to both industries is not just historically, but also increasingly important in New York City, we include them here. Some studies have included the sports and recreation and education sectors (at least arts schools). We did not include sports and recreation in this study because they do not have creative output as core value-added. Arts schools were a closer call; ultimately we did not include them because the numerous arts, design and similar departments that are part of a college or university or not counted separately.
Data by industry include employment; total annual and average weekly wages; and, the number of establishments. We use publicly available annual county files, for which the latest available data is from 2017. Some information is protected under State law which prohibits disclosure of information that would reveal the identity of individual employers. We impute employment and wage information for sectors where the number of establishments is reported but employment and wages are non-disclosed. The imputation procedure involves taking total employment and wages from NAICS codes at a higher level of classification than the creative sectors used in this report and allocating them to the non-disclosed sectors according to the share of establishments in those sectors in the higher level NAICS classification.
The QCEW includes only salaried workers and thus does not measure self-employment. Self-employment data is sourced from the Bureau of the Census’ American Community Survey (ACS). ACS is an ongoing household survey by the U.S. Census Bureau sampling approximately one percent of the households annually in the United States. We use publicly available ACS three-year files covering the time period 2015 through 2017 in order to have more accurate estimates of self-employed.[134] Each adult surveyed is classified according to their class of employment (private sector employee, government employee, self-employed, etc.) and also assigned a standard list of industries, the North American Industrial Classification System (NAICS). Because the NAICS codes provided in ACS are usually at a higher level of classification than the creative sectors used in this report, further imputation procedures are used to calculate total self-employment and wages in each of the creative sectors.[135]
| Report Sectors | NAICS Industries | NAICS Codes |
| Advertising | Advertising agencies | 54181 |
| Applied Design | Specialized design services | 5414 (except 54149) |
| Photographic services | 54192 | |
| Architecture | Architectural services | 54131 |
| Fashion | Other specialized design services | 54149 |
| Textile mills | 313 | |
| Apparel manufacturing | 315 | |
| Leather and allied product manufacturing | 316 | |
| Film and Television | Motion picture and video industries | 5121 (except 51213) |
| Television broadcasting | 51512 | |
| Cable and other subscription programming | 51521 | |
| Galleries and Auction Houses | Art dealers | 45392 |
| Independent Artists | Independent artists, writers, and performers | 7115 |
| Music Recording | Sound recording industries | 5122 |
| Museums and Libraries | Museums, historical sites and similar institutions | 7121 |
| Libraries and archives | 51912 | |
| Performing Arts | Theaters | 71111 |
| Dance | 71112 | |
| Music | 71113 | |
| Other Performing Arts | 71119 | |
| Publishing | Periodical publishers | 51112 |
| Book publishers | 51113 |
The Creative Workforce
Occupational data is sourced from the Bureau of the Census’ American Community Survey (ACS) three year sample for 2015-17. Survey respondents are asked their occupation; responses therefore reflect the respondent’s self-classification. Respondents are also asked to name the industry in which they work, which the Census Bureau then codes according to the NAICS codes used by the QCEW. The following occupations are included in our definition of the creative workforce:
| Report Occupation | ACS Occupation | SOCP |
| Actors | Actors | 272011 |
| Agents | Agents and Business Managers of Artists, Performers and Athletes | 131011 |
| Architects | Architects, Except Naval | 171010 |
| Artists | Artists and Related Workers | 271010 |
| Dancers and Entertainers | Dancers and Choreographers | 272030 |
| Entertainers and Performers, Sports and Related Workers, All Other | 272099 | |
| Designers | Designers | 271020 |
| Editors, Writers and Authors |
Editors | 273041 |
| Technical Writers | 273042 | |
| Writers and Authors | 273043 | |
| Musicians | Musicians, Singers, and Related Workers | 272040 |
| Photographers | Photographers | 274021 |
| Producers & Directors | Producers and Directors | 272012 |
| Broadcast, Sound and Media Operators, Editors and Technicians |
Miscellaneous Media and Communication Workers | 273090 |
| Television, Video, and Motion Picture Camera Operators and Editors | 274030 | |
| Broadcast and Sound Engineering Technicians and Radio Operators, and media and communication equipment workers, all other | 2740XX |
Multiplier Methodology
The multipliers for total output for NYC provided by the U.S. Bureau of Economic Analysis require output by industry. This number is not available at the city level. To create a proxy for output we estimated that, on average for the whole economy, total output is 2.5 times wages and salaries. Thus for each industry in this report we estimated output by multiplying total wages and salaries by 2.5.
From the estimated total output by industry we assigned one of the available multipliers to each industry. Certain available multipliers, such as for publishing, match closely with industry sectors. For other industry sectors we had to rely on broader multiplier categories – such as using “other retail” for galleries and auction houses.
These factors were multiplied by the estimated output for each industry to get a total impact to the economy for each industry. Summing these we estimate that the direct impact to the economy from the creative sector, as we define it in the report, is $76 billion. The total impact is $110 billion or about 12% of the City’s economy. The output-weighted average multiplier for the creative industries, as a class, is estimated to be 1.45.
| Report Sector | BEA Sector | Multiplier |
| Advertising | Professional scientific and technical services | 1.3413 |
| Applied Design | Professional scientific and technical services | 1.3413 |
| Architecture | Professional scientific and technical services | 1.3413 |
| Fashion Design | Apparel and leather and allied product manufacturing | 1.2851 |
| Fashion Production | Apparel and leather and allied product manufacturing | 1.2851 |
| Film & TV | Motion picture and sound recording | 1.5715 |
| Galleries & Auction Houses | Other retail | 1.3587 |
| Independent Artists | Performing arts, spectator sports, museums, and related | 1.5732 |
| Museums & Libraries | Performing arts, spectator sports, museums, and related | 1.5732 |
| Music Recording | Performing arts, spectator sports, museums, and related | 1.5732 |
| Performing Arts | Performing arts, spectator sports, museums, and related | 1.5732 |
| Publishing | Publishing industry | 1.3639 |
Acknowledgements
The Comptroller would like to acknowledge the staff of the Bureau of Budget for their work on this report, in particular Preston Niblack, Deputy Comptroller for Budget; Lawrence Mielnicki, Chief Economist; Eng-Kai Tan, Bureau Chief; Stephen Corson; Selcuk Eren; Peter E. Flynn; Tammy Gamerman; Stephen Giachetti; Michael Hecht; Andrew McWilliam; Marcia Murphy; and Orlando Vasquez.
Endnotes
[1] See Data Sources and Methods for the derivation of this figure.
[2] A complete list of North American Industry Classification Standard (NAICS) codes used to define the sector is included in Data Sources and Methods.
[3] Center for an Urban Future: Brooklyn’s Growing Innovation Economy (June 2019; https://nycfuture.org/research/brooklyns-growing-innovation-economy)
[4] These figures include salaries and wages only, and exclude fringe benefits such as health insurance or pension benefits.
[5] We define a part-time worker as an individual who is employed but works fewer than 35 hours per week.
[6] Innovative Theater Foundation, Demographic Study of Off-Off Broadway Practitioners (January 2010), http://nyitawards.com/survey/oobdemographics.pdf.
[7] Andrew W. Mellon Foundation, Art Museum Staff Demographic Survey (July 28, 2015), https://mellon.org/media/filer_public/ba/99/ba99e53a-48d5-4038-80e1-66f9ba1c020e/awmf_museum_diversity_report_aamd_7-28-15.pdf.
[8] SMU DataArts, New York City Department of Cultural Affairs Workforce Demographics Pilot Study Results, July 2019, https://www1.nyc.gov/assets/dcla/downloads/pdf/NYC%20DCLA%20Full%202018%20WfD%20Report%207-24-19.pdf
[9] New York City Department of Cultural Affairs, CreateNYC: A Cultural Plan for All New Yorkers (July 2017), p. 160, http://createnyc.org/wp-content/uploads/2017/07/CreateNYC_Report_FIN.pdf.
[10] Center for an Urban Future, Creative New York (June 2015), https://nycfuture.org/pdf/Creative-New-York-2015.pdf. See also, Ruth Simon and Rob Barry, “A Degree Drawn in Red Ink” The Wall Street Journal (February 18, 2013), https://www.wsj.com/articles/SB10001424127887324432004578306610055834952.
[11] Strategic National Arts Alumni Project, 2017 Annual Report (November 2017), p. 11, http://snaap.indiana.edu/pdf/2017/SNAAP_Annual_Report_2017.pdf.
[12] Based on the QCEW, average wage growth from 2008 to 2017 was higher in music and dance; television broadcasting; cable and other subscription programming; and leather goods. Source: U.S. Census, American Community Survey, 1-year estimates for 2008 and 2017.
[13] National Center for Arts Research, SMU DataArts, www.culturaldata.org. It is important to note that there is no unified database of not-for-profit organizations in the creative sector. SMU DataArts includes data from arts-oriented non-profits that choose to share it for the purposes of applying for and obtaining grants from private and public sources. We believe that the organizations included in SMU DataArts include all of the largest of these organizations and a large number of smaller, active, not-for-profit arts organizations.
[14] Urban Institute, National Center for Charitable Statistics Data Archive, Core Files (IRS Business Master Files), 2017. Available at https://nccs-data.urban.org/data.php?ds=bmf
[15] IRS Form 990 filings for The Metropolitan Museum of Art; The New York Public Library; Wildlife Conservation Society; Museum of Modern Art; American Museum of Natural History; New York Botanical Garden; Solomon R. Guggenheim Foundation; Whitney Museum of American Art; Philharmonic Symphony Society of New York; New York City Ballet; The Frick Collection; and Brooklyn Botanic Garden, retrieved from https://www.guidestar.org/Home.aspx .
[16] Long Island City Partnership, Long Island City Comprehensive Plan, https://longislandcityqueens.com/media/filer_public/4a/bd/4abddb15-ceab-4e32-abe5-201b7c1d6fa4/lic_plan_full_report_for_web.pdf.
[17] Office of the Mayor, Mayor de Blasio, Speaker Mark-Viverito, City Council Reach Early Agreement on Balanced FY2017 Budget, Marking Earliest Handshake Since 2001; June 8, 2016, https://www1.nyc.gov/office-of-the-mayor/news/521-16/mayor-de-blasio-speaker-mark-viverito-city-council-reach-early-agreement-balanced-fy2017#/0;
[18] https://www1.nyc.gov/site/dcla/about/pressrelease/PR-2018-10-23-DCLA-Budget-CDF-Funding.page
[19] The 34th member of the Cultural Institutions Group, Weeksville Heritage Center, was added in fiscal year 2020
[20] https://www.nytimes.com/2017/05/08/arts/design/deblasio-museums-cultural-plan-funding.html
[21] Based on each institution’s 2016 IRS Form 990.
[22] A capital “commitment” is a contractual commitment for spending, and is not the same as cash outlays for a project, which generally lag commitments as payments are made over time against the contract as work progresses.
[23] NEA, NYSCA and DCLA grants are awarded in Federal, State, and City fiscal years, respectively. Although the fiscal years do not coincide, the grant composition should not be significantly affected.
[24] All NYSCA grants less capital and regional economic development grants.
[25] Mayor’s Office of Film, Theatre and Broadcasting, “History of the Mayor’s Office of Film, Theater and Broadcasting.” Available at https://web.archive.org/web/20100527194216/http://nyc.gov/html/film/html/office/history_moftb.shtml.
[26] To be eligible to receive the credit, generally at least 75 percent of overall eligible production costs had to be incurred in New York State (and within New York City for the City credit). Eligible costs excluded principal actor and director fees and typically referred to as below the line costs related to production, film crew and related activities. The credits were structured to be refundable so that in addition to offsetting any tax liability a company could receive a reimbursement in the event that costs exceeded revenues. Credits could also apply to pass through entities on individual tax forms.
[27] Louisiana and New Mexico were the first states to introduce credits in 2002. Neil DeMause, “New York Is Throwing Money at Film Shoots, But Who Benefits?” The Village Voice (October 11, 2017), https://www.villagevoice.com/2017/10/11/new-york-is-throwing-money-at-film-shoots-but-who-benefits/.
[28] Glenn Collins, “On Brooklyn Backlot, Finally, Some Action; After Years of Talk, A Movie Studio is Being Built at the Navy Yard” The New York Times (July 21, 2003), https://www.nytimes.com/2003/07/21/nyregion/brooklyn-back-lot-finally-some-action-after-years-talk-movie-studio-being-built.html.
[29] Brett Lang, “After a Rocky Start, Steiner Studios Builds a Production Powerhouse in Brooklyn” Variety (October 2, 2018), https://variety.com/2018/biz/news/doug-steiner-studios-brooklyn-1202963788/.
[30] New York City Economic Development Corporation, “Statement on York Studios’ Expansion to the Bronx” (June 6, 2017), https://www.nycedc.com/press-release/statement-york-studios-expansion-bronx.
[31] “Governor Cuomo and CBS Corporation Announce that The Late Show With Stephen Colbert Will Remain in New York” (press release, July 23, 2014), https://www.governor.ny.gov/news/governor-cuomo-and-cbs-corporation-announce-late-show-stephen-colbert-will-remain-new-york; and New York State Empire State Development “Excelsior Jobs Program Quarterly Report, Businesses Admitted to the Program as of March 31, 2018,” https://esd.ny.gov/sites/default/files/Excelsior-ChartA_BusinessesAdmittedToProgram_3312018.pdf.
[32] “ESD Closes on Redevelopment of Arthur Kill Correctional Facility into First-Class TV and Film Production Studio Space” (press release, August 8, 2017), https://esd.ny.gov/esd-media-center/press-releases/esd-closes-redevelopment-arthur-kill-correctional-facility-first.
[33] IDNYC: A Tool of Empowerment. Westat, Inc., August 2016 (https://www1.nyc.gov/assets/idnyc/downloads/pdf/idnyc_report_full.pdf).
[34] https://www.nytimes.com/2018/07/20/arts/library-cards-rival-golden-tickets-with-culture-pass-option.html
[35] New York City Department of Education, Arts in Schools Report: 2017-2018, p. 66, https://infohub.nyced.org/docs/default-source/default-document-library/arts_in_school_report_17-18.pdf?sfvrsn=34ec35f9_2.
[36] Ibid, p. 17.
[37] New York City, “FY 2018 Schedule C Database” (accessed October 25, 2018), http://www.nyc.gov/html/citycouncil/html/budget/expense_funding.shtml.
[38] New York City Economic Development Corporation, NYCxDesign, 2018 Overview. Available at https://www.nycxdesign.com/wp-content/uploads/2017/12/NYCxDESIGN-2018-Overview-Website-1.pdf
[39] “Museum Mile Festival” (accessed November 8, 2018), http://museummilefestival.org/index.php/about/.
[40] Global Cultural Districts Network, “Brooklyn Cultural District” (accessed November 8, 2018), https://gcdn.net/member/brooklyn-cultural-district/; and New York City Economic Development Corporation, “Brooklyn Cultural District” (accessed November 8, 2018), https://www.nycedc.com/project/brooklyn-cultural-district.
[41] Downtown Brooklyn Partnership and Downtown Brooklyn Arts Alliance, “Culture Forward” (July 2016), http://s3.amazonaws.com/downtown-brooklyn/imgr/Culture-Forward.pdf; “Mayor Bloomberg Announces Developer Chosen to Build Affordable Housing, Retail and Cultural Space in Downtown Brooklyn Cultural District” (press release, October 8, 2013), https://www1.nyc.gov/office-of-the-mayor/news/324-13/mayor-bloomberg-developer-chosen-build-affordable-housing-retail-cultural-space.
[42] Mayor of London, Cultural Infrastructure Plan: A Call to Action. https://www.london.gov.uk/what-we-do/arts-and-culture/culture-and-good-growth/cultural-infrastructure-plan
[43] “Inaugural Downtown Brooklyn Arts Festival: Brooklyn Institutions Unite for a Weekend of Activity,” (accessed December 4, 2018), http://downtownbrooklyn.com/news/2018/inaugural-downtown-brooklyn-arts-festival-brooklyn-institutions-unite-for-weekend-of-activity.
[44] A series of papers were published under the aegis of the University of Pennsylvania Social Impact of the Arts Project as Culture and Wellbeing in New York City, 2014-2017 (https://repository.upenn.edu/siap_culture_nyc/)
[45] Long Island City Partnership, Long Island City Comprehensive Plan, https://longislandcityqueens.com/media/filer_public/4a/bd/4abddb15-ceab-4e32-abe5-201b7c1d6fa4/lic_plan_full_report_for_web.pdf.
[46] Jeanmarie Evelly, “Free ‘LIC Art Bus’ to Shuttle Visitors to Neighborhood Museums” DNA Info (May 6, 2014), https://www.dnainfo.com/new-york/20140506/long-island-city/free-lic-art-bus-shuttle-visitors-neighborhood-museums/.
[47] A0372/S01425 of 2019, https://assembly.state.ny.us/leg/?default_fld=&bn=A03723&term=2019&Summary=Y&Actions=Y&Text=Y&Committee%26nbspVotes=Y&Floor%26nbspVotes=Y
[48] National Assembly of State Arts Agencies, State Cultural Districts (May 2018), https://nasaa-arts.org/wp-content/uploads/2018/05/StateCulturalDistrictsPolicyBrief.pdf; and Americans for the Arts, “Cultural Districts Basics” (accessed November 2, 2018), https://www.americansforthearts.org/by-program/reports-and-data/toolkits/national-cultural-districts-exchange/cultural-districts-basics.
[49] New York City Council, “Engines of Opportunity” (November 2014), https://council.nyc.gov/land-use/plans/enginesofopportunity/.
[50] https://www.nycedc.com/program/cfda-fashion-incubator
[51] https://www.nycedc.com/program/chashama-artist-studios
[52] https://www.nycedc.com/program/made-ny-media-center
[53] https://www.newmuseum.org/pages/view/new-inc-1
[54] https://socialinnovation.org/
[55] https://bkaccelerator.com/
[57] https://www.makerspace.nyc/
[58] https://www.bwayaccelerator.com/
[59] Includes only classrooms designed and used solely for the arts. NYC Comptroller analysis of “2016-2017 Arts Survey Data” (accessed October 30, 2018), https://data.cityofnewyork.us/Education/2016-2017-Arts-Survey-Data/ujyk-wix4/data.
[60] DanceWorks New York City, “Rehearsal Schedule” (accessed October 30, 2018), http://danceworksnewyorkcity.com/rehearsal-schedule/.
[61] New York City Center for an Urban Future, Artists in Schools: A Creative Solution to NYC’s Affordable Space Crunch (July 2017), https://nycfuture.org/research/more-NYC-artists-fewer-studios-schools.
[62] See, for example, the Arts + Social Impact Explorer by Americans for the Arts: https://www.americansforthearts.org/arts-social-impact-explorer
[63] Susan Edelman, “NYC’s top-performing arts high schools,” Daily News, September 17, 2016, https://nypost.com/2016/09/17/nycs-top-performing-arts-high-schools/
[64] Students may still have access to arts education in schools that lack certified arts teachers, as some schools may share teachers and other schools may use uncertified teachers. Office of the New York City Comptroller, State of the Arts: A Plan to Boost Arts Education in New York City Schools (April 2014), https://comptroller.nyc.gov/wp-content/uploads/documents/State_of_the_Arts.pdf; and Comptroller Office analysis of New York City Department of Education, “Arts Reporting: 2017-18” (accessed June 19, 2019), https://infohub.nyced.org/reports-and-policies/government/intergovernmental-affairs/arts-reporting.
[65] New York City Department of Education, Arts in Schools Report: 2017-2018, p. 16, Available at https://infohub.nyced.org/reports-and-policies/citywide-information-and-data/annual-arts-in-schools-reports.
[66] New York City Department of Probation, “NeON Arts Program” (accessed January 3, 2019), https://www1.nyc.gov/site/neon/programs/neon-arts.page
[67] Metis Associates and Westat, “Evaluation of the Neighborhood Opportunity Network (NeON) Arts Program” (December 2018), https://www1.nyc.gov/assets/probation/pdf/press/neon-arts-evaluation-report-december-2018.pdf.
[68] New York City Council, “Oversight Hearing on Department of Probation Arts Programming – Committee Report” (December 18, 2018), https://legistar.council.nyc.gov/LegislationDetail.aspx?ID=3761129&GUID=8B63E008-E9E3-4653-9806-1CA32A838FE1&Options=&Search=; and Young New Yorkers, “About” (accessed January 3, 2019), http://www.youngnewyorkers.org/about.
[69] New York City Council, “Oversight Hearing on Department of Probation Arts Programming – Testimony” (December 18, 2018), https://legistar.council.nyc.gov/LegislationDetail.aspx?ID=3761129&GUID=8B63E008-E9E3-4653-9806-1CA32A838FE1&Options=&Search=
[70] Freelancers Union, Upwork, and the New York City Mayor’s Office of Media and Entertainment, “Freelancing in New York City 2019,” https://www.freelancersunion.org/resources/freelancing-in-nyc/.
[71] Elaine Pofeldt, “Can This Sweeping New Program Take the Insecurity Out of Freelancing?” Forbes (August 22, 2018), https://www.forbes.com/sites/elainepofeldt/2018/08/22/can-the-city-of-new-york-blunt-the-insecurities-of-freelancing/#507df2185d85.
[72] New York City Department of Consumer Affairs, “Freelance Isn’t Free Act” (accessed October 30, 2018), https://www1.nyc.gov/site/dca/about/freelance-isnt-free-act.page.
[73] “De Blasio Administration Announces First of Its Kind ‘Freelancers Hub’ (press release, August 22, 2018), https://www1.nyc.gov/site/mome/news/08222018-freelancers-hub.page.
[74] P. 7, https://www1.nyc.gov/assets/dca/downloads/pdf/workers/Demanding-Rights-in-an-On-Demand-Economy.pdf.
[75] Samar Khurshid, “Two Years After New York City Expanded Protections for Freelancers, State Yet to Act” The Gotham Gazette (May 3, 2019), https://www.gothamgazette.com/state/8499-two-years-after-new-york-city-expanded-protections-for-freelancers-state-yet-to-act.
[76] https://www.nysenate.gov/legislation/bills/2009/s8084/amendment/original; https://nyassembly.gov/leg/?default_fld=&leg_video=&bn=A05472&term=2013&Summary=Y&Actions=Y&Memo=Y&Text=Y; https://nyassembly.gov/leg/?default_fld=&leg_video=&bn=A06698&term=2011&Summary=Y&Actions=Y&Memo=Y&Text=Y
[77] Deutschland.de, “How Germany Supports Professional Artists.” https://www.deutschland.de/en/topic/culture/how-germany-supports-professional-artists
[78] The Arts and Entertainment Plan. See https://www.aeplan.ca/guest.
[79] New York State Department of Labor, “Guidelines for Determining Worker Status: Performing Artists” (November 2017, https://www.labor.ny.gov/formsdocs/ui/IA318.17.pdf.
https://www.harveymarsattorney.com/wp-content_8348/uploads/WCL-Article-06-2017.pdf
[80] “Westbeth: History” (accessed October 30, 2018), http://westbeth.org/wordpress/about/history/.
[81] National Endowment for the Arts, “Westbeth: At Home in the Arts” (accessed October 30, 2018), https://www.arts.gov/about/40th-anniversary-highlights/westbeth-home-arts.
[82] Related, “Manhattan Plaza” (accessed October 30, 2018), http://www.related.com/our-company/properties/99/MANHATTAN-PLAZA; The Actors Fund, “The Schermerhorn” (accessed October 30, 2018), https://actorsfund.org/services-and-programs/schermerhorn; and Art Space, “P.S. 109” (accessed October 30, 2018), https://www.artspace.org/ps109.
[83] Emilia David, “More than 53,000 Artists Apply for 89 Affordable Harlem Apartments” DNA Info (July 31, 2014), https://www.dnainfo.com/new-york/20140731/east-harlem/more-than-53000-artists-apply-for-89-affordable-harlem-apartments/.
[84] Brigid Bergin, “De Blasio to Unveil New Artist Housing, Workspace” WNYC (February 2, 2015), https://www.wnyc.org/story/de-blasio-unveil-new-artist-housing-workspace/?utm_content=bufferb6175&utm_medium=social&utm_source=facebook&utm_campaign=wnyc-facebook.
[85] “Long Island City: An Investment Strategy” (October 2018), https://docs.wixstatic.com/ugd/1b4cbc_fdcade1ca8584903a587cce2bdad64d3.pdf.
[86] “Data Suggests Surprising Shift,” eMarketer, March 19, 2018.
[87] Suzanne Vranica and Nicole Hong, “Federal Prosecutors Probe Ad Industry’s Media-Buying Practices,” Wall Street Journal, September 27, 2018.
[88] Mike Shields, “The Future of Ad Agencies Has Never Been More in Doubt,” Business Insider, June 18, 2017.
[89] Megan Rose Dickey, “The World’s 25 Best Design Schools,” Business Insider, November 23, 2012.
[90] “New York Area’s Largest Architecture Firms,” Crain’s New York Business, Aug. 20, 2018. The number of projects and millions of square feet are understated due to missing data for some firms.
[91] Impact Integration, Galleries of New York. Available at http://www.galleriesofnewyork.com.
[92] Galleries of New York, and member list from The Art Dealers Association of America. Available at https://www.artdealers.org/.
[93] Dr. Clare McAndrew; Art Basel and UBS, The Art Market 2018. Available at https://d2u3kfwd92fzu7.cloudfront.net/Art%20Basel%20and%20UBS_The%20Art%20Market_2018_2.pdf.
[94] Center for an Urban Future, Destination New York, May 2018. Available at https://nycfuture.org/pdf/CUF_Destination_New_York.pdf.
[95] McAndrew, op. cit.
[96] https://www.christies.com/about-us/press-archive/details?PressReleaseID=9026&lid=1
[97] Norma M. Rantisi, “The Ascendance of New York Fashion,” International Journal of Urban and Regional Research (28:1), March 2004, pgs. 86-106.
[98] Need SOURCE
[99] United States Congress Joint Economic Committee, “The Economic Impact of the Fashion Industry,” February 6, 2015. Available at https://maloney.house.gov/sites/maloney.house.gov/files/documents/The%20Economic%20Impact%20of%20the%20Fashion%20Industry%20–%20JEC%20report%20FINAL.pdf.
[100] We use NAICS code 54149, Other Specialized Design Services, which includes fashion, jewelry, shoes, furs, textiles and costume design, to measure the City’s fashion design industry.
[101] Website of the Garment District Alliance, “Plan Your Visit.” Available at http://garmentdistrict.nyc/plan-your-visit/getting-here/.
[102] Department of City Planning, “Special Garment Center District Text Amendment.” Available at https://www1.nyc.gov/site/planning/plans/garment-center/garment-center.page.
[103] New York City Economic Development Corporation, “New York Works: De Blasio Administration, Speaker Johnson, and Manhattan Borough President Brewer Unveil Plan to Save Fashion Production in Garment District,” June 4, 2018. Available at https://www.nycedc.com/press-release/new-york-works-de-blasio-administration-speaker-johnson-and-manhattan-borough; Mayor’s Press Office, “De Blasio Administration, City Council and Garment Center Steering Committee Announce Passage of Unprecedented Support Package for Fashion Production and the Garment Center,” Dec. 20, 2018.
[104] New York Economic Development Corporation and the Council of Fashion Designers of America, Fashion Manufacturing Initiative. Available at https://www.nycedc.com/program/fashion-manufacturing-initiative-fmi.
[105] U.S. National Park Service, “Thomas Edison National Historic Park.” Available at https://www.nps.gov/edis/learn/kidsyouth/motion-pictures.htm.
[106] Michael Janofsky, “Dinkins Turns To Industry Experience to Lure Films Back to New York City,” New York Times, November 25, 1992; Matthew Purdy, “Hollywood is Casting; New York Stays Home,” New York Times, February 27, 1994.
[107] Neil DeMause, “New York Is Throwing Money at Film Shoots, But Who Benefits?” The Village Voice, October 11, 2017.
[108] National Conference of State Legislatures, State Film Production Incentives and Programs January 30, 2018, available at http://www.ncsl.org/Portals/1/Documents/fiscal/2018StateFilmIncentivePrograms_20189.pdf.
[109] New York State Department of Labor, New York’s Motion Picture Industry, June 2014. Available at https://labor.ny.gov/stats/PDFs/New-York-Motion-Picture-Industry.pdf.
[110] New York City Mayor’s Office of Media and Entertainment, “Resources: Studios and Stages.” Available at https://www1.nyc.gov/site/mome/resources/studios-stages.page.
[111] Allie Griffin, “Designs Unveiled for Robert De Niro’s $400M Production Studio in Astoria.” Astoria Post, Sept. 23, 2019. Accessed at https://astoriapost.com/designs-unveiled-for-robert-de-niros-400m-production-studio-in-astoria
[112] New York City Mayor’s Office of Media and Entertainment, “Mayor’s Office of Media and Entertainment Announces Sharp Rise in Number of Broadcast Pilots Shooting in NYC,” March 22, 2018. Available at https://www1.nyc.gov/site/mome/news/03222018-nyc-tv-pilots.page; and “Mayor de Blasio Announces All-Time Record Number of Television Shows Shooting in New York City,” June 6, 2017. Available at https://www1.nyc.gov/site/mome/news/television-productions-2016-2017-season.page.
[113] Variety Staff, “Emmy Awards: The Complete Winners List,” September 17, 2018. Available at https://variety.com/2018/tv/news/2018-emmy-winners-list-1202943321/. Accessed January 3, 2019.
[114] Based on analysis of permits approved by the City for using city property, such as a sidewalk, street or park. These figures exclude productions in studios which do not require permits. Mayor’s Office of Data Analytics, Department of Information Technology and Telecommunications (NYC Open Data). Available at https://data.cityofnewyork.us/City-Government/Film-Permits/tg4x-b46p.
[115] New York City Mayor’s Office of Media and Entertainment, Music in New York City: Economic Trends, Impact and Opportunities, 2017, p. 27. Available at https://www1.nyc.gov/assets/mome/pdf/MOME_Music_Report_2017_DIGITAL.pdf.
[116] “Mayor de Blasio, Berklee, the Mayor’s Office of Media and Entertainment and NYC Economic Development Corporation, and Berklee Trustee Pete Muller Announce Preservation of Historic Power Station (Avatar) Studios,” September 5, 2017. Available at https://www1.nyc.gov/site/mome/news/090517-berkleenyc-avatar-studios.page.
[117] Colin Moynihan, “Petition Filed to Create First Union for Guggenheim Museum Staff.” The New York Times, June 12, 2019 (https://www.nytimes.com/2019/06/12/arts/design/guggenheim-museum-union.html); Colin Moynihan, “Workers at New Museum in Manhattan Vote to Unionize.” The New York Times, January 24, 2019 (https://www.nytimes.com/2019/01/24/arts/design/new-museum-vote-to-unionize.html); Evan Nicole Brown, “Tenement Museum Workers Vote to Unionize, Citing Low Pay and Limited Benefits.” Gothamist, April 12, 2019. (https://gothamist.com/2019/04/19/tenement_museum_workers_vote_to_unionize.php); Hakim Bishara, “Brooklyn Academy of Music Employees Vote in Favor of Union.” Hyperallergic, June 13, 2019. (https://hyperallergic.com/505184/bam-union-vote/).
[118] The Broadway League, Broadway’s Economic Contribution to New York City, 2016-2017 (March 2018), p. 32.
[119] Rules and Regulations of the American Theatre Wing’s Tony Awards, 2017-18 Season, p. 20, https://www.tonyawards.com/pdf/2018_Tony_Rules.pdf.
[120] Michael Paulson, “This Broadway Season, the Play’s Really the Thing,” The New York Times, Oct. 10, 2018 (https://www.nytimes.com/2018/10/10/theater/this-broadway-season-the-plays-really-the-thing.html); and Patrick Healy, “Nonprofit Companies Enjoying, Well, Profits,” The New York Times, Dec. 16, 2011 (https://www.nytimes.com/2011/12/17/theater/nonprofit-theater-companies-enjoying-well-profits.html). Non-profit theaters often rent their space to commercial productions as well.
[121] The Broadway League, “The Demographics of the Broadway Audience: 2017-18” (Press release: October 18, 2018), https://www.broadwayleague.com/press/press-releases/the-broadway-league-reveals-the-demographics-of-the-broadway-audience-for-20172018-season/.
[122] The Lortel Archives, Producing Companies, http://www.lortel.org/Archives/ProducingCompanies.
[123] New York Innovative Theatre Foundation, New York Innovative Theater Awards, “About Off-Off-Broadway” http://www.nyitawards.com/aboutus/oob.asp.
[124] Alexandra Levine, “The Nightlife Mayor’s Citywide Tour,” New York Times (October 1, 2018), https://www.nytimes.com/2018/10/01/nyregion/new-york-today-the-nightlife-mayors-citywide-tour.html.
[125] New York City Mayor’s Office of Media and Entertainment, Music in New York City: Economic Trends, Impact and Opportunities (2017), p. 18, https://www1.nyc.gov/assets/mome/pdf/MOME_Music_Report_2017_DIGITAL.pdf.
[126] Mihir Zaveri, “Washington Wants to Hire a Night Mayor. So What is That?” New York Times (October 10, 2018), https://www.nytimes.com/2018/10/10/us/night-mayor-washington-dc.html.
[127] Birdie Media, Encyclopedia.com, Publishing Industry, https://www.encyclopedia.com/literature-and-arts/journalism-and-publishing/journalism-and-publishing/publishing-industry
[128] The Balance Careers, “The Big 5 Trade Book Publishers,” https://www.thebalancecareers.com/the-big-five-trade-book-publishers-2800047
[129] Lisa Rabasca Roepe, “The Publishing Industry,” Sage Business Researcher, May 7, 2018, http://businessresearcher.sagepub.com/sbr-1946-106481-2887680/20180507/the-publishing-industry
[130] Andrew Perrin, “Nearly One-in-Five Americans Now Listen to Audibooks,” Pew Research Center, http://www.pewresearch.org/fact-tank/2018/03/08/nearly-one-in-five-americans-now-listen-to-audiobooks/
[131] Jeffrey A. Trachtenberg, “Amazon Already Disrupted the Sale of Print Titles. Up Next: Audiobooks,” Wall Street Journal, February 5, 2018, https://www.wsj.com/articles/readers-listen-up-amazon-wants-to-extend-its-dominance-in-audiobooks-1517832000
[132] Edison Research, Blog: The Latest News, The Infinite Dial 2018, March 8, 2018, https://www.edisonresearch.com/infinite-dial-2018/
[133] Adam Rowe, “How the Publishing Industry Is Learning to Love the Podcast,” Forbes, April 27, 2917; https://www.forbes.com/sites/adamrowe1/2018/04/27/how-the-publishing-industry-is-learning-to-love-the-podcast/#4ef29f287536
[134] For more information on ACS data, see https://usa.ipums.org/usa/
[135] The imputation procedure employs two more data sources: Nonemployer Statistics (see https://www.census.gov/programs-surveys/nonemployer-statistics.html) and County Business Patterns (see: https://www.census.gov/programs-surveys/cbp.html); both published by the Census Bureau.