
Introduction
New York City’s nonprofit sector is a critical driver of the City’s economy. Nonprofit organizations provide essential cultural, educational, health and social services, and employ a substantial percentage of the City’s private workforce. Nonprofits generate billions of dollars for the local economy and tax base each year through wages, employment taxes, programmatic and operating spending, and indirect employment. New York City Comptroller Scott Stringer’s Office, in collaboration with Nonprofit New York, analyzed the economic impact of the nonprofit sector and presents new data on its contributions in these pages. As Federal, State and City governments continue to take legislative and budgetary actions to promote our economic recovery from COVID-19, the role and stability of the nonprofit sector must be prioritized. Our City’s economy will depend on it.
$77.7 B/Yr
Contribution
to the NYC economy
(9.4% of NYC GDP)
662,025
Workers
Almost 18% of all NYC workers
13,062
Establishments
Nearly 5% of all businesses
NYC Nonprofit Establishments
Chart 1
Chart 2
Employment and Wages
Chart 4
Chart 5
Chart 6
Who are NYC Nonprofit workers?
64%
Women
34%
Foreign-Born
56%
People of Color
Race And Ethnicity
Chart 7
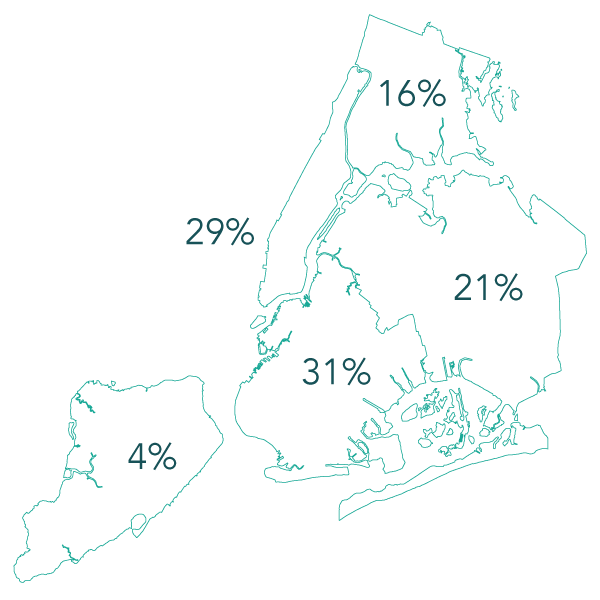
Where do they live in NYC?
Age
Chart 8
What industries employ NYC nonprofit workers?
Top 10 Nonprofit Industries (68% of nonprofit employees)
| Industry | Nonprofit Employees | Share of Total Nonprofit Employees |
| General Medical and Surgical Hospitals, and Specialty (Except Psychiatric and Substance Abuse) Hospitals | 59,592 | 12.3% |
| Civic, Social, Advocacy Organizations, and Grantmaking and Giving Services | 53,174 | 11.0% |
| Colleges, Universities, and Professional Schools, Including Junior Colleges | 53,115 | 11.0% |
| Elementary and Secondary Schools | 50,818 | 10.5% |
| Individual and Family Services | 40,597 | 8.4% |
| Religious Organizations | 21,272 | 4.4% |
| Home Health Care Services | 13,610 | 2.8% |
| Child Day Care Services | 11,555 | 2.4% |
| Museums, Art Galleries, Historical Sites, and Similar Institutions | 11,508 | 2.4% |
| Outpatient Care Centers | 11,381 | 2.4% |
What do NYC nonprofit workers do?
Top 10 Nonprofit Occupational Groups (83% of nonprofit employees)
| Occupational Group | Nonprofit Employees | Share of Total Nonprofit Employees |
| Education, Training, and Library Occupations | 74,721 | 15.5% |
| Management Occupations | 67,982 | 14.1% |
| Office and Administrative Support Occupations | 62,144 | 12.9% |
| Healthcare Practitioners and Technical Occupations | 47,193 | 9.8% |
| Community and Social Service Occupations | 41,495 | 8.6% |
| Healthcare Support Occupations | 31,371 | 6.5% |
| Business Operations Occupations | 20,975 | 4.3% |
| Arts, Design, Entertainment, Sports, and Media Occupations | 18,337 | 3.8% |
| Building and Grounds Cleaning and Maintenance Occupations | 18,328 | 3.8% |
| Personal Care and Service Occupations | 16,104 | 3.3% |
Sources & Notes
The data for this report are drawn from the U.S. Bureau of Labor Statistics (BLS) Research Data on the Nonprofit Sector. The latest available data is for 2017. The BLS uses its Quarterly Census of Employment and Wages (QCEW) combined with the Internal Revenue Service’s Exempt Organization Business Master File (EOBMF). The QCEW includes all employers who pay into their State’s unemployment insurance fund. Only full-time employees of 501(c)(3) nonprofits are included in this data.
The number of reporting entities in the QCEW data is smaller than the number in the IRS EOBMF for two reasons: First, because only 501(c)(3) organizations are included (and not other types of exempt organizations, such as 501(c)(4)s), and second, because the reporting level for the QCEW is a “firm,” which is an economic unit that may include multiple establishments in the EOBMF file.
Demographic data for this report are drawn from American Community Survey (ACS) 1-year estimates published by the U.S. Census Bureau. The latest available data is for 2018. All data sourced from the ACS measures nonprofit workers living in New York City who reported being an “employee of a private not-for-profit, tax-exempt, or charitable organization.”
Estimate of the contribution to NYC gross domestic product is based on input-output final demand multipliers from the Bureau of Economic Analysis.