
Introduction
The Paycheck Protection Program (PPP) is a $669-billion business loan program administered by the U.S. Small Business Administration. It was established through the Coronavirus Aid, Relief, and Economic Security Act and has been renewed, expanded, and tweaked on several occasions in recent months. Its purpose is to help sustain American businesses and their employees during the ongoing global pandemic. The PPP loan may be partially or fully forgiven if a business retains its employees and wages.
Across the five boroughs, New York City small businesses have received approximately 145,936 PPP loans as of June 30. Manhattan led the way with 61,666 loans, followed by Brooklyn (39,093), Queens (29,997), the Bronx (9,577), and Staten Island (5,603).[i]
Loans were spread across hundreds of New York City industries, with Retail (14,946), Restaurants and Bars (9,315), Doctors’ Offices & Outpatient Clinics (8,044), Construction (7,044), Wholesale (6,638) and Real Estate (5,383) employers receiving the largest number of PPP loans (see Chart 1).[ii]
Chart 1: Distribution of PPP Loans to New York City Employers, by Industry
| Industry | Total PPP Loans |
| Retail | 14,946 |
| Restaurants & Bars | 9,315 |
| Doctors’ Offices & Outpatient Clinics | 8,044 |
| Construction | 7,044 |
| Wholesale | 6,638 |
| Real Estate | 5,383 |
| Personal Services | 5,118 |
| Manufacturing | 4,274 |
| Management Consulting Services | 3,673 |
| Legal services | 3,275 |
| Tech | 2,970 |
| Architecture, Engineering & Design | 2,942 |
| Arts, Entertainment, Sports & Related Industries | 2,557 |
| Travel & Accommodations | 2,026 |
| Employment & Business Services | 1,946 |
While the PPP loan was largely created to help small businesses cover payroll and help them retain employees, “non-employers” – including sole proprietorships, the self-employed, and independent contractors – are also eligible. In total, there are approximately 240,355 PPP-eligible employers (e.g. those with fewer than 500 employees) and 946,373 non-employer businesses in New York City.[iii] PPP loans were received by 120,863 employee-based business and 25,073 “non-employer” businesses (see Chart 2).
Chart 2: Number of PPP Recipients and Eligible Businesses, by Borough and Business Type
| Boroughs | PPP Loans for Employer-Based Businesses | Small Businesses (Employers) | Share Receiving PPP Loan | PPP Loans for Non-employer Businesses | Non-employer Small Businesses | Share Receiving PPP Loan |
| Bronx | 7,329 | 18,251 | 40% | 2,248 | 120,174 | 2% |
| Brooklyn | 31,538 | 59,657 | 53% | 7,555 | 288,852 | 3% |
| Manhattan | 52,953 | 102,367 | 52% | 8,713 | 232,503 | 4% |
| Queens | 24,368 | 50,657 | 48% | 5,629 | 266,193 | 2% |
| Staten Island | 4,675 | 9,423 | 50% | 928 | 38,651 | 2% |
| New York City | 120,863 | 240,355 | 50% | 25,073 | 946,373 | 3% |
Drilling down further, we can see a wide distribution of establishments received PPP loans in each borough (see Chart 3). For instance, independent contractors, sole proprietorships, and self-employed individuals accounted for 23 percent of all PPP loans in the Bronx, compared to just 17 percent in Staten Island and 14 percent in Manhattan.
Nonprofits, meanwhile, did not fare well in any of the boroughs, but especially in the Bronx. In total, there are 6,000 nonprofits in Manhattan, 3,260 in Brooklyn, 1,904 in Queens, 1,378 in Bronx, and 520 in Staten Island.[iv] From this total, only 21 percent received PPP loans in the Bronx, 30 percent in Staten Island, 33 percent in Queens, 34 percent in Brooklyn, and 36 percent in Manhattan.
Chart 3: Distribution of PPP Loans, by Business Type and Borough
| Business Type | Bronx | Brooklyn | Manhattan | Queens | Staten Island | NYC |
| Corporation | 4,287 | 15,157 | 20,901 | 13,893 | 2,497 | 56,735 |
| Limited Liability Company | 1,156 | 8,365 | 17,360 | 3,905 | 861 | 31,647 |
| Subchapter S Corporation | 1,369 | 5,850 | 9,498 | 5,051 | 977 | 22,745 |
| Sole Proprietorship | 1,289 | 4,201 | 5,945 | 3,076 | 616 | 15,127 |
| Self-Employed Individuals | 608 | 2,083 | 1,628 | 1,597 | 161 | 6,077 |
| Nonprofit Organization | 287 | 1,086 | 2,145 | 618 | 156 | 4,292 |
| Independent Contractors | 351 | 1,271 | 1,140 | 956 | 151 | 3,869 |
| Partnership | 97 | 370 | 1,230 | 320 | 82 | 2,099 |
| Limited Liability Partnership | 30 | 229 | 799 | 146 | 38 | 1,242 |
| Cooperative | 45 | 171 | 439 | 193 | 29 | 877 |
| N/A | 24 | 115 | 300 | 127 | 10 | 576 |
| Professional Association | 30 | 178 | 242 | 102 | 23 | 575 |
| Nonprofit Childcare Center | 2 | 13 | 15 | 4 | 2 | 36 |
| Employee Stock Ownership Plan | 1 | 1 | 10 | 3 | 0 | 15 |
| Trust | 0 | 2 | 10 | 1 | 0 | 13 |
| Tenant in Common | 1 | 0 | 0 | 5 | 0 | 6 |
| Joint Venture | 0 | 1 | 4 | 0 | 0 | 5 |
| Total | 9,577 | 39,093 | 61,666 | 29,997 | 5,603 | 145,936 |
Looking more broadly, with roughly 1,186,728 New York City employer and non-employer businesses receiving 145,936 loans, approximately 12 percent received support from the Paycheck Protection Program. This compares unfavorably to the average among the 50 states, where all but North Carolina had a higher share of PPP recipients (see Chart 4). Leading the way were North Dakota (24 percent), South Dakota (24 percent), Nebraska (22 percent), Iowa (20 percent), Kansas (19 percent), Wyoming (18 percent), and Montana (17 percent).[v]
Chart 4: Share of Eligible Employer and Non-Employer Businesses that Received a PPP loan, by State
| State Rank | State | Share of Eligible Businesses Receiving a PPP Loan |
| 1 | North Dakota | 24% |
| 2 | South Dakota | 24% |
| 3 | Nebraska | 22% |
| 4 | Iowa | 20% |
| 5 | Kansas | 19% |
| 6 | Wyoming | 18% |
| 7 | Montana | 17% |
| 8 | Minnesota | 17% |
| 9 | Wisconsin | 17% |
| 10 | Maine | 17% |
| New York City | 12% | |
| 50 | North Carolina | 12% |
Meanwhile, zeroing in on the 240,355 employee-based businesses in New York City, there are some notable disparities between the boroughs and between industries. For instance, while approximately 53 percent of employee-based small businesses in Brooklyn, 52 percent in Manhattan, 50 percent in Staten Island, and 48 percent in Queens received a PPP loan, only 40 percent in the Bronx were PPP recipients (see Chart 5).
Chart 5: Share of Eligible Employer Businesses that Received a PPP loan, by Borough
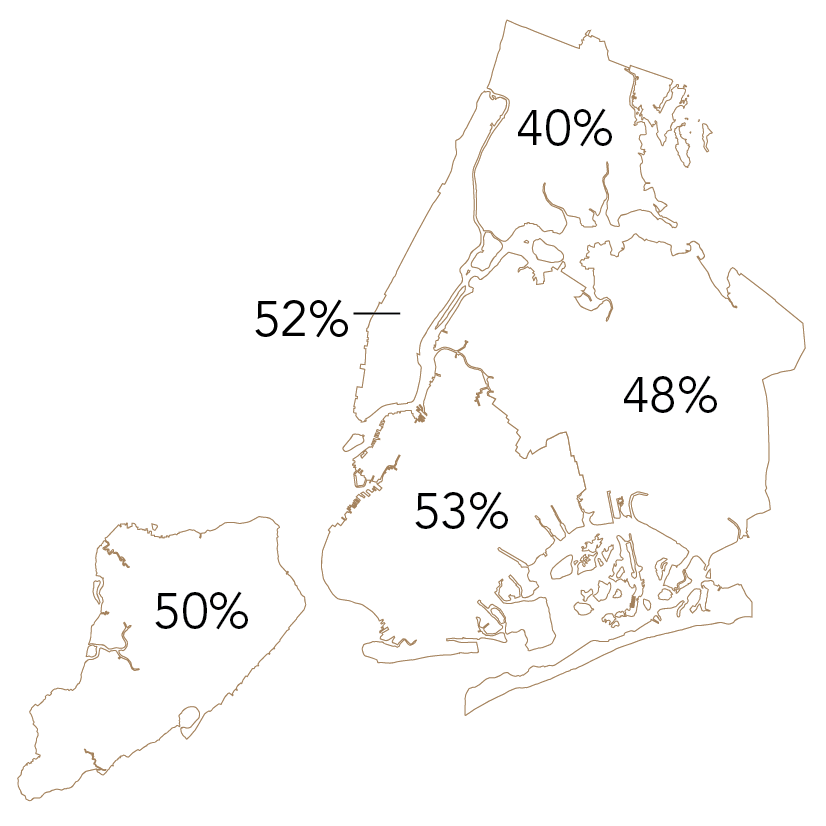
Chart 5
This varied significantly by industry, with 89 percent of Hotels, 88 percent of Manufacturing, 66 percent of Consulting firms, 60 percent of Newspaper, Book, & Directory Publishers, and 59 percent of Architecture, Engineering & Design small businesses receiving PPP loans. By contrast, only 28 percent of Real Estate, 24 percent of Civic, Professional & Advocacy Organizations & Grantmakers, 23 percent of Nursing Home & Mental Health Facilities, 21 percent of Social Services, and 19 percent of Finance small businesses were PPP recipients (see Chart 6).[vi]
Chart 6: Share of Eligible Employer Businesses that Received a PPP loan, by Industry and Borough
| Industry | Bronx | Brooklyn | Manhattan | Queens | Staten Island | NYC |
| Hotels | 89% | n/a | 85% | 90% | n/a | 89% |
| Manufacturing | 80% | 79% | n/a | 76% | n/a | 88% |
| Management Consulting Services | 64% | 69% | 68% | 59% | 53% | 66% |
| Newspaper, Book, & Directory Publishers | n/a | 80% | 55% | 56% | n/a | 60% |
| Architecture, Engineering & Design | 58% | 65% | 58% | 52% | 73% | 59% |
| Employment & Business Services | 67% | 79% | 48% | 69% | 85% | 57% |
| Legal Services | 50% | 59% | 55% | 55% | 53% | 55% |
| Film & Television | 57% | 60% | 51% | 46% | n/a | 53% |
| Personal Services | 46% | 54% | 57% | 47% | 58% | 53% |
| Advertising, PR, & Related Services | 67% | 64% | 51% | 55% | 27% | 53% |
| Arts & Entertainment | 59% | 58% | 47% | 65% | 53% | 51% |
| Doctors’ Offices & Outpatient Clinics | 39% | 46% | 56% | 50% | 47% | 50% |
| Accounting & Bookkeeping Services | 37% | 45% | 49% | 52% | 45% | 48% |
| Freight, Delivery & Warehousing | 50% | 43% | 65% | 44% | 50% | 47% |
| Construction | 43% | 44% | 60% | 43% | 44% | 46% |
| Wholesale | 52% | 51% | 44% | 39% | 49% | 45% |
| Retail | 38% | 43% | 46% | 42% | 39% | 43% |
| Insurance | 41% | 57% | 28% | 53% | 54% | 42% |
| Restaurants & Bars | 34% | 37% | 46% | 39% | 47% | 41% |
| Building & Security Services | 35% | 40% | 42% | 35% | 37% | 39% |
| Tech | 37% | 31% | 46% | 23% | 18% | 38% |
| Child care | 30% | 31% | 27% | 34% | 28% | 31% |
| Real Estate | 14% | 32% | 27% | 30% | 51% | 27% |
| Civic, Professional, & Advocacy Organizations & Grantmakers | 22% | 39% | 23% | 15% | 35% | 24% |
| Nursing Home & Mental Health Facilities | 16% | 27% | 18% | 25% | 15% | 22% |
| Social Services | 15% | 21% | 25% | 20% | 21% | 21% |
| Finance | 9% | 22% | 21% | 14% | 18% | 20% |
Lenders
In total, 899 unique banks and lenders provided 145,936 PPP loans to New York City businesses. Leading the way was JPMorgan (34,843 loans), which was responsible for 24 percent of all loans in the five boroughs. In fact, JPMorgan provided the most loans in every borough, across every major industry group, and among businesses receiving both larger and smaller loans (see Chart 7).
Chart 7: Distribution of PPP Loans, by Lender and Borough
| Bronx | Brooklyn | Manhattan | |||
| JPMorgan Chase Bank, National Association | 1,729 | JPMorgan Chase Bank, National Association | 9,023 | JPMorgan Chase Bank, National Association | 16,380 |
| Kabbage, Inc. | 1,191 | Cross River Bank | 4,116 | Citibank, N.A. | 4,910 |
| TD Bank, National Association | 750 | Kabbage, Inc. | 3,232 | Bank of America, National Association | 4,585 |
| Cross River Bank | 718 | TD Bank, National Association | 2,812 | TD Bank, National Association | 4,259 |
| Celtic Bank Corporation | 691 | Celtic Bank Corporation | 2,553 | Celtic Bank Corporation | 2,723 |
| Bank of America, National Association | 604 | Bank of America, National Association | 2,505 | Cross River Bank | 2,679 |
| Citibank, N.A. | 428 | Citibank, N.A. | 1,698 | Kabbage, Inc. | 2,210 |
| WebBank | 297 | WebBank | 1,471 | Signature Bank | 1,792 |
| Customers Bank | 207 | Customers Bank | 1,139 | WebBank | 1,398 |
| Ponce Bank | 196 | Signature Bank | 805 | HSBC Bank USA, National Association | 1,331 |
| All Loans | 9,577 | All Loans | 39,093 | All Loans | 61,666 |
| Queens | Staten Island | NYC | |||
| JPMorgan Chase Bank, National Association | 6,870 | JPMorgan Chase Bank, National Association | 841 | JPMorgan Chase Bank, National Association | 34,843 |
| TD Bank, National Association | 2,968 | TD Bank, National Association | 655 | TD Bank, National Association | 11,444 |
| Kabbage, Inc. | 2,883 | Northfield Bank | 408 | Cross River Bank | 9,989 |
| Cross River Bank | 2,195 | Santander Bank, National Association | 402 | Kabbage, Inc. | 9,827 |
| Celtic Bank Corporation | 1,854 | Victory State Bank | 344 | Bank of America, National Association | 9,641 |
| Bank of America, National Association | 1,717 | Kabbage, Inc. | 311 | Citibank, N.A. | 8,862 |
| Citibank, N.A. | 1,584 | Cross River Bank | 281 | Celtic Bank Corporation | 8,047 |
| WebBank | 1,117 | Empire State Bank | 271 | WebBank | 4,447 |
| Capital One, National Association | 760 | Citibank, N.A. | 242 | Signature Bank | 3,353 |
| Customers Bank | 604 | Bank of America, National Association | 230 | Customers Bank | 2,936 |
| All Loans | 29,997 | All Loans | 5,603 | All Loans | 145,936 |
Looking at loan size, there are some interesting differences between those banks that reached smaller firms and those that did not. Most notably, financial technology companies like Kabbage provided more loans of less than $150,000 than any other firm with the exception of JPMorgan Chase and TD Bank (see Chart 8).
Chart 8: Distribution of PPP Loans, by Lender and Loan Size
| Loan of Less than $150k | Loan of More than $150k | ||
| JPMorgan Chase Bank, National Association | 28,759 | JPMorgan Chase Bank, National Association | 6,084 |
| TD Bank, National Association | 10,017 | Signature Bank | 1,428 |
| Kabbage, Inc. | 9,676 | TD Bank, National Association | 1,427 |
| Cross River Bank | 9,510 | Citibank, N.A. | 1,376 |
| Bank of America, National Association | 8,455 | Bank of America, National Association | 1,186 |
| Celtic Bank Corporation | 7,769 | HSBC Bank USA, National Association | 571 |
| Citibank, N.A. | 7,486 | Cross River Bank | 479 |
| WebBank | 4,338 | Capital One, National Association | 351 |
| Customers Bank | 2,705 | Manufacturers and Traders Trust Company | 343 |
| Capital One, National Association | 2,221 | City National Bank | 334 |
| Grand Total | 124,077 | Grand Total | 21,859 |
Endnotes
[i] U.S. Department of Treasure. “SBA Paycheck Protection Program Loan Level Data,” July 6, 2020. https://home.treasury.gov/policy-issues/cares-act/assistance-for-small-businesses/sba-paycheck-protection-program-loan-level-data
[ii] Industries correspond to the following NAICS Codes. Accounting and bookkeeping services: 5412, 5418, 5413, and 5414; Building and Security Services: 5616 and 5617; Childcare: 6244; Construction: 23; Doctors’ Offices and Outpatient Clinics: 6211, 6212, 6213, and 6214; Film and Television: 51211; Finance: 521, 522, 523, and 5259; Freight, Delivery, and Warehousing: 4883, 4885, 482, 483, 484, 491, 492, and 493; Home Healthcare: 6216; Hospitals: 6221; Insurance: 524 and 5251; Legal services: 5411; Management Consulting Services: 5416; Manufacturing: 31- 33; Newspaper, book, and directory publishers: 5111, 6231, 6232, 6233, and 6239; Real Estate: 5311, 5312, and 5313; Retail: 44-45; Social Services: 6241, 6242, and 6243; Tech: 334, 51913, 454110, 518, 5112, 5415, and 5417; Wholesale: 42.
[iii] While Paycheck Protection Program loans were distributed in 2020, the most recently available business data is from 2018. This will explain some minor discrepancies and omissions in the analysis. Data on employer based businesses with less than 500 employees is drawn from the United State Census Bureau’s “County Business Patterns, 2018” dataset. Data on non-employer businesses is drawn from the United State Census Bureau’s “Non-employer Statistics, 2018,” dataset.
[iv] Office of the New York City Comptroller. “The Economic Impact of NYC Nonprofit Organizations,” July 2, 2020.
[v] See Note iii
[vi] See Note ii