The Gap is Still Growing: New York City’s Continuing Housing Affordability Challenge
Revised 9/26/2018
Introduction
In April 2014, the Office of New York City Comptroller Scott M. Stringer published The Growing Gap: New York City’s Housing Affordability Challenge. Reviewing census bureau data, The Growing Gap documented a substantial shift in the cost of housing in New York City between 2000 and 2012. During that period, more than 400,000 apartments renting for less than $1,000 disappeared from the inventory, as median rents were pushed higher by 75 percent.
In this update to that report, we have updated our analysis using estimates from the most recent New York City Housing and Vacancy Survey (HVS) for 2017. We find that the disappearance of modestly-priced rental units has continued, leaving the City’s lowest-income households with fewer and fewer options for affordable housing.
A Declining Number of Affordable, Low-Cost Units
Between 2005 and 2017, rising rents led to the disappearance of over 425,000 apartments renting for $900 or less (in 2017 dollars) from the City’s housing inventory. Over half of these units – 55 percent, or more than 235,000 apartments – saw their rents increase to between $1,051 and $1,650. Apartments renting for over $2,700 per month more than doubled, increasing by approximately 111,000 units (Fig. 1).
This substantial shift in the price distribution of rental apartments away from lower-priced units, to more middle- and high-rent units is illustrated in Fig. 2. In 2005, 78.4 percent of rental apartments in NYC rented for $1,200 or less. By 2017, just 60 percent of apartments rented for that amount. Meanwhile, the number of apartments renting for more than $2,700 per month shot up from just 3.9 percent of the inventory, to 9.0 percent of all apartments. This rise in housing costs was seen across all five boroughs, although Manhattan was the only borough with a loss of low-cost rental units that exceeded its gain of higher-cost rental units.
One factor that may have contributed to the rising cost of housing is that the supply of housing has failed to keep up with the continuing growth in the City’s population. Between 2005 and 2016, the City added an estimated 576,000 residents – but a mere 76,211 net new units of occupied rental housing. Between 2011 and 2017, the number of occupied rental units actually declined (insignificantly – 942 units), while the total available rental inventory (both occupied and unoccupied units) rose by a mere 0.5% or 10,430 units.
In contrast, the number of unavailable units rose by 51%, from 164,467 in 2011 to 247,977 in 2017. The most common reasons apartments were considered not available was that they were awaiting or undergoing renovation (32 percent of unavailable units) or were held for occasional, seasonal, or recreational use (30.5 percent of unavailable units).
Fig. 1: Net Losses and Gains by Monthly Rent, 2005-2017
Inflation-adjusted 2017 dollars
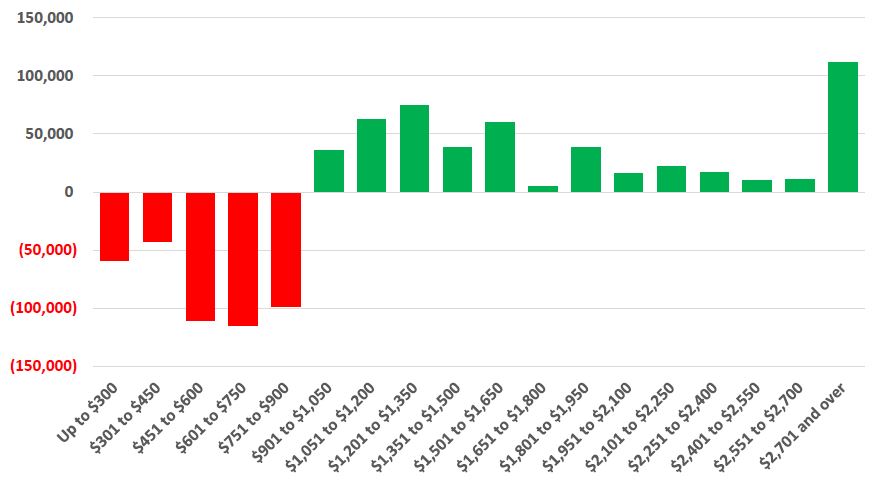
Source: New York City Comptroller’s Office from HVS microdata.
Fig. 2: Changing Distribution of Units by Monthly Rent, 2005-2017
Inflation-adjusted 2017 dollars
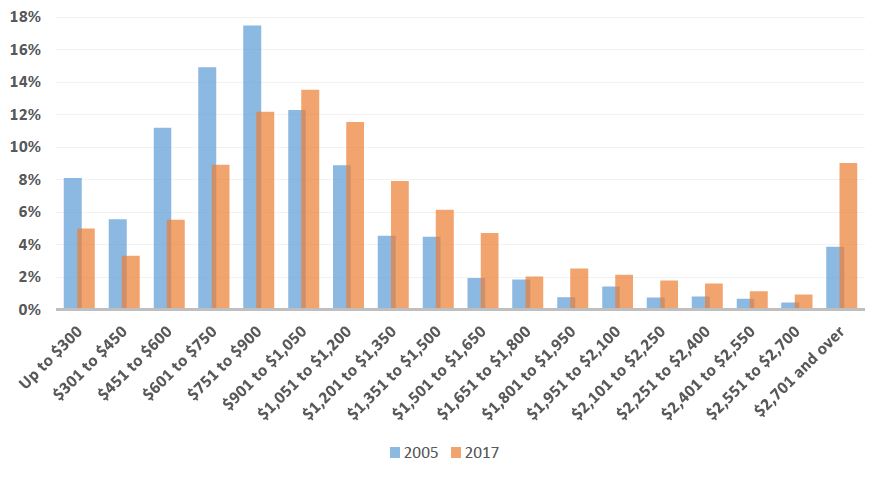
Source: New York City Comptroller’s Office from HVS microdata
The Continuing Erosion of Rent-Regulated Housing
Contributing to this broad shift toward higher cost housing over this period was a continued erosion in the inventory of rent-regulated housing. Rent regulation continues to be an important part of the City’s affordable housing inventory, with housing subject to regulation comprising the majority of units renting for between $601 and $1,800 (Fig. 3).
Fig. 3: Rental Units by Monthly Rent and Regulatory Status, 2017
Inflation-adjusted 2017 dollars
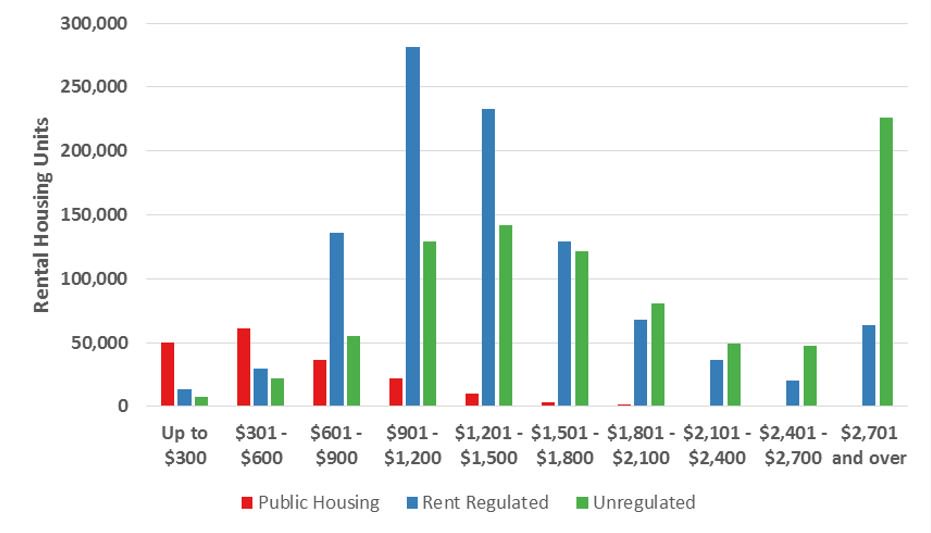
Source: New York City Comptroller’s Office from HVS microdata.
Note: “Rent-regulated” refers to rent-stabilized, rent-controlled, and Mitchell-Lama rental units.
However, the City lost 88,518 units of rent-regulated housing between 2005 and 2017 – more than the entire addition to the stock of occupied rental housing. More regulated units were removed from the inventory than were added in every year except 2017, when a large number of rental units were stabilized after the renewal of the 421-a program (Fig. 4).
Fig. 4: Additions and Subtractions to Rent-Stabilized Housing Inventory, 2005-2017
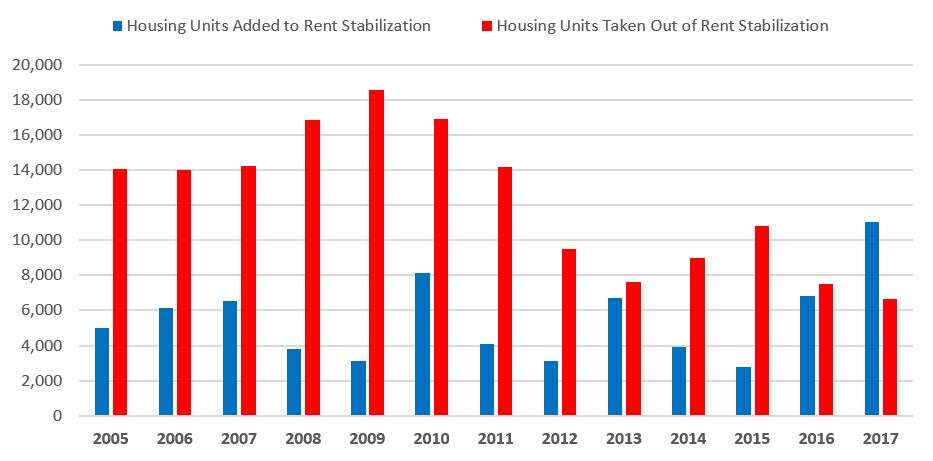
Source: New York City Rent Guidelines Board
The rate at which housing units have been removed from rent stabilization has declined since peaking at over 18,500 in 2009, averaging 8,300 units per year from 2013 through 2017.
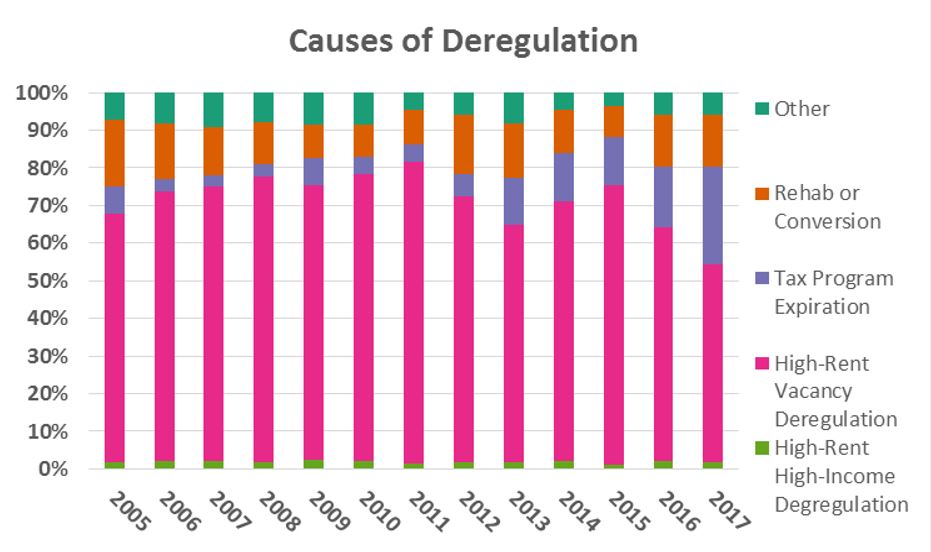
High-rent vacancy deregulation, under which a unit can exit rent stabilization when a tenant chooses not to renew their lease and if that unit’s maximum legal rent exceeds a deregulation threshold set by the State, was by far the biggest contributor to the loss of rent-stabilized housing during this period, as show in Fig. 5. But higher deregulation thresholds enacted in 2011 and 2015 may have contributed to noticeable dips in the number and share of deregulated units attributable to high-rent vacancy deregulation in the years immediately following passage.
The increased threshold for high-rent vacancy decontrol, which rose from $2,000 to $2,500 in 2011, and to $2,700 in 2015, may also explain why three-quarters of units renting for over $2,700 were unregulated in 2017,up from 60 percent in 2005, as owners of rent stabilized units chase increasingly rising decontrol thresholds.[1]
Fig. 5: Causes of Deregulation, 2005-2017
Source: New York City Rent Guidelines Board
[1] The Rent Act of 2015 mandates that the threshold for high-rent vacancy deregulation be adjusted each year based on the percentage change to one year leases passed by the Rent Guidelines Board in the previous year. As of January 1, 2018 the deregulation threshold was adjusted upwards to $2,733.75 per month.