The Impact of Airbnb on NYC Rents
Introduction
New York City has been suffering through an affordable housing crisis for years. Between 2011 and 2017, New York City lost nearly 183,000 affordable units of housing renting for less than $1,000 – larger than the entire public housing stock. Affordable housing is increasingly hard to find, with vacancy rates for apartments renting for less than $1,000 at 1.54%.[1] Homelessness stands at a record high, with over 60,000 homeless people sleeping in shelters every night. Meanwhile, wages are stagnant and rents continue to climb in all five boroughs.
The rising popularity of homesharing websites such as Airbnb is adding to the problem.[2] The trendy replacement for hotels and hostels in effect removes housing units from the overall supply – units that might otherwise be available to rent to New Yorkers looking to rent an apartment. The most basic concept in the field of economics – supply and demand – says that, everything else equal, a reduction in supply will lead to higher prices. This report, by Comptroller Scott M. Stringer, evaluates the impact of homesharing on rents in New York City over the period 2009 to 2016.
Background
Between 2009 and 2016, rents rose 25% on average citywide, or $279 per month. Rents rose most rapidly in Brooklyn, by 35% ($340 per month) followed by Queens by 22% ($242 per month); Bronx by 21% ($171 per month); Manhattan by 19% ($276 per month); and Staten Island by 14% ($129 per month).[3]
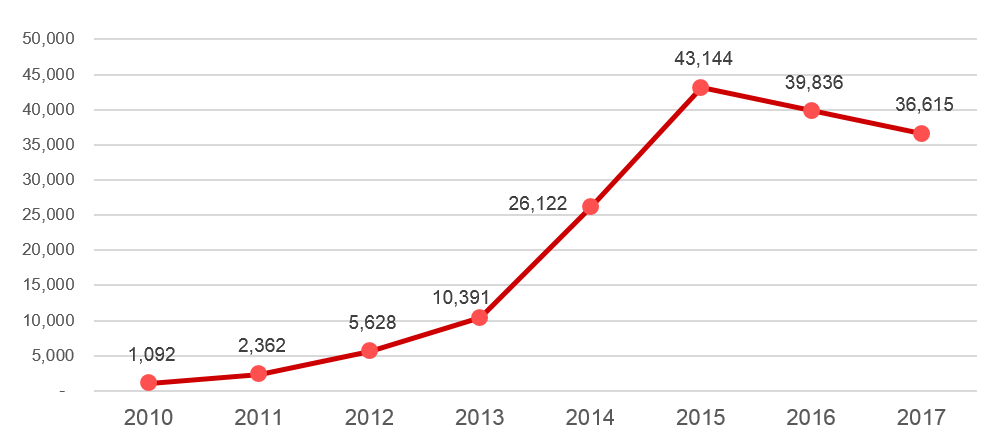
During the same period, Airbnb listings skyrocketed, from 1,000 in 2010 to over 43,000 in 2015, before declining to slightly under 40,000 in 2016 according to data from AirDNA (Figure 1) – most in violation of existing State or City laws.[4] Airbnb listings are most heavily concentrated in Manhattan (52% of all listings in 2016) and Brooklyn (35% of all listings in 2016), but are found in every borough. Airbnb listings are particularly concentrated in Manhattan below 59th Street, including Chelsea, Clinton and Midtown Business District (11.3% of all listings in 2016), Battery Park City, Greenwich Village and Soho (7.9%), Chinatown and Lower East Side (6.9%), Murray Hill, Gramercy and Stuyvesant Town (5.9%) as well as parts of Brooklyn including Greenpoint and Williamsburg (8.3%), Bedford-Stuyvesant (5.1%), and Bushwick (5.0%).
Rents in these eight neighborhoods rose at substantially higher rates than the borough average between 2009 and 2016. Average monthly rent in Greenpoint and Williamsburg went up by 62.6% ($659 per month), by 47.2% in Bedford-Stuyvesant ($407 per month), by 39.5% in Bushwick ($369 per month), by 25.9% Murray Hill, Gramercy and Stuyvesant Town ($488 per month), by 23.4% in Chelsea, Clinton and Midtown Business District ($398 per mont), by 23% in Chinatown and Lower East Side ($242 per month), and by 21.4% in Battery Park City, Greenwich Village and Soho ($411 per month).
Figure 1: Airbnb Total Listings by Year, 2010 – 2017
Findings
We sought to estimate the impact that Airbnb listings have had on neighborhood rents.
Utilizing neighborhood level data for the years 2009 to 2016, we found that:
- For each one percent of all residential units in a neighborhood listed on Airbnb, rental rates in that neighborhood went up by 1.58 percent.
- Between 2009 and 2016, approximately 9.2 percent of the citywide increase in rental rates can be attributed to Airbnb.
- Airbnb listings were heavily concentrated in parts of Manhattan and Brooklyn and had a greater impact on these neighborhoods. Approximately 20% of the increase in rental rates was due to Airbnb listings in midtown and lower Manhattan including neighborhoods such as Chelsea, Clinton, and Midtown Business District; Murray Hill, Gramercy, and Stuyvesant Town; Chinatown and Lower East Side; Battery Park City, Greenwich Village, and Soho as well as parts of Brooklyn including Greenpoint and Williamsburg.
- In aggregate, New York City renters had to pay an additional $616 million in 2016 due to price pressures created by Airbnb, with half of the increase concentrated in the neighborhoods highlighted above.
Data and Methodology
We obtained Airbnb listings data from AirDNA (https://www.airdna.co/), which scrapes listings data on a daily basis from Airbnb. We gathered zip code level data going back to 2010 when Airbnb first listed dwellings in New York City, through the end of 2017. We then summed the data to the neighborhood level, defined by Census Bureau Public Use Microdata Area (PUMA).[5] Whenever a zip code crossed PUMA boundaries, we used 2010 population ratios as weights to divide the number of listings between PUMAs. The number of unique listings in New York City peaked in 2015 at just over 43,000 and dropped to under 37,000 by 2017.
Rental rate data comes from the annual American Community Survey (2009-16). We use average monthly gross rent for all renters as our rent measure.[6] We also control for neighborhood level economic and demographic characteristics using data from the American Community Survey.
We pooled eight years of data for 55 neighborhoods, bringing our total number of observations to 440. The dependent variable is the logarithm of average monthly gross rent by neighborhood in a given year. The independent variable with the coefficient of interest is the share of residential units listed on Airbnb which is calculated by dividing annual unique Airbnb listings in the neighborhood by total residential units in the same neighborhood.[7] We also control for demographic and economic changes in neighborhood level by including average household income (in log form), population (in log form), and the shares of college-educated and employed residents in the neighborhood. We also included year and neighborhood-level fixed effects (dummy) variables to control for otherwise uncontrolled-for trends and neighborhood characteristics.
A summary of the regression results is presented in Table 1. We find that as the share of units listed on Airbnb goes up by one percentage point, rental rates in the neighborhood go up by 1.58 percent, after controlling for neighborhood level demographic and economic changes. The result is statistically significant at the 1-percent level. Coefficients of other control variables including household income, population and share of college graduates are positive and statistically significant at 1-percent level. Employment rate is not statistically different from zero.
In order to calculate the Airbnb contribution to total change in rents, we first predict the change in PUMA level average gross rents from 2009 to 2016 using the regression model coefficients with existing conditions (i.e. with existing demographic and economic conditions as well as Airbnb listings). We then compare these predictions with an alternative prediction in which Airbnb listings are set to zero throughout the entire time period. The difference between the latter and the former gives the rent change associated with Airbnb growth in the neighborhood. Results are reported in Table 2 (column labeled “Total Annual Rental Cost of Airbnb to the Neighborhood”), which shows rental change associated with increase in Airbnb listings at PUMA level. With existing conditions, from 2009 to 2016, citywide annual gross rents were predicted to go up by 25.3% (approximately $6.67 billion). If, however, there were no Airbnb listings, the rents would be predicted to go up by 23% (approximately $6.06 billion). Therefore, approximately $616 million, or 9.2 percent of the overall increase in rents for the period may be attributed to the rise in Airbnb listings.
Airbnb growth, however, was particularly high in certain neighborhoods. For instance, the share of Airbnb listings reached 4.1% of residential units in the Chelsea, Clinton & Midtown Business District neighborhood and 4.6% in Greenpoint and Williamsburg. The largest relative Airbnb effects on the rental market occurred in Chelsea, Clinton & Midtown Business District (21.6%) and Murray Hill, Gramercy & Stuyvesant Town (21.5%). Average monthly rents went up by in these neighborhoods by $398 and $488 respectively out of which $86 and $105 per month could be attributed to Airbnb growth. The largest absolute effect occurred in Greenpoint and Williamsburg where average rents increased by $659 between 2009 and 2016, of which $123 can be attributed to Airbnb growth.
Table 1: Regression Results
Dependent Variable: Logarithm of Average Rental Rate
| Variables | Fixed Effects Model |
| AirBnb Share | 1.584***
(0.389) |
| Household Income (log) | 0.152***
(0.0349) |
| Population (log) | 0.194***
(0.0421) |
| Share of College Graduates | 0.436***
(0.109) |
| Employment Rate | 0.154
(0.111) |
| Constant | 2.760***
(0.554) |
| Observations | 440 |
| Number of PUMAs | 55 |
| R-squared | 0.836 |
| PUMA FE | YES |
| Year FE | YES |
NOTE: Standard errors in parentheses
*** p<0.01, ** p<0.05, * p<0.1
Table 2: Neighborhood Results
| PUMA Code | Neighborhood Name | Rental Units (2016) |
Airbnb Listings (2016) | Monthly Rent (2009) |
Monthly Rent (2016) |
Change in Monthly Rent (2009-16) |
Change due to Airbnb (in $) | % Change associated with Airbnb | Total Annual Rental Cost of Airbnb to the Neighborhood |
| 4001 | Greenpoint & Williamsburg | 45,147 | 3,296 | $1,054 | $1,713 | $659 | $123 | 18.6% | $66,401,795 |
| 3808 | Murray Hill, Gramercy & Stuyvesant Town | 54,579 | 2,355 | $1,887 | $2,375 | $488 | $105 | 21.5% | $68,820,035 |
| 3807 | Chelsea, Clinton & Midtown Business District | 59,679 | 4,486 | $1,697 | $2,095 | $398 | $86 | 21.6% | $61,451,469 |
| 3810 | Battery Park City, Greenwich Village & Soho | 51,596 | 3,123 | $1,916 | $2,327 | $411 | $79 | 19.3% | $49,121,185 |
| 4003 | Bedford-Stuyvesant | 34,555 | 2,047 | $863 | $1,270 | $407 | $59 | 14.4% | $24,288,659 |
| 4002 | Bushwick | 36,052 | 1,990 | $935 | $1,304 | $369 | $58 | 15.6% | $24,984,861 |
| 4004 | Brooklyn Heights & Fort Greene | 34,811 | 1,321 | $1,270 | $1,779 | $510 | $54 | 10.7% | $22,737,172 |
| 3809 | Chinatown & Lower East Side | 60,180 | 2,746 | $1,052 | $1,294 | $242 | $47 | 19.6% | $34,252,965 |
| 3805 | Upper East Side | 78,130 | 1,803 | $1,780 | $2,158 | $378 | $43 | 11.3% | $40,027,985 |
| 3802 | Hamilton Heights, Manhattanville & West Harlem | 37,380 | 1,433 | $1,093 | $1,338 | $245 | $39 | 15.9% | $17,452,649 |
| 4005 | Park Slope, Carroll Gardens & Red Hook | 30,750 | 787 | $1,593 | $1,906 | $312 | $39 | 12.4% | $14,341,390 |
| 4006 | Crown Heights North & Prospect Heights | 38,532 | 1,238 | $931 | $1,307 | $376 | $39 | 10.4% | $18,131,790 |
| 3806 | Upper West Side & West Side | 68,920 | 1,750 | $1,722 | $2,012 | $290 | $32 | 11.1% | $26,613,050 |
| 4101 | Astoria & Long Island City | 58,653 | 1,239 | $1,075 | $1,386 | $311 | $29 | 9.2% | $20,092,964 |
| 3803 | Central Harlem | 41,832 | 1,119 | $798 | $1,084 | $287 | $28 | 9.8% | $14,118,122 |
| 4109 | Sunnyside & Woodside | 36,068 | 647 | $1,292 | $1,608 | $317 | $22 | 6.9% | $9,431,814 |
| 3801 | Washington Heights, Inwood & Marble Hill | 60,473 | 995 | $935 | $1,214 | $279 | $21 | 7.5% | $15,253,929 |
| 4011 | Crown Heights South, Prospect Lefferts & Wingate | 32,957 | 585 | $938 | $1,213 | $275 | $20 | 7.4% | $8,067,130 |
| 4012 | Sunset Park & Windsor Terrace | 33,528 | 394 | $991 | $1,312 | $321 | $20 | 6.2% | $7,991,986 |
| 4014 | Borough Park, Kensington & Ocean Parkway | 31,126 | 263 | $988 | $1,405 | $417 | $19 | 4.6% | $7,113,264 |
| 4110 | Ridgewood, Glendale & Middle Village | 35,651 | 464 | $1,049 | $1,375 | $326 | $14 | 4.3% | $5,989,498 |
| 3804 | East Harlem | 37,814 | 1,003 | $831 | $960 | $129 | $13 | 10.4% | $6,114,647 |
| 4015 | Flatbush & Midwood | 41,110 | 396 | $935 | $1,196 | $261 | $13 | 5.1% | $6,618,526 |
| 4108 | Forest Hills & Rego Park | 27,313 | 216 | $1,241 | $1,600 | $359 | $12 | 3.5% | $4,088,401 |
| 4007 | Brownsville & Ocean Hill | 33,250 | 404 | $705 | $886 | $181 | $10 | 5.3% | $3,817,643 |
| 4010 | East Flatbush, Farragut & Rugby | 29,698 | 256 | $929 | $1,192 | $264 | $10 | 3.7% | $3,488,963 |
| 4013 | Bay Ridge & Dyker Heights | 27,982 | 195 | $1,070 | $1,354 | $284 | $9 | 3.2% | $3,041,981 |
| 4103 | Flushing, Murray Hill & Whitestone | 48,979 | 292 | $1,177 | $1,368 | $191 | $7 | 3.7% | $4,104,914 |
| 4107 | Elmhurst & South Corona | 33,304 | 190 | $1,115 | $1,320 | $205 | $7 | 3.5% | $2,895,541 |
| 4008 | East New York & Starrett City | 37,776 | 268 | $839 | $1,021 | $182 | $6 | 3.4% | $2,794,966 |
| 4016 | Sheepshead Bay, Gerritsen Beach & Homecrest | 27,490 | 167 | $918 | $1,222 | $303 | $6 | 1.9% | $1,880,709 |
| 4102 | Jackson Heights & North Corona | 32,819 | 228 | $1,131 | $1,288 | $157 | $6 | 3.9% | $2,389,733 |
| 4106 | Briarwood, Fresh Meadows & Hillcrest | 28,452 | 100 | $1,064 | $1,448 | $384 | $5 | 1.2% | $1,597,232 |
| 4114 | Far Rockaway, Breezy Point & Broad Channel | 22,373 | 177 | $856 | $995 | $139 | $5 | 3.5% | $1,302,810 |
| 3701 | Riverdale, Fieldston & Kingsbridge | 27,564 | 95 | $1,011 | $1,225 | $214 | $4 | 1.7% | $1,211,959 |
| 4009 | Canarsie & Flatlands | 27,002 | 146 | $1,000 | $1,242 | $242 | $4 | 1.6% | $1,236,019 |
| 4104 | Bayside, Douglaston & Little Neck | 12,621 | 83 | $1,269 | $1,542 | $273 | $4 | 1.6% | $667,138 |
| 4111 | Richmond Hill & Woodhaven | 23,544 | 126 | $1,132 | $1,354 | $222 | $4 | 1.9% | $1,169,156 |
| 3704 | Pelham Parkway, Morris Park & Laconia | 29,595 | 72 | $887 | $1,126 | $239 | $3 | 1.3% | $1,087,022 |
| 3903 | Port Richmond, Stapleton & Mariners Harbor | 26,520 | 125 | $855 | $1,061 | $207 | $3 | 1.5% | $1,013,387 |
| 4018 | Brighton Beach & Coney Island | 32,416 | 119 | $770 | $946 | $177 | $3 | 1.5% | $1,040,590 |
| 3706 | Bedford Park, Fordham North & Norwood | 39,929 | 66 | $854 | $1,032 | $178 | $2 | 1.1% | $942,338 |
| 3707 | Morris Heights, Fordham South & Mount Hope | 41,468 | 54 | $777 | $970 | $193 | $2 | 1.1% | $1,029,003 |
| 3708 | Concourse, Highbridge & Mount Eden | 40,145 | 86 | $750 | $934 | $184 | $2 | 1.2% | $1,095,031 |
| 3709 | Castle Hill, Clason Point & Parkchester | 50,936 | 64 | $819 | $1,025 | $206 | $2 | 0.8% | $1,006,744 |
| 3710 | Hunts Point, Longwood & Melrose | 42,778 | 114 | $653 | $811 | $158 | $2 | 1.1% | $876,036 |
| 4017 | Bensonhurst & Bath Beach | 34,275 | 87 | $899 | $1,214 | $314 | $2 | 0.7% | $941,936 |
| 4105 | Queens Village, Cambria Heights & Rosedale | 16,594 | 108 | $1,178 | $1,325 | $147 | $2 | 1.4% | $410,678 |
| 4112 | Jamaica, Hollis & St. Albans | 32,053 | 142 | $990 | $1,146 | $156 | $2 | 1.3% | $801,327 |
| 3702 | Wakefield, Williamsbridge & Woodlawn | 27,747 | 62 | $966 | $1,092 | $126 | $1 | 1.0% | $402,301 |
| 3703 | Co-op City, Pelham Bay & Schuylerville | 22,244 | 37 | $970 | $1,095 | $125 | $1 | 0.8% | $251,180 |
| 3705 | Belmont, Crotona Park East & East Tremont | 47,005 | 70 | $712 | $838 | $126 | $1 | 0.7% | $506,036 |
| 4113 | Howard Beach & Ozone Park | 11,866 | 58 | $1,139 | $1,254 | $114 | $1 | 1.0% | $167,533 |
| 3901 | Tottenville, Great Kills & Annadale | 8,205 | 20 | $1,094 | $1,074 | ($19) | $0 | 0.3% | ($4,864) |
| 3902 | New Springville & South Beach | 12,239 | 53 | $1,048 | $1,109 | $61 | $0 | 0.8% | $72,989 |
Acknowledgements
The Comptroller wishes to thanks Selçuk Eren, senior economist in the Bureau of Budget, for his work on this report, as well as Lawrence Mielnicki, Chief Economist, and Preston Niblack, Deputy Comptroller for Budget.
Appendix
Table A:1: Residential Units and Airbnb Listings by Neighborhood, 2016
| PUMA Code | Neighborhood Name | Airbnb listings (2016) | Residential Units (2016) | Airbnb Share (2016) |
| 3701 | Riverdale, Fieldston & Kingsbridge | 95 | 50,560 | 0.2% |
| 3702 | Wakefield, Williamsbridge & Woodlawn | 62 | 53,892 | 0.1% |
| 3703 | Co-op City, Pelham Bay & Schuylerville | 37 | 49,029 | 0.1% |
| 3704 | Pelham Parkway, Morris Park & Laconia | 72 | 50,610 | 0.1% |
| 3705 | Belmont, Crotona Park East & East Tremont | 70 | 70,636 | 0.1% |
| 3706 | Bedford Park, Fordham North & Norwood | 66 | 50,419 | 0.1% |
| 3707 | Morris Heights, Fordham South & Mount Hope | 54 | 52,433 | 0.1% |
| 3708 | Concourse, Highbridge & Mount Eden | 86 | 55,131 | 0.2% |
| 3709 | Castle Hill, Clason Point & Parkchester | 64 | 68,096 | 0.1% |
| 3710 | Hunts Point, Longwood & Melrose | 114 | 67,852 | 0.2% |
| 3801 | Washington Heights, Inwood & Marble Hill | 995 | 84,947 | 1.2% |
| 3802 | Hamilton Heights, Manhattanville & West Harlem | 1,433 | 61,784 | 2.3% |
| 3803 | Central Harlem | 1,119 | 67,946 | 1.6% |
| 3804 | East Harlem | 1,003 | 61,588 | 1.6% |
| 3805 | Upper East Side | 1,803 | 137,519 | 1.3% |
| 3806 | Upper West Side & West Side | 1,750 | 125,673 | 1.4% |
| 3807 | Chelsea, Clinton & Midtown Business District | 4,486 | 108,218 | 4.1% |
| 3808 | Murray Hill, Gramercy & Stuyvesant Town | 2,355 | 101,111 | 2.3% |
| 3809 | Chinatown & Lower East Side | 2,746 | 91,149 | 3.0% |
| 3810 | Battery Park City, Greenwich Village & Soho | 3,123 | 95,239 | 3.3% |
| 3901 | Tottenville, Great Kills & Annadale | 20 | 62,339 | 0.0% |
| 3902 | New Springville & South Beach | 53 | 54,777 | 0.1% |
| 3903 | Port Richmond, Stapleton & Mariners Harbor | 125 | 68,653 | 0.2% |
| 4001 | Greenpoint & Williamsburg | 3,296 | 71,055 | 4.6% |
| 4002 | Bushwick | 1,990 | 54,560 | 3.6% |
| 4003 | Bedford-Stuyvesant | 2,047 | 59,405 | 3.4% |
| 4004 | Brooklyn Heights & Fort Greene | 1,321 | 76,011 | 1.7% |
| 4005 | Park Slope, Carroll Gardens & Red Hook | 787 | 52,216 | 1.5% |
| 4006 | Crown Heights North & Prospect Heights | 1,238 | 62,837 | 2.0% |
| 4007 | Brownsville & Ocean Hill | 404 | 56,542 | 0.7% |
| 4008 | East New York & Starrett City | 268 | 63,601 | 0.4% |
| 4009 | Canarsie & Flatlands | 146 | 71,956 | 0.2% |
| 4010 | East Flatbush, Farragut & Rugby | 256 | 56,163 | 0.5% |
| 4011 | Crown Heights South, Prospect Lefferts & Wingate | 585 | 48,350 | 1.2% |
| 4012 | Sunset Park & Windsor Terrace | 394 | 51,043 | 0.8% |
| 4013 | Bay Ridge & Dyker Heights | 195 | 52,955 | 0.4% |
| 4014 | Borough Park, Kensington & Ocean Parkway | 263 | 47,063 | 0.6% |
| 4015 | Flatbush & Midwood | 396 | 62,138 | 0.6% |
| 4016 | Sheepshead Bay, Gerritsen Beach & Homecrest | 167 | 63,169 | 0.3% |
| 4017 | Bensonhurst & Bath Beach | 87 | 69,620 | 0.1% |
| 4018 | Brighton Beach & Coney Island | 119 | 52,290 | 0.2% |
| 4101 | Astoria & Long Island City | 1,239 | 84,838 | 1.5% |
| 4102 | Jackson Heights & North Corona | 228 | 61,099 | 0.4% |
| 4103 | Flushing, Murray Hill & Whitestone | 292 | 97,693 | 0.3% |
| 4104 | Bayside, Douglaston & Little Neck | 83 | 46,865 | 0.2% |
| 4105 | Queens Village, Cambria Heights & Rosedale | 108 | 67,354 | 0.2% |
| 4106 | Briarwood, Fresh Meadows & Hillcrest | 100 | 65,384 | 0.2% |
| 4107 | Elmhurst & South Corona | 190 | 48,613 | 0.4% |
| 4108 | Forest Hills & Rego Park | 216 | 57,309 | 0.4% |
| 4109 | Sunnyside & Woodside | 647 | 61,224 | 1.1% |
| 4110 | Ridgewood, Glendale & Middle Village | 464 | 68,089 | 0.7% |
| 4111 | Richmond Hill & Woodhaven | 126 | 49,917 | 0.3% |
| 4112 | Jamaica, Hollis & St. Albans | 142 | 79,376 | 0.2% |
| 4113 | Howard Beach & Ozone Park | 58 | 41,837 | 0.1% |
| 4114 | Far Rockaway, Breezy Point & Broad Channel | 177 | 51,028 | 0.3% |
[1] Source: Department of Housing Preservation and Development: Selected Initial Findings of the 2017 New York City Housing and Vacancy Survey (dated February 9, 2018) (http://www1.nyc.gov/assets/hpd/downloads/pdf/about/2017-hvs-initial-findings.pdf).
[2] There are other homesharing websites, including HomeAway and VRBO, which have smaller presences in the City and for which listings data was not available. They were therefore not included in this analysis. Presumably their inclusion would have amplified the results.
[3] Source: U.S. Census Bureau, American Community Survey, 2009-2016.
[4] A report by Attorney General Eric Schneiderman found that 72% of short-term rentals on Airbnb appeared to be illegal (https://ag.ny.gov/pdfs/AIRBNB%20REPORT.pdf)
[5] PUMAs are geographic units used by the US Census for providing statistical and demographic information. Each PUMA contains at least 100,000 people. There are 55 PUMAs in New York City. See https://www.census.gov/geo/reference/puma.html for more details.
[6] Gross monthly rent includes contract rent, utility costs, and fuel costs. Gross monthly rent amounts are more comparable across time and households than contract rent which may or may not include utilities and fuels.
[7] A table with Airbnb listings, Residential Units and Airbnb Share by PUMA in 2016 can be found in the Appendix.