New Comptroller Stringer Analysis Reveals Full Scale of Retail Vacancy Crisis as Amount of Empty Retail Space Doubled Since 2007

Between 2007 and 2017, the vacancy rate rose by nearly 50 percent across New York City
Most comprehensive analysis to-date uses never-before analyzed data to show how online retailing, rising commercial rents, and onerous regulatory hurdles fueled the rise in vacant storefronts
“Amazon effect” has changed the face of New York City storefronts, hurting traditional and independent retail stores as restaurants and service-oriented businesses grow
Twenty-four in-depth neighborhood profiles showcase the local reality as some neighborhoods see vacancy rates up to 25 percent
(New York, NY) – Despite New York City’s continued economic expansion, a new in-depth analysis released today by New York City Comptroller Scott M. Stringer shows that the rate of empty and vacant storefronts across the five boroughs has skyrocketed by nearly 50 percent over the past decade, rising to a high of 5.8 percent in 2017. Using never-before analyzed data, Comptroller Stringer’s new report found that the dramatic rise of retail vacancy citywide – which doubled to over 11 million square feet between 2007 and 2017 – has been fueled by the growth in online shopping, rising commercial rents, and burdensome regulatory hurdles. The rise of online retail in particular has dramatically reshaped the mix of New York City’s retail space away from traditional retail stores in favor of service-oriented establishments such as restaurants, barbers, and exercise studios, contributing to the growing vacancy trends as landlords, retailers – and the City bureaucracy – struggle to adjust.
To turn the tide and support local small business growth, Comptroller Stringer proposed a series of measures, including a tax incentive for retailers in high-vacancy areas; reforming the City bureaucracy that stalls the construction, inspection, and permit processes; and improving planning for how retail spaces are developed.
Key findings from Comptroller Stringer’s report include:
- The citywide vacancy rate, measured as vacant retail square feet divided by total retail square feet, rose from 4.0 percent in 2007 to 5.8 percent in 2017. An additional 5.2 million square feet of retail space was vacant in 2017 compared to 2007.
- Vacancy rates have risen across all five boroughs. Although Manhattan is home to areas with some of the greatest amounts of vacant square-feet, the highest vacancy rate neighborhoods lie outside of Manhattan – particularly in Staten Island and Queens.
- Over the past decade, average retail rents rose 22 percent citywide. Rents rose most rapidly in parts of Manhattan – as much as 68 percent on the Upper West Side, and 55 percent in Central Harlem.
- Rise of online shopping has reshaped the mix of New York City’s retail space in favor of service-oriented establishments such as restaurants, barbers, and exercise studios. The number of merchandise retail outlets in New York City rose by 19 percent between 2007 and 2017, while the number of personal services establishments rose by nearly 50 percent, and bars and restaurants soared by 65 percent.
“New Yorkers have all seen the signs of our changing economy in the last decade, as vacant storefronts have become all too common and neighborhood institutions have fallen by the wayside. Our report shows the phenomenon of retail vacancies from one end of the city to the other,” said New York City Comptroller Scott M. Stringer. “Change is the one constant in New York City – and sometimes, change can be overwhelming. Even as our economy has grown, many mom-and-pop stores have been left behind, transforming spaces once owned by local small businesses into barren storefronts. This isn’t just about empty buildings and neighborhood blight, it’s about the affordability crisis in our city. We need to use every tool in the box to tackle affordability, support small businesses and ensure New Yorkers are equipped to succeed in the new economic reality.”
As City’s Economy Grew, Vacancy Rates Also Rose
- Between 2007 and 2017, New York City’s economy expanded rapidly as 350,000 new residents poured in and 660,000 new jobs were created. During that period, the amount of retail space in the city also expanded considerably, by about 27.1 million square feet.
- However, as the City grew, so did the vacant retail space. Citywide, the retail vacancy rate rose from a low of 4.0 percent in 2007 to 5.8 percent in 2017.
- Reported vacant retail space roughly doubled over the last decade, rising to 11.8 million square feet in 2017, up from 5.6 million square feet before the great recession. (Roughly 1 million square feet of the reported increase is due to improved reporting of retail vacancy.)
Chart 1. Retail Vacancy Rates Have Risen Citywide
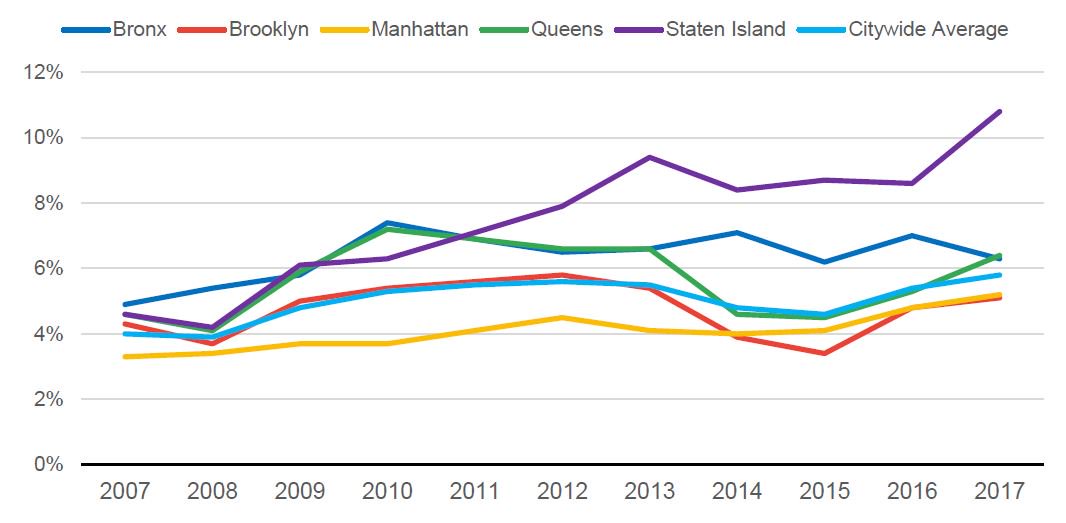
Source: Office of the Comptroller from Department of Finance RPIE filings.
- Neighborhoods with the highest vacancy rates are outside of Manhattan – however, Manhattan neighborhoods account for half of the twenty neighborhoods with the greatest vacant square footage.
- In addition to the report, Comptroller Stringer also released a set of neighborhood profiles detailing how the shifting economy is impacting vacancy rates in communities across the five boroughs. The neighborhood profiles track trends in rent costs, property taxes, total retail square footage and indicators of regulatory burden. These can be viewed in detail here.
Table 1. Zip Codes with Most Vacant Square Footage in 2007 and 2017
| 2007 | 2017 | ||||||
| Zip Code | Neighborhood | Vacancy Rate | Vacant Sq. Ft. | Zip Code | Neighborhood | Vacancy Rate | Vacant Sq. Ft. |
| 10036 | Times Square | 8.8% | 360,395 | 10314 | Mid-SI | 11.6% | 439,870 |
| 10021 | Upper East Side | 7.5% | 302,363 | 11201 | Dumbo, B.H. | 9.7% | 392,193 |
| 11354 | Flushing, QN | 12.0% | 231,224 | 10022 | 5th Avenue | 5.8% | 358,152 |
| 11385 | Glendale BK | 15.9% | 190,419 | 11432 | Jamaica, QN | 14.1% | 334,787 |
| 10022 | 5th Avenue | 4.0% | 185,919 | 11373 | Elmhurst, QN | 12.5% | 323,199 |
| 10027 | Harlem/Columbia | 8.9% | 125,073 | 10019 | Midtown Clinton | 5.8% | 308,403 |
| 10019 | Midtown Clinton | 2.2% | 115,538 | 10013 | Greenwich V./Soho | 6.8% | 265,230 |
| 10309 | West SI | 29.8% | 112,542 | 10011 | Chelsea South | 6.3% | 254,552 |
| 10469 | East Bronx | 14.8% | 108,721 | 10036 | Times Square | 6.3% | 250,829 |
| 10455 | Mott Haven, BX | 10.0% | 105,790 | 10309 | West SI | 16.4% | 229,341 |
Table 2. Zip Codes with Highest Vacancy Rates in 2007 and 2017
| 2007 | 2017 | ||||||
| Zip Code | Neighborhood | Vacancy Rate | Vacant Sq. Ft. | Zip Code | Neighborhood | Vacancy Rate | Vacant Sq. Ft. |
| 10309 | West SI | 29.8% | 112,542 | 11362 | Little Neck, QN | 25.8% | 176,681 |
| 11218 | Kensington, BK | 17.0% | 77,279 | 11363 | Little Neck, QN | 18.9% | 10,369 |
| 11385 | Glendale BK | 15.9% | 190,419 | 10465 | Throgs Neck, BX | 17.5% | 137,042 |
| 10037 | East Harlem | 15.0% | 29,262 | 10309 | West SI | 16.4% | 229,341 |
| 10469 | East Bronx | 14.8% | 108,721 | 11370 | Jackson Hgts, QN | 16.0% | 53,722 |
| 10280 | WTC | 13.6% | 34,025 | 10301 | North SI | 15.8% | 63,047 |
| 11691 | Far Rockaway | 13.5% | 72,106 | 10306 | S. Shore, SI | 15.7% | 201,789 |
| 11426 | Floral Park, QN | 12.2% | 16,135 | 11411 | Cambria Heights, QN | 14.9% | 29,006 |
| 11413 | Laurelton, QN | 12.1% | 25,283 | 10031 | Hamilton Heights, M | 14.9% | 100,800 |
| 11354 | Flushing, QN | 12.0% | 231,224 | 10455 | Mott Haven, BX | 14.8% | 210,821 |
Report Spotlights Three Drivers Fueling the Rise in Retail Vacancy
A statistical analysis of the factors that have contributed to the rising rate of retail vacancy reveals that there are three factors in particular that have had a significant impact: the rise of internet retailing (the “Amazon effect”); rising rents; and regulatory burdens.
- Rise of online shopping has reshaped the mix of New York City’s retail space. Increasingly, retail space is used for restaurants and bars, and for personal services – everything from barbers to dry cleaners, nail salons to exercise studios. Between 2007 and 2017, growth in the number of retail outlets in New York City was significantly outshined by growth in the number of service-oriented establishments – partly due to the skyrocketing growth of internet shopping, particularly Amazon. The number of merchandise retail outlets in New York City rose by 19 percent between 2007 and 2017, while the number of personal services establishments rose by nearly 50 percent, and bars and restaurants soared by 65 percent.
- Rise in commercial rents contributed to rising vacancy rates. The Comptroller’s report found that retail rents rose by 22 percent on average citywide between 2007 and 2017. In some parts of the City, such as Soho, rents doubled in those years.
- The Comptroller’s office also analyzed the role of property taxes paid by retail tenants, which are increasingly burdensome, doubling over the last ten years to over $2.2 billion in 2017. Property taxes account for a rising share of total retail rent burdens. In 2007, retail tenants paid $1.1 billion in property taxes, equal to about 20% of total retail rents paid. The $2.2 billion in property taxes paid by retail tenants in 2017 accounted for 23% of total retail rents paid.
- Regulatory burdens throw onerous hurdles in front of New York City store-owners. Regulatory hurdles can also impede the turnover of retail space – making it more difficult for New Yorkers to utilize vacant storefronts. The Comptroller’s examined various regulatory burdens which are associated with greater retail vacancy. Notably:
- The share of Department of Buildings alteration permits unapproved after 30 days is a significant driver of retail vacancy. A one percent increase in this metric is associated with a 3.28 percent increase in vacant retail square footage. Although this metric fell sharply between 2007 and 2017, it increased substantially in 2018, particularly outside Manhattan.
- The average number of days it takes to get a liquor license is also a significant driver of retail vacancy. A one percent increase in this measure is associated with a 0.17 percent increase in retail vacancy. In 2018, liquor license approval times increased city wide from roughly 50 to nearly 75 days, an increase of about 50 percent.
Addressing the Retail Vacancy Crisis
To turn the tide on the growing retail vacancy crisis and support local small business growth at the heart of New York City’s economy, Comptroller Stringer laid out a series of recommendations including:
- Provide tax incentives for independent merchandise retailers in high-vacancy retail corridors. The City should provide tax credits for independent retailers to help lower the cost of space in retail corridors with persistently high vacancy rates.
- Create single point-of-contact customer service for businesses occupying retail space. To expedite and facilitate a change in use of retail space from goods to personal services or an eating or drinking establishment, the City should create a multi-agency task force staffed with single point-of-contact customer service representatives to assist new businesses by coordinating and expediting the necessary regulatory actions. The City should also waive permitting and inspection fees for businesses taking over existing space that has been vacant for a given period of time.
- Incorporate retail demand into neighborhood planning. The City should require an analysis of retail demand in any major development proposal or rezoning, to ensure that the right amounts and types of retail space are incorporated into the planning process.
To read Comptroller Stringer’s full report, click here.
To view Comptroller Stringer’s neighborhood profiles, click here.
###